44
RE GIONAL WATER RESOURCES PLAN FOR THE EDWARDS AQU . IFER CITY OF SAN ANTONIO CITY COUNCIL AND THE EDWARDS U NDERGROUND WATER DISTRICT .. • BOARD OF DIRECTORS 1988

REGIONAL WATER RESOURCES PLAN
FOR THE
EDWARDS AQU.IFER
CITY OF SAN ANTONIO CITY COUNCIL
AND THE
EDWARDS UNDERGROUND WATER DISTRICT .. •
BOARD OF DIRECTORS
SEPTEMBER~~ 1988
~REGIONAL WATER RESOURCES PLAN
FOR THE
EDWARDS AQUIFER
CITY OF SAN ANTONIO CITY COUNCIL
AND THE
EDWARDS UNDERGROUND WATER DISTRICT
BOARD OF DIRECTORS
SEPTEMBER, 1988

EXECU'tiVE SUMMARY
BACKGROUND
This plan deals with water resources in the region consist
ing of Uvalde 1 Medina 1 Bexar 1 Comal and Hays Counties. It
presents a policy framework·for water resources planning between
1990-2040 and lays out the next steps for implementation. It is
the product of a unique joint planning effort by the City of San
Antonio and the Edwards Underground Water District.
The precise beginning of any planning process is difficult
to identify because many past decisions may have led up to
initiation of the current plan. Sometime in the 1970s it became
evident that· a water resources plan for San Antonio must be
developed within a larger regional context. It also became
evident that this would require a regional consensus which did
not then exist on the·policies and actions that would be needed
to implement the plan.
·Regional Water Resources Study. 1983-1986
The realization of the need for a regional consensus led to
an agreement between the City of San Antonio and the Edwards
Underground Water District in November 1983 to develop this plan.
The Memorandum of Understanding between these two agencies
initiated a joint study of long range water needs and supply
alternatives. Every effort was made to insure that the full
range of issues was explored and that all interests were repre-
1

sented in the process. The resultinq San Antonio Regional Water
Resources StudY (Fiqure E-1) was published in April 1986.
The Reqional Water Resources Study identified the componen~s
that would constitute a reqional water resources plan. It
assembled data on future water demands and possible alternative
sources, and analyzed the impacts of each alternative. It also
suqqested alternative implementation strateqies.
One of the implementation recommendations was the formation
of an Implementation Advisory Task Force. The objectives of the
IATF were to learn about the issues, to educate others in the
reqion, and to develop a consensus on policy recommendations to
be considered by the District and the City. The IATF met
throuqhout the summer and fall of 1986 and submitted its policy
recommendations to the Joint Sponsors in December 1986.
2

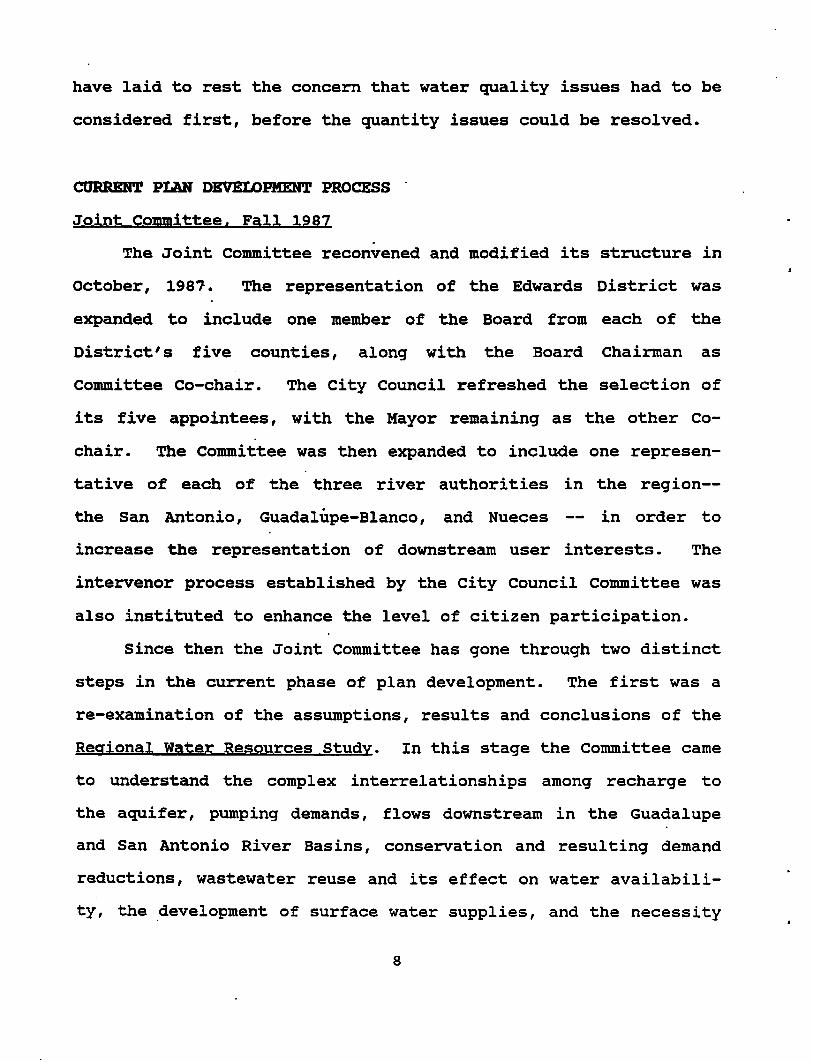
Figure E-1 study Areas of the San Antonio Reqional Water Resources Study
I-·
-.
··- .-....... _.__... -- ._._ .... ... --._ ........... --0 ..... . ..., , ... . CHMHILL
3
\ ....
... • ...
·~· --· ~ ~ ~--.. ----"·- flt• I
,\ II T -.:-1 \ !.:
IC:IJ'-11
.. ...
SAN ANTONIO·NUECES •' COASTAL BASIN
STUDY AREA BOUNDARIES

Joint Committee, Spring 1987
At this point, two considerations were uppermost in the
minds of the City Council and the Edwards District Board of
Directors: (1) to provide adequate regional representation in the
development of the plan; and (2) to create a workable decision
making process to ensure consensus on policy. These goals were
accomplished by the appointment of a Joint Committee on Water
Resources, representing both policymaking bodies. The Committee
initially consisted of five members of City Council and five
members of the Edwards Board of Directors, co-chaired by the
Chairman of the Board and the Mayor of the City.
The Joint Committee met each week through the spring of 1987
to consider policy issues systematically. Discussions continued
at these meetings until consensus was reached. Not all of the
policy recommendations submitted by the IATF were adopted exactly
as submitted, nor were all issues resolved. However, three
extremely important elements of a Regional Water Resources Plan
resulted from this effort.
First, a Joint Resolution was developed and adopted by the
City Council and the Edwards Board of Directors in March 1987.
This Resolution ~ascribed the principles and policies accepted up
to that point. The key policy held that the aquifer should not
be overdrafted during periods of average rainfall, in order to
ensure natural flows at Comal and San Marcos Springs.
The Joint Resolution was intended to inform the Legislature
on the region's efforts and progress in developing a regional
4

plan, and to obtain approval of the program as state policy. It
was submitted to the Legislature in the 1987 session, but it was
not passed due to the press of time and the emphasis on efforts
to pass related legislation on drought management.
Second, the Joint Committee reached consensus on the imme
diate need for a plan to manage a regional drought emergency.
Therefore the Joint Resolution contained a policy statement that
the Edwards District would seek legislative authority to develop
and implement a Drought Management Plan. An amendment to the
Edwards District enabling statute was developed, submitted and
approved by the Legislature as House Bill 1942. Since then, the
Edwards District has been developing the Drought Management Plan
in a separate process from this long range planning program.
Third, the Joint Committee found that its format and proce
dures facilitated the development of consensus. They fostered.
the mutual trust and respect necessary to the negotiation and
consensus building process. The Committee therefore agreed to
continue addressing policy issues in this forum until all issues
were negotiated and agreed upon, including both water quality and
quantity measures.
City Council Committee on the Aquifer. Summer 1987
Development of the plan was continued throughout the summer
of 1987 by a committee of the City Council examining water
quality protection issues. The groundwork for this activity was
5
established by the Joint committee in its policy statement number
one:
one of the ultimate goals of the Edwards aquifer region is to maintain the aquifer's current high water quality. With technical assistance from the Edwards Underground Water· District, cities in the region will adopt ordinances in 1987 for water quality protection to prevent degradation by contamination of sensitive areas of the aquifer. The ordinances will cover matters including but not limited to: using, producing, transporting or storing hazardous materials by commercial activities; assuring the integrity of sewer lines; protecting caves and sinkholes.
A zoning request for a new shopping mall on the aquifer
recharge zone precipitated a controversy over the adequacy of
regulations to protect the aquifer's water quality. The result
was a public bearing and the formation of the City Council
Committee on the Aquifer.
This committee designated four 11 intervenor11 groups to ensure
that all views were considered in the course of its work. These
represented environmentalist and community-based organizations,
and the chambers of commerce and development industries. The
committee heard from experts on each issue, along with questions
and comments from the intervenors, at weekly meetings through the
summer.
In September 1987, the Council Committee completed its
report, The Edwards Aquifer: Perspectives for Local and Regional
Action. The central policy statement was an unambiguous commit
ment: All policy should be based on a principle of no degradation
in groundwater quality. Acceptance of this principle led the
6

committee to examine potential sources of contamination along
with procedures for dealing with them.
one possible major source of contamination was waste dis
charges or leaks from sewer lines and septic tanks. The Commit
tee recommended improved specifications for sewer line construc
tion and new controls on septic tanks.·
Another concern was the storage and transportation of
hazardous materials. A major recommendation was to encourage the
Texas Water Commission to amend the Edwards Aquifer Rules to
regulate more stringently the storage of hazardous materials.
Another was to work for legislation authorizing cities to estab
lish transportation routes through their jurisdictions for
hazardous materials shipments.
The Committee recommended ~ new methodology for review of
the Water Pollution Abatement Plans which are required by the
Texas Water Commission as a condition for development. The City
was urged to amend its zoning ordinance to withhold approval of a
zoning change until TWC had previously approved the WPAP.
Still another· recommendation was the development of an
enhanced mapping process to identify sensitive recharge features
such as caves, sinkholes and faults. This information would be
useful to both the regulators and those being regulated.
The report was adopted by a unanimous Council and endorsed
by the Edwards Board of Directors. Implementation is being
carried out according to a specific timetable. These actions
7
have laid to rest the concern that water quality issues had to be
considered first, before the quantity issues could be resolved.
CURRENT PLAN DEVELOPMENT PROCESS
Joint Committee. Fall 1987
The Joint Committee reconvened and modified its structure in
October, 198?. The representation of the Edwards District was
expanded to include one member of the Board from each of the
District's five counties, along with the Board Chairman as
Committee Co-chair. The City Council refreshed the selection of
its five appointees, with the Mayor remaining as the other co
chair. The Committee was then expanded to include one represen
tative of each of the three river authorities in the region-
the san Antonio, Guadalupe-Blanco, and Nueces in order to
increase the representation of downstream user interests. The
intervenor process established by the City Council Committee was
also instituted to enhance the level of citizen participation.
Since then the Joint Committee has gone through two distinct
steps in the current phase of plan development. The first was a
re-examination of the assumptions, results and conclusions of the
Regional Water Resources Study. In this stage the Committee came
to understand the complex interrelationships among recharge to
the aquifer, pumping demands, flows downstream in the Guadalupe
and San Antonio River Basins, conservation and resulting demand
reductions, wastewater reuse and its effect on water availabili
ty, the _development of surface water supplies, and the necessity
8

•
of · a reasonable cost recovery mechanism. This resulted in a
reaffirmation of the principles adopted in the spring 1987. Joint
Resolution.
Development of the Planning Model. 1988
The second step has involved a series of policy decisions.
The Committee realized that policy on one plan component could
not be made in isolation from other issues. The Committee also
came to understand that a large number of alternatives were
available for selection as policy.
A tool in the form of a "planning model" was developed
(Table E-1.) A planning model in this sense presents numbers in
an accounting framework for analysis of alternatives. The
numbers in the model represent possible policy choices and they
highlight the implications of choosing different values. Thus
the Committee could quickly see the effect of using different
numbers for groundwater withdrawals, conservation goals, waste
water reuse and surface water development, under both average and
assumed drought conditions. The Committee steadily refined and
adjusted its targets so that the impacts were as positive as
possible for all categories of users in the region.
9
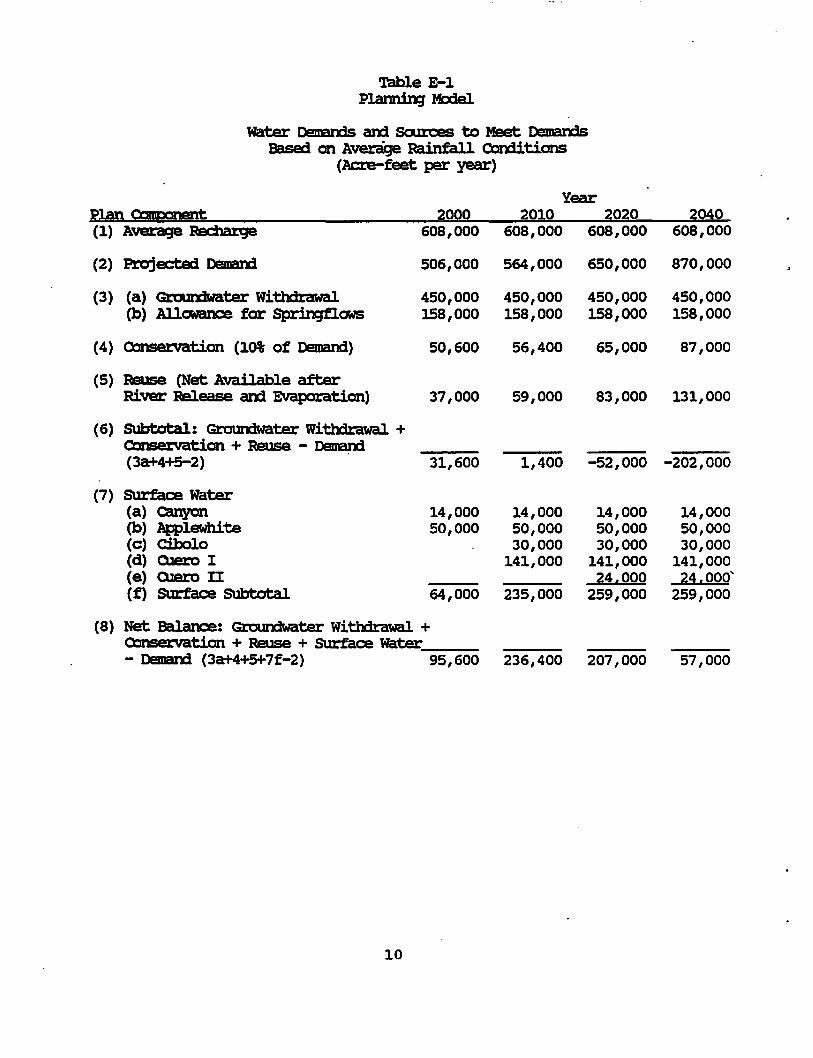
Table E-1 Pl.armi.n:J M:x1el.
water DemarxJs an::l SalrCeS to Meet Demal'm; Basei on Avera"ge Rainfall ccnditions
(Acre-feet per year)
Year Plan p;1111~ 2000 20J.O 2020 ~~0
(1) Average RechaJ:ge 608,000 608,000 608,000 608,000
(2) Prcjecteci Demand 506,000 564,000 650,000 870,000
(3) (a) Grcun:iwater Withdrawal 450,000 450,000 450,000 450,000 (b) Allowance for SprjnJfl.aNS 158,000 158,000 158,000 158,000
(4) conservation (10% of Demand) 50,600 56,400 65,000 87,000
(5) Reuse (Net Ava i1 able after River Release am Evaporation) 37,000 59,000 83,000 131,000
(6) SUbtotal: Grourdwater Withdrawal+ ccnservation + Reuse - DemaD:l (3a+4+5-2) 31,600 1,400 -52,000 -202,000
(7) surface Water (a) canyon 14,000 14,000 14,000 14,000 (b) Applewhite 50,000 50,000 50,000 50,000 (c) Ci):x)lo 30,000 30,000 30,000 (d) Ole!:o I 141,000 141,000 141,000 (e) OJero II 24,000 24,000' (f) SUrface SUbtotal 64,000 235,000 259,000 259,000
(8) Net Balance: Grourdwater Withdrawal + Ccnservation + Reuse + surface water - Demand (3a+4+5+7f-2) 95,600 236,400 207,000 57,000
10

at
In refining the Planning Model, the Joint Committee arrived
policy
1.
2.
3.
4.
5.
6.
7.
recommendations on the following plan components:
Quantity of aquifer recharge to be assumed;
Projected future regional water demand;
Withdrawals of aquifer groundwater;
Conservation programs;
Wastewater reuse and downstream flows;
Surface water projects; and
Financing approaches.
The following section discusses each element of the Planning
Model and the Committee's rationale for the recommended policy.
11
1. AQUJ:PER RECHARGE
Policy
The lonq term annua1 averaqe recbarqe for the period of
record, 608, 000 acre-feet per year, is used throuqhout the
planninq period to represent averaqe conditions.
Artificial recharqe may help to sustain aquifer water levels
in the lonq run, but it is not likely to become a major factor in
the reqion 1 s water budqet.
Discussion
This policy, taken in conjunction with the grQundwater
withdrawal pol~cy, reflects the overarching principle of no long
term overdraft of the aquifer. For the purposes of this plan,
overdraft is defined as a discharge of groundwater from the
aquifer by pumping and . springflows at an average rate which is
greater than the long term average annual recharge.
Annual recharge is a value calculated using specific mea
surements and formulas. Actual recharge has varied from a low of
43,000 acre-feet in 1956 to a high of 2,003,600 acre-feet in 1987
(Table E-2. ) This variation reflects the region's history of
alternating between periods of abundant rainfall and periods of
painful drought.
12
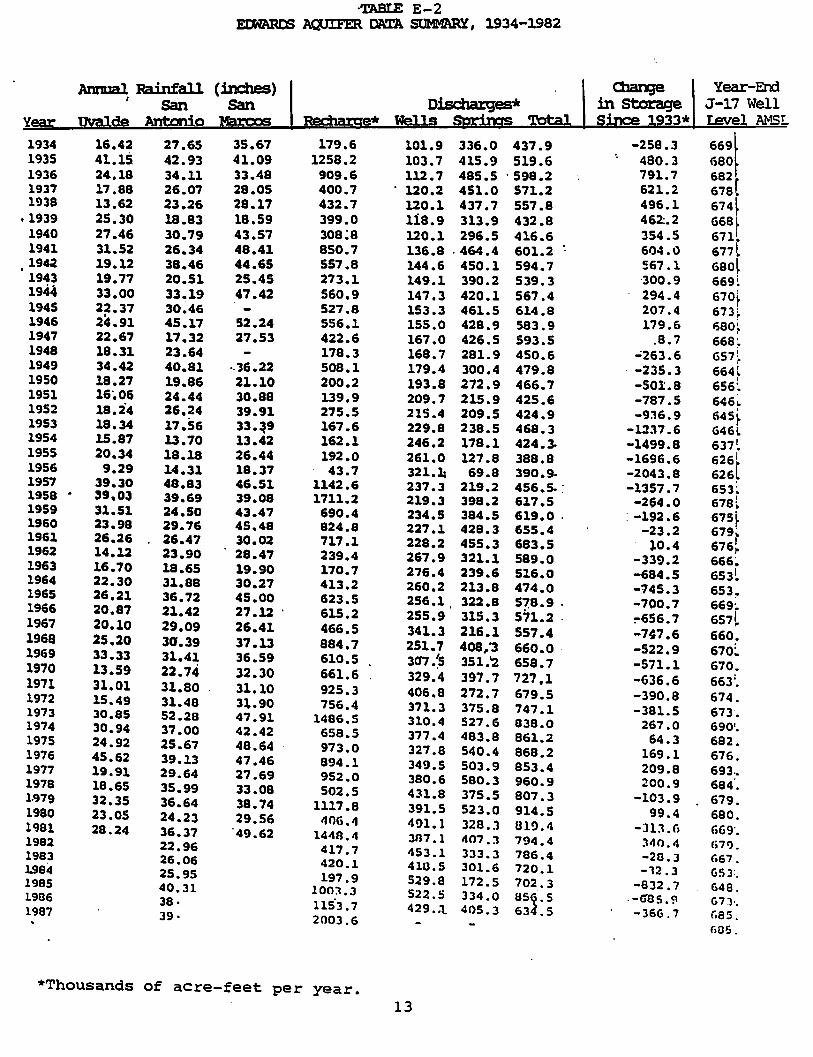
-TABIE E-2 EDiARtS AQUIFER DATA SUMMARY, 1934-1982
Annual Ra:infall (inches) Year-End :
San San J-17 Well rev Ar-tsL
1934 16.42 27.65 35.67 179.6 101.9 336.0 437.9 -258.3 669~ 1935 41.15 42.93 41.09 1258.2 103.7 415.9 519.6 490.3 680 1936 24.18 34.11 33.48 909.6 112.7 485.5 •598.2 791.7 682[ 1937 17.88 26.07 28.05 400.7 120.2 451.0 571.2 621.2 678 1938 13.62 23.26 28.17 432.7 120.1 437.7 557.8 496.1 674~
'1939 25.30 18.83 18.59 399.0 1i8.9 313.9 432.8 462:.2 668' 1940 27.46 30.79 43.57 308~8 120.1 296.5 416.6 354.5 67lt 1941 31.52 26.34 48.41 850.7 136.8 .464.4 601.2 604.1) 677( 1942 19.12 38.46 44.65 557.8 144.6 450.1 594.7 567.1 680~ 1943 19.77 20.51 25.45 273.1 149.1 390.2 539.3 300.9 669t 194~ 33.00 33.19 47.42 560.9 147.3 420.1 567.4 294.4 670~ 1945 22.37 30~46 527.8 153.3 461.5 614.8 207.4 673~ 1946 24.91 45.17 52.24 556.1 155.0 428.9 583.9 179.6 680~ 1947 22.67 17.32 27.53 422.6 167.0 426.5 593.5 .e. 1 668~ 1948 18.31 23.64 178.3 168.7 281.9 450.6 ...;263.6 657!
f 1949 34.42 40.81 .. '36.22 508.1 179.4 300.4 479.8 -235.3 664l ' 1950 18.27 19.86 21.10 200.2 193.8 272.9 466.7 -501:.8 656~
1951 16',06 24.44 30.88 139.9 209.7 215.9 425.6 -787.5 646. 1952 18.24 26,24 39.91 275.5 215.4 209.5 424.9 -936.9 645~ 1953 18.34 17.56 33.~9 167.6 229.8 238.5 468.3 -1237.6 646L 1954 15.87 13.70 13.42 162.1 246.2 178.1 424.J. -1499.8 637L 1955 20.34 18.18 26.44 192.0 261.0 127.8 388.8 -1696.6 626 1 1956 9.29 14.31 18,37 43.7 321.1; 69.8 390.9- -2043.8 626~ 1957 39.30 48.83 46.51 1142.6 237.3 219.2 456.5-: -1357.7 653~ 1958 . 39,03 39.69 39.08 1711.2 219.3 398.2 617.5 -264.0 678L 1959 31.51 24.50 43.47 690.4 234.5 384.5 619.0 . : -192.6 675~ 1960 23.98 29.76 45.48 824.8 227.1 428.3 655.4 -23.2 679 .. 1961 26.26 26.47 30.02 717.1 228.2 455.3 683.5 10.4 676~ 1962 14.12 23.90 28.47 239.4 267.9 321.1 589.0 -339.2 666~ 1963 16.70 18.65 19.90 170.7 276.4 239.6 516.0 -684.5 653L 1964 22.30 31.88 30.27 413.2 260.2 213.8 474.0 -745.3 653:-1965 26.21 36.72 45.00 623.5 256.1 322.8 5~8.9 . -700.7 669:. 1966 20.87 21.42 27.12 . 615.2 255.9 315.3 571.2 . ~656.7 6s1L 1967 20.10 29,09 26.41 466.5 341.3 216.1 557.4 -747.6 660. 1968 25.20 30.39 37.13 884.7 251.7 408,"3 660.0 . -522.9 670~ 1969 33.33 31.41 36.59 610.5 3a1 .~5 351.'2 658.7 -571.1 670. 1970 13.59 22.74 32.30 661.6 329.4 397.7 727,1 -636.6 663:. 1971 31.01 31.80 31.10 925.3 406.8 272.7 679.5 -390.8 674. 1972 15.49 31.48 31.90 756.4 371.3 375.8 747.1 -381.5 673. 1973 30.85 52.28 47.91 1486.5 310.4 527.6 838.0 267.0 6901• 1974 30.94 37.00 42.42 658.5 371.4 483.8 861.2 64.3 682. 1975 24.92 25.67 48.64 973.0 327.8 540.4 868.2 169.1 676. 1976 45.62 39.13 47.46 894.1 349.5 503.9 853.4 209.8 693 .• 1977 19.91 29.64 27.69 952.0 380.6 580.3 960.9 200.9 684·. 1978 18.65 35.99 33.08 502.5 431.8 375.5 807.3 -103.9 679. 1.979 32.35 36.64 38.74 1117.8 391.5 523.0 914.5 99.4 680. 1980 23.05 24.23 29.56 406.4 491.1 328.3 019.4 -:11:1.6 669'. 1981 28.24 36.37 '49.62 1440.4 307.1 407.:1 794.4 :\40. 4 (j 7C). 1982 22.96 417.7 453.1 333.3 786.4 -20.3 1983 667. .1.994
26.06 420.1 410.5 301.6 720.1 -l2.J GSJ: . 25.95 197.9 529.8 172.5 702.3 -832.7 648. 1995 40.31 lOO:t.J 522.5 334.0 asl.s · -G'DS. ~ 1906 38. 115'3. 7 G7 1·. 429.;'1, 405.3 63 . s -366.7 c.as. 1987 39. 2003.6 fi05.
*Thousands of acre-feet per year. 13

If qroundwater discharges exceed average recharge for a
number of years, we know that two things will happen as conse
quences:
(1) Water elevati~ns throughout the region will decline.
(2) Pumping costs will increase.
Two other things also ~ happen:
(3) In some areas, particularly along the northern edge of
the recharge zone, wells may cease producing water
entirely.
(4) Poor quality water may move into the portion of the
aquifer that now yields good quality water.
The Joint committee recognized the wide variation in annual
recharge. Therefore the Committee developed its general policy
recommendations in the context of average conditions, and then
superimposed the consequences of drought levels of recharge on
the Planning Model to adjust its policy recommendations.
The difference in the Planning Model between average re
charge and the total pumping withdrawal from the aquifer is
reserved for natural springflows at Comal and San Marcos Springs.
It is estimated that a discharge on the order of 150, 000 acre
feet per year is the minimum needed to maintain the springs'
unique environments in a healthy state. It is also necessary to
consider the water rights of the downstream surface water users
in the Guadalupe River Basin.
Policy for periods of relatively abundant
discussed in the section below on Groundwater
14
rainfall is
Withdrawal.
Response to a regional drought emergency will be governed by the
Edwards District's separate Drought Management Plan. Significant
reductions in water use will be required during drought periods.
2. PROJECTED
Policy
The water demand projections developed in the Reqional Water
Resources Study are used for the purposes of this plan.
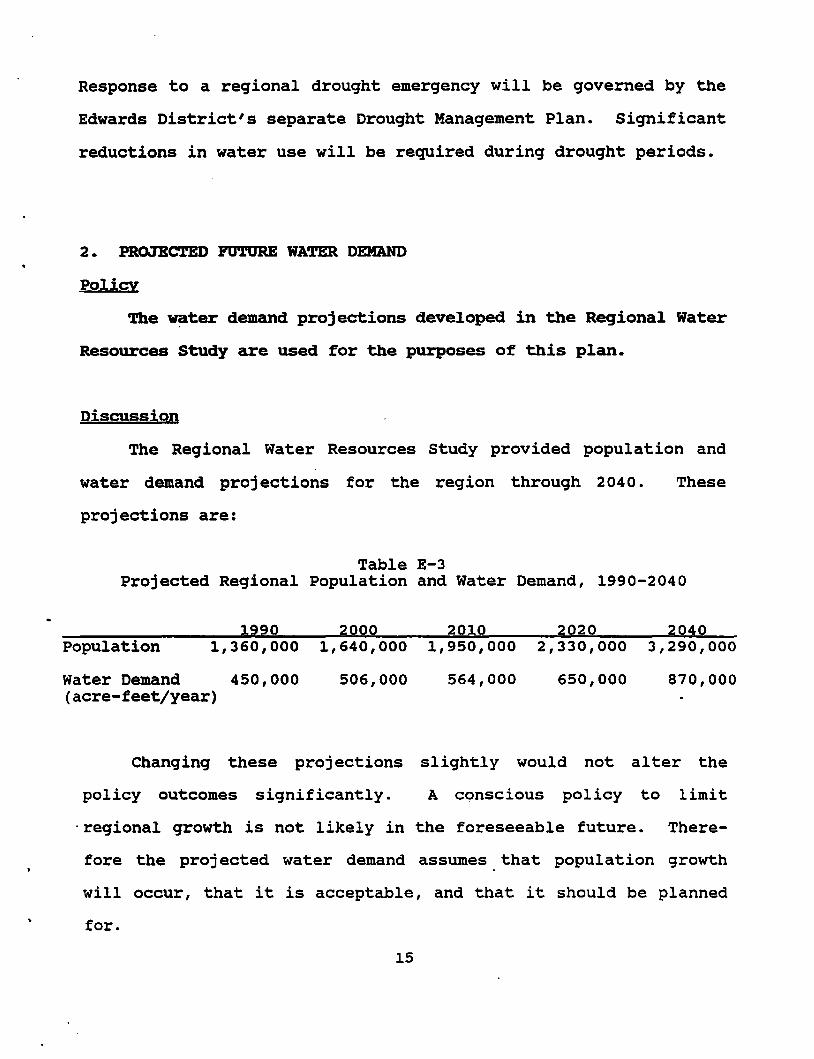
Discussion
The Regional Water Resources Study provided population and
water demand projections for the region through 2040.
projections are:
Table E-3
These
Projected Regional Population and Water Demand, 1990-2040
1990 2000 2010 2020 2040 Population 1,360,000 1,640,000 1,950,000 2,330,000 3,290,000
Water Demand 450,000 506,000 564,000 650,000 870,000 (acre-feetjyear)
Changing these projections slightly would not alter the
policy outcomes significantly. A conscious policy to limit
·regional growth is not likely in the foreseeable future. There-
fore the projected water demand assumes that population growth
will occur, that it is acceptable, and that it should be planned
for.
15

3. GROUNDWATER WITHDRAWAL
Policy
The amount of water withdrawn from the aquifer by new users,
and increases in withdrawals by existinq users, wil.l. both be
regulated. This process wil.l. recognize the historic riqhts of
al.l users to pump the amounts they have used in previous years.
over time, as new sources of water are developed and as irriqa
tion riqhts are transferred to other uses, the total. amount
pumped will. be qradual.l.y reduced to a qoal. of preservinq 150,000
acre-feet per year in natural sprinqfl.ows. This means a pumpinq
qoal of 450,000 acre-feet, or approximately 75% of the averaqe
annual. recbarqe.
owners of irriqated aqricul tura1 land will be entitled to
pump the actual amount they need to qrow crops on the number of
acres that were irriqated at any time durinq the "historic
period. n They wil.l have flexibility in applyinq this riqht to
specific acres. Non-irriqation users will be entitled to the
amount actual.l.y pumped durinq the historic period. Transition
periods of six years for aqricultural. irriqators and three years
for other users wil.l allow new historic riqhts to be established.
Use of water in excess of the historic riqhts will be
subject to a withdrawal fee to offset the cost of other water
supplies. This fee will be hiqher for low priority uses such as
seasonal lawn waterinq and lower for hiqh priority uses such as
cropland irriqation and industria~ purposes.
16

During periods of relative abundance, additional water
withdrawals may be permitted, depending on conditions in the
aquifer. During periods of drought, withdrawals from the aquifer
will be governed by the Regional Drought Management Plan.
The Edwards District will organize a market in water rights.
The principal means to reduce groundwater withdrawals to the long
run tarqet will be an active policy of retiring water rights
through voluntary purchases.
Implementation of the groundwater withdrawal policy will be
closely tied to the development of alternative water supplies 1
including conservation, reuse 1 and surface water development.
Discussion
The Regional Water Resources Study identified four basic
sources of water which could be included in the regional water
plan: the aquifer, conservation, wastewater reuse, and surface
water projects. The most fundamental policy issue is how much
water will be withdrawn from the aquifer.
The recommended policy for groundwater use is rooted in the
decision that the aquifer must not be overdrafted on a sustained
basis and that springflow and other environmental needs will be
recognized. In implementing this principle, the groundwater
withdrawal policy attempts to protect all of the varied user
interests in the aquifer.
Once the decision is made that groundwater withdrawals must
be limited, the amount of the limit becomes the next policy
17

issue. If this amount is set very high, less protection is .
afforded to environmental water needs and downstream users. If
it is set very low 1 more water must be developed from other
sources. The amount used as a planning/target value also influ
ences legal and financial policies.
The Joint Committee considered possible target values
ranging from 425,000 acre-feet per year {the amount recommended·
in the 1984 Texas Water Plan) to 525,000 acre-feet {the appr9xi-
mate maximum historic experience.) After analyzing the impacts
of various combinations in the Planning Model 1 the Committee
chose a taraet withdrawal limit of 450 1 ooo acre-feetjyear for
average recharge conditions. This value represents a balance
between the reality of current pumping conditions and the need to
provide protection to springflows, instream water needs, and bay
and estuary freshwater inflows. The value is not an initial
11 allocation 11 amount but a target value to be reached over an
indefinite time.
In effect, all existing water rights are 11grandfathered" at
historic pumping amounts. New growth is then made to bear the
cost of the additional supplies it will require.
The development of a market in water rights is an important
safety valve in the plan. Sale or lease of groundwater rights
would allow water to shift easily and efficiently from one use to
another in response to market incentives. As irrigation rights
are converted to non-irrigation uses, they would be limited to
two acre-feet per previously irriga.ted acre. This conversion
18

ratio ia an essential mechanism to gradually reduce the existing
rights toward the long run target.
The entire regulatory mechanism wi~l automatically terminate
by law if satisfactory progress is not made in developing addi
tional water supplies to serve the region's growth.
4. CONSERVATION
Policy
Conservation is to be treated as a source of water, with a
goal of reducing total regional water demand by 10% by the year
2000. This will be achieved by a combination of measures includ-
ing:
•
•
•
•
•
Public and school education programs to develop wise
water use practices;
Restructuring water rates to encourage conservation
through increasing block rates, seasonal peak rates and
excess use penalties;
Institution of leak detection programs by the water
purveyors:
Building code amendments to require installation of
water conserving fixtures and appliances in all new
construction;
Ordinances requiring retrofit of existing structures
with water conserving devices upon sale or structural
remodeling:
19

•
•
Ordinances and education programs to reduce the use of
water in urban landscape irrigation:
Retrofittinq of public facilities with water conservinq
fixtures and more efficient landscape irriqation.
Significant effort will be made to increase this qoal in the
future.
Discussion
In a major departure from "traditional 11 water planninq,
demand manaqement -- conservation -- is treated as a source of
water. The Committee recognized that a gallon of water saved is
equal to a ·gallon of new water supply.
With this principl"e established, the next policy question
was to determine how much could be saved and by what means. The
Committee considered an array of possible programs which would
produce estimated savings ranging from 2% to 13.5% {Table E-4.)
After evaluating the costs of each option, the Committee agreed
that a goal of 10% was ambitious but achievable. This is shown
in the table as Revised Alternative 2C.
20
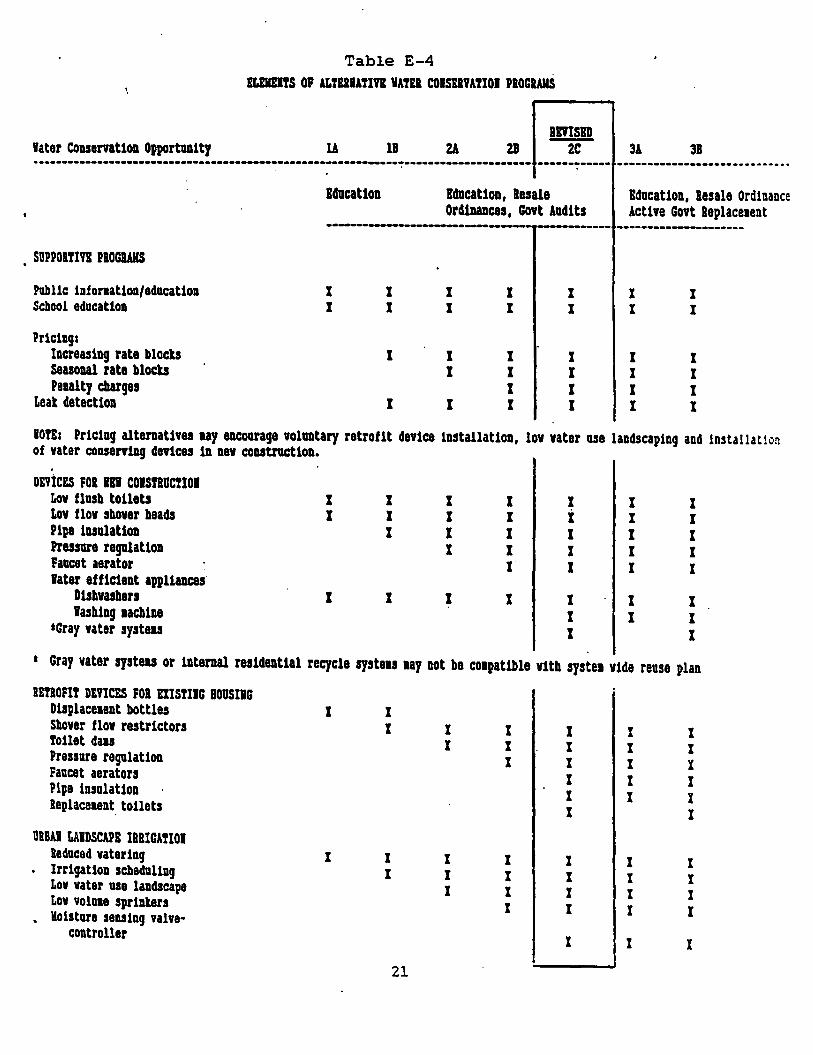
Table E-4 IL£K£JfS OF ALTERIATIVR VATER COISERYA!IOI PBOGRAUS
later couervatioa Opportality lA lB RMSID
2C 3! 31 ···----------------------------------------------------------~--------------------- ------~----- ---------------------------··
SUPPOl!IYI PlOGlAHS
Public lnforaatloa/aducatloa School education
Prlclag: Iacreas1Dg rate blocls seasonal rata blocls Penalty cbarges
Leal detection
14ucat1oD 1411cat1oD, Resale OrdiDADces, Govt Audits
Education, Resale Ordinance Active Govt Replacetent ------------·-·------ -------- ---------------------
I I I I I I I I I I I I I I
I I 1 1 1 I I I I I I
I I I I I I I I I I
IO!E: Prlclag alteruatlves uy eacourage volUDtary retrofit device lD!tallatloo, loY vater use landscaping and 1nstallat1on of water couen1Dg dertces 1D aev coutractioa • . DEVtCES FOR Ill COISflUC!IOI
LoY flub toilets I I I I I I I LoY flov shover beads I I I I I I I Piva luulattoo I I I I I I Pressure regulatioa I I I I I Faucet aerator I I I I later efficient appliances
Dishvashers I l I I I I I lashing aacbine I I I
•Gray vater syste1s I I
• Gray vater syst81S or tnternal residential recycle systeas aay not be coapatible vtth syste1 vide reuse plan
RETIOFIT DEVICES FOR EIIStiiG BOUSIIG Dlsplace•ent bottles I I Shover flov restrictors I I I I I I !otlet da1s I I I I I Pressure regulatioa I I I I Faucet aerators I I I Pipe insulation I I I Replaceaent. toilets I I
UlBAI LAIDSCAPI IlllGA!IOI leducad watering I I I I I I I . Irrigation scheduling I I I I I I Lov vater usa landscape I I I I I Lov voluae sprinters I I I I . Moisture sensing valve-
controller I I X
21

•. Table E-4 (cont.)
ALUW!M PIOGUIS amsn
ll 2A 21 2C 3A 31 tater conserrattoa OpportUDity lA ----··-·-· -------·-·r·-----····-------------····· ---·-------~----------------------------------------- ~ ·-------------------- .
PUBLIC F!CILI!! amom toilet 4au Faucet uratora Autoaattc faucets Shover flov restr1ctors t.ov flov shovers
Public fac111ty lndscape u1Dt
KAIUFAC!UIIIG Bec1rcalat1oa of cooltag water Reuse of cooling process vater
* Reuse of treated vastevatir lff1c1ent landscape 1rr1gat1oa Lov vater ustng fixtures Process aod1f1cat1ona
AGIICUL!IJI£ Irrigation syatea evaluat1oDS irrtgattoa schedultag Laser leveling Furrow cUttng Lov energy prec1a1on application Surge flov 1rr1gat1oa Drip ' lov volDJe 1rrtgattoa Brush ~~nageaent
~IUGY GEIWfiOI Rec1rculat1on of cooling vater
· Reuse of treated vastevater Ia systea treataent
I
I
I
I I
I I I
I I I
I I
I I I
I I I I
I I I I
I I I
I I I I
I I I I I
I I I I I
I I
.I
l I I
I I
I I I I I I
I I I I I I
I I I
I ·I I
I
I I I I I I
I I I I I I I
I I I
Energy Geaeratton and Yanafacturtng reuse systeas aay not be coapat1ble vtth syatea v~de reuse plans.
22
I I I
I
I I I I I I
I I I I I I I I
I I I

The goal of reducing total regional water demand by 10%
translates into the following decreases from the demands projec
ted by the Regional Water Resources study:
Table E-5 Regional Water Conservation Goals, 2000-2040
(Acre-feet per year)
Year 2000 2010 2020 Amount Conserved 50,600 56,400 65,000
2040 87,000
The amounts which would be saved and the costs of each
element in the recommended program are shown in Table E-6.
Addi tiona! conservation reductions in the agricultural, indus-
trial and. steam electric generating sectors are also expected as
the result of stream discharge requirements and economic pres-
sures.
23
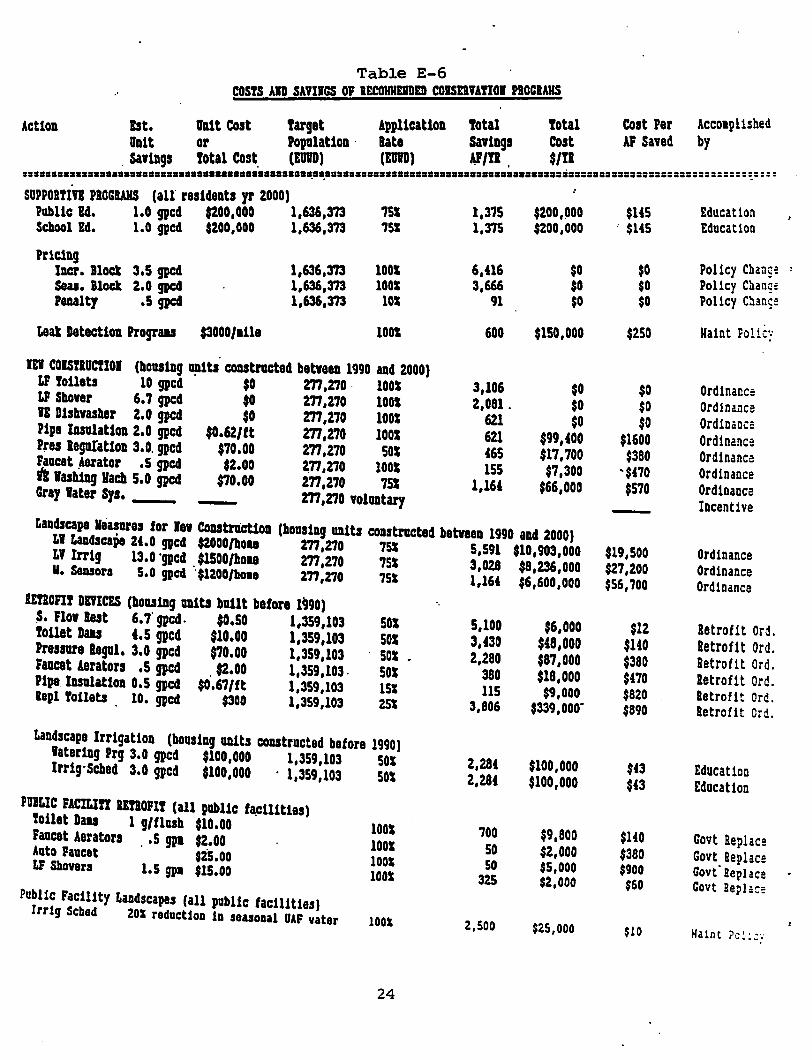
Table E-6 .. com AD SAYIIGS OF IECOHHEIDED COISEIVA!IOI PBOCIAIIS
! t 1 total COst Per Accotpl1shed A t1 Est 1Jil1t COst target App11cat1oD o a d b c oo 1JD1t or PopalatioD late Sav1oga COst AF Save y
Savings total cost (EUID) (EUID) A:F/D . $/tl ----------------·-======••••••••••••••==•••••••••••••••••••••••••~·~··==•••=•=••••••••••••••••••••••••••••=•=:==•••=========-------------~----
SUPPOl!IVI PIOGIAHS (all resideDts yr 2000) 1,315
$100,~00 $145 Education Pullc 24. 1.0 gcd $200,000 1,636,3'13 ?Sl $200,000 .· $US Education School Ed. 1.0 gpcd $100,000 1,636,373 75l 1,375
Pricing IDcr. Bloct 3.5 gpc4 1,636,373 lOOl Seu. Bloct 1.0 gpc4 1,636,373 lOOl PeDalty .s gpc:4 1,636,373 10l
Leat Detect1oD Prograu $3000/1118 lOOl
lEV COIS!IUC!IOI (hou1Dg ~its. coutracted betveeD 1990 and 1000) LF !oUets 10 gcd $0 m ,270 · lOOl LF Shover 6. 7 gad $0 m ,270 lOGS IB Dishwasher 2.0 gpc4 $0 m ,270 lOOl Pipe lDsalatiOD 2.0 gcd $0.62/ft 277,270 1001 Pres legu!at1oD 3.0.gpcd $70.00 277,270 SOl Faucet •erator .s gpcd $2.00 ~77 ,270 100l it lashing Hach s.o gpcc1 $'10.00 277,270 751 Gray later Sys. _ m ,270 YOlUDtary
6,U6 3,666
91
600
3,106 2,081.
621 621 465 155
1,16!
$0 $0 $0
$1SO,OOO
$0 $0 $0
$99,400 $17,700 $7,300
$66,000
Landscape laasares for lev CoDStrlctioD (housing aaits constructed betveeD 1990 aDd 2000) Ll Landscape 24.0 gpcd $2000/hOII 277,270 7Sl 5,591 $10,903,000 LV Irrig 13.o·gpcd .$1500/hoaa 277,270 7Sl 3,028 $8,236,000 u. Seusora s.o gpcd '$1200/boaa 277,270 75S 1,164 $6,600,000
tmont DMCES (hou1Dg mts llailt before 1990) $. Flov aut 6.7· gpcd. $0.50 1,359,103 toilet Daas f.S gpcd $10.00 1,3S9,103 Prasaara legal. 3.0 gpcd $70.00 1,359,103 Faacat Aerators .s gpcd $2.00 1,359,103. Pipe lnsalat1on o.s gpcd $0.67/ft 1,359,103 lepl !oilets . 10. gpcd $300 1,359,103
SOX SOl SOl -SOl 15l 25S
Landscape Irrigation (bous1Dg units constructed before 1990) latertng Prg 3.0 gpcd $100,000 1,359,103 SOl Irrtg·Scbed 3.0 gpcd $100,000 . 1,3S9,103 SOl
PUBLIC FACILI!! IEtROFI! (all pUblic f•c111t1es) !o1let Dau 1 g/f1usb $10.00 100l Faucet Aerators .• s gpa $~.00 100l Auto Faucet $25.00 lOOl r.F Shovera 1.5 gpa $15.00 lOOl
Public Facility Landscapes (all public facilities) Irrtg Schad 20% raductioD 1D saasoDal OAF vatar lOOS
24
5,100 3,430 2,280
380 115
3,806
2,284 2,284
700 so 50
325
2,500
$6,000 $48,000 $87,000 $18,000 $9,000
$339,ooo·
$100,000 $100,000
$9,800 $2,000 $5,000 $2,000
$25,000
$0 $0 $0
$250
$0 $0 $0
$1600 $380
•$470 $570
$19,500 $27,200 $56,700
$12 $UO $380 $470 $820 $890
$43 $43
$140 $380 $900 $60
$10
Policy Chang~ Policy Chang; Policy c~ans:
Kaint Polic:·
Ordinance Ordinance Ordinance Ordinance Ordinance Ordinance Ordinance Incentive
Ordinance Ordinance Ordinance
lletrofi t Ord. Retrofit Ord. Retrofit Ord. Retrofit Ord. Retrofit Ord. Retrofit Ord.
Education Education
Govt Replace Govt Replace Govt'aeplace Govt 2epla::~
Ua1nt ?c!:.:;

5. WASTEWATER REUSE AND DOWNSTREAM FLOWS
Policy
The City of San Antonio should develop a proqram to reuse
wastewater as a substitute for other supplies. New "water
factories" should meet at least 20,000 acre-feet per year of the
regional water demand in non-potable uses by the year 2000. The •
effluents of the existing regional advanced secondary treatment
plants should be further treated to a quality allowing discharge
into area cooling lakes. The amounts not sold for non-potable
uses and not needed in the lakes should be treated to drinking
wate~ standards and added to the city's water supply.
This program must be managed to maintain a minimum flow in
the San Antonio River of 55,000 acre-feet per year as •easured at
the Falls City gauge. It must also be managed ·to allow 46,000
acre-feet · per year in evaporation at the City Public Service
cooling lakes.
Local economic development agencies should encourage new
water usinq industries to locate near the projected "water
factories" in order to provide a market for the reused water.
Other wastewater producers in the region should also explore
the potential to promote reuse within their service areas.
Discussion
The City of San Antonio proposes to treat its wastewater to
a level sufficient to allow for indirect reuse in nonpotable
purposes of 20,000 acre-feet per year by the year 2000.
25
The first project would involve construction of a new "water
factory" near San Antonio International Airport to treat the
wastewater generated in the upper Salado Creek watershed. This
facility is expected to produce 4000 acre-feet per year in 1995,
rising to 40,000 acre-feet by 2040. The effluent from this plant
would substitute for pumping from the aquifer to create the flow
of the San Antonio River through downtown and to irrigate down
stream golf courses.
A related project would transfer the effluent from the
existing Salado Creek Wastewater Treatment Plant to a new Water
Renovation Center next to Braunig Lake. Here the nutrients would
be removed and further treatment provided to allow reuse in area
lakes. An estimated 24,000 acre-feet would thus be available to
improve the water quality of Braunig Lake. A water treatment
plant adjacent to the Water Renovation Center could then treat
the improved lake water to drinking water standards. Allowing
for 7000 acre-feet in evaporation consumption, this would provide
an additional 17,000 acre-feet per year for reuse.
Additional water factories would be built in the upper Leon
Creek and Medina River. watersheds. Their effluents would be
targeted for industrial reuse opportunities along Leon Creek,
Apache Creek, the San Antonio River, and the Medina River below
Applewhite Reservoir. The effluents from the existing Leon Creek
and Oos Rios plants would also be transferred to the Water
Renovation Center for release to the cooling lakes. Ultimately
26

the water treatment plant could be expanded to treat 63,000 acre
feet of lake water to drinking water standards.
Table E-7 summarizes the wastewater volumes generated and
available for reuse from each project.
entire program schematically.
Figure E-2 shows the
Data developed by the San Antonio River Authority suggest
that a minimum flow of 55,000 acre-feet per year is needed in the
San Antonio River to satisfy surface water rights and prevent
environmental damage downstream from the city. Since there may
be no natural flow in the river during a drought, the city may
have to release this amount from its wastewater treatment system.
Under current City Public Service plans, the cooling lakes
will also consume 46,000 acre-feet per year in evaporation. This
water is now diverted from the San Antonio River. A plan needs
to be developed to manage lake releases in order to reduce the
dissolved solids in Braunig Lake.
Marketing the output of these new facilities is also an
importan~ consideration. The initial target for indirect reuse
of 20,000 acre-feet by the year 2000 is a bare minimum. Under
the city's projections of wastewater availability, the city's
treatment plants may be capable of producing 131,000 acre-feet by
2040. This would save the expense of the additional treatment
needed to take this water all the way to drinking water stan
dards.
27

Table E-7 wastewater Volumes Generated am Available for Reuse, 1995-2040
(Acre-feet per year)
1995 2000 ~QJ.Q ~020 2030 2040 WASTEWATER GENERATED water Factm:ies
Northeast 4,000 8,000 16,000 24,000 32,000 40,000 . Northwest 4,000 8,000 16,000 24,000 32,000 40,000 Far West 4,000 8,000 J,6 1 QQO 24,000 32,000 40,000
SUbtotal 12,000 24,000 48,000 72,000 96,000 120,000
FJdst.:bJj T.t&lbi&IL Plants salado Creek 24,000 24,000 24,000 24,000 24,000 24,000 IBon Creek 24,000 24,000 24,000 24,000 24,000 24,000 Des Rios 64,000 64,000 ~.ooo 64,000 6!\,000 64,000
SUbtotal. l~.ooo 112,000 J.l~ 1 QOO 1~,000 1~,000 112,000 Gross Total Generated 124,000 136,000 160,000 184,000 208,000 232,000
OIBm USES Bralmiq lake Evaporation 7,000 7,000 7,000 7,000 7,000 7,000 calaveras lake Evaporation . 37,000 37,000 39,000 39,000 39,000 39,000 DcWnstream Ri'C8r Releases 55,000 55,000 52,000 55,000 55,000 55,000
Total caamitted to other Uses 99,000 99,000 J.OJ,,OOO 101,000 101,000 101,000 NEr 'rorAL AVAIIAmE FOR REIJSE 25,000 37,000 59,000 83,000 107,000 131,000
28

Figure E-2 Schematic Summary of Proposed San Antonio .
Wastewater Reuse Manaqement strateqy, 2oo·o - 2040
17 POTABLE I TR~Nr I
DECADE 2000
DECADE 2010
DECADE 2020
DECADE 2040
29

6. StJRPACE WATER PROJECTS
Policy
The Applewhite Reservoir project should be developed with
all due speed. It should be reconfigured to defer indefinitely
the Leon Creek Diversion. An improved wildlife mitigation plan
should also be developed.
Permitting should be initiated for the Cibolo, cuero I and
CUero II projects in order to protect the region from a severe
drought after the year 2000.
Discussion
Under average rainfall conditions, additional sources of
water will clearly be needed by 2010. Without surface water, the
Planning Model (Table E-1, page 10) show~ a deficit beyond 2010
even after the effects of significant conservation and reuse
programs. A drought of any serious magnitude would hasten the
onset of a crisis (Table E-8.)
Table E-8 Planning Model Projections for Year 2000
Under Alternative Drought Conditions
Average Mild Historic condition Drought Drought
1. Recharge 608,000 350,000 180,000 2. Projected Demand 506,000 500,940 519,156 3. Allocation 450,000 405,000 350,000 4. Conservation 50,600 5. Drought Reduction 22,770 68,310 6. Reuse 371000 341000 321500 Total ( 3+4+5+6-2) 31,600 -39,170 -68,346
30

..
Possible surface water projects have been identified for
many years. These are shown in Figure E-3 and compared in Table
E-9.
By their nature, these projects have a long lead t;ime.
Planning, permitting, design, construction and filling can easily
take 10 or 20 years. Therefore they must be initiated as soon as
possible.
Applewhite is the only project which can be completed before
the year 2000. Desiqn and permitting are virtually complete, but
there are concerns over the effects of the Leon Creek Diversion
and the wildlife mitigation plan. Therefore the Joint Committee
recommended that this project be completed with changes in design
configuration and planned mitigation.
The Cibolo and Cuero Projects should be initiated for
planning desiqn and permitting purposes in order to reduce the
impacts of a severe drought beyond the year 2000 •
31

•
-
Figure E-3 Possible surface Reservoir Locations,
San Antonio and Guadalupe River Basins
! • 0 • --·-
32
'
........

Table E-9 comparative SUIIUIIBry of-Potential Surface Uater Projects
COSTS DEVELOPMENT TIME I PROJECT YIELD (ICAF/YR) cs Mil. 1988) (Years) I Hfld severe Cost/
PRDJEC! caefta! 0 ' I! oetimistlc Nominal Pesslmla$ic Averase l!£:ousht oroushS 6C•Ft
Applewhite 113.0 1.2 6 7 8 50 40 12 12,260
Cibolo 258.0 2.5 13 20 27 30 30 30 S8,600
Cuero 457 .o 7.4 12 17 23 -141 141 141 $3,241
w w Cuero II
(Stand Alone) 398.0 8.2 8 12 17 80 80 80 $4,975 ~
cuero II (Incremental) 398.0 8.2 8 11 14 24 24 24 $16,583
7. FINANCE
Policy
The casts of these plan components should be met as fallows:
The Edwards Underground Water District's ad val.arem
property tax should fund implementation of the ground
water withdrawal. policy and the conservation program.
sewer use charqes shaul.d fund the wastewater reuse
program.
Water purveyor rates areawide, water availability
charqes (hook-up fees), and groundwater withdrawal fees
during times of relative abundance, al.l. should fund
surface water development.
Discussion
From the beginning of the planning process, the cost of
implementing these recommendations was known to be high. Using
water directly out of the aquifer is inexpensive, so any change
would be relatively costly. The issue of "who pays and how
much?" has been at the heart of the difficulty in developing a
regional water plan for many years.
An equitable groundwater withdrawal policy is essential to
the solution of this problem. No one can be expected to pay for
additional supplies willingly if others can escape this cost
entirely. The essence of the groundwater withdrawal policy is to
limit the use of aquifer water to the amount the aquifer can
34

'
provide. Thereafter the growth which requires additional sup-
plies will pay the costs of those supplies.
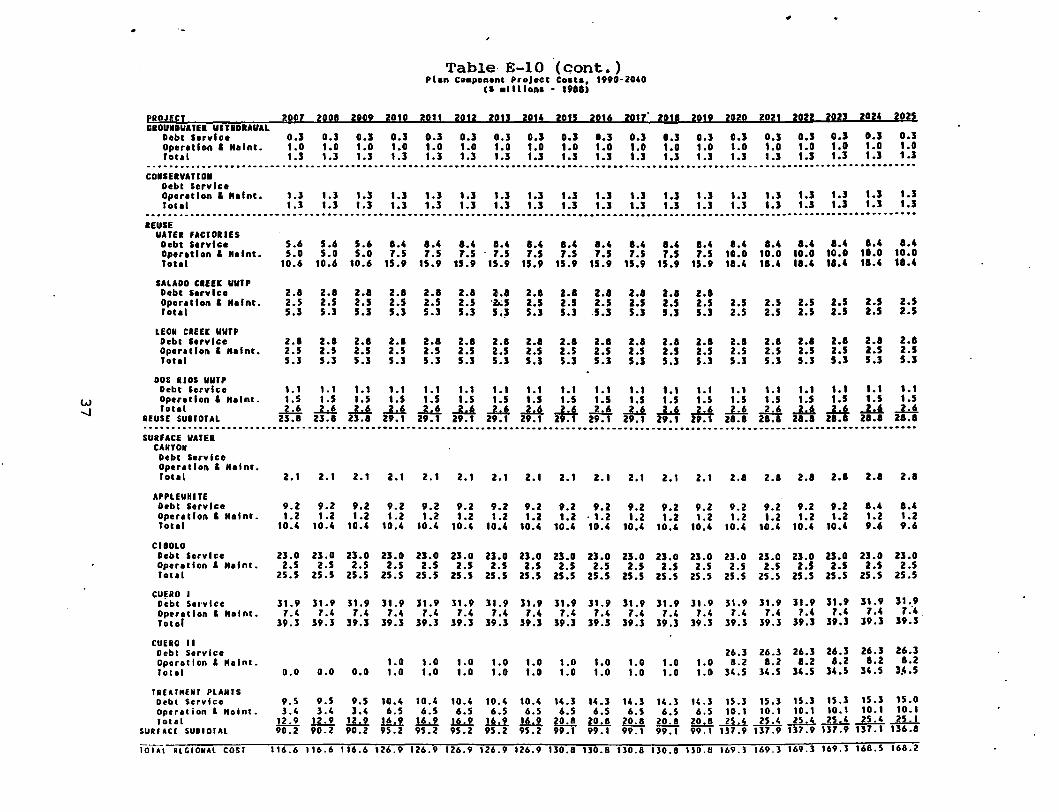
The total public sector costs of the recommended programs
are detailed in Table E-10. These costs include operating and
maintenance expenses and annual debt service. The financing
period for each project was based on a financing program devel-
oped by each responsible agency.
35

PROJECT GIOUIDUATEI UITIOIAUAL
Debt service Operation I Nalnt. Total
CAPITAL con
J.O
s.o
J990
o.s 1.0 1.3
1921 O.J 1.0 1.J
Table E-10 Plan Coaponent ProJect Coate, 1990•2040
CS allllona • 1911)
1!92
0.3 1.0 1.J
1993
O.J 1.0 1.J
J994
O.J 1.0 1.J
!995 o.s 1.0 1.S
19!6 19!7 1990 1999 2009 2001
o.s o.3 1.0 1.0 1.J 1.S
O.S O~J O.S O.S 1.0 1.0 1.0 1.0 I.S 1.S 1.3 I.S
2002
o.s 1.0 I.S
zpn
o.s 1.0 1.J
2Q04
o.s 1.0 1.S
2pos o.s 1.0 1.S
2006
O.J 1.0 1.J
··························································------··································································· COISEIVATIOI o.o
Debt Service Operation I Kalnt. Total
1.S I.S 1.J. 1.S 1.J 1.J 1.J 1.J 1.3 1.S 1.S 1.3 1.S 1.J I.J 1.S 1.J 0.0 1.J I,J I.J I.J I.J 1.S I.S I.J I.J I.S I.S I.S I.J 1.J I.J I.S I.J
·----------····································-···········-·····································································--IIEUSE
UATEI fACJOIIU Debt Service Operation & Nelnt. Iota I
SALADO ClEf( UUJP Debt Service Operetlen I Kelnt. rout
LEOI CIEEIC UUJP Debt Service Operation I Nalnt. lout
DOS RIOS UUJP
140.0 2.0 2.5
uo.o 5.S
zo.o 2.0 2.5
zo.o 5.S
zo.o 1.0
21.0 1.0
11.0
2.1 2.5 5.J
2.0 2.5 5.J
1.0 1.0
2.1 2.5 S.J
2.0 2.5 5.J
1.0 1.0
2.1 2.1 2.5 2.5 5.J 5.J
2.1 2.0 2.1 2.5 2.5 2.5 5.J 5.S 5.3
2.1 2.5 S.J
1 ~0 1.0
2.1 2.0 2.1 2.1 2.5 2.5 2.5 2.5 5.3 5.s 5.J 5.s
1.0 1.0 1.0 1.0 1.0 1.0 1.0 1.0
2.1 z.1 5.6 5.6 5.6 5.6 5.6 5.6 5.6 2.5 2.5 5.0 5.0 5.0 s.o 5.0 5.0 5.0 5.S 5.J 10.6 10.6 10.6 10.6 10.6 10.6 10.6
2.1 2.1 2.1 2.1 2.5 2.5 2.5 2.5 S.J S.J S.S S.S
2.1 2.1 1.0 1.0 2.5 2.5 1.0 1.0 5.S 5.3
2.1 2.0 2.1 2.5 z.s z.s S.J S.J S.J
2.0 z.1 z.o 2.5 2.5 2.5 5.J 5.J 5.J
2.1 z.5 5.3
2.1 2.5 s.s
2.1 2.5 S.J
2.0 2.5 S.J
Debt Service Operation I Nalnt. Jotat
REUSE SUBJOJAL
1.1 1.1 1.1 1.1 1.1 1.1 1.1 0.5 0.5 0.5 o.s 0.5 0.5 0.5 0.5 0.5 0.5 1.5 1.5 1.5 1.5 1.5 1.5 1.5
....1.1.....i....!l..1....!l..1....!l..1....!!.....1..!Li....!l..1...L1....!l..1...L1....Ll...L.J...L.J.....LJ...L.!...L..i...L..i..L.! 207.0 12.1 12.1 12.1 12.1 12.1 12.1 12.1 12.1 12.1 12.1 23.1 2S.I 2J.I 2J.O 23.1 23.8 2S.O
··--············-····························---············-··············-······················································· SUifACE VATEI
CAIIJOII o.o Debt service Operation I Kalnt. Total 0.0 0.6 0.6 0.6 0.6 0.6 0.6 0.6 0.6 0,6 0.6 2.1 2.1 2.1 2.1 2.1 2.1 2.1
APPLEUHI IE Debt Service Operation I Nalnt. Total
11S.O
11J.O
CIBOLO 250.0 Debt Service
1 .o 0.0 1.0
's.2 0.0 J.2
Operation I Kalnt. 1.0 1.0 Jotel 258.0 1.0 1.0
CUERO l 457.0 Debt Service
5.! 0.0 5.9
7.0 9.1 9.J P.S !.S 0.5 1.2 1.2 1.2 1.2 I.S 10.J 10.5 10.5 10.5
!.3 9.2 1.2 1.2
10.5 10.4
!.2 1. 2
10.4
!.2 1.2
10.4
!.2 9.2 9.2 1.2 1.2 1.2
10.4 10.4 10.4
2.2 2.2 1.2 1.2
10.4 10.4
2S.O 23.0 2S.O 23.0 2S.O 23.0 1.0 1.0 1.0 1.0 1.0 1.0 1.0 1.0 1.0 2.5 2.5 2.5. 2.5 2.5 2.5 1.0 1.0 1.0 1.0 1.0 1.0 1.0 1.0 1.0 25.5 25.5 25.5 25.5 25.5 25.5
Operation I Kolnt. 1.0 1.0 1.0 31.! S1.! J1.9 J1.! J1.9 S1.9 S1.9
1.0 1.0 1.0 1.0 1.0 1.0 1.0 7.4 7.4 7.4 7.4 '·' 7.4 7.4 1.0 1.0 1.0 1.0 1.0 1.0 1.0 39.3 39.3 39.J S!.S SP.3 JP.3 J9.3 Totot 457.0 1.0 1.0 1.0
CUERO II 3!1,0 Debt Service Operation I Kelnt. Jotot 198.0 0.0 0.0 0.0 O.D 0.0 0.0 0.0 0.0 0.0 0.0 0.0 0.0 0.0 0.0 0.0 0.0 0.0
IREAINEIIT PlAIII$ 241.1 Debt Service 0.1 0.1 Operotlon I Nolnt. lotol ~ ~ 0.1
SURfACE SUBIOIAL 1,467.1 1.7 ~
0.8 1.1 2.6 5.] 6.0 6.0 6.0 6.0 6.0 6.0 6.0 6.0 6.0 9.5 !.5 1.1 1.1 1.1 1.1 1.1 1.1 ],4 1.4 3.4 ].4 1.4 3.4 3.4
!!.....! -L.! ...L..! 6. 4 ..1..:..! ..1..:..! .L..! ..1..:..! ...L.! ...L.! ....!....! ...L.! ...!..!. 1 2 • 9 !.L.!. 9.3 12.7 16.6 19:5 ZO.Z ZD.Z Z0.2 20.1 62.2 16.7 16.7 16.7 86.7 90.2 90.2
10141 RfCIOIIAI COS! 1,677.1 18.4 20.8 24.0 27.4 ]1.] 34.2 )4.9 )4.9 ]4.9 }4.8 88.6 111.1 111.1 111.1 111.1 116.6 116.6 •
fROJfCI GIOUNDWATEI WlliDIAWAL
Debt Service Operetlon & Malnt. Tot.l
Table E-10 ·(cont.) Plan Coaponent ProJect Coata. 1990·2040
(I allllona • 1911)
2007 2000 2009 2010 2011 2012 2013 20!4 2015 2016 2017' 2011 2019
0.3 1.0 1.3
0.3 0.3 1.0 1.0 1.3 1.3
0.3 0.3 1.0 1.0 1. 3 1 .3
0.3 1.0 1.3
0.3 0.3 1.0 1.0 1 .3 1.3
0.3 1.0 1.3
o.s 0.3 o.s 0.3 1.0 1.0 1.0 1.0 1.1 1.3 1.3 1.3
zozo
0.3 1.0 1.3
2021 2022 2023 2024
0.3 0.3 0.3 o.s 1.0 1.0 1.0 1.0 1.3 1.3 1.3 1.3
2025
0.3 1.0 1.3
·····················----·····-···········-·······--·-·····················································-···························· COUEIVATIOI
Debt ServIce Operetlon & Malnt. rout
1.3 1.3 1.1 1.1 1.3 1.3 1.3 1.s 1.1 1.3 1.1 1.1 1.3 1.3 1.3 1.3 1.1 1.3 1.3 1.3 1.3 1.3 1.3 1.3 1.3 1.3 1.3 1.3 1.3 1.3 1.3 1.3 1.3 1.3 1.3 1.3 1.3 1.3
-·················----------·······-···············--······················-···························································· REUSE
WATER fACTOIIES Debt Service Operetlon & Malnt. rout
SALADO ClEEK WWTP Debt Service Operetlon & Malnt. Tot. I
LEON ClEEK WWTP Debt Service Operetlon & Malnt. Total
DOS RIGS WWTP Debt Service Operetlon & Melnt. Total
REUSE SU8JOTAL
5.6 5.6 5.6 1.4 8.4 1.4 1.4 1.4 8.4 1.4 1.4 8.4 1.4 1.4 1.4 1~4 1.4 1.4 8.4 5.0 5.0 5.0 7.5 7.5 7.5 7.5 7.5 7.5 7.5 7.5 7.5 7.5 10.0 10.0 10.0 10.0 10.0 10.0
10.6 10.6 10.6 15.9 15.9 15.9 15.9 15.9 15.9 15.9 15.9 15.9 15.9 11.4 11.4 11.4 11.4 11.4 11.4
2.1 2.5 5.3
2.1 2.5 5.3
2.1 2.1 2.1 2.1 2.5 2.5 2.5 2.5 5.3 5.3 5.3 5.3
2.1 2.1 2.1 2.1 2.5 2.5 2.5 2.5 5.3 5.3 5.3 5.3
2.1 l.l 2.1 2.5 ·z.~5 2.5 5.3 5;~ 5.3
2.1 2.1 2.1 2.5 2.5 2.5 5.3 5.3 5.3
2.1 2.1 2.5 2.5 5.3 .5.3
2.1 2.1 2.5 2.5 5.3 5.3
2.1 2.5 5.3
2.1 2.5 5.3
2.1 2.5 5.3
2.1 2.5 5.3
2.1 2.5 5.3
2.1 2.5 5.3
2.5 2.5
2.1 2.5 5.3
2.5 2.5 2.5 2.5 2.5 2.5
2.1 2.1 2.1 2.5 2.5 2.5 5.3 5.3 5.3
2.5 2.5
2.1 2.5 5.3
2.5 2.5
2.1 2.5 5.3
1.1 1.1 1.1 1.1 1.1 1.1 1.1 1.1 1.1 1.1 1.1 1.1 1.1 1.1 1.1 1.1 1.1 1.1 1.1 1.5 1.5 1.5 1.5 1.5 1.5 1.5 1.5 1.5 1.5 1.5 1.5 1.5 1.5 1.5 1.5 1.5 1.5 1.5 ~~~~~~~~~~~~~~~~~~~ 21.1 23.1 23.1 29.1 29.1 29.1 29.1 29.1 29.1 29.1 29.1 29.1 29.1 21.1 21.1 21.1 2iJr 21.1 21.1
--···········------····-------··············-······--····························---·············~-----···----------------·············· SUIFACE WATER
CANT Oil Debt Service Oper•tlon & Maint. Tot. I
APPLEUHI TE Debt Service Operetlon & Malnt. Tote I
CIBOLO Oebt Service Operetlon & Maint. foUl
CU~RO I Debt Snvlce Operation & Malnt. Total
CUERO II Debt Service Operotlon & Malnt. Total
TRfAT"fNT PLANTS Debt Service Operation & Koint. total
SURfAC( SUBTOTAl
IOIAI RlGIONAl COST
2.1 2.1 2.1 2.1 2.1 2.1 2.1 2.1 2.1 2.1 2.1 2.1 2.1 z.a 2.1 2.1 2.1 2.1 2.1
9.2 1.2
10.4
9.2 1.2
10.4
9.2 9.2 9.2 9.2 9.2 9.2 9.2 9.2 1.2 1.2 1.2 1.2 1.2 1.2 1.2 . 1.2
10.4 10.4 10.4 10.4 10.4 10.4 10.4 10.4
9.2 9.2 9.2 9.2 9.2 9.2 9.2 1.2 1.2 1.2 1.2 1.2 1.2 1.2
10.4 10.4 10.4 10.4 10.4 10.4 10.4
1.4 1.2 9.6
1.4 1.2 9.6
23.0 23.0 23.0 23.0 23.0 23.0 23.0 23.0 23.0 23.0 23.0 23.0 23.0 23.0 23.0 23.0 23.0 23.0 23.0 2.5 2.5 2.5 2.5 2.5 2.5 2.5 2.5 2.5 2.5 2.5 2.5 z.s 2.5 2.5 2.5 2.5 2.5 2.5
25.5 25.5 25.5 25.5 25.5 25.5 25.5 25.5 25.5 25.5 25.5 25.5 25.5 25.5 25.5 25.5 25.5 25.5 25.5
31.9 31.9 31.9 31.9 31.9 31.9 31.9 31.9 31.9 31.9 31.9 31.9 31.9 31.9 31.9 31.9 31.9 31.9 31.9 7.4 7.4 7.4 7.4 7.4 7.4 7.4 7.4 7.4 7.4 7.4 7.4 7.4 7.4 7.4 7.4 7.4 7.4 7:4.
39.3 39.3 39.3 39.3 39.3 39.3 39.3 39.3 39.3 39.3 39.3 39.3 39.3 39.3 39.3 39.3 39.3 39.3 39.3
26.3 26.3 26.3 26.3 26.3 26.3 1.0 1.0 1.0 1.0 1.0 1.0 1.o 1.0 1.0 1.0 1.2 o.2 1.2 1.2 1.2 1.2
o.o o.o o.o 1.0 1.0 1.0 1.0 1.0 1.0 1.0 1.0 1.0 1.0 34.5 34.5 34.5 34.5 34.5 3~.5
9.5 9.5 9.5 10.4 10.4 10.4 10.4 10.4 14.3 14.3 14.3 14.3 14.3 15.3 15.3 15.3 15.3 15.3 15.0 3.4 3.4 3.4 6.5 6.5 6.5 6.5 6.5 6.5 6.5 6.5 6.5 6.5 10.1 10.1 10.1 10.1 10.1 10.1
J..U J..U .11....! 14.9 16.9 16.9 J.!...!. 14.9 lY lY 20.0 lL!, Zi.J!. 2S.4 25.4 .J2.!. .J2.!, 25.4 ....ll...!. 90.2 90.2 90.2 95.2 95.2 95.2 95.2 95.2 99.1 99.1 99.1 99.1 99.1 ii7:9 137:9 137.9 137.9 137.1 136.0
116.6 116.6 116.6 126.9 126.9 126.9 126.9 126.9 130.8 130.8 llD.8 13D.8 130.8 169.3 169.3 169.3 169.3 168.5 168.2
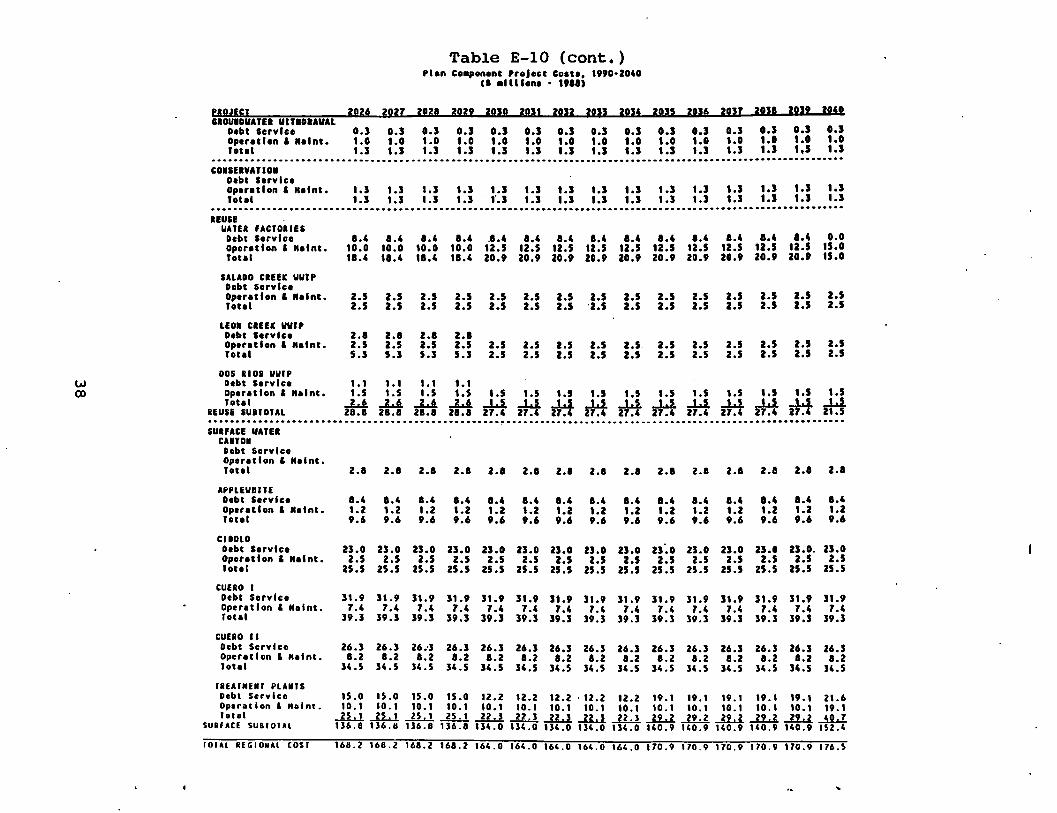
Table E-10 (cont.) Plan Co•ponont Project Cotta. 1990•2040
CS •llllona • 1988)
PROJECT 1016 Z!!ll IIIII zgu IOJO IDJJ nn IUJ I!!J4 103! nJ6 Z!!Jl IIJI I!!J! 11!1 CIOUIDUATEI UITIOIAVAL
Debt service O.J o.J O.J O.J O.J O.J o.J o.J o.3 0.3 O.J O.J o.3 o.3 O.J Operation I Moine. 1.0 1.0 1.0 t.O t.o t.O 1.0 t.O 1.0 1.0 1.0 1.0 1.0 1.0 1.0 foUl 1.3 1.3 1.3 1.3 1.3 1.3 1.3 1.3 1.3 1.3 1.3 1.3 1.3 1,3 1.3
·············································•·········•····•·•········•••••······················•···•··••••·•· COISEIVA Tl 01
Debt Service Operation I Moine. 1.J 1.J 1.J 1.J 1.3 1.3 1.3 1.J 1.J 1.3 1.3 1.3 1.3 1.3 1.3 ToUt 1.J 1.3 1.3 1.J 1'.J 1.J 1.J 1.J 1.:S 1.:S 1.3 1.3 1.3 1.3 1.J
········••••··••····•······•···········••······••••···•··••·•·••••••••··••••··•···········•·•·····••••·•·••••••• REUSE
IIATEI UCJOIIEI Oebt service 8.4 8.4 8.4 8.4 .1.4 1.4 8.4 1.4 8.4 8.4 8.4 1.4 1.4 .. , o.o Operation I Molnt. 10.0 10.0 10.0 10.0 12.5 12.5 12.5 u.s 12.5 12.5 u.s u.s u.s u.s 15.0 foUl 18.4 11.4 11.4 111.4 20.9 20.9 20.9 20.9 20.9 20.9 20.9 20.9 20.9 20.9 1S.O
SALADO CREEK IIIITP Debt service Operation I Molnt. 2.5 2.5 2.5 2.S 2.5 2.5 2.5 2.5 2.S 2.5 2.5 2.S 2.5 2.5 2.5 foUl 2.5 2.S 2.5 2.S 2.5 2.S 2.S ·2,5 2.S 2.5 2.5 2.S 2.5 2.5 2.5
UOI ClEEK UUIP Debt Service 2.1 2.1 2.1 2.1 Dperotlon I Moine. 2.5 2.5 2.5 2.5 2.5 2.5 2.5 2.5 2.S 2.5 2.5 2.S 2.S 2.5 2.5 to tot 5.J 5.J 5.J 5.J 2.5 2.5 2.5 2.5 2.5 2.5 2.5 2.5 2.S 2.S 2.5
DOS II OS IIUIP w Debt Service 1.1 1.1 1.1 1.1 Cl) Operation I Moine. 1.5 1.5 1.5 1.S 1.5 1.5 1.5 1.S 1.5 1.5 1.5 1.5 1.S 1.5 1.S
Toto I ..LA ..LA ...z....A ...L.A. ....Li ....Li zJ:I zH ....Li ....Li ...L1 ...L1 ..L1 iH tH REUSE IUIIOJAL 21.1 28.1 28.1 28.1 27.4 27.4 27.4 27.4 27.4 27.4 27.4 ············································································--·································· SURFACE VATER
CUYOII Debt Service Operation & Molnt. Tout 2.11 2.1 2.11 2.1 2.1 2.1 z.a 2.1 2.1 2.1 z.1 2.1 z.a 2.1 2.1
APPUIIIIIIE Debt Service 8.4 8.4 8.4 8.4 1.4 8.4 8.4 8.4 8.4 8.4 1.4 1.4 8.4 8.4 8.4 Operation I Moine. 1.2 1.2 1.2 1.2 1.2 1.2 1.2 1.2 1.2 1.2 1.2 1.2 1.2 1.2 1.2 Tout 9.6 9.6 9.6 9.6 9.6 9.6 9.6 9.6 9.6 9.6 9.6 9.6 9.6 9.6 9.6
CIIOLO Debt Service ZJ.O zs.o ZJ.O 2J,O 23.0 ZJ.O z:s.o ZJ.O ZJ,O 2:s·.o ZJ.O ZJ.O ZJ.O zs.o. u.o Operation I Moine. 2.5 2.5 2.S 2.S 2.5 2.5 2.S 2.5 2.5 2.5 2.S z.s 2.S 2.S 2.S Ioul 25.S 25.5 25.5 25.S zs.s 25.5 25.5 zs.s zs.s 25.5 25.5 25.5 25.5 25.5 25.5
CUERO I Debt Service J1.9 J1.9 31.9 J1.9 J1.9 :S1.9 31.9 Jl.9 J1.9 J1,9 31.9 J1.9 J1.9 31.9 51.9 Operation & Molnt. 7.4 7.4 7.4 7.4 7.4 7.4 7.4 7.4 7.4 7.4 7.4 7.4 7.4 7.4 7.4 Toto I 39.3 39.J 39.5 :S9.J J9.3 39.J J9.3 39.3 J9.J J9.J 39.3 J9.3 39.J J9.3 59.J
CUERO II Debt Service 26.J 26.J 26.·J 26.J 26.J 26.3 26.3 26.3 26.J Z6.J 26.J Z6.J 26.3 26.3 Z6.5 Operation & Moine. 1.2 1.2 a.z 1.2 a.z 8.2 11.2 8.2 1.2 a.z 8.2 8.2 1.2 11.2 1.2 loU I 34.5 J4.5 34.5 J4.5 34.5 34.5 J4.5 34.5 34.5 34.5 34.5 J4.5 :S4.5 34.5 34.5
IIEAJMENI PLAIIJS Debt Service 15.0 15.0 15.0 15.0 1z.z tZ.Z 12.2 · 12.2 12.2 19.1 19.1 19. I 19.1 19. I 21.6 Operation & Malnt. 10. I 10. I 10.1 10.1 10.1 10. I 10.1 10. I 10. I 10.1 10.1 10.1 10. I 10.1 19.1 foul -l.L.!JL..!...11.....!-l.L.!..l.Ll..11....1...ll.J...lL.l..11....1...l!.d..l!.:l...lL.l..lLl....lL.l...!.L.L
SURfACE SUBIOIAl 1:S6.8 1:S6.8 1:S6.8 1:S6.8 134.0 134.0 I:S4.0 1:S4.0 1:S4.0 140.9 140.9 140.9 140.9 140.9 152.4
IOIAl REGIONAl cosr 168.2 168.2 168.2 168.2 164.0 164.0 164.0 164.0 164.0 170.9 170.9 170.9 170.9 170.9 176. s
..

The Joint Committee considered a wide range of possible
funding sources (Table E-11.) For each one it considered whether
the burden would fall on existing users or only on new growth,
whether new legislation would be needed to implement it, and
whether it would contribute to the goal of conservation. The
Committee also considered which plan component each revenue
source could most logically finance, and whether it could meet
the full costs of that component.
39
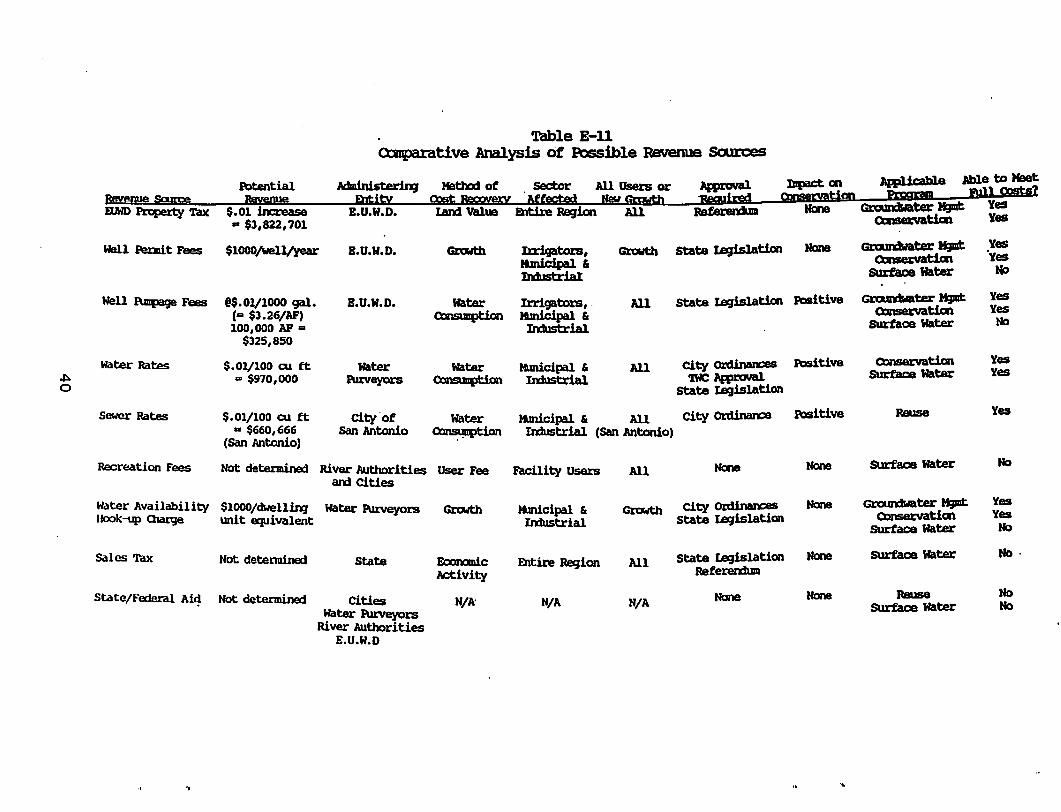
Table E-ll OVrplrative Analysis of ~ible Revenue SaJrces
Potential 1ldmini.sterinJ Het:ha:l of Sector All Users or ~ Revenue Sgume Beyenue &Jt:ity cmt RecxJveJ;y Affected New Grgwtb 'BeeN ired f1JWI) Pa:perty TaX $.01 increase E.U.W.D. Lard value Entire Regic:xl All RafereiD.1m
.. $3,822,701
Well ~tFees $1000/Wel.]/year E.U.W.D. GaJwth Ilrigat:ors, G1'oWt:b State IB;Jislat:im None Gl.'aJrdwater HJmt Yes
llmicipal. ' OCinSei:Vatial ·yes
IDbst:riai surtace water No
Well E\mpage Fees @$.01/1000 gal. E.U.W.D. Hater Irrigators, . All state tegisl.at:im Positive Grclllrdwater HJmt Yes ("" $3.26/AF) Q:lnslmption
ltJnicipal ' Q:Jnsenatia\ Yes
100,000 AF = IrxJust:rial surface water No
$325,850
Water Rates $.01/100 Ql ft water Hater !t.micipal & All City orcUnanc:es Positive OJnservation Yes ~ ... $970,000 PUrveyors Olns\mption lD!ustrial. 'M: App1:tMll surface water Yes 0 state legislation
sewer Rates $.01/100 Ql ft City'of Water !t.micipal & All City ordinanc:e Positive Reuse Yes ... $660,666 san Antonio ~ Irdustrial (Ban Antonio)
(San Antonio)
Recreation Fees Not determined River Authorities User Fee Facility users All None None surface water No
an:l Cities
~ter Availability $1000/dwellinl Water PUrveyors Growth ltlnicipal & Gtcwth City OtdinanCeS None Grcli.Ddwater H;pld: Yes llook-up Charge unit ecp~ivalent Industrial state teqislation Q:Jnsenatiat Yes
surface water No
Sales Tax Not detenuined State Economic Entire Region All State Legislation None surface water No·
ltctivity Referendum
State/Federal Ai4 Notdetemined Cities N/A· N/A N/A None None Reuse No
~ter 1\arveyors surface Hater No
River Authorities E.U.W.D
..

..
IMPLEMENTATION
It is crucial that this plan be implemented as a regionwide
program. The Edwards District should administer the groundwater
withdrawal po~icy and manage the conservation programs because of
their regionwide impacts. It should provide technical assistance
to municipalities in developing conservation ordinances and
facility retrofit programs. It should also assist water pur-
veyors in developing leak detection programs and restructuring
their rates to encourage conservation. To do this the District
must have adequate funding, staffing, and capital equipment.
Other agencies should take part in the operation of the
remaining plan components as they are implemented. The City of
San Antonio should be responsible for the wastewater reuse
program. The City Water Board, San Antonio River Authority and
Guadalupe-Blanco River Authority should be the contracting
agencies for the proposed reservoirs.
Action will be needed in the 1989 session of the Texas
Legislature to authorize the groundwater withdrawal policy. This
is the key to implementing the entire plan. Other legislative
initiatives such as new fees are for consideration in the future.
Once the region achieves consensus for this legislation,
implementation efforts must be made equally on the conservation,
reuse and surface water components. If one of these is less
successful than intended, then the other programs must make up
the difference. An early start on the modified Applewhite
41
Reservoir project is also essential to establish momentum in
creating supplemental water supplies.
Ultimately, everyone in the region has a major stake in the
success of this plan. Each agency, and each individual consumer,
must recoqnize that we all depend on the same Edwards Aquifer.
It is a common resource with a finite capacity. If the region is
to continue to grow and prosper, we must act upon this knowledge
now.
42


