For the transition period from to Commission File Number: 000-50831
Regions Financial Corporation (Exact name of registrant as specified in its charter)
(205) 326-5807 (Registrant’s telephone number, including area code)
NOT APPLICABLE (Former name, former address and former fiscal year, if changed since last report)
Indicate by check mark whether the registrant (1) has filed all reports required to be filed by Section 13 or 15(d) of the Securities Exchange Act of 1934 during the preceding 12 months (or for such shorter period that the registrant was required to file such reports), and (2) has been subject to such filing requirements for the past 90 days. Yes � No
Indicate by check mark whether the registrant has submitted electronically and posted on its corporate Web site, if any, every Interactive Data File required to be submitted and posted pursuant to Rule 405 of Regulation S-T (§232.405 of this chapter) during the preceding 12 months (or for such shorter period that the registrant was required to submit and post such files). Yes � No
Indicate by check mark whether the registrant is a large accelerated filer, an accelerated filer, a non-accelerated filer, or a smaller reporting company. See the definitions of “large accelerated filer”, “accelerated filer” and “smaller reporting company” in Rule 12b-2 of the Exchange Act. (Check one): Large accelerated filer Accelerated filer � Non-accelerated filer � (Do not check if a smaller reporting company) Smaller reporting company �
Indicate by check mark whether the registrant is a shell company (as defined in Rule 12b-2 of the Exchange Act). � Yes No
The number of shares outstanding of each of the issuer’s classes of common stock was 1,256,084,000 shares of common stock, par value $.01, outstanding as of October 29, 2010.
Quarterly report pursuant to Section 13 or 15(d) of the Securities Exchange Act of 1934
� Transition report pursuant to Section 13 or 15(d) of the Securities Exchange Act of 1934
Delaware 63-0589368 (State or other jurisdiction of incorporation or organization)
(IRS Employer Identification No.)
1900 Fifth Avenue North Birmingham, Alabama 35203
(Address of principal executive offices) (Zip Code)
Table of Contents
REGIONS FINANCIAL CORPORATION
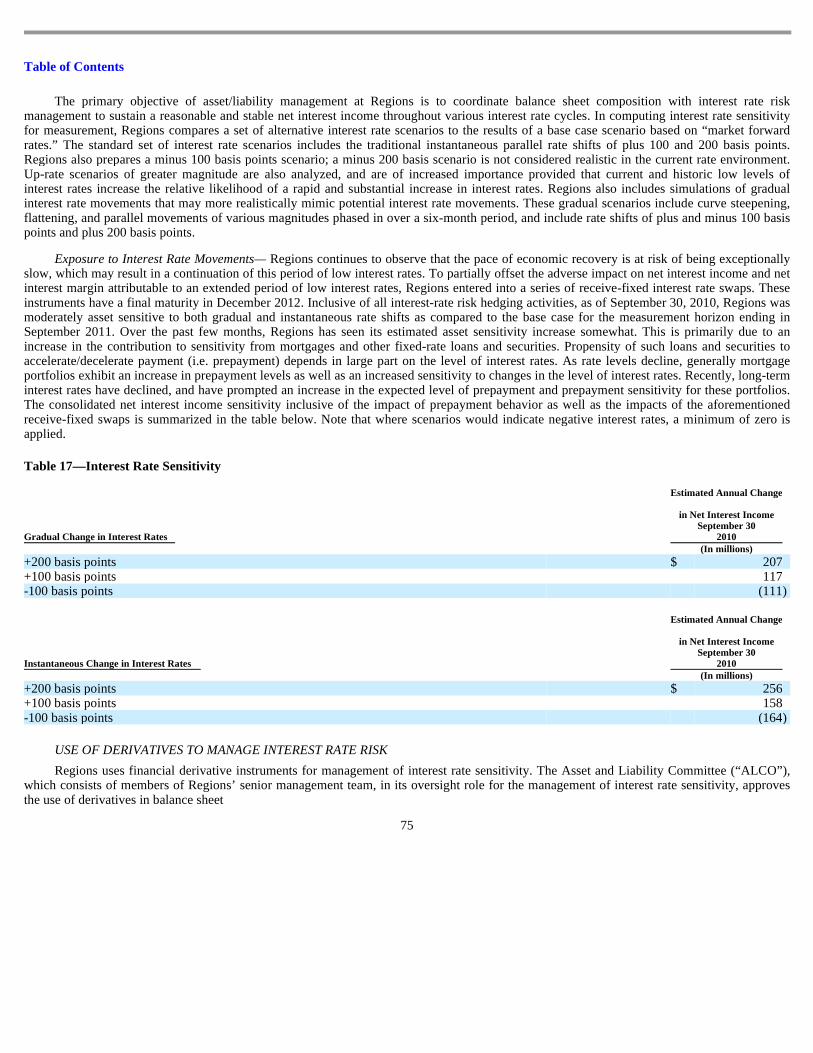
FORM 10-Q
INDEX
2
Page Part I. Financial Information
Item 1. Financial Statements (Unaudited)
Consolidated Balance Sheets—September 30, 2010, December 31, 2009 and September 30, 2009 5 Consolidated Statements of Operations—Three and nine months ended September 30, 2010 and 2009 6 Consolidated Statements of Changes in Stockholders’ Equity—Nine months ended September 30, 2010 and 2009 7 Consolidated Statements of Cash Flows—Nine months ended September 30, 2010 and 2009 8 Notes to Consolidated Financial Statements 9 Item 2. Management’s Discussion and Analysis of Financial Condition and Results of Operations 47 Item 3. Quantitative and Qualitative Disclosures about Market Risk 85 Item 4. Controls and Procedures 85
Part II. Other Information Item 1. Legal Proceedings 86 Item 1A. Risk Factors 86 Item 2. Unregistered Sales of Equity Securities and Use of Proceeds 88 Item 6. Exhibits 89
Signatures 90
Table of Contents
Forward-Looking Statements
This Quarterly Report on Form 10-Q, other periodic reports filed by Regions Financial Corporation (“Regions”) under the Securities Exchange Act of 1934, as amended, and any other written or oral statements made by or on behalf of Regions may include forward-looking statements. The Private Securities Litigation Reform Act of 1995 (the “Act”) provides a “safe harbor” for forward-looking statements which are identified as such and are accompanied by the identification of important factors that could cause actual results to differ materially from the forward-looking statements. For these statements, we, together with our subsidiaries, claim the protection afforded by the safe harbor in the Act. Forward-looking statements are not based on historical information, but rather are related to future operations, strategies, financial results or other developments. Forward-looking statements are based on management’s expectations as well as certain assumptions and estimates made by, and information available to, management at the time the statements are made. Those statements are based on general assumptions and are subject to various risks, uncertainties and other factors that may cause actual results to differ materially from the views, beliefs and projections expressed in such statements. These risks, uncertainties and other factors include, but are not limited to, those described below:
3
• The Dodd-Frank Wall Street Reform and Consumer Protection Act became law on July 21, 2010, and a number of legislative, regulatory and tax proposals remain pending. Additionally, the U.S. Treasury and federal banking regulators continue to implement, but are also beginning to wind down, a number of programs to address capital and liquidity in the banking system. All of the foregoing may have significant effects on Regions and the financial services industry, the exact nature and extent of which cannot be determined at this time.
• The impact of compensation and other restrictions imposed under the Troubled Asset Relief Program (“TARP”) until Regions repays
the outstanding preferred stock and warrant issued under the TARP, including restrictions on Regions’ ability to attract and retain talented executives and associates.
• Possible additional loan losses, impairment of goodwill and other intangibles, and adjustment of valuation allowances on deferred tax
assets and the impact on earnings and capital. • Possible changes in interest rates may increase funding costs and reduce earning asset yields, thus reducing margins.
• Possible changes in general economic and business conditions in the United States in general and in the communities Regions serves
in particular, including any prolonging or worsening of the current unfavorable economic conditions, including unemployment levels.
• Possible changes in the creditworthiness of customers and the possible impairment of the collectability of loans.
• Possible changes in trade, monetary and fiscal policies, laws and regulations, and other activities of governments, agencies, and
similar organizations, may have an adverse effect on business. • The current stresses in the financial and real estate markets, including possible continued deterioration in property values.
• Regions’ ability to manage fluctuations in the value of assets and liabilities and off-balance sheet exposure so as to maintain
sufficient capital and liquidity to support Regions’ business. • Regions’ ability to expand into new markets and to maintain profit margins in the face of competitive pressures.
• Regions’ ability to develop competitive new products and services in a timely manner and the acceptance of such products and
services by Regions’ customers and potential customers. • Regions’ ability to keep pace with technological changes.
• Regions’ ability to effectively manage credit risk, interest rate risk, market risk, operational risk, legal risk, liquidity risk, and
regulatory and compliance risk.
Table of Contents
The words “believe,” “expect,” “anticipate,” “project,” and similar expressions often signify forward-looking statements. You should not place undue reliance on any forward-looking statements, which speak only as of the date made. We assume no obligation to update or revise any forward-looking statements that are made from time to time.
See also Item 1A. “Risk Factors” of this Form 10-Q and of Regions’ Annual Report on Form 10-K for the year ended December 31, 2009 and Quarterly Reports on Form 10-Q for the quarters ended March 31, 2010 and June 30, 2010.
4
• Regions’ ability to ensure adequate capitalization which is impacted by inherent uncertainties in forecasting credit losses.
• The cost and other effects of material contingencies, including litigation contingencies, and any adverse judicial, administrative, or
arbitral rulings or proceedings. • The effects of increased competition from both banks and non-banks. • The effects of geopolitical instability and risks such as terrorist attacks.
• Possible changes in consumer and business spending and saving habits could affect Regions’ ability to increase assets and to attract
deposits. • The effects of weather and natural disasters such as floods, droughts and hurricanes, and the effects of the Gulf of Mexico oil spill. • Regions’ ability to maintain favorable ratings from rating agencies. • Potential dilution of holders of shares of Regions’ common stock resulting from the U.S. Treasury’s investment in TARP. • Possible changes in the speed of loan prepayments by Regions’ customers and loan origination or sales volumes.
• Possible acceleration of prepayments on mortgage-backed securities due to low interest rates, and the related acceleration of premium
amortization on those securities.
• The effects of problems encountered by larger or similar financial institutions that adversely affect Regions or the banking industry
generally. • Regions’ ability to receive dividends from its subsidiaries. • The effects of the failure of any component of Regions’ business infrastructure which is provided by a third party.
• Changes in accounting policies or procedures as may be required by the Financial Accounting Standards Board or other regulatory
agencies. • The effects of any damage to Regions’ reputation resulting from developments related to any of the items identified above.
Table of Contents
PART I FINANCIAL INFORMATION
Item 1. Financial Statements (Unaudited) REGIONS FINANCIAL CORPORATION AND SUBSIDIARIES
CONSOLIDATED BALANCE SHEETS
See notes to consolidated financial statements.
5
September
30 2010
December
31 2009
September
30 2009
(In millions, except share data) Assets
Cash and due from banks $ 1,898 $ 2,052 $ 2,101 Interest-bearing deposits in other banks 3,852 5,580 5,902 Federal funds sold and securities purchased under agreements to resell 1,137 379 366 Trading account assets 1,580 3,039 1,388 Securities available for sale 23,555 24,069 21,030 Securities held to maturity 26 31 39 Loans held for sale (includes $1,183, $780 and $726 measured at fair value, respectively) 1,587 1,511 1,470 Loans, net of unearned income 84,420 90,674 92,754 Allowance for loan losses (3,185 ) (3,114 ) (2,627 )
Net loans 81,235 87,560 90,127 Other interest-earning assets 1,043 734 839 Premises and equipment, net 2,564 2,668 2,694 Interest receivable 512 468 499 Goodwill 5,561 5,557 5,557 Mortgage servicing rights 204 247 216 Other identifiable intangible assets 414 503 535 Other assets 8,330 7,920 7,223
Total deposits 94,978 98,680 94,880 Borrowed funds:
Short-term borrowings: Federal funds purchased and securities sold under agreements to repurchase 2,451 1,893 2,633 Other short-term borrowings 1,210 1,775 2,653
Total borrowed funds 17,996 22,132 23,379 Other liabilities 3,361 3,625 3,235
Total liabilities 116,335 124,437 121,494 Stockholders’ equity:
Preferred stock, authorized 10 million shares Series A, cumulative perpetual participating, par value $1.00 (liquidation preference $1,000.00) per share,
net of discount; Issued—3,500,000 shares 3,370 3,343 3,334 Series B, mandatorily convertible, cumulative perpetual participating, par value $1,000.00 (liquidation
preference $1,000.00) per share; Issued—0; 267,665 and 287,500 shares, respectively — 259 278
Common stock, par value $.01 per share: Authorized 3 billion shares at September 30, 2010, and 1.5 billion shares at December 31, 2009 and
September 30, 2009 Issued including treasury stock—1,298,993,365; 1,235,850,589 and 1,231,352,421 shares, respectively 13 12 12
Additional paid-in capital 19,047 18,781 18,754 Retained earnings (deficit) (4,070 ) (3,235 ) (2,618 ) Treasury stock, at cost—42,909,422; 43,241,020 and 43,316,136 shares, respectively (1,405 ) (1,409 ) (1,411 ) Accumulated other comprehensive income, net 208 130 143
Total stockholders’ equity 17,163 17,881 18,492
Total liabilities and stockholders’ equity $ 133,498 $ 142,318 $ 139,986
Table of Contents
REGIONS FINANCIAL CORPORATION AND SUBSIDIARIES CONSOLIDATED STATEMENTS OF OPERATIONS
See notes to consolidated financial statements.
6
Three Months Ended September 30
Nine Months Ended September 30
2010 2009 2010 2009 (In millions, except per share data)
Total securities 214 238 681 728 Loans held for sale 10 12 27 43 Federal funds sold and securities purchased under agreements to resell 1 — 2 2 Trading account assets 8 10 29 32 Other interest-earning assets 6 7 20 21
Total interest income 1,158 1,314 3,553 4,044 Interest expense on:
Cash dividends declared per common share 0.01 0.01 0.03 0.12 (1) Includes $3 million for the three months ended and $266 million for the nine months ended September 30, 2009, respectively, of gross
charges, net of $0 for the three months ended and $191 million for the nine months ended September 30, 2009, respectively, of non-credit portion reported in other comprehensive income (loss). The corresponding 2010 amounts are immaterial.
Table of Contents
REGIONS FINANCIAL CORPORATION AND SUBSIDIARIES CONSOLIDATED STATEMENTS OF CHANGES IN STOCKHOLDERS’ EQUITY
See notes to consolidated financial statements.
7
Preferred Stock Common Stock Additional
Paid-In Capital
Retained
Earnings
(Deficit)
Treasury
Stock,
At Cost
Accumulated Other
Comprehensive
Income (Loss)
Total Shares Amount Shares Amount (In millions, except share and per share data) BALANCE AT JANUARY 1, 2009 4 $ 3,307 691 $ 7 $ 16,815 $ (1,869 ) $ (1,425 ) $ (22 ) $ 16,813 Comprehensive income:
Net income (loss) — — — — — (488 ) — — (488 ) Net change in unrealized gains and losses on securities available for
sale, net of tax and reclassification adjustment, excluding non-credit portion of other-than temporary impairments* — — — — — — — 389 389
Non-credit portion of other-than-temporary impairments recognized in other comprehensive income, net of tax* — — — — — — — (124 ) (124 )
Net change in unrealized gains and losses on derivative instruments, net of tax and reclassification adjustment* — — — — — — — (120 ) (120 )
Net change from defined benefit pension plans, net of tax* — — — — — — — 20 20
Net proceeds from issuance of 460 million shares of common stock — — 460 5 1,764 — — — 1,769 Issuance of 33 million shares of common stock in connection with early
extinguishment of debt — — 33 — 135 — — — 135 Impact of stock transactions under compensation plans, net — — 4 — 40 — 14 — 54
* See disclosure of reclassification adjustment amount and tax effect, as applicable, in Note 3 to the consolidated financial statements.
Table of Contents
REGIONS FINANCIAL CORPORATION AND SUBSIDIARIES CONSOLIDATED STATEMENTS OF CASH FLOWS
See notes to consolidated financial statements.
8
Nine Months Ended
September 30 2010 2009 (In millions)
Operating activities:
Net income (loss) $ (628 ) $ (488 ) Adjustments to reconcile net cash provided by operating activities:
Provision for loan losses 2,181 2,362 Depreciation and amortization of premises and equipment 216 212 Provision for losses on other real estate, net 121 90 Net amortization (accretion) of securities 151 (9 ) Net amortization of loans and other assets 167 192 Net accretion of deposits and borrowings (4 ) (13 ) Net securities gains (61 ) (165 ) Loss (gain) on early extinguishment of debt 53 (61 ) Other-than-temporary impairments, net 2 75 Deferred income tax benefit (216 ) (471 ) Originations and purchases of loans held for sale (3,744 ) (6,179 ) Proceeds from sales of loans held for sale 4,167 6,358 Gain on sale of loans, net (59 ) (79 ) Decrease (increase) in trading account assets 1,459 (338 ) (Increase) decrease in other interest-earning assets (309 ) 58 Increase in interest receivable (44 ) (41 ) Decrease in other assets 51 1,368 Decrease in other liabilities (244 ) (223 ) Other 75 (11 )
Net cash from operating activities 3,334 2,637 Investing activities:
Proceeds from sales of securities available for sale 1,610 3,657 Proceeds from maturities of:
Securities available for sale 5,617 4,002 Securities held to maturity 4 7
Purchases of:
Securities available for sale (6,572 ) (9,312 ) Proceeds from sales of loans 966 350 Net decrease in loans 2,168 1,786 Net purchases of premises and equipment (118 ) (120 ) Net cash received from deposits assumed — 279
Net cash from investing activities 3,675 649 Financing activities:
Net (decrease) increase in deposits (3,702 ) 3,700 Net decrease in short-term borrowings (7 ) (10,536 ) Proceeds from long-term borrowings 743 1,602 Payments on long-term borrowings (4,990 ) (2,482 ) Net proceeds from issuance of mandatorily convertible preferred stock — 278 Net proceeds from issuance of common stock — 1,769 Cash dividends on common stock (36 ) (94 ) Cash dividends on preferred stock (141 ) (140 ) Proceeds from stock transactions under compensation plans — 13
Net cash from financing activities (8,133 ) (5,890 )
Decrease in cash and cash equivalents (1,124 ) (2,604 ) Cash and cash equivalents at beginning of year 8,011 10,973
Cash and cash equivalents at end of period $ 6,887 $ 8,369
Table of Contents
REGIONS FINANCIAL CORPORATION AND SUBSIDIARIES
NOTES TO CONSOLIDATED FINANCIAL STATEMENTS (Unaudited)
Three and Nine Months Ended September 30, 2010 and 2009
NOTE 1—Basis of Presentation
Regions Financial Corporation (“Regions” or the “Company”) provides a full range of banking and bank-related services to individual and corporate customers through its subsidiaries and branch offices located primarily in Alabama, Arkansas, Florida, Georgia, Illinois, Indiana, Iowa, Kentucky, Louisiana, Mississippi, Missouri, North Carolina, South Carolina, Tennessee, Texas and Virginia. The Company is subject to competition from other financial institutions, is subject to the regulations of certain government agencies and undergoes periodic examinations by those regulatory authorities.
The accounting and reporting policies of Regions and the methods of applying those policies that materially affect the consolidated financial statements conform with accounting principles generally accepted in the United States (“GAAP”) and with general financial services industry practices. The accompanying interim financial statements have been prepared in accordance with the instructions for Form 10-Q and, therefore, do not include all information and notes to the consolidated financial statements necessary for a complete presentation of financial position, results of operations and cash flows in conformity with GAAP. In the opinion of management, all adjustments, consisting of normal and recurring items, necessary for the fair presentation of the consolidated financial statements have been included. These interim financial statements should be read in conjunction with the consolidated financial statements and notes thereto in Regions’ Form 10-K for the year ended December 31, 2009.
Regions has evaluated all subsequent events for potential recognition and disclosure through the filing date of this Form 10-Q.
Certain amounts in prior period financial statements have been reclassified to conform to the current period presentation. These reclassifications are immaterial and have no effect on net income, total assets or stockholders’ equity.
NOTE 2—Earnings (Loss) per Common Share
The following table sets forth the computation of basic earnings (loss) per common share and diluted earnings (loss) per common share:
9
Three Months Ended
September 30 Nine Months Ended
September 30 2010 2009 2010 2009 (In millions, except per share amounts)
Numerator:
Net income (loss) $ (155 ) $ (377 ) $ (628 ) $ (488 ) Preferred stock dividends and accretion (54 ) (60 ) (171 ) (167 )
Net income (loss) available to common shareholders $ (209 ) $ (437 ) $ (799 ) $ (655 )
Denominator:
Weighted-average common shares outstanding—basic and dilulted 1,257 1,189 1,217 921
Basic and diluted weighted-average common shares outstanding are the same due to the net losses for all periods presented.
As discussed in Note 3 to the consolidated financial statements, approximately 63 million common shares were issued in June of 2010 in connection with the conversion of the remaining Series B mandatorily convertible preferred shares, which were originally issued in May 2009. Under applicable accounting literature, such shares should be included in the denominator in arriving at diluted earnings per share as if they were issued at the beginning of the reporting period or as of the date issued, if later. Prior to conversion, these shares were not included in the computation above as such amounts would have had an antidilutive effect on earnings (loss) per common share.
NOTE 3—Stockholders’ Equity and Comprehensive Income (Loss)
On November 14, 2008, Regions completed the sale of 3.5 million shares of its Fixed Rate Cumulative Perpetual Preferred Stock, Series A, par value $1.00 and liquidation preference $1,000.00 per share (and $3.5 billion liquidation preference in the aggregate) to the U.S. Treasury as part of the Capital Purchase Program (“CPP”). Regions will pay the U.S. Treasury on a quarterly basis a 5 percent dividend, or $175 million annually, for each of the first five years of the investment, and 9 percent thereafter unless Regions redeems the shares. Regions performed a discounted cash flow analysis to value the preferred stock at the date of issuance. For purposes of this analysis, Regions assumed that the preferred stock would most likely be redeemed five years from the valuation date based on optimal financial budgeting considerations. Regions used the Bloomberg USD US Bank BBB index to derive the market yield curve as of the valuation date to discount future expected cash flows to the valuation date. The discount rate used to value the preferred stock was 7.46 percent, based on this yield curve at a 5-year maturity. Dividends were assumed to be accrued until redemption. While the discounting was required based on a 5-year redemption, Regions did not have a 5-year security or similarly termed security available. As a result, it was necessary to use a benchmark yield curve to calculate the 5-year value. To determine the appropriate yield curve that was applicable to Regions, the yield to maturity on the outstanding debt instrument with the longest dated maturity (8.875% junior subordinated notes due June 2048) was compared to the longest point on the USD US Bank BBB index as of November 14, 2008. Regions concluded that the yield to maturity as of the valuation date of the debt, which was 11.03 percent, was consistent with the indicative yield of the curve noted above. The longest available point on this curve was 10.55 percent at 30 years.
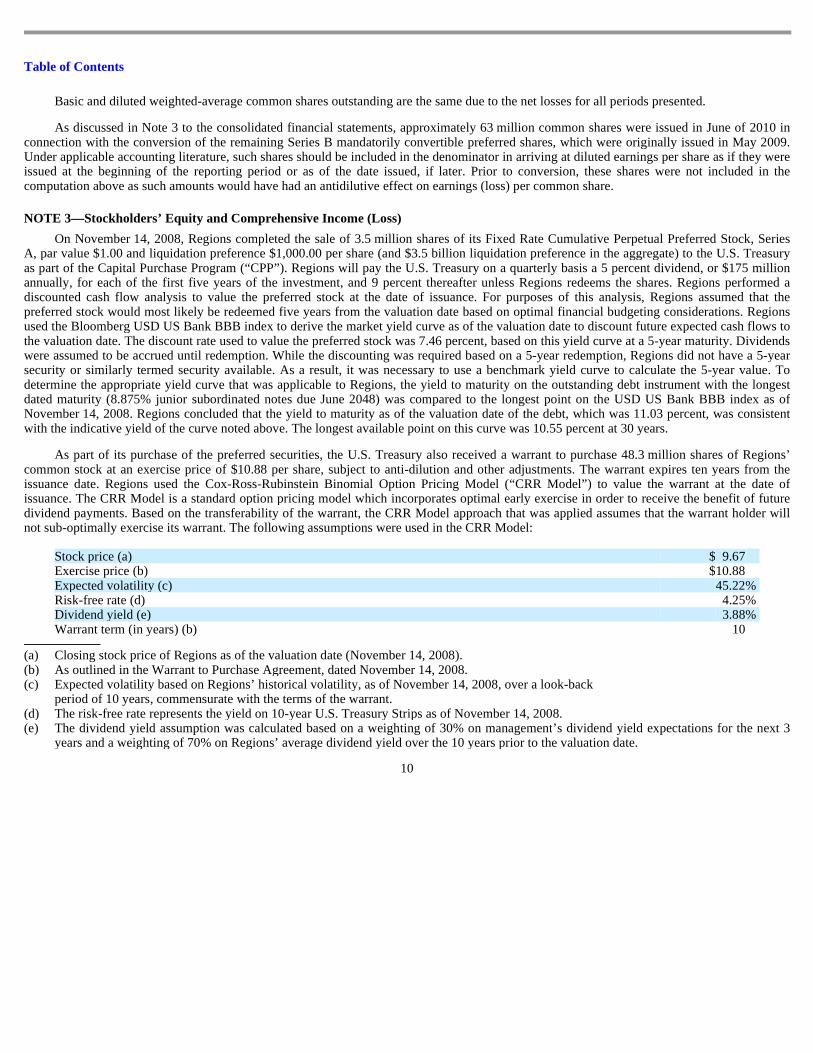
As part of its purchase of the preferred securities, the U.S. Treasury also received a warrant to purchase 48.3 million shares of Regions’common stock at an exercise price of $10.88 per share, subject to anti-dilution and other adjustments. The warrant expires ten years from the issuance date. Regions used the Cox-Ross-Rubinstein Binomial Option Pricing Model (“CRR Model”) to value the warrant at the date of issuance. The CRR Model is a standard option pricing model which incorporates optimal early exercise in order to receive the benefit of future dividend payments. Based on the transferability of the warrant, the CRR Model approach that was applied assumes that the warrant holder will not sub-optimally exercise its warrant. The following assumptions were used in the CRR Model:
period of 10 years, commensurate with the terms of the warrant.
(a) Closing stock price of Regions as of the valuation date (November 14, 2008). (b) As outlined in the Warrant to Purchase Agreement, dated November 14, 2008. (c) Expected volatility based on Regions’ historical volatility, as of November 14, 2008, over a look-back
(d) The risk-free rate represents the yield on 10-year U.S. Treasury Strips as of November 14, 2008. (e) The dividend yield assumption was calculated based on a weighting of 30% on management’s dividend yield expectations for the next 3
years and a weighting of 70% on Regions’ average dividend yield over the 10 years prior to the valuation date.
Table of Contents
The fair value allocation of the $3.5 billion between the preferred shares and the warrant resulted in $3.304 billion allocated to the preferred shares and $196 million allocated to the warrant. Accrued dividends on the preferred shares reduced retained earnings by $131 million during the first nine months of both 2010 and 2009. The unamortized discount on the preferred shares was $130 million at September 30, 2010, $157 million at December 31, 2009 and $166 million at September 30, 2009. Discount accretion on the preferred shares reduced retained earnings by $27 million during the first nine months of both 2010 and 2009, respectively. Both the preferred securities and the warrant are accounted for as components of Regions’ regulatory Tier 1 Capital.
On May 20, 2009 the Company issued 287,500 shares of mandatorily convertible preferred stock, Series B (“Series B shares”), generating net proceeds of approximately $278 million. Accrued dividends on the Series B shares reduced retained earnings by $12 million and $9 million for the first nine months of 2010 and 2009, respectively. In November 2009, a single investor converted approximately 20,000 Series B shares to common shares as allowed under the original transaction documents. On June 18, 2010, as allowed by the terms of the Series B shares, Regions initiated an early conversion of all of the remaining outstanding Series B shares. Dividends accrued and unpaid at the conversion date were settled through issuance of common shares in accordance with the original document. No Series B shares were outstanding at September 30, 2010. Approximately 63 million common shares were issued in the conversion and dividend settlement.
On May 20, 2009, the Company announced a public equity offering and issued 460 million shares of common stock at $4 per share, generating proceeds of $1.8 billion, net of issuance costs.
In addition to the offerings mentioned above, in the second quarter of 2009, the Company also exchanged approximately 33 million common shares for $202 million of outstanding 6.625% trust preferred securities issued by Regions Financing Trust II (“the Trust”). The trust preferred securities were exchanged for junior subordinated notes issued by the Company to the Trust. The Company recognized a pre-tax gain of approximately $61 million on the extinguishment of the junior subordinated notes. The increase in shareholders’ equity related to the debt for common share exchange was approximately $135 million, net of issuance costs.
At September 30, 2010, Regions had 23.1 million common shares available for repurchase through open market transactions under an existing share repurchase authorization. There were no treasury stock purchases through open market transactions during the first nine months of 2010. The Company’s ability to repurchase its common stock is limited by the terms of the CPP mentioned above.
The Board of Directors declared a $0.01 cash dividend for the third quarters of both 2010 and 2009. Regions does not expect to increase its quarterly dividend above $0.01 for the foreseeable future. Cash dividends declared for the first nine months of 2010 and 2009 were $0.03 and $0.12, respectively.
Comprehensive income (loss) is the total of net income (loss) and all other non-owner changes in equity. Items are recognized as components of comprehensive income (loss) and are displayed in the consolidated statements of changes in stockholders’ equity. In the calculation of comprehensive income (loss), certain reclassification adjustments are made to avoid double-counting items that are displayed as part of net income (loss) for a period that also had been displayed as part of other comprehensive income (loss) in that period or earlier periods.
11
Table of Contents
The following disclosure reflects the components of comprehensive income (loss) and any associated reclassification amounts:
12
Three Months Ended September 30, 2010 Before Tax Tax Effect Net of Tax (In millions)
Net income (loss) $ (305 ) $ 150 $ (155 ) Net unrealized holding gains and losses on securities available for sale arising
during the period (144 ) 56 (88 ) Less: reclassification adjustments for net securities gains realized in net
income (loss) 2 — 2
Net change in unrealized gains and losses on securities available for sale (146 ) 56 (90 ) Net unrealized holding gains and losses on derivatives arising during the
period 34 (13 ) 21 Less: reclassification adjustments for net gains realized in net income (loss) 60 (23 ) 37
Net change in unrealized gains and losses on derivative instruments (26 ) 10 (16 ) Net actuarial gains and losses arising during the period 23 (8 ) 15 Less: amortization of actuarial loss and prior service credit realized in net
Three Months Ended September 30, 2009 Before Tax Tax Effect Net of Tax (In millions)
Net income (loss) $ (651 ) $ 274 $ (377 ) Net unrealized holding gains and losses on securities available for sale arising
during the period 352 (131 ) 221 Less: non-credit portion of other-than-temporary impairments recognized in
other comprehensive income (loss) — — — Less: reclassification adjustments for net securities gains realized in net
income (loss) 4 (2 ) 2
Net change in unrealized gains and losses on securities available for sale 348 (129 ) 219 Net unrealized holding gains and losses on derivatives arising during the
period 37 (14 ) 23 Less: reclassification adjustments for net gains realized in net income (loss) 105 (40 ) 65
Net change in unrealized gains and losses on derivative instruments (68 ) 26 (42 ) Net actuarial gains and losses arising during the period 18 (9 ) 9 Less: amortization of actuarial loss and prior service credit realized in net
Nine Months Ended September 30, 2010 Before Tax Tax Effect Net of Tax (In millions)
Net income (loss) $ (1,027 ) $ 399 $ (628 ) Net unrealized holding gains and losses on securities available for sale arising
during the period 293 (109 ) 184 Less: reclassification adjustments for net securities gains realized in net income
(loss) 61 (21 ) 40
Net change in unrealized gains and losses on securities available for sale 232 (88 ) 144 Net unrealized holding gains and losses on derivatives arising during the period 52 (20 ) 32 Less: reclassification adjustments for net gains realized in net income (loss) 186 (71 ) 115
Net change in unrealized gains and losses on derivative instruments (134 ) 51 (83 ) Net actuarial gains and losses arising during the period 62 (24 ) 38 Less: amortization of actuarial loss and prior service credit realized in net income
Nine Months Ended September 30, 2009 Before Tax Tax Effect Net of Tax (In millions)
Net income (loss) $ (372 ) $ (116 ) $ (488 ) Net unrealized holding gains and losses on securities available for sale arising
during the period 783 (287 ) 496 Less: non-credit portion of other-than-temporary impairments recognized in other
comprehensive income (loss) 191 (67 ) 124 Less: reclassification adjustments for net securities gains realized in net income
(loss) 165 (58 ) 107
Net change in unrealized gains and losses on securities available for sale 427 (162 ) 265 Net unrealized holding gains and losses on derivatives arising during the period 110 (42 ) 68 Less: reclassification adjustments for net gains realized in net income (loss) 303 (115 ) 188
Net change in unrealized gains and losses on derivative instruments (193 ) 73 (120 ) Net actuarial gains and losses arising during the period 66 (25 ) 41 Less: amortization of actuarial loss and prior service credit realized in net income
Net periodic pension and other postretirement benefits cost included the following components:
During 2009, participant accruals of service in the Regions Financial Corporation Retirement Plan (the “pension plan”) and the Company’s current active non-qualified supplemental retirement plan (the “SERP”) were temporarily suspended resulting in a reduction in service cost. Effective January 1, 2010, the benefit accruals were reinstated for pension plan and SERP participants.
Matching contributions in the 401(k) plan were temporarily suspended beginning in the second quarter of 2009. Effective January 1, 2010, Regions restored matching contributions to the 401(k) plan to pre-existing levels.
NOTE 5—Share-Based Payments
Regions has long-term incentive compensation plans that permit the granting of incentive awards in the form of stock options, restricted stock awards and units, and/or stock appreciation rights. The terms of all awards issued under these plans are determined by the Compensation Committee of the Board of Directors; however, no awards may be granted after the tenth anniversary from the date the plans were initially approved by shareholders. Options and restricted stock usually vest based on employee service, generally within three years from the date of the grant. The contractual lives of options granted under these plans range from seven to ten years from the date of grant.
On May 13, 2010, the shareholders of the Company approved the Regions Financial Corporation 2010 Long-Term Incentive Plan (“2010 LTIP”), which permits the Company to grant to employees and directors various forms of incentive compensation. These forms of incentive compensation are similar to the types of compensation approved in prior plans. The 2010 LTIP authorizes 100 million common share equivalents available for grant, where grants of options count as one share equivalent and grants of full value awards (e.g., shares of restricted stock and restricted stock units) count as 2.25 share equivalents. Unless otherwise determined
14
For The Three Months Ended September 30
Pension Other Postretirement
Benefits 2010 2009 2010 2009 (In millions)
Service cost $ 8 $ — $ — $ — Interest cost 23 22 — — Expected return on plan assets (28 ) (22 ) — — Amortization of actuarial loss 12 11 — — Settlement charge — 1 — —
$ 15 $ 12 $ — $ —
For The Nine Months Ended September 30
Pension Other Postretirement
Benefits 2010 2009 2010 2009 (In millions)
Service cost $ 27 $ 2 $ — $ — Interest cost 69 65 2 1 Expected return on plan assets (78 ) (66 ) — — Amortization of prior service cost (credit) 1 1 (1 ) (1 ) Amortization of actuarial loss 33 33 — — Settlement charge — 1 — —
$ 52 $ 36 $ 1 $ —
Table of Contents
by the Compensation Committee of the Board of Directors, grants of restricted stock and restricted stock units accrue dividends as they are declared by the Board of Directors, and the dividends are paid upon vesting of the award. The 2010 LTIP closed all prior long-term incentive plans to new grants, and accordingly, prospective grants must be made under the 2010 LTIP or a successor plan. All existing grants under prior long-term incentive plans were unaffected by this amendment. The number of remaining share equivalents available for future issuance under the active long-term compensation plan was approximately 91 million at September 30, 2010.
In the second quarter of 2010, Regions made stock option grants that vest based upon a service condition. The fair value of these stock options was estimated on the date of the grant using a Black-Scholes option pricing model and related assumptions. The stock options vest ratably over a 3-year term. During the first quarter of 2009, Regions made stock option grants from prior long-term incentive plans that vest based upon a service condition and a market condition in addition to awards that were similar to prior grants. The fair value of these stock options was estimated on the date of the grant using a Monte-Carlo simulation method. The simulation generates a defined number of stock price paths in order to develop a reasonable estimate of the range of future expected stock prices and minimize standard error.
The following table summarizes the weighted-average assumptions used and the estimated fair values related to stock options granted during the nine months ended September 30:
The second quarter 2010 awards of stock options were granted to a broader pool of employees than the 2009 awards. The expected exercise behavior of the broader base of employees receiving awards resulted in a lower expected option life when comparing 2010 to 2009. The expected volatility increased based upon increases in the historical volatility of Regions’ stock price, offset slightly by reductions in the implied volatility measurements from traded options on the Company’s stock. The expected dividend yield increased based upon the Company’s expectation of increased dividends over the long term.
The following table details the activity during the first nine months of 2010 and 2009 related to stock options:
In the second quarter of 2010, Regions granted 800 thousand restricted shares that vest based upon a service condition. Dividend payments during the vesting period are deferred to the end of the vesting term. The fair value of these restricted shares was estimated based upon the fair value of the underlying shares on the date of the grant. The valuation was not adjusted for the deferral of dividends.
Outstanding at beginning of period 52,968,560 $ 26.34 52,955,298 $ 28.22 Granted 7,173,667 7.00 4,063,209 3.29 Exercised (137,736 ) 3.29 — — Forfeited or cancelled (3,610,699 ) 20.07 (2,335,717 ) 30.38
Outstanding at end of period 56,393,792 $ 24.34 54,682,790 $ 26.29
Exercisable at end of period 45,537,603 $ 27.85 43,875,821 $ 28.76
Table of Contents
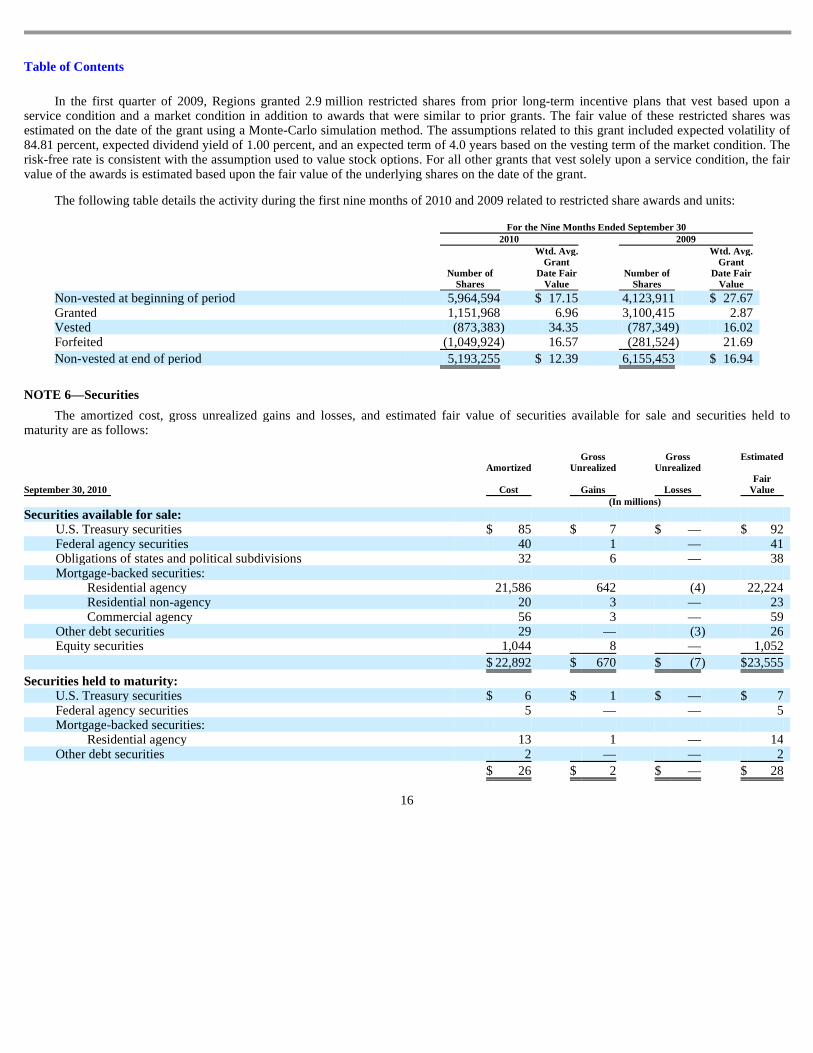
In the first quarter of 2009, Regions granted 2.9 million restricted shares from prior long-term incentive plans that vest based upon a service condition and a market condition in addition to awards that were similar to prior grants. The fair value of these restricted shares was estimated on the date of the grant using a Monte-Carlo simulation method. The assumptions related to this grant included expected volatility of 84.81 percent, expected dividend yield of 1.00 percent, and an expected term of 4.0 years based on the vesting term of the market condition. The risk-free rate is consistent with the assumption used to value stock options. For all other grants that vest solely upon a service condition, the fair value of the awards is estimated based upon the fair value of the underlying shares on the date of the grant.
The following table details the activity during the first nine months of 2010 and 2009 related to restricted share awards and units:
NOTE 6—Securities
The amortized cost, gross unrealized gains and losses, and estimated fair value of securities available for sale and securities held to maturity are as follows:
16
For the Nine Months Ended September 30 2010 2009
Number of
Shares
Wtd. Avg. Grant
Date Fair Value
Number of Shares
Wtd. Avg. Grant
Date Fair Value
Non-vested at beginning of period 5,964,594 $ 17.15 4,123,911 $ 27.67 Granted 1,151,968 6.96 3,100,415 2.87 Vested (873,383 ) 34.35 (787,349 ) 16.02 Forfeited (1,049,924 ) 16.57 (281,524 ) 21.69
Non-vested at end of period 5,193,255 $ 12.39 6,155,453 $ 16.94
September 30, 2010
Amortized
Cost
Gross Unrealized
Gains
Gross Unrealized
Losses
Estimated
Fair Value
(In millions)
Securities available for sale:
U.S. Treasury securities $ 85 $ 7 $ — $ 92 Federal agency securities 40 1 — 41 Obligations of states and political subdivisions 32 6 — 38 Mortgage-backed securities:
The Company reviews its securities portfolio on a regular basis to determine if there are any conditions indicating that a security has other-than-temporary impairment. Factors considered in this determination include the length of time and the extent to which the market value has been below cost, the credit standing of the issuer, Regions’ intent to sell and whether it is more likely than not that the Company will have to sell the security before its market value recovers. For debt securities, activity related to the credit loss component of other-than-temporary impairment is recognized in earnings, and the portion of other-than-temporary impairment related to all other factors is recognized in other comprehensive income (loss). For the three and nine months ended September 30, 2010, Regions recorded a credit related impairment charge related to debt securities of approximately $0 and $1 million, respectively. For the three and nine months ended September 30, 2009, Regions recorded a credit related impairment charge related to debt securities of approximately $3 million and $63 million, respectively. There were no non-credit related impairment charges related to debt securities recorded during the three and nine months ended September 30, 2010. For the three and nine months ended September 30, 2009, $0 and $191 million non-credit portion of other-than-temporary impairment charges related to debt securities were recorded in other comprehensive income (loss).
In addition to the other-than-temporary impairment charge recognized during the nine months ended September 30, 2010 related to debt securities, the Company recognized a write-down of approximately $1 million during both the three and nine months ended September 30, 2010 and $0 and $12 million for the three and nine months ended September 30, 2009, representing other-than-temporary-impairments of equity securities classified as available for sale. The Company recognizes impairment of available for sale equity securities when the current market value is below the highest traded price within the past six months. The cost basis of the securities is adjusted to current fair value with the entire offset recorded in the statement of operations.
17
December 31, 2009 Amortized
Cost
Gross Unrealized
Gains
Gross Unrealized
Losses
Estimated Fair
Value (In millions)
Securities available for sale:
U.S. Treasury securities $ 46 $ 4 $ — $ 50 Federal agency securities 44 1 — 45 Obligations of states and political subdivisions 70 — — 70 Mortgage-backed securities:
The following tables present unrealized loss and estimated fair value of securities available for sale at September 30, 2010 and December 31, 2009. These securities are segregated between investments that have been in a continuous unrealized loss position for less than twelve months and twelve months or more.
For securities included in the tables above, management does not believe that any of the 83 securities and 151 securities at September 30, 2010 and December 31, 2009, respectively, in an individual loss position represented an other-than-temporary impairment as of those dates.
The gross unrealized loss on debt securities held to maturity was less than $1 million at September 30, 2010 and December 31, 2009.
The cost and estimated fair value of securities available for sale and securities held to maturity at September 30, 2010, by contractual maturity, are shown below. Expected maturities will differ from contractual maturities because borrowers may have the right to call or prepay obligations with or without call or prepayment penalties.
Proceeds from sales of securities available for sale in the three and nine months of 2010 were $150 million and $1.6 billion, respectively. Gross realized gains and losses were $2 million and $0 million for the three months ended September 30, 2010, and $84 million and $23 million, respectively, for the nine months ended September 30, 2010. Proceeds from sales of securities available for sale in the three and nine months of 2009 were $1.3 billion and $3.7 billion, respectively. Gross realized gains and losses were $8 million and $4 million, respectively, for the three months ended September 30, 2009, and $169 million and $4 million, respectively, for the nine months ended September 30, 2009.
Equity securities included $477 million and $437 million, respectively, of amortized cost related to Federal Reserve Bank stock and Federal Home Loan Bank (“FHLB”) stock as of September 30, 2010 and $492 million and $533 million, respectively, of amortized cost related to Federal Reserve Bank stock and FHLB stock as of December 31, 2009. The estimated fair value of both Federal Reserve Bank and FHLB stock approximates their carrying amounts.
Securities with carrying values of $14.4 billion and $12.4 billion at September 30, 2010 and December 31, 2009, respectively, were pledged to secure public funds, trust deposits and certain borrowing arrangements.
Trading account net gains totaled $18 million and $27 million for the three and nine months ended September 30, 2010, respectively, (including $6 million and $10 million of net unrealized gains for the three months and nine months ended September 30, 2010, respectively). Trading account net gains totaled $27 million and $50 million for the three and nine months ended September 30, 2009, respectively, (including $24 million and $12 million of net unrealized gains for the three months and nine months ended September 30, 2009, respectively). The unrealized gains primarily represent market valuation changes in securities related to deferred compensation plans, and are offset by increases in salaries and employee benefits expense.
19
Amortized
Cost Estimated Fair Value
(In millions)
Securities available for sale:
Due in one year or less $ 41 $ 41 Due after one year through five years 89 96 Due after five years through ten years 14 14 Due after ten years 42 46 Mortgage-backed securities:
Due in one year or less $ 4 $ 4 Due after one year through five years 6 7 Due after five years through ten years 3 3 Due after ten years — — Mortgage-backed securities:
Residential agency 13 14
$ 26 $ 28
Table of Contents
NOTE 7—Business Segment Information
Regions’ segment information is presented based on Regions’ key segments of business. Each segment is a strategic business unit that serves specific needs of Regions’ customers. The Company’s primary segment is Banking/Treasury, which represents the Company’s branch network, including consumer and commercial banking functions, and has separate management that is responsible for the operation of that business unit. This segment also includes the Company’s Treasury function, including the Company’s securities portfolio and other wholesale funding activities.
In addition to Banking/Treasury, Regions has designated as distinct reportable segments the activity of its Investment Banking/Brokerage/Trust and Insurance divisions. Investment Banking/Brokerage/Trust includes trust activities and all brokerage and investment activities associated with Morgan Keegan. Insurance includes all business associated with commercial insurance and credit life products sold to consumer customers.
During the third quarter of 2010, minor reclassifications were made from the Banking/Treasury segment to the Insurance segment to more appropriately present management’s current view of the segments. The 2009 amounts presented below have been adjusted to conform to the 2010 presentation.
The following tables present financial information for each reportable segment for the period indicated.
20
Banking/ Treasury
Investment Banking/
Brokerage/ Trust Insurance
Total Company
Three months ended September 30, 2010 (In millions)
Net interest income $ 852 $ 15 $ 1 $ 868 Provision for loan losses 760 — — 760 Non-interest income 415 309 26 750 Non-interest expense 851 289 23 1,163 Income tax expense (benefit) (165 ) 13 2 (150 )
Net income (loss) $ (179 ) $ 22 $ 2 $ (155 )
Average assets $ 127,090 $ 6,121 $ 518 $ 133,729
Banking/ Treasury
Investment Banking/
Brokerage/ Trust Insurance
Total Company
Three months ended September 30, 2009 (In millions)
Net interest income $ 830 $ 14 $ 1 $ 845 Provision for loan losses 1,025 — — 1,025 Non-interest income 430 316 26 772 Non-interest expense 935 284 24 1,243 Income tax expense (benefit) (292 ) 17 1 (274 )
Net income (loss) $ (408 ) $ 29 $ 2 $ (377 )
Average assets $ 134,824 $ 4,981 $ 500 $ 140,305
Table of Contents
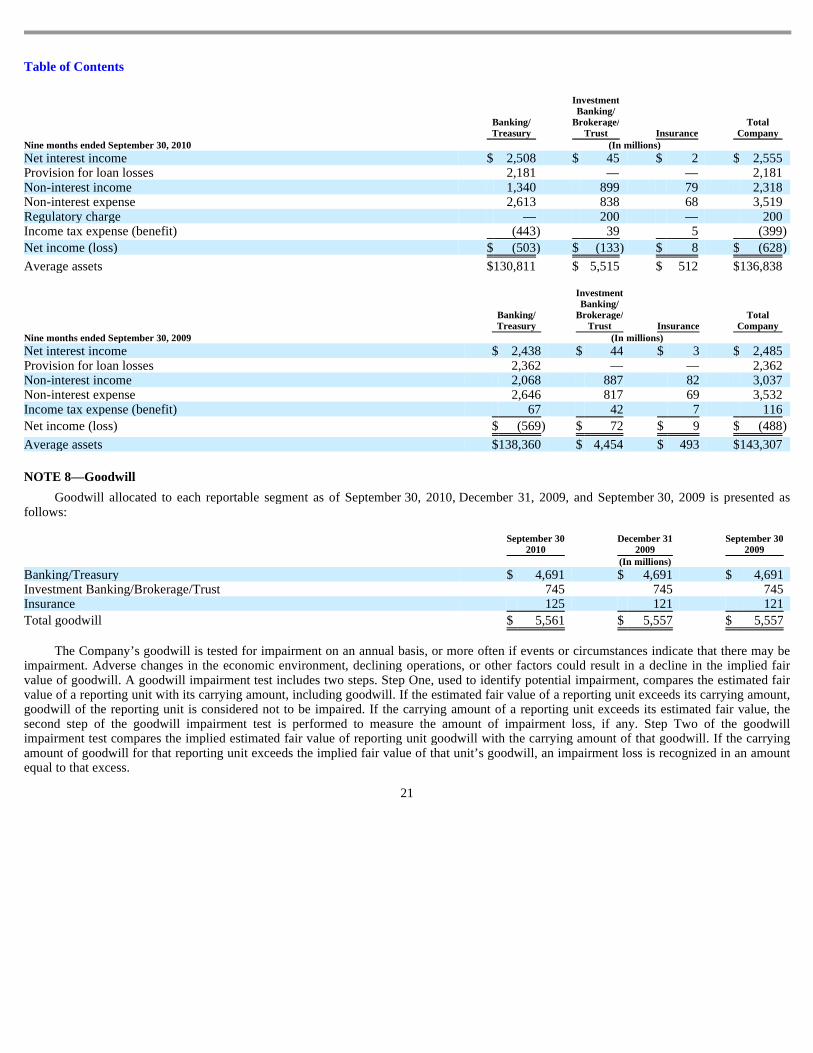
NOTE 8—Goodwill
Goodwill allocated to each reportable segment as of September 30, 2010, December 31, 2009, and September 30, 2009 is presented as follows:
The Company’s goodwill is tested for impairment on an annual basis, or more often if events or circumstances indicate that there may be impairment. Adverse changes in the economic environment, declining operations, or other factors could result in a decline in the implied fair value of goodwill. A goodwill impairment test includes two steps. Step One, used to identify potential impairment, compares the estimated fair value of a reporting unit with its carrying amount, including goodwill. If the estimated fair value of a reporting unit exceeds its carrying amount, goodwill of the reporting unit is considered not to be impaired. If the carrying amount of a reporting unit exceeds its estimated fair value, the second step of the goodwill impairment test is performed to measure the amount of impairment loss, if any. Step Two of the goodwill impairment test compares the implied estimated fair value of reporting unit goodwill with the carrying amount of that goodwill. If the carrying amount of goodwill for that reporting unit exceeds the implied fair value of that unit’s goodwill, an impairment loss is recognized in an amount equal to that excess.
21
Banking/ Treasury
Investment Banking/
Brokerage/ Trust Insurance
Total Company
Nine months ended September 30, 2010 (In millions)
Net interest income $ 2,508 $ 45 $ 2 $ 2,555 Provision for loan losses 2,181 — — 2,181 Non-interest income 1,340 899 79 2,318 Non-interest expense 2,613 838 68 3,519 Regulatory charge — 200 — 200 Income tax expense (benefit) (443 ) 39 5 (399 )
Net income (loss) $ (503 ) $ (133 ) $ 8 $ (628 )
Average assets $ 130,811 $ 5,515 $ 512 $ 136,838
Banking/ Treasury
Investment Banking/
Brokerage/ Trust Insurance
Total Company
Nine months ended September 30, 2009 (In millions)
Net interest income $ 2,438 $ 44 $ 3 $ 2,485 Provision for loan losses 2,362 — — 2,362 Non-interest income 2,068 887 82 3,037 Non-interest expense 2,646 817 69 3,532 Income tax expense (benefit) 67 42 7 116
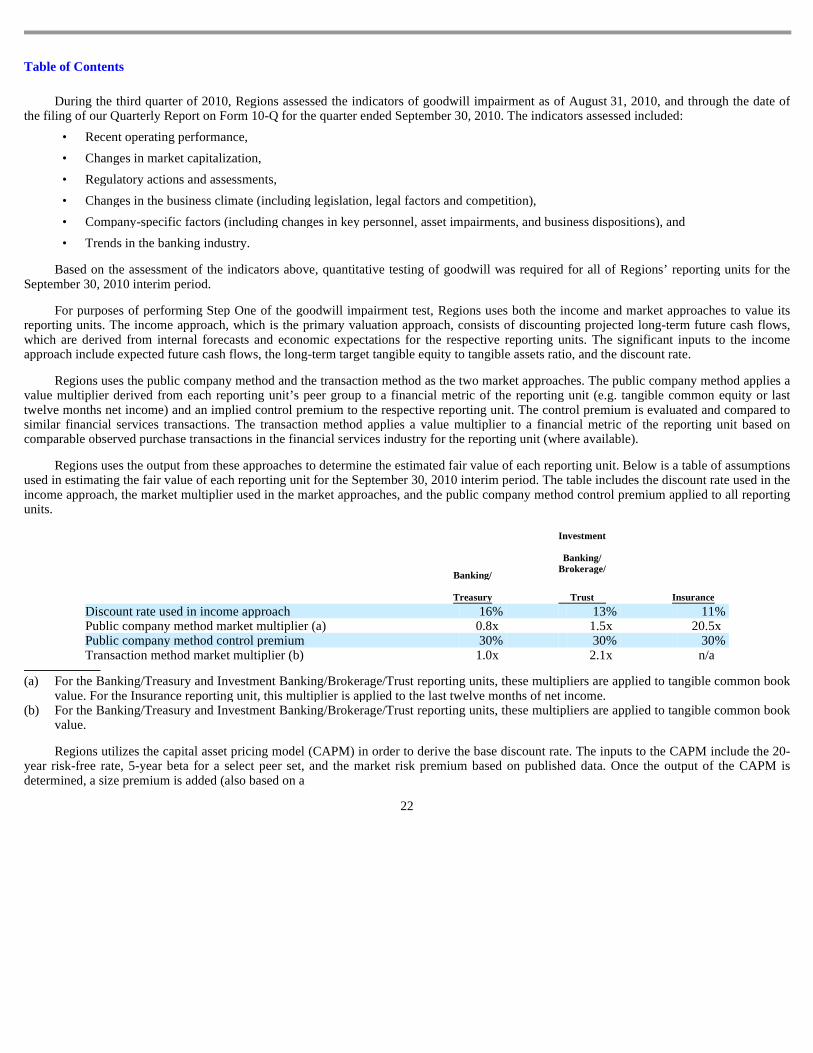
During the third quarter of 2010, Regions assessed the indicators of goodwill impairment as of August 31, 2010, and through the date of the filing of our Quarterly Report on Form 10-Q for the quarter ended September 30, 2010. The indicators assessed included:
Based on the assessment of the indicators above, quantitative testing of goodwill was required for all of Regions’ reporting units for the September 30, 2010 interim period.
For purposes of performing Step One of the goodwill impairment test, Regions uses both the income and market approaches to value its reporting units. The income approach, which is the primary valuation approach, consists of discounting projected long-term future cash flows, which are derived from internal forecasts and economic expectations for the respective reporting units. The significant inputs to the income approach include expected future cash flows, the long-term target tangible equity to tangible assets ratio, and the discount rate.
Regions uses the public company method and the transaction method as the two market approaches. The public company method applies a value multiplier derived from each reporting unit’s peer group to a financial metric of the reporting unit (e.g. tangible common equity or last twelve months net income) and an implied control premium to the respective reporting unit. The control premium is evaluated and compared to similar financial services transactions. The transaction method applies a value multiplier to a financial metric of the reporting unit based on comparable observed purchase transactions in the financial services industry for the reporting unit (where available).
Regions uses the output from these approaches to determine the estimated fair value of each reporting unit. Below is a table of assumptions used in estimating the fair value of each reporting unit for the September 30, 2010 interim period. The table includes the discount rate used in the income approach, the market multiplier used in the market approaches, and the public company method control premium applied to all reporting units.
Regions utilizes the capital asset pricing model (CAPM) in order to derive the base discount rate. The inputs to the CAPM include the 20-year risk-free rate, 5-year beta for a select peer set, and the market risk premium based on published data. Once the output of the CAPM is determined, a size premium is added (also based on a
22
• Recent operating performance, • Changes in market capitalization, • Regulatory actions and assessments, • Changes in the business climate (including legislation, legal factors and competition), • Company-specific factors (including changes in key personnel, asset impairments, and business dispositions), and • Trends in the banking industry.
Banking/
Treasury
Investment
Banking/ Brokerage/
Trust Insurance
Discount rate used in income approach 16 % 13 % 11 % Public company method market multiplier (a) 0.8 x 1.5 x 20.5 x Public company method control premium 30 % 30 % 30 % Transaction method market multiplier (b) 1.0 x 2.1 x n/a
(a) For the Banking/Treasury and Investment Banking/Brokerage/Trust reporting units, these multipliers are applied to tangible common book
value. For the Insurance reporting unit, this multiplier is applied to the last twelve months of net income. (b) For the Banking/Treasury and Investment Banking/Brokerage/Trust reporting units, these multipliers are applied to tangible common book
value.
Table of Contents
published source) as well as a company-specific risk premium, which is an estimate determined by the Company and meant to compensate for the risk inherent in the future cash flow projections and inherent differences (such as business model and market perception of risk) between Regions and the peer set. The table below summarizes the discount rate used in the goodwill impairment tests of the Banking/Treasury reporting unit for the reporting periods indicated:
The decrease in discount rate from the Annual 2009 test to the first quarter 2010 test was driven primarily by a reduction in the company-specific risk premium, which was lowered as a result of updated forecasts that reduced uncertainty from the projected cash flows.
In estimating future cash flows, a balance sheet as of the test date and an income statement for the last twelve months of activity for the reporting unit are compiled. From that point, future balance sheets and income statements are projected based on the inputs discussed below. Cash flows are based on expected future capitalization requirements due to balance sheet growth and anticipated changes in regulatory capital requirements. The baseline cash flows utilized in all models correspond to the most recent internal forecasts and/or budgets that range from 1 to 5 years. These internal forecasts are typically projections submitted to regulators and are based on inputs developed by the Company’s internal economic forecasting committee.
Specific factors as of the date of filing our financial statements that could negatively impact the assumptions used in assessing goodwill for impairment include: disparities in the level of fair value changes in net assets compared to equity; adverse business trends resulting from litigation and/or regulatory actions; increasing FDIC premiums; higher loan losses resulting from a double-dip recession or deflation; lengthened forecasts of unemployment in excess of 10 percent beyond 2012; future increased minimum regulatory capital requirements above current thresholds (refer to Note 14 “Regulatory Capital Requirements and Restrictions” of the consolidated financial statements included in the 2009 Form 10-K for a discussion of current minimum regulatory requirements); future federal rules and regulations resulting from the Dodd-Frank Wall Street Reform and Consumer Protection Act; and/or a protraction in the current low level of interest rates beyond 2012.
The Step One analyses performed for the Investment Banking/Brokerage/Trust and Insurance reporting units during the third quarter of 2010 indicated that the estimated fair value exceeded its carrying value (including goodwill). Therefore, a Step Two analysis was not required for these reporting units.
The Step One analysis performed for the Banking/Treasury reporting unit during the third quarter of 2010 indicated that the carrying value (including goodwill) of the reporting unit exceeded its estimated fair value. Therefore, Step Two was performed for the Banking/Treasury reporting unit as discussed below. For purposes of performing Step Two of the goodwill impairment test, Regions compared the implied estimated fair value of the Banking/Treasury reporting unit goodwill with the carrying amount of that goodwill. In order to determine the implied estimated fair value, a full purchase price allocation was performed in the same manner as if a business combination had occurred. As part of the Step Two analysis, Regions estimated the fair value of all of the assets and liabilities of the reporting unit, including unrecognized assets and liabilities. The fair values of certain material financial assets and liabilities and the valuation methodologies are discussed in Note 11 “Fair Value Measurements.” Based on the results of the Step Two analysis performed, Regions concluded the Banking/Treasury reporting unit’s goodwill was not impaired for the September 30, 2010 interim period.
Regions has not completed the annual goodwill impairment test performed in the fourth quarter.
NOTE 9—Loan Servicing
The fair value of mortgage servicing rights is calculated using various assumptions including future cash flows, market discount rates, expected prepayment rates, servicing costs and other factors. A significant change
23
3rd Quarter
2010 2nd Quarter
2010 1st Quarter
2010 Annual Test
2009 3rd Quarter
2009
Discount Rate 16 % 16 % 16 % 18 % 18 %
Table of Contents
in prepayments of mortgages in the servicing portfolio could result in significant changes in the valuation adjustments, thus creating potential volatility in the carrying amount of mortgage servicing rights. Regions uses various derivative instruments and/or trading securities to mitigate the effect of changes in the fair value of its mortgage servicing rights in the statement of operations. The table below presents the impact on the statements of operations associated with changes in mortgage servicing rights and related derivative and/or trading securities for the three and nine months ended September 30, 2010 and 2009.
Beginning in the third quarter of 2009, Regions began using an option-adjusted spread (OAS) valuation approach. The OAS represents the additional spread over the swap rate that is required in order for the asset’s discounted cash flows to equal its market price.
The table below presents an analysis of mortgage servicing rights for the three and nine months ended September 30, 2010 and 2009, under the fair value measurement method:
Data and assumptions used in the fair value calculation related to mortgage servicing rights (excluding related derivative instruments) as of September 30, 2010 and 2009 are as follows:
24
Three Months Ended
September 30 Nine Months Ended
September 30 2010 2009 2010 2009 (In millions)
Net interest income $ — $ — $ 3 $ — Brokerage, investment banking and capital markets income — — 4 — Mortgage income 2 19 30 16
Total $ 2 $ 19 $ 37 $ 16
Three Months Ended
September 30 Nine Months Ended
September 30 2010 2009 2010 2009 (In millions)
Carrying value, beginning of period $ 220 $ 202 $ 247 $ 161 Additions 23 31 53 83 Increase (decrease) in fair value:
Due to change in valuation inputs or assumptions (31 ) (11 ) (77 ) (2 ) Other changes (1) (8 ) (6 ) (19 ) (26 )
Carrying value, end of period $ 204 $ 216 $ 204 $ 216
(1) Represents economic amortization associated with borrower repayments.
Estimated impact on fair value of a 10% increase $ (16 ) $ (13 ) Estimated impact on fair value of a 20% increase $ (31 ) $ (25 )
Option-adjusted spread (basis points) 529 633 Estimated impact on fair value of a 10% increase $ (4 ) $ (4 ) Estimated impact on fair value of a 20% increase $ (7 ) $ (8 )
The sensitivity calculations above are hypothetical and should not be considered to be predictive of future performance. Changes in fair value based on adverse changes in assumptions generally cannot be extrapolated because the relationship of the change in assumption to the change in fair value may not be linear. Also, the effect of an adverse variation in a particular assumption on the fair value of the mortgage servicing rights is calculated without changing any other assumption, while in reality changes in one factor may result in changes in another which may either magnify or counteract the effect of the change. The derivative instruments utilized by Regions would serve to reduce the estimated impacts to fair value included in the table above.
NOTE 10—Derivative Financial Instruments and Hedging Activities
Regions enters into derivative financial instruments to manage interest rate risk, facilitate asset/liability management strategies and manage other exposures. These derivative instruments primarily include interest rate swaps, options on interest rate swaps, interest rate caps and floors, Eurodollar futures, forward rate contracts and forward sale commitments. All derivative financial instruments are recognized on the consolidated balance sheets as other assets or other liabilities at fair value. Regions enters into master netting agreements with counterparties and/or requires collateral based on counterparty credit ratings to cover exposures.
Interest rate swaps are agreements to exchange interest payments based upon notional amounts. Interest rate swaps subject Regions to market risk associated with changes in interest rates, as well as the credit risk that the counterparty will fail to perform. Option contracts involve rights to buy or sell financial instruments on a specified date or over a period at a specified price. These rights do not have to be exercised. Some option contracts such as interest rate floors, involve the exchange of cash based on changes in specified indices. Interest rate floors are contracts to hedge interest rate declines based on a notional amount. Interest rate floors subject Regions to market risk associated with changes in interest rates, as well as the credit risk that the counterparty will fail to perform. Forward rate contracts are commitments to buy or sell financial instruments at a future date at a specified price or yield. Regions primarily enters into forward rate contracts on market instruments, which expose Regions to market risk associated with changes in the value of the underlying financial instrument, as well as the credit risk that the counterparty will fail to perform. Eurodollar futures are futures contracts on Eurodollar deposits. Eurodollar futures subject Regions to market risk associated with changes in interest rates. Because futures contracts are cash settled daily, there is minimal credit risk associated with Eurodollar futures.
25
Table of Contents
The following tables present the fair value of derivative instruments on a gross basis as of September 30, 2010 and December 31, 2009, respectively:
26
September 30, 2010 Asset Derivatives Liability Derivatives
Balance Sheet Location Fair
Value Balance Sheet Location Fair
Value (In millions)
Derivatives designated as hedging instruments
Interest rate swaps Other assets $ 402 Other liabilities $ 51 Interest rate options Other assets 19 Other liabilities — Eurodollar futures (1) Other assets — Other liabilities —
Total derivatives designated as hedging instruments $ 421 $ 51
Derivatives not designated as hedging instruments
Interest rate swaps Other assets $ 2,393 Other liabilities $ 2,394 Interest rate options Other assets 46 Other liabilities 29 Interest rate futures and forward commitments Other assets 8 Other liabilities 15 Other contracts Other assets 21 Other liabilities 19
Total derivatives not designated as hedging instruments $ 2,468 $ 2,457
Total derivatives $ 2,889 $ 2,508
(1) Changes in fair value are cash-settled daily; therefore there is no ending balance at any given reporting period.
December 31, 2009 Asset Derivatives Liability Derivatives
Balance Sheet Location Fair
Value Balance Sheet Location Fair
Value (In millions)
Derivatives designated as hedging instruments
Interest rate swaps Other assets $ 390 Other liabilities $ 22 Interest rate options Other assets 52 Other liabilities — Eurodollar futures (1) Other assets — Other liabilities —
Total derivatives designated as hedging instruments $ 442 $ 22
Derivatives not designated as hedging instruments
Interest rate swaps Other assets $ 1,518 Other liabilities $ 1,505 Interest rate options Other assets 26 Other liabilities 33 Interest rate futures and forward commitments Other assets 13 Other liabilities — Other contracts Other assets 20 Other liabilities 19
Total derivatives not designated as hedging instruments $ 1,577 $ 1,557
Total derivatives $ 2,019 $ 1,579
(1) Changes in fair value are cash-settled daily; therefore there is no ending balance at any given reporting period.
Table of Contents
HEDGING DERIVATIVES
Derivatives entered into to manage interest rate risk and facilitate asset/liability management strategies are designated as hedging derivatives. Derivative financial instruments that qualify in a hedging relationship are classified, based on the exposure being hedged, as either fair value or cash flow hedges. The Company formally documents all hedging relationships between hedging instruments and the hedged items, as well as its risk management objective and strategy for entering into various hedge transactions. The Company performs periodic assessments to determine whether the hedging relationship has been highly effective in offsetting changes in fair values or cash flows of hedged items and whether the relationship is expected to continue to be highly effective in the future.
When a hedge is terminated or hedge accounting is discontinued because the hedged item no longer meets the definition of a firm commitment, or because it is probable that the forecasted transaction will not occur by the end of the specified time period, the derivative will continue to be recorded in the consolidated balance sheets at its fair value, with changes in fair value recognized currently in other non-interest income. Any asset or liability that was recorded pursuant to recognition of the firm commitment is removed from the consolidated balance sheets and recognized currently in other non-interest expense. Gains and losses that were accumulated in other comprehensive income pursuant to the hedge of a forecasted transaction are recognized immediately in other non-interest expense.
The following tables present the effect of derivative instruments on the statements of operations for the periods indicated:
Amount of Gain(Loss) Recognized in OCI on Derivatives (Effective
Portion) (1)
Location of Gain(Loss)
Reclassified from Accumulated OCI
into Income (Effective Portion)
Amount of Gain(Loss)
Reclassified from Accumulated OCI
into Income (Effective Portion) (2)
Location of Gain(Loss) Recognized in Income
on Derivatives (Ineffective Portion
and Amount Excluded from Effectiveness
Testing)
Amount of Gain(Loss) Recognized in Income
on Derivatives (Ineffective Portion
and Amount Excluded from
Effectiveness Testing) (2)
(In millions) Interest rate swaps
$ (22)
Interest income on loans
$ 131
Other non-interest expense $ 3
Interest rate swaps (42)
Interest expense on debt
—
Other non-interest expense —
Interest rate options (15)
Interest income on loans
33
Interest income on loans —
Eurodollar futures (4)
Interest income on loans
20
Other non-interest expense (7)
Total $ (83) $ 184 $ (4)
(1) After-tax (2) Pre-tax
Table of Contents
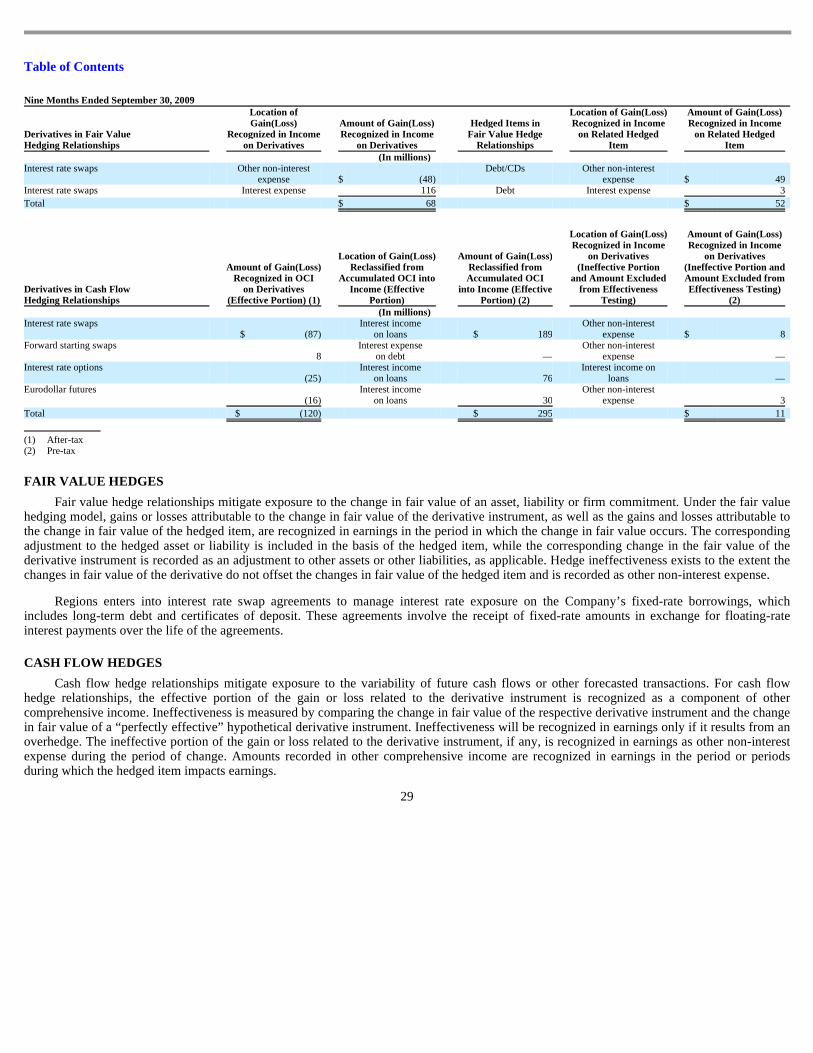
FAIR VALUE HEDGES
Fair value hedge relationships mitigate exposure to the change in fair value of an asset, liability or firm commitment. Under the fair value hedging model, gains or losses attributable to the change in fair value of the derivative instrument, as well as the gains and losses attributable to the change in fair value of the hedged item, are recognized in earnings in the period in which the change in fair value occurs. The corresponding adjustment to the hedged asset or liability is included in the basis of the hedged item, while the corresponding change in the fair value of the derivative instrument is recorded as an adjustment to other assets or other liabilities, as applicable. Hedge ineffectiveness exists to the extent the changes in fair value of the derivative do not offset the changes in fair value of the hedged item and is recorded as other non-interest expense.
Regions enters into interest rate swap agreements to manage interest rate exposure on the Company’s fixed-rate borrowings, which includes long-term debt and certificates of deposit. These agreements involve the receipt of fixed-rate amounts in exchange for floating-rate interest payments over the life of the agreements.
CASH FLOW HEDGES
Cash flow hedge relationships mitigate exposure to the variability of future cash flows or other forecasted transactions. For cash flow hedge relationships, the effective portion of the gain or loss related to the derivative instrument is recognized as a component of other comprehensive income. Ineffectiveness is measured by comparing the change in fair value of the respective derivative instrument and the change in fair value of a “perfectly effective” hypothetical derivative instrument. Ineffectiveness will be recognized in earnings only if it results from an overhedge. The ineffective portion of the gain or loss related to the derivative instrument, if any, is recognized in earnings as other non-interest expense during the period of change. Amounts recorded in other comprehensive income are recognized in earnings in the period or periods during which the hedged item impacts earnings.
Amount of Gain(Loss) Reclassified from Accumulated OCI
into Income (Effective Portion) (2)
Location of Gain(Loss) Recognized in Income
on Derivatives (Ineffective Portion
and Amount Excluded from Effectiveness
Testing)
Amount of Gain(Loss) Recognized in Income
on Derivatives (Ineffective Portion and Amount Excluded from Effectiveness Testing)
(2) (In millions)
Interest rate swaps $ (87)
Interest income on loans
$ 189
Other non-interest expense $ 8
Forward starting swaps 8
Interest expense on debt
—
Other non-interest expense —
Interest rate options (25)
Interest income on loans
76
Interest income on loans —
Eurodollar futures (16)
Interest income on loans
30
Other non-interest expense 3
Total $ (120) $ 295 $ 11
(1) After-tax (2) Pre-tax
Table of Contents
Regions enters into interest rate swap agreements to manage overall cash flow changes related to interest rate risk exposure on LIBOR-based loans. The agreements effectively modify the Company’s exposure to interest rate risk by utilizing receive fixed/pay LIBOR interest rate swaps.
Regions issues long-term fixed-rate debt for various funding needs. Regions enters into receive LIBOR/pay-fixed forward starting swaps to hedge risks of changes in the projected quarterly interest payments attributable to changes in the benchmark interest rate (LIBOR) during the time leading up to the probable issuance date of the new long term fixed-rate debt.
Regions enters into interest rate option contracts to protect cash flows through the maturity date of the hedging instrument on designated one-month LIBOR floating-rate loans from adverse extreme market interest rate changes. Regions purchases Eurodollar futures to hedge the variability in future cash flows based on forecasted resets of one-month LIBOR-based floating rate loans due to changes in the benchmark interest rate. Regions realized an after-tax benefit of $47 million and $19 million in accumulated other comprehensive income at September 30, 2010 and 2009, respectively, related to terminated cash flow hedges of loan and debt instruments which will be amortized into earnings in conjunction with the recognition of interest payments through the beginning of 2012. Regions recognized pre-tax income of $25 million and $31 million during the first nine months of 2010 and 2009, respectively, related to the amortization of terminated cash flow hedges of loan and debt instruments.
At September 30, 2010, Regions expects to reclassify out of other comprehensive income and into earnings approximately $154 million in pre-tax income due to the receipt of interest payments on all cash flow hedges within the next twelve months. Of this amount, $64 million relates to the amortization of discontinued cash flow hedges. The maximum length of time over which Regions is hedging its exposure to the variability in future cash flows for forecasted transactions is approximately 2 years as of September 30, 2010.
The following table presents the notional value of fair value and cash flow hedges as of September 30, 2010 and December 31, 2009:
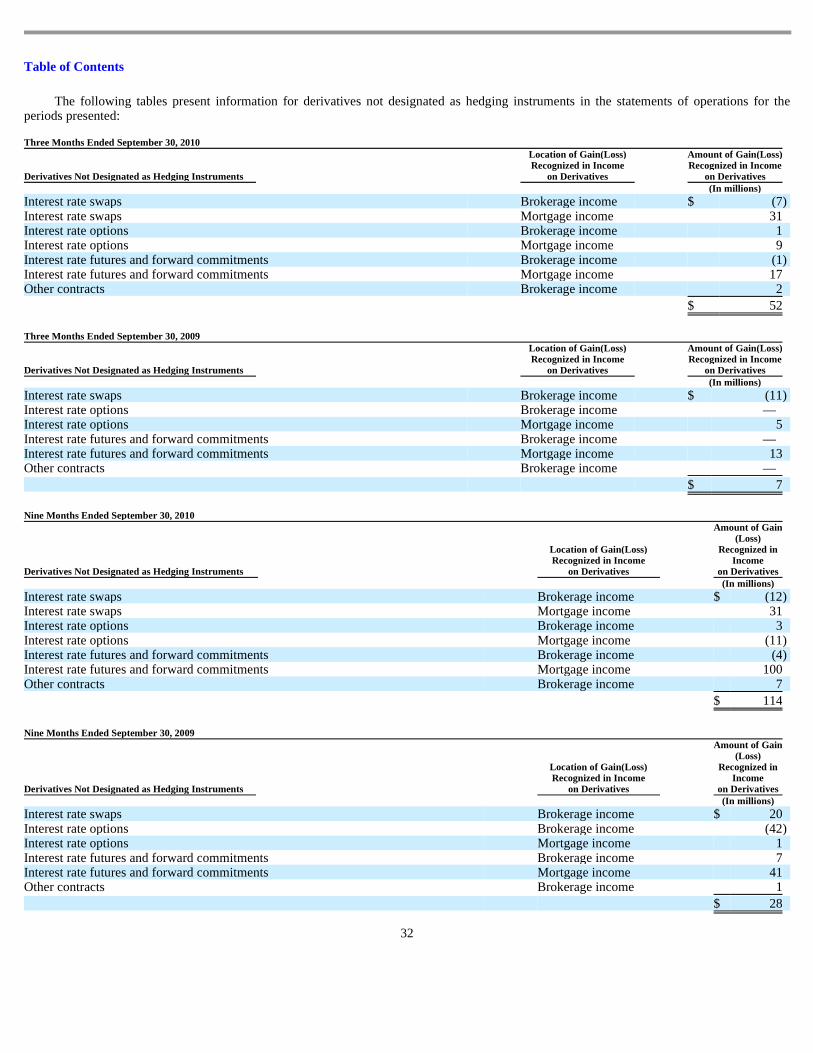
DERIVATIVES NOT DESIGNATED AS HEDGES
Derivative contracts that do not qualify for hedge accounting are classified as “trading” with gains and losses related to the change in fair value recognized in earnings during the period. These positions are used to mitigate economic and accounting volatility related to customer derivative transactions, as well as non-derivative instruments.
The Company maintains a derivatives trading portfolio of interest rate swaps, option contracts, and futures and forward commitments used to help customers mitigate market risk. The Company is subject to the credit risk that a counterparty will fail to perform. The Company is also subject to market risk, which is monitored by the
asset/liability management function and evaluated by the Company. Separate derivative contracts are entered into to reduce overall market exposure to pre-defined limits. The contracts in this portfolio do not qualify for hedge accounting and are marked-to-market through earnings and included in other assets and other liabilities. As of September 30, 2010 and 2009, the total absolute notional amount of the Company’s derivatives trading portfolio was $92.9 billion and $65.8 billion, respectively.
In the normal course of business, Morgan Keegan enters into underwriting and forward commitments on U.S. Government and municipal securities. As of September 30, 2010 and 2009, the contractual amounts of forward commitments was approximately $535 million and $256 million, respectively. The brokerage subsidiary typically settles its position by entering into equal but opposite contracts and, as such, the contract amounts do not necessarily represent future cash requirements. Settlement of the transactions relating to such commitments is not expected to have a material effect on the subsidiary’s financial position. Transactions involving future settlement give rise to market risk, which represents the potential loss that can be caused by a change in the market value of a particular financial instrument. The exposure to market risk is determined by a number of factors, including size, composition and diversification of positions held, the absolute and relative levels of interest rates, and market volatility.
Regions enters into interest rate lock commitments, which are commitments to originate mortgage loans whereby the interest rate on the loan is determined prior to funding and the customers have locked into that interest rate. Fair value is based on fees currently charged to enter into similar agreements and, for fixed-rate commitments, considers the difference between current levels of interest rates and the committed rates. As of September 30, 2010 and 2009, Regions had $1.2 billion and $669 million in notional amounts of interest rate lock commitments. Regions manages market risk on interest rate lock commitments and mortgage loans held for sale with corresponding forward sale commitments, which are recorded at fair value with changes in fair value recorded in mortgage income. As of September 30, 2010 and 2009, Regions had $2.1 billion and $1.3 billion in absolute notional amounts related to these forward rate commitments.
On January 1, 2009, Regions made an election to account for mortgage servicing rights at fair market value with any changes to fair value being recorded within mortgage income. Concurrent with the election to use the fair value measurement method, Regions began using various derivative instruments to mitigate the income statement effect of changes in the fair value of its mortgage servicing rights. Regions continues to use derivatives such as forward rate commitments, swaptions, interest rate swaps, and futures contracts to mitigate these fair value changes. Additionally, Regions has and may prospectively use marketable securities classified as trading assets to mitigate these changes. As of September 30, 2010 and 2009, the total notional amount related to these swaptions, interest rate swaps, forward rate commitments, and futures contracts was $1.4 billion and $1.8 billion, respectively.
31
Table of Contents
The following tables present information for derivatives not designated as hedging instruments in the statements of operations for the periods presented:
32
Three Months Ended September 30, 2010
Derivatives Not Designated as Hedging Instruments
Location of Gain(Loss) Recognized in Income
on Derivatives
Amount of Gain(Loss) Recognized in Income
on Derivatives (In millions)
Interest rate swaps Brokerage income $ (7 ) Interest rate swaps Mortgage income 31 Interest rate options Brokerage income 1 Interest rate options Mortgage income 9 Interest rate futures and forward commitments Brokerage income (1 ) Interest rate futures and forward commitments Mortgage income 17 Other contracts Brokerage income 2
$ 52
Three Months Ended September 30, 2009
Derivatives Not Designated as Hedging Instruments
Location of Gain(Loss) Recognized in Income
on Derivatives
Amount of Gain(Loss) Recognized in Income
on Derivatives (In millions)
Interest rate swaps Brokerage income $ (11 ) Interest rate options Brokerage income — Interest rate options Mortgage income 5 Interest rate futures and forward commitments Brokerage income — Interest rate futures and forward commitments Mortgage income 13 Other contracts Brokerage income —
$ 7
Nine Months Ended September 30, 2010
Derivatives Not Designated as Hedging Instruments
Location of Gain(Loss) Recognized in Income
on Derivatives
Amount of Gain(Loss)
Recognized in Income
on Derivatives (In millions)
Interest rate swaps Brokerage income $ (12 ) Interest rate swaps Mortgage income 31 Interest rate options Brokerage income 3 Interest rate options Mortgage income (11 ) Interest rate futures and forward commitments Brokerage income (4 ) Interest rate futures and forward commitments Mortgage income 100 Other contracts Brokerage income 7
$ 114
Nine Months Ended September 30, 2009
Derivatives Not Designated as Hedging Instruments
Location of Gain(Loss) Recognized in Income
on Derivatives
Amount of Gain(Loss)
Recognized in Income
on Derivatives (In millions)
Interest rate swaps Brokerage income $ 20 Interest rate options Brokerage income (42 ) Interest rate options Mortgage income 1 Interest rate futures and forward commitments Brokerage income 7 Interest rate futures and forward commitments Mortgage income 41 Other contracts Brokerage income 1
$ 28
Table of Contents
Credit risk, defined as all positive exposures not collateralized with cash or other liquid assets, at September 30, 2010 and 2009, totaled approximately $1.3 billion and $1.2 billion, respectively. This amount represents the net credit risk on all trading and other derivative positions held by Regions.
CREDIT DERIVATIVES
Regions has both bought and sold credit protection in the form of participations on interest rate swaps (swap participations). These swap participations, which meet the definition of credit derivatives, were entered into in the ordinary course of business to serve the credit needs of customers. Credit derivatives, whereby Regions has purchased credit protection, entitle Regions to receive a payment from the counterparty when the customer fails to make payment on any amounts due to Regions upon early termination of the swap transaction and have maturities between 2012 and 2026. Credit derivatives whereby Regions has sold credit protection have maturities between 2010 and 2016. For contracts where Regions sold credit protection, Regions would be required to make payment to the counterparty when the customer fails to make payment on any amounts due to the counterparty upon early termination of the swap transaction. Regions bases the current status of the prepayment/performance risk on bought and sold credit derivatives on recently issued internal risk ratings consistent with the risk management practices of unfunded commitments.
Regions’ maximum potential amount of future payments under these contracts is approximately $38 million. This scenario would only occur if variable interest rates were at zero percent and all counterparties defaulted with zero recovery. The fair value of sold protection at September 30, 2010 and 2009 was immaterial. In transactions where Regions has sold credit protection, recourse to collateral associated with the original swap transaction is available to offset some or all of Regions’ obligation.
CONTINGENT FEATURES
Certain Regions’ derivative instruments contain provisions that require Regions’ debt to maintain an investment grade credit rating from each of the major credit rating agencies. If Regions’ debt were to fall below investment grade, it would be in violation of these provisions, and the counterparties to the derivative instruments could request immediate payment or demand immediate and ongoing full overnight collateralization on derivative instruments in net liability positions. The aggregate fair value of all derivative instruments with credit-risk-related contingent features that are in a liability position on September 30, 2010 and December 31, 2009 was $647 million and $347 million, respectively, for which Regions had posted collateral of $637 million and $336 million, respectively, in the normal course of business. If the credit-risk-related contingent features underlying these agreements were triggered on September 30, 2010 and December 31, 2009 Regions would be required to post an additional $10 million and $11 million, respectively, of collateral to its counterparties.
NOTE 11—Fair Value Measurements
Fair value guidance establishes a framework for using fair value to measure assets and liabilities and defines fair value as the price that would be received to sell an asset or paid to transfer a liability (an exit price) as opposed to the price that would be paid to acquire the asset or received to assume the liability (an entry price). A fair value measure should reflect the assumptions that market participants would use in pricing the asset or liability, including the assumptions about the risk inherent in a particular valuation technique, the effect of a restriction on the sale or use of an asset and the risk of nonperformance. Required disclosures include stratification of balance sheet amounts measured at fair value based on inputs the Company uses to derive fair value measurements. These strata include:
33
• Level 1 valuations, where the valuation is based on quoted market prices for identical assets or liabilities traded in active markets
(which include exchanges and over-the-counter markets with sufficient volume),
• Level 2 valuations, where the valuation is based on quoted market prices for similar instruments traded in active markets, quoted
prices for identical or similar instruments in markets that are not active and model-based valuation techniques for which all significant assumptions are observable in the market, and
Table of Contents
ITEMS MEASURED AT FAIR VALUE ON A RECURRING BASIS
Trading account assets (net of certain short-term borrowings), securities available for sale, mortgage loans held for sale, mortgage servicing rights and derivatives were recorded at fair value on a recurring basis during 2010 and 2009. Below is a description of valuation methodologies for these assets and liabilities:
Trading account assets, net and securities available for sale primarily consist of U.S. Treasuries, obligations of states and political subdivisions, mortgage-backed securities (including agency securities), and equity securities. Trading account assets are presented net of short-sale liabilities which are valued based on the fair value of the underlying securities.
Mortgage loans held for sale consist of residential first mortgage loans held for sale that are valued based on traded market prices of similar assets where available and/or discounted cash flows at market interest rates, adjusted for securitization activities that include servicing value and market conditions, a Level 2 measurement. Regions has elected to measure mortgage loans held for sale at fair value by applying the fair value option (see additional discussion under the “Fair Value Option” section below).
Mortgage servicing rights consist of residential mortgage servicing rights and were valued using an option-adjusted spread valuation approach, a Level 3 measurement. See Note 9 “Loan Servicing” for additional details regarding assumptions relevant to this valuation.
Derivatives, net which primarily consist of interest rate contracts that include futures, options and swaps, are included in other assets and other liabilities (as applicable) on the consolidated balance sheets, and are presented in the tables below as a net amount. Interest rate swaps are predominantly traded in over-the-counter markets and, as such, values are determined using widely accepted discounted cash flow models, or Level 2 measurements. These discounted cash flow models use projections of future cash payments/receipts that are discounted at mid-market rates. The assumed cash flows are sourced from an assumed yield curve, which is consistent with industry standards and conventions. These valuations are adjusted for the unsecured credit risk at the reporting date, which considers collateral posted and the impact of master netting agreements. For exchange-traded options and futures contracts, values are based on quoted market prices, or Level 1 measurements. For all other options and futures contracts traded in over-the-counter markets, values are determined using discounted cash flow analyses and option pricing models based on market rates and volatilities, or Level 2 measurements.
34
• Level 3 valuations, where the valuation is generated from model-based techniques that use significant assumptions not observable in the market, but observable based on Company-specific data. These unobservable assumptions reflect the Company’s own estimates for assumptions that market participants would use in pricing the asset or liability. Valuation techniques typically include option pricing models, discounted cash flow models and similar techniques, but may also include the use of market prices of assets or liabilities that are not directly comparable to the subject asset or liability.
• U.S. Treasuries and mortgage-backed securities are valued primarily using data from third-party pricing services for similar securities
as applicable. Pricing from these third party services is generally based on quoted market prices of similar instruments (including matrix pricing); these valuations are Level 2 measurements.
• Obligations of states and political subdivisions are generally based on data from third party pricing services for similar securities (Level 2 measurements as described above). Where such comparable data is not available, the Company develops valuations based on assumptions that are not readily observable in the market place; these valuations are Level 3 measurements. For example, auction-rate securities fall into this category; for these instruments, internal pricing models assume converting the securities into fixed-rate debt securities with similar credit ratings and maturity dates based on management’s estimates of the term of the securities. Assumed terms generally fall within a range of one to four years.
• Equity securities are valued based on quoted market prices of identical assets on active exchanges; these valuations are Level 1
measurements.
Table of Contents
Interest rate lock commitments on loans intended for sale, treasury locks and credit derivatives are valued using option pricing models that incorporate significant unobservable inputs, and therefore are Level 3 measurements.
Regions rarely transfers assets and liabilities measured at fair value between Level 1 and Level 2 measurements. There were no such transfers during the three or nine months ended September 30, 2010 or 2009. Trading account assets are periodically transferred to or from Level 3 valuation based on management’s conclusion regarding the best method for pricing for an individual security. Such transfers are accounted for as if they occur at the beginning of a reporting period.
New accounting literature effective for 2010 financial reporting requires more granular levels of disclosure for fair value measurements. The new guidance does not require any changes to presentation of prior periods. The following tables present assets and liabilities measured at fair value on a recurring basis as of September 30, 2010 and 2009:
35
September 30, 2010
Level 1 Level 2 Level 3 Fair
Value (In millions)
Trading account assets, net (1)
U.S. Treasury securities $ — $ (221 ) $ — $ (221 ) Obligations of states and political subdivisions — 293 222 515 Mortgage-backed securities: —
Total trading account assets, net (1) $ 376 $ 559 $ 268 $ 1,203
Securities available for sale
U.S. Treasury securities $ 92 $ — $ — $ 92 Federal agency securities 25 16 — 41 Obligations of states and political subdivisions — 21 17 38 Mortgage-backed securities:
(1) Trading account assets are presented in the table above net of short-sale liabilities; accordingly, the total of the balances above are not in
agreement with trading account assets as shown on the balance sheet. (2) Derivatives include approximately $1.4 billion related to legally enforceable master netting agreements that allow the Company to settle
positive and negative positions. Derivatives, net are also presented excluding cash collateral received of $111 million and cash collateral posted of $637 million with counterparties.
Table of Contents
Assets and liabilities in all levels could result in volatile and material price fluctuations. Realized and unrealized gains and losses on Level 3 assets represent only a portion of the risk to market fluctuations in Regions’ consolidated balance sheets. Further, net trading account assets and net derivatives included in Levels 1, 2 and 3 are used by the Asset and Liability Management Committee of the Company in a holistic approach to managing price fluctuation risks.
The following tables illustrate a rollforward for all assets measured at fair value on a recurring basis using significant unobservable inputs (Level 3) for the three and nine months ended September 30, 2010 and 2009, respectively. The tables do not reflect the change in fair value attributable to any related economic hedges the Company used to mitigate the interest rate risk associated with these assets.
36
September 30, 2009
Level 1 Level 2 Level 3 Fair
Value (In millions)
Trading account assets, net $ 321 $ 456 $ 204 $ 981 Securities available for sale 256 20,687 87 21,030 Mortgage loans held for sale — 726 — 726 Mortgage servicing rights — — 216 216 Derivatives, net (1) — 649 12 661 (1) Derivatives include approximately $1.1 billion related to legally enforceable master netting agreements that allow the Company to settle
positive and negative positions. Derivative assets and liabilities are also presented excluding cash collateral received of $101 million and cash collateral posted of $403 million with counterparties.
Fair Value Measurements Using Significant Unobservable Inputs Three Months Ended September 30, 2010
(Level 3 measurements only) Trading account assets, net (1) Securities available for sale
Mortgage servicing
rights
Derivatives, net
Obligations of states and political
subdivisions Commercial agency MBS Other securities
(1) Brokerage income from trading account assets, net, primarily represents gains/(losses) on disposition, which inherently includes
commissions on security transactions during the period.
Table of Contents
The following tables detail the presentation of both realized and unrealized gains and losses recorded in earnings for Level 3 assets for the three and nine months ended September 30, 2010 and 2009, respectively:
38
Fair Value Measurements Significant Unobservable Inputs Nine Months Ended September 30, 2009
(Level 3 measurements only)
Trading account
assets, net (1)
Securities available for
sale
Mortgage
servicing rights
Derivatives,
net (In millions)
Beginning balance, January 1, 2009 $ 275 $ 95 $ 161 $ 55 Total gains (losses) realized and unrealized:
Included in earnings (1) (8 ) (15 ) (28 ) 34 Included in other comprehensive income — 20 — —
Purchases and issuances 60 — 83 — Settlements (100 ) (13 ) — (77 ) Transfers in and/or out of Level 3, net (23 ) — — —
(1) Brokerage income from trading account assets, net, primarily represents gains/(losses) on disposition, which inherently includes
commissions on security transactions during the period.
Total Gains and Losses (Level 3 measurements only)
Three Months Ended September 30, 2010
Trading account assets, net (1) Derivatives,
net
Obligations of states and political
subdivisions
Commercial agency MBS
Other securities
Mortgage servicing
rights Interest
rate options (In millions)
Classifications of gains (losses) both realized and unrealized included in earnings for the period:
Brokerage, investment banking and capital markets $ (4 ) $ 1 $ 10 $ — $ —
Mortgage income — — — (39 ) 46 Other comprehensive income — — — — —
Total realized and unrealized gains and (losses) $ (4 ) $ 1 $ 10 $ (39 ) $ 46
(1) Brokerage income from trading account assets, net, primarily represents gains/(losses) on disposition, which inherently includes
commissions on security transactions during the period.
Table of Contents
39
Total Gains and Losses (Level 3 measurements only)
Three Months Ended September 30, 2009
Trading account
assets, net (1)
Securities available for
sale
Mortgage servicing
rights Derivatives,
net (In millions)
Classifications of gains (losses) both realized and unrealized included in earnings for the period:
Brokerage, investment banking and capital markets $ (6 ) $ — $ — $ — Mortgage income — — (17 ) 31 Other income — — — —
Other comprehensive income — 16 — —
Total realized and unrealized gains and (losses) $ (6 ) $ 16 $ (17 ) $ 31
(1) Brokerage income from trading account assets, net, primarily represents gains/(losses) on disposition, which inherently includes
commissions on security transactions during the period.
Total Gains and Losses (Level 3 measurements only)
Nine Months Ended September 30, 2010
Trading account assets, net (1)
Securities available for sale
Derivatives, net
Obligations of states and political
subdivisions
Commercial agency MBS
Other securities
Obligations of states
and political
subdivisions
Mortgage servicing
rights Interest
rate options (In millions)
Classifications of gains (losses) both realized and unrealized included in earnings for the period:
Brokerage, investment banking and capital markets $ (7 ) $ 2 $ 22 $ — $ — $ —
Mortgage income — — — — (96 ) 106 Other comprehensive income — — — 5 — —
Total realized and unrealized gains and (losses) $ (7 ) $ 2 $ 22 $ 5 $ (96 ) $ 106
(1) Brokerage income from trading account assets, net, primarily represents gains/(losses) on disposition, which inherently includes
commissions on security transactions during the period.
Table of Contents
The following tables detail the presentation of only unrealized gains and losses recorded in earnings for Level 3 assets for the three and nine months ended September 30, 2010 and 2009, respectively:
40
Total Gains and Losses (Level 3 measurements only)
Nine Months Ended September 30, 2009
Trading account
assets, net (1)
Securities available for
sale
Mortgage servicing
rights Derivatives,
net (In millions)
Classifications of gains (losses) both realized and unrealized included in earnings for the period:
Brokerage, investment banking and capital markets $ (8 ) $ — $ — $ (35 ) Mortgage income — — (28 ) 69 Other income — (15 ) — —
Other comprehensive income — 20 — —
Total realized and unrealized gains and (losses) $ (8 ) $ 5 $ (28 ) $ 34
(1) Brokerage income from trading account assets, net, primarily represents gains/(losses) on disposition, which inherently includes
commissions on security transactions during the period.
Three Months Ended September 30, 2010
Derivatives,
net
Mortgage servicing
rights Interest
rate options (In millions)
The amount of total gains and losses for the period, included in earnings, attributable to the change in unrealized gains (losses) relating to assets and liabilities still held at September 30, 2010:
Mortgage income $ (31 ) $ 17 Other comprehensive income — —
Total unrealized gains and (losses) $ (31 ) $ 17
Three Months Ended September 30, 2009
Securities available for
sale
Mortgage servicing
rights Derivatives,
net (In millions)
The amount of total gains and losses for the period included in earnings, attributable to the change in unrealized gains (losses) relating to assets and liabilities still held at September 30, 2009:
Brokerage, investment banking and capital markets $ — $ — $ 31 Mortgage income — (11 ) — Other income — — —
Other comprehensive income 16 — —
Total unrealized gains and (losses) $ 16 $ (11 ) $ 31
Table of Contents
ITEMS MEASURED AT FAIR VALUE ON A NON-RECURRING BAS IS
From time to time, certain assets may be recorded at fair value on a non-recurring basis. These non-recurring fair value adjustments typically are a result of the application of lower of cost or fair value accounting or a write-down occurring during the period. For example, if the fair value of an asset in these categories falls below its cost basis, it is considered to be at fair value at the end of the period of the adjustment. In periods where there is no adjustment, the asset is generally not considered to be at fair value. The following is a description of the valuation methodologies used for certain assets that are recorded at fair value.
Foreclosed property and other real estate is carried in other assets at the lower of the recorded investment in the loan or fair value less estimated costs to sell the property. The fair value for foreclosed property that is based on either observable transactions of similar instruments or formally committed sale prices is classified as a Level 2 measurement. If no formally committed sale price is available, a professional valuation is obtained. Updated valuations are obtained on at least an annual basis. Foreclosed property exceeding established dollar thresholds are valued based on appraisals. Appraisals are performed by third-parties with appropriate professional certifications and conform to generally accepted appraisal standards as evidenced by the Uniform Standards of Professional Appraisal Practice (“USPAP”). Regions’ policies related to appraisals conform with regulations established by the Financial Institutions Reform, Recovery and Enforcement Act of 1989 (“FIRREA”) and other regulatory guidance. Professional valuations are considered Level 2 measurements because they are based largely on observable inputs. In some instances, management may decrease the estimate of fair value below the appraised value, given trends in valuation of similar properties. These valuations are considered Level 3 measurements as management uses assumptions not observable in the market.
41
Nine Months Ended September 30, 2010
Securities
available for sale Derivatives,
net
Obligations of states and political
subdivisions
Mortgage servicing
rights Interest
rate options (In millions)
The amount of total gains and losses for the period, included in earnings, attributable to the change in unrealized gains (losses) relating to assets and liabilities still held at September 30, 2010:
Mortgage income $ — $ (77 ) $ 17 Other comprehensive income 5 — —
Total unrealized gains and (losses) $ 5 $ (77 ) $ 17
Nine Months Ended September 30, 2009
Trading account
assets, net
Securities available for
sale
Mortgage servicing
rights Derivatives,
net (In millions)
The amount of total gains and losses for the period included in earnings, attributable to the change in unrealized gains (losses) relating to assets and liabilities still held at September 30, 2009:
Brokerage, investment banking and capital markets $ (3 ) $ — $ — $ 6 Mortgage income — — (2 ) 69 Other income — (15 ) — —
Other comprehensive income — 20 — —
Total unrealized gains and (losses) $ (3 ) $ 5 $ (2 ) $ 75
Table of Contents
Loans held for sale for which the fair value option has not been elected are recorded at the lower of cost or fair value and therefore are reported at fair value on a non-recurring basis. The fair values for loans held for sale that are based on formally committed loan sale prices or valuations performed using observable inputs are classified as a Level 2 measurement. If no formally committed sales price is available, a professional valuation is obtained, consistent with the process described above for foreclosed property and other real estate.
The following tables present the carrying value of those assets measured at fair value on a non-recurring basis as of September 30, 2010 and 2009, as well as the corresponding fair value adjustments.
FAIR VALUE OPTION
Regions elected the fair value option for residential mortgage loans held for sale originated after January 1, 2008. This election allows for a more effective offset of the changes in fair values of the loans and the derivative instruments used to economically hedge them without the burden of complying with the requirements for hedge accounting. Regions has not elected the fair value option for other loans held for sale primarily because they are not economically hedged using derivative instruments. Fair values of mortgage loans held for sale are based on traded market prices of similar assets where available and/or discounted cash flows at market interest rates, adjusted for securitization activities that include servicing values and market conditions, and were recorded in loans held for sale in the consolidated balance sheets.
The following table summarizes the difference between the aggregate fair value and the aggregate unpaid principal balance for mortgage loans held for sale measured at fair value:
42
Carrying Value as of September 30, 2010 Fair value
adjustments for the three months ended September 30, 2010 Level 1 Level 2 Level 3 Total
(In millions)
Loans held for sale $ — $ 266 $ — $ 266 $ (2 ) Foreclosed property and other real estate — 304 22 326 (67 )
Carrying Value as of September 30, 2009 Fair value
adjustments for the three months ended September 30, 2009 Level 1 Level 2 Level 3 Total
(In millions)
Loans held for sale $ — $ 132 $ 16 $ 148 $ (79 ) Foreclosed property and other real estate — 340 — 340 (78 )
September 30, 2010 December 31, 2009
Aggregate Fair
Value Aggregate Unpaid
Principal
Aggregate Fair Value
Less Aggregate Unpaid Principal
Aggregate Fair Value
Aggregate Unpaid Principal
Aggregate Fair Value Less Aggregate
Unpaid Principal (In millions)
Mortgage loans held for sale, at fair value $ 1,183 $ 1,151 $ 32 $ 780 $ 773 $ 7
Table of Contents
Interest income on mortgage loans held for sale is recognized based on contractual rates and is reflected in interest income on loans held for sale in the consolidated statements of operations. The following table details net gains (losses) resulting from changes in fair value of these loans which was recorded in mortgage income in the consolidated statements of operations during the three months and nine months ended September 2010 and 2009, respectively. These changes in fair value are mostly offset by economic hedging activities. An immaterial portion of these amounts was attributable to changes in instrument-specific credit risk.
FAIR VALUE OF FINANCIAL INSTRUMENTS
The methods and assumptions used by the Company in estimating fair values of financial instruments are disclosed in Regions’ Form 10-K for the year ended December 31, 2009. The carrying amounts and estimated fair values of the Company’s financial instruments as of September 30, 2010 and December 31, 2009 are as follows:
43
Mortgage loans held for sale, at fair value
Three Months Ended
September 30 Nine Months Ended
September 30 2010 2009 2010 2009 (In millions)
Net gains (losses) resulting from changes in fair value $ (3 ) $ 28 $ 24 $ 10
September 30, 2010 December 31, 2009
Carrying Amount
Estimated Fair
Value (1) Carrying Amount
Estimated Fair
Value (1) (In millions)
Financial assets:
Cash and cash equivalents $ 6,887 $ 6,887 $ 8,011 $ 8,011 Trading account assets 1,580 1,580 3,039 3,039 Securities available for sale 23,555 23,555 24,069 24,069 Securities held to maturity 26 28 31 31 Loans held for sale 1,587 1,587 1,511 1,511 Loans (excluding leases), net of unearned income and
allowance for loan losses (2), (3) 79,225 69,082 85,452 72,119 Other interest-earning assets 1,043 1,043 734 734 Derivatives, net 381 381 520 520
(1) Estimated fair values are consistent with an exit price concept. The assumptions used to estimate the fair values are intended to
approximate those that a market participant would use in a hypothetical orderly transaction. In estimating fair value, the Company makes adjustments for interest rates, market liquidity and credit spreads as appropriate.
(2) The estimated fair value of portfolio loans assumes sale of the loans to a third-party financial investor. Accordingly, the value to the Company if the loans were held to maturity is not reflected in the fair value estimate. In the current whole loan market, financial investors are generally requiring a higher rate of return than the return inherent in loans if held to maturity. The fair value discount at September 30, 2010 was $10.1 billion or 12.8%. The majority of the discount represents the higher rate of return required by financial investors.
(3) Excluded from this table is the lease carrying amount of $2.0 billion at September 30, 2010 and $2.1 billion at December 31, 2009, which approximates fair value.
Table of Contents
NOTE 12—Commitments and Contingencies
COMMERCIAL COMMITMENTS
Regions issues off-balance sheet financial instruments in connection with lending activities. The credit risk associated with these instruments is essentially the same as that involved in extending loans to customers and is subject to Regions’ normal credit approval policies and procedures. Regions measures inherent risk associated with these instruments by recording a reserve for unfunded commitments based on an assessment of the likelihood that the guarantee will be funded and the creditworthiness of the customer or counterparty. Collateral is obtained based on management’s assessment of the creditworthiness of the customer.
Credit risk associated with these instruments is represented by the contractual amounts indicated in the following table:
Unused commitments to extend credit —To accommodate the financial needs of its customers, Regions makes commitments under various terms to lend funds to consumers, businesses and other entities. These commitments include (among others) revolving credit agreements, term loan commitments and short-term borrowing agreements. Many of these loan commitments have fixed expiration dates or other termination clauses and may require payment of a fee. Since many of these commitments are expected to expire without being funded, the total commitment amounts do not necessarily represent future liquidity requirements.
Standby letters of credit —Standby letters of credit are also issued to customers, which commit Regions to make payments on behalf of customers if certain specified future events occur. Regions has recourse against the customer for any amount required to be paid to a third party under a standby letter of credit. Historically, a large percentage of standby letters of credit expired without being funded. The contractual amount of standby letters of credit represents the maximum potential amount of future payments Regions could be required to make and represents Regions’ maximum credit risk.
Commercial letters of credit —Commercial letters of credit are issued to facilitate foreign or domestic trade transactions for customers. As a general rule, drafts will be drawn when the goods underlying the transaction are in transit.
LEGAL
Regions and its affiliates are subject to litigation and claims arising in the ordinary course of business. Punitive damages are routinely claimed in these cases. Regions continues to be concerned about the general trend in litigation involving large damage awards against financial service company defendants. Regions evaluates these contingencies based on information currently available, including advice of counsel and assessment of available insurance coverage. Although it is not possible to predict the ultimate resolution or financial liability
44
September 30
2010
December 31
2009
September 30
2009 (In millions)
Unused commitments to extend credit $ 31,649 $ 31,008 $ 31,993 Standby letters of credit 3,956 4,610 5,859 Commercial letters of credit 44 30 14 Liabilities associated with standby letters of credit 76 119 88 Assets associated with standby letters of credit 74 114 82 Reserve for unfunded credit commitments 71 74 63
Table of Contents
with respect to these litigation contingencies, management is currently of the opinion that the outcome of pending and threatened litigation would not have a material effect on Regions’ business, consolidated financial position or results of operations, except to the extent indicated in the discussion below.
Regions and certain of its affiliates have been named in class-action lawsuits filed in federal and state courts on behalf of investors who purchased shares of certain Regions Morgan Keegan Select Funds (the “Funds”) and shareholders of Regions. The Funds were formerly managed by Morgan Asset Management, Inc. (“Morgan Asset Management”). Morgan Asset Management no longer manages these Funds, which were transferred to Hyperion Brookfield Asset Management in 2008. Certain of the funds have since been terminated by Hyperion. The complaints contain various allegations, including claims that the Funds and the defendants misrepresented or failed to disclose material facts relating to the activities of the Funds. No class has been certified and at this stage of the lawsuits Regions cannot determine the probability of a material adverse result or reasonably estimate a range of potential exposures, if any. However, it is possible that an adverse resolution of these matters may be material to Regions’ business, consolidated financial position or results of operations.
Certain of the shareholders in these Funds and other interested parties have entered into arbitration proceedings and individual civil claims, in lieu of participating in the class actions. Although it is not possible to predict the ultimate resolution or financial liability with respect to these contingencies, management is currently of the opinion that the outcome of these proceedings will not have a material effect on Regions’business, consolidated financial position or results of operations.
On April 7, 2010, the Securities and Exchange Commission (“SEC”), the Financial Industry Regulatory Authority (“FINRA”) and a joint state task force of securities regulators from Alabama, Kentucky, Mississippi, and South Carolina (“Task Force”) announced that they were commencing administrative proceedings against Morgan Keegan, Morgan Asset Management and certain of their employees for violations of federal and state securities laws and NASD rules relating to the Funds. The proceedings contain various allegations, including that the net asset values of the Funds were artificially inflated due to allegedly improper conduct related to the valuation of the securities held by the Funds, and that the defendants failed to disclose certain risks associated with the Funds. The administrative proceedings seek civil penalties, injunctive relief, disgorgement, rescission and other relief. Based on the then current status of settlement negotiations, Regions believed that a loss on this matter was probable and reasonably estimable. Accordingly, during the quarter ended June 30, 2010, Morgan Keegan recorded a non-tax deductible $200 million charge representing the estimate of probable loss. Settlement negotiations and hearing preparations are ongoing.
On July 21, 2009, the SEC filed a complaint in U.S. District Court for the Northern District of Georgia against Morgan Keegan alleging violations of the federal securities laws in connection with auction rate securities (“ARS”) that Morgan Keegan underwrote, marketed and sold. The SEC is seeking an injunction against Morgan Keegan for violations of the antifraud provisions of the federal securities laws, as well as disgorgement, financial penalties and other equitable relief for customers, including repurchase by Morgan Keegan of all ARS that it sold prior to March 20, 2008. Beginning in February 2009, Morgan Keegan commenced a voluntary program to repurchase ARS that it underwrote and sold to the firm’s customers, and extended that repurchase program on October 1, 2009 to include ARS that were sold by Morgan Keegan to its customers but were underwritten by other firms. As of September 30, 2010, customers of Morgan Keegan owned approximately $61 million of ARS and Morgan Keegan held approximately $217 million of ARS on its balance sheet. On July 21, 2009, the Alabama Securities Commission issued a “Show Cause” order to Morgan Keegan arising out of the ARS matter that is the subject of the SEC complaint described above. The order requires Morgan Keegan to show cause why its registration as a broker-dealer should not be suspended or revoked in the State of Alabama and also why it should not be subject to disgorgement, repurchasing all ARS sold to Alabama residents and payment of costs and penalties. Although it is not possible to predict the ultimate resolution or financial liability with respect to the ARS matter, management is currently of the opinion that the outcome of this matter will not have a material effect on Regions’ business, consolidated financial position or results of operations.
45
Table of Contents
In April 2009, Regions, Regions Financing Trust III (the “Trust”) and certain of Regions’ current and former directors, were named in a purported class-action lawsuit filed in the U.S. District Court for the Southern District of New York on behalf of the purchasers of trust preferred securities offered by the Trust. The complaint alleges that defendants made statements in Regions’ registration statement, prospectus and year-end filings which were materially false and misleading. On May 10, 2010, the trial court dismissed all claims against all defendants in this case. However, the plaintiffs have appealed the decision. In October 2010, a separate purported class-action lawsuit was filed by Regions’stockholders in the U.S. District Court for the Northern District of Alabama against Regions and certain former officers of Regions. The lawsuit alleges violations of the federal securities laws based on alleged actions similar to those that were the basis for the suit filed by purchasers of the trust preferred securities, including allegations that statements that were materially false and misleading were included in filings made with the SEC. Although it is not possible to predict the ultimate resolution or financial liability with respect to these matters, management is currently of the opinion that the outcome of these matters will not have a material effect on Regions’ business, consolidated financial position or results of operations.
In December 2009, Regions and certain current and former directors and officers were named in a consolidated shareholder derivative action filed in Jefferson County, Alabama. The complaint alleges mismanagement, waste of corporate assets, breach of fiduciary duty and unjust enrichment relating to bonuses and other benefits received by executive management. Although it is not possible to predict the ultimate resolution or financial liability with respect to this matter, management is currently of the opinion that the outcome of this matter will not have a material effect on Regions’ business, consolidated financial position or results of operations.
In September 2009, Regions was named as a defendant in a purported class-action lawsuit filed by customers of Regions Bank in the U.S. District Court for the Northern District of Georgia challenging the manner in which non-sufficient funds (NSF) and overdraft fees were charged and the policies related to posting order. The case was transferred to multidistrict litigation in the U.S. District Court for the Southern District of Florida, and in May 2010 an order to compel arbitration was denied. In July 2010, a separate class action was filed in the Circuit Court of Greene County Missouri, making a claim under Missouri’s consumer protection statute. The case has been removed to the U.S. District Court for the Western District of Missouri. Neither class has been certified and at this stage of the lawsuits, Regions cannot determine the probability of a material adverse result or reasonably estimate a range of potential exposures, if any. However, it is possible that adverse resolutions of these matters may be material to Regions’ business, consolidated financial position or results of operations.
NOTE 13—Recent Accounting Pronouncements
In July 2010, the FASB issued accounting guidance related to disclosures about the credit quality of financing receivables and the allowance for credit losses. The amended guidance applies to all financing receivables except for short-term trade receivables and receivables measured at either fair value or the lower of cost or fair value. The objective of the amendment is disclosure of information that enables financial statement users to understand the nature of inherent credit risks, the entity’s method of analysis and assessment of credit risk in estimating the allowance for credit losses, and the reasons for changes in both the receivables and allowances when examining a creditor’s portfolio of financing receivables and its allowance for losses. Under the new guidance, the disaggregation of financing receivables will be disclosed by portfolio segment or by class of financing receivable. The amended guidance is applicable to period-end balances beginning with the first interim or annual reporting period ending on or after December 15, 2010. The adoption of this guidance is not expected to have a material impact to the consolidated financial statements.
46
Table of Contents
INTRODUCTION
The following discussion and analysis is part of Regions Financial Corporation’s (“Regions” or the “Company”) Quarterly Report on Form 10-Q to the Securities and Exchange Commission (“SEC”) and updates Regions’ Form 10-K for the year ended December 31, 2009, which was previously filed with the SEC. This financial information is presented to aid in understanding Regions’ financial position and results of operations and should be read together with the financial information contained in the Form 10-K. Certain prior period amounts presented in this discussion and analysis have been reclassified to conform to current period classifications, except as otherwise noted. The emphasis of this discussion will be on the three and nine months ended September 30, 2010 compared to the three and nine months ended September 30, 2009 for the statement of operations. For the balance sheet, the emphasis of this discussion will be the balances as of September 30, 2010 compared to December 31, 2009.
This discussion and analysis contains statements that may be considered “forward-looking statements” as defined in the Private Securities Litigation Reform Act of 1995. See pages 3 and 4 for additional information regarding forward-looking statements.
CORPORATE PROFILE
Regions is a financial holding company headquartered in Birmingham, Alabama, which operates in the South, Midwest and Texas. Regions provides traditional commercial, retail and mortgage banking services, as well as other financial services in the fields of investment banking, asset management, trust, securities brokerage, insurance and other specialty financing.
Regions conducts its banking operations through Regions Bank, an Alabama chartered commercial bank that is a member of the Federal Reserve System. At September 30, 2010, Regions operated approximately 1,774 total branch outlets in Alabama, Arkansas, Florida, Georgia, Illinois, Indiana, Iowa, Kentucky, Louisiana, Mississippi, Missouri, North Carolina, South Carolina, Tennessee, Texas and Virginia. Regions provides brokerage services and investment banking from approximately 329 offices of Morgan Keegan & Company, Inc. (“Morgan Keegan”), a full-service regional brokerage and investment banking firm. Regions provides full-line insurance brokerage services primarily through Regions Insurance, Inc.
Regions’ profitability, like that of many other financial institutions, is dependent on its ability to generate revenue from net interest income and non-interest income sources. Net interest income is the difference between the interest income Regions receives on interest-earning assets, such as loans and securities, and the interest expense Regions pays on interest-bearing liabilities, principally deposits and borrowings. Regions’net interest income is impacted by the size and mix of its balance sheet components and the interest rate spread between interest earned on its assets and interest paid on its liabilities. Non-interest income includes fees from service charges on deposit accounts, securities brokerage, investment banking and trust activities, mortgage servicing and secondary marketing, insurance activities, and other customer services which Regions provides. Results of operations are also affected by the provision for loan losses and non-interest expenses, such as salaries and employee benefits, occupancy and other operating expenses, as well as income taxes.
Economic conditions, competition, new legislation and related rules impacting regulation of the financial services industry, and the monetary and fiscal policies of the Federal government significantly affect most financial institutions, including Regions. Lending and deposit activities and fee income generation are influenced by levels of business spending and investment, consumer income, consumer spending and savings, capital market activities, and competition among financial institutions, as well as customer preferences, interest rate conditions and prevailing market rates on competing products in Regions’ market areas.
Regions’ business strategy has been and continues to be focused on providing a competitive mix of products and services, delivering quality customer service and maintaining a branch distribution network with offices in
47
Item 2. Management’s Discussion and Analysis of Financial Condition and Results of Operations
Table of Contents
convenient locations. Regions delivers this business strategy with the personal attention and feel of a community bank and with the service and product offerings of a large regional bank.
THIRD QUARTER HIGHLIGHTS
Regions reported a net loss available to common shareholders of $209 million, or $0.17 loss per diluted share in the third quarter of 2010, compared to a net loss available to common shareholders of $437 million, or $0.37 loss per diluted share in the third quarter of 2009. During the third quarter of 2010, Regions recorded a $760 million provision for loan losses, $265 million lower than the third quarter of 2009. The decrease in provision for loan losses was the primary driver of the improvement in operations from the prior year period. However, credit costs continue to be elevated, reflecting an economy that remains under pressure. Maturities of higher-rate certificates of deposits and lower deposit pricing drove the net interest margin to 2.96 percent for the third quarter of 2010, a 23 basis point improvement over the third quarter of 2009.
Net interest income on a fully taxable-equivalent basis for the third quarter of 2010 was $876 million compared to $853 million in the third quarter of 2009. Improved deposit pricing, as evidenced by a decline in deposit costs from 1.26 percent to 0.70 percent, as well as a favorable mix shift to lower cost products, drove the improvement.
Net charge-offs totaled $759 million, or an annualized 3.52 percent of average loans, in the third quarter of 2010, compared to $680 million, or an annualized 2.86 percent for the third quarter of 2009. Charge-offs were higher across most major categories when comparing the 2010 period to the prior year period, with investor real estate representing the most significant driver of the increase. Increased charge-offs reflect the impact of opportunistic asset dispositions. The provision for loan losses totaled $760 million in the third quarter of 2010 compared to $1.025 billion during the third quarter of 2009. The allowance for loan losses at September 30, 2010 was 3.77 percent of total loans, net of unearned income, compared to 3.43 percent at December 31, 2009 and 2.83 percent at September 30, 2009. Total non-performing assets, excluding loans held for sale, at September 30, 2010 were $3.8 billion, compared to $4.1 billion at December 31, 2009 and $3.7 billion at September 30, 2009.
Non-interest income for the third quarter of 2010 decreased by $22 million compared to the third quarter of 2009. The impact of policy changes and changes related to Regulation E on service charges on deposit accounts contributed to the decrease. Service charges will be negatively impacted going forward due to these changes. Lower mortgage income, resulting from market valuation adjustments for mortgage servicing rights and related derivatives, also drove the year-over-year decrease.
Total non-interest expense was $1.2 billion in the third quarter of 2010, an $80 million decrease from the third quarter of 2009. The 2009 period included approximately $41 million related to branch consolidation costs. Lower professional and legal fees also contributed to the year-over-year decrease.
The Company continues to closely monitor the impact of the oil spill in the Gulf of Mexico on Regions’ customer base. Regions estimates the maximum loss potential is approximately $20 million.
The Dodd-Frank Wall Street Reform and Consumer Protection Act (“Dodd-Frank Act”) which was signed into law on July 21, 2010 provides some level of clarity regarding how the industry and Regions’ specific business will be affected moving forward. However, provisions in the Dodd-Frank Act remain subject to regulatory rule-making and implementation, and it will be some time before the business implications are completely defined. For example, the Durbin amendment authorizes the Federal Reserve to regulate interchange fees and network charges in connection with debit card transactions, and the impact of this provision on the Company’s annual interchange revenue stream is not currently defined. Non-interest expenses (e.g., FDIC insurance premiums, compliance costs, and other regulatory fees) could also be pressured by provisions included in the legislation. Additionally, trust preferred securities will be phased out as an allowable component of Tier 1 capital over a three-year period beginning in 2013.
48
Table of Contents
On September 12, 2010, the Group of Governors and Heads of Supervisors of the Basel Committee on Banking Supervision published its “calibrated” capital standards for major banking institutions (“Basel III”). Regions is evaluating the anticipated impact of Basel III. The Company’s Tier 1 Common ratio is currently 7.6 percent, above the Basel III minimum 7 percent guideline. Regions’ Tier 1 Capital ratio is currently 12.1 percent, above the Basel III minimum 8.5 percent guideline. Regions also expects to meet the Basel III liquidity requirements in its current form. However, there is still need for some clarification of the Basel III rules and implementation by U.S. banking regulators, so the ultimate impact on Regions is not completely known at this point. See the “Risk Factors” section of this Form 10-Q for more information.
TOTAL ASSETS
Regions’ total assets at September 30, 2010 were $133.5 billion, compared to $142.3 billion at December 31, 2009. The decrease in total assets from year-end 2009 resulted primarily from decreases in the loan portfolio, a product of weak demand as well as strategic decisions to reduce the concentration in investor real estate loans. Lower interest-bearing deposits in other banks also contributed to the decrease.
LOANS
At September 30, 2010 and December 31, 2009, loans represented 72 percent of Regions’ interest-earning assets. The following table presents the distribution by loan type of Regions’ loan portfolio, net of unearned income:
Table 1—Loan Portfolio
Loans, net of unearned income, totaled $84.4 billion at September 30, 2010, a decrease of $6.3 billion from year-end 2009 levels. Strategic decisions to reduce the concentration in investor real estate were the primary contributor to the decrease. All other categories also decreased from year-end reflecting continued overall weak loan demand. However, commercial and industrial increased $405 million from June 30, 2010 as a result of growth experienced in certain specialty lending groups such as healthcare and energy in the Texas, Tennessee and Georgia markets.
CREDIT QUALITY
Weak economic conditions, including declining property values and high levels of unemployment, impacted the credit quality of Regions’loan portfolio. Investor real estate loans and home equity products (particularly, Florida second lien) carry a higher risk of non-collection than other loans.
49
September 30
2010
December 31
2009
September 30
2009 (In millions, net of unearned income)
Commercial and industrial $ 21,501 $ 21,547 $ 21,925 Commercial real estate mortgage—owner occupied 11,850 12,054 12,103 Commercial real estate construction—owner occupied 522 751 875
Total commercial 33,873 34,352 34,903 Commercial investor real estate mortgage 14,489 16,109 16,190 Commercial investor real estate construction 2,975 5,591 6,616
Total investor real estate 17,464 21,700 22,806 Residential first mortgage 15,723 15,632 15,513 Home equity 14,534 15,381 15,630 Indirect 1,657 2,452 2,755 Other consumer 1,169 1,157 1,147
Total consumer 33,083 34,622 35,045
$ 84,420 $ 90,674 $ 92,754
Table of Contents
The following chart presents details of Regions’ $17.5 billion investor real estate portfolio as of September 30, 2010 (dollars in billions):
LAND, SINGLE-FAMILY, AND CONDOMINIUM
Beginning in late 2007, the land, single-family, and condominium components of the investor real estate portfolio came under significant pressure. Credit quality of the investor real estate portfolio is sensitive to risks associated with construction loans such as cost overruns, project completion risk, general contractor credit risk, environmental and other hazard risks, and market risks associated with the sale or rental of completed properties. While losses within these loan types were influenced by conditions described above, the most significant drivers of losses were the continued decline in demand for residential real estate and in the value of property. Beginning in 2008 and continuing through 2010, Regions has strategically reduced exposures in these product types through pro-active workouts, appropriate charge-offs, and asset dispositions as detailed in Table 2 below. In the third quarter of 2010, Regions executed a bulk sale of nonperforming assets which totaled $350 million. Non-accrual portfolio loans secured predominantly by land represented approximately $200 million of the sale, with the remaining amount primarily comprised of foreclosed property and loans held for sale. Accordingly, this transaction contributed to the decrease in non-accruing loans in the land table below.
The following table presents credit metrics for land, single-family and condominium loans:
Table 2—Land, Single-Family and Condominium
50
September 30
2010
December 31
2009
September 30
2009 (In millions, net of unearned income)
Land
Loan balance $ 1,889 $ 2,979 $ 3,362 Accruing loans 90 days past due 1 16 17 Non-accruing loans 489 724 713
September 30
2010
December 31
2009
September 30
2009 (In millions, net of unearned income)
Single-Family
Loan balance $ 1,402 $ 2,083 $ 2,344 Accruing loans 90 days past due 2 7 6 Non-accruing loans 341 545 483
Table of Contents
MULTI-FAMILY AND RETAIL
Beginning in 2009, multi-family and retail loans experienced increased pressure and contributed to increases in non-accrual loans. Continued weak economic conditions impacted demand for products and services in these sectors. Lower demand impacted cash flows generated by these properties, leading to a higher rate of non-collection. The geographic diversity of Regions’ exposure tends to mitigate the risk of non-collection.
The following table presents credit metrics and geographic distribution for multi-family and retail loans:
Table 3—Multi-family and Retail
HOME EQUITY PORTFOLIO
The home equity portfolio totaled $14.5 billion at September 30, 2010 as compared to $15.6 billion at September 30, 2009. Losses in this portfolio generally track overall economic conditions. The main source of economic stress has been in Florida, where residential property values have declined significantly while unemployment rates have risen to historically high levels. Losses on relationships in Florida where Regions is in a second lien position are higher than first lien losses.
The Company calculated an estimate of the current value of property secured as collateral for home equity lending products (“current LTV”). The estimate is based on home price indices compiled by the Federal Housing
51
September 30
2010
December 31
2009
September 30
2009 (In millions, net of unearned income)
Condominium
Loan balance $ 359 $ 586 $ 677 Accruing loans 90 days past due — — — Non-accruing loans 132 184 231
September 30
2010 (1)
December 31
2009
September 30
2009 (In millions, net of unearned income)
Multi -family
Loan balance $ 4,569 $ 5,049 $ 5,147 Accruing loans 90 days past due — 1 5 Non-accruing loans 242 113 190
(1) The majority of the September 30, 2010 balance related to multi-family loans is geographically distributed throughout the following areas:
Texas 21%, Florida 14%, Georgia 9%, Tennessee 8%, Louisiana 7% and North Carolina 6%. All other states, none of which comprise more than 5%, make up the remainder of the balance.
September 30
2010 (1)
December 31
2009
September 30
2009 (In millions, net of unearned income)
Retail
Loan balance $ 3,389 $ 4,120 $ 4,270 Accruing loans 90 days past due — 4 — Non-accruing loans 265 288 258
(1) The majority of the September 30, 2010 balance related to retail loans is geographically distributed throughout the following areas: Florida
23%, Texas 14%, Georgia 9%, Alabama 9%, Tennessee 8% and North Carolina 6%. All other states, none of which comprise more than 5%, make up the remainder of the balance.
Table of Contents
Finance Agency (“FHFA”). The FHFA data indicates trends for Metropolitan Statistical Areas (“MSA”). Regions uses the FHFA valuation trends from the MSA’s in the Company’s footprint in its estimate. The trend data is applied to the loan portfolios taking into account the age of the most recent valuation and geographic area. At September 30, 2010, the Company estimates that the number of home equity loans where the current LTV exceeded 100 was approximately 8.5 percent, while approximately 14.8 percent of the outstanding balances of home equity loans had a current LTV greater than 100. If the home equity loan is in a second lien position, the first lien has also been considered in the analysis. If the first lien position is with another institution, the Company uses the first lien outstanding balance at the time the second lien was originated.
The following tables provide details related to the home equity portfolio as follows:
Table 4—Selected Home Equity Portfolio Information
Net charge-offs were an annualized 2.89 percent of home equity loans for the first nine months of 2010 compared to an annualized 2.54 percent through the first nine months of 2009. Losses in Florida-based credits remained at elevated levels, as unemployment levels remain high and property valuations in certain markets have continued to experience ongoing deterioration. As illustrated in Table 4 “Selected Home Equity Portfolio Information,” these loans and lines in Florida represent approximately $5.3 billion of Regions’ total home equity portfolio at September 30, 2010. Of that balance, approximately $2.1 billion represent first liens, while second liens, which total $3.2 billion, are the main source of losses. Florida second lien losses were 7.32 percent annualized through the first nine months of 2010 as compared to 6.80 percent for the same period of 2009. Through the first nine months of 2010, home equity losses in Florida amounted to an annualized 5.57 percent of loans and lines versus 1.33 percent across the remainder of Regions’ footprint. This compares to the first nine months of 2009 losses of 5.23 percent and 1.00 percent, respectively.
OTHER CREDIT QUALITY MATTERS
Regions does not have any option adjustable rate mortgage (“ARM”) products, loans with initial teaser rates or other higher-risk residential loans. As of September 30, 2010, Regions has approximately $53 million in book value of “sub-prime” loans retained from the disposition of EquiFirst in 2007, down from the year-end 2009 balance of $61 million. The credit loss exposure related to these loans is addressed in management’s periodic determination of the allowance for credit losses.
Using the same methodology described in the above discussion of home equity loans, at September 30, 2010, the Company estimates that the number of residential first mortgage loans where the current LTV exceeded 100 was approximately 4.8 percent, while approximately 10.6 percent of the outstanding balances of residential first mortgage loans had a current LTV greater than 100.
52
As of and for the Nine Months Ended September 30, 2010 Florida All Other States Total (Dollars in millions) 1st Lien 2nd Lien Total 1st Lien 2nd Lien Total 1st Lien 2nd Lien Total
As of and for the Nine Months Ended September 30, 2009 Florida All Other States Total (Dollars in millions) 1st Lien 2nd Lien Total 1st Lien 2nd Lien Total 1st Lien 2nd Lien Total
Balance $ 2,181 $ 3,570 $ 5,751 $ 4,451 $ 5,428 $ 9,879 $ 6,632 $ 8,998 $ 15,630 Net Charge-offs 42 184 226 19 57 76 61 241 302 Net Charge-off % (1) 2.59 % 6.80 % 5.23 % 0.57 % 1.36 % 1.00 % 1.22 % 3.50 % 2.54 % (1) Net charge-off percentages are calculated on an annualized basis as a percent of average balances.
Table of Contents
Regions’ recourse liability, which primarily relates to residential mortgage loans, totaled $32 million and $30 million at September 30, 2010 and December 31, 2009, respectively. During the nine months ended September 30, 2010, $14 million of provision expense (included in non-interest expense) was recorded and $12 million was charged-off against the reserve. The recourse liability represents Regions’ estimated credit losses on contingent repurchases of loans or make-whole payments related to residential mortgage loans previously sold. This recourse arises when debtors fail to pay for an initial period of time after the loan is sold or due to defects in the underwriting of the sold loans.
ALLOWANCE FOR CREDIT LOSSES
The allowance for credit losses represents management’s estimate of credit losses inherent in the portfolio as of year-end. The allowance for credit losses consists of two components: the allowance for loan losses and the reserve for unfunded credit commitments. Management’s assessment of the adequacy of the allowance for credit losses is based on a combination of both of these components. Regions determines its allowance for credit losses in accordance with applicable accounting literature as well as regulatory guidance related to receivables and contingencies. Binding unfunded credit commitments include items such as letters of credit, financial guarantees and binding unfunded loan commitments.
Factors considered by management in determining the adequacy of the allowance include, but are not limited to: (1) detailed reviews of individual loans; (2) historical and current trends in gross and net loan charge-offs for the various portfolio segments evaluated; (3) the Company’s policies relating to delinquent loans and charge-offs; (4) the level of the allowance in relation to total loans and to historical loss levels; (5) levels and trends in non-performing and past due loans; (6) collateral values of properties securing loans; (7) the composition of the loan portfolio, including unfunded credit commitments; (8) management’s analysis of current economic conditions; (9) migration of loans between risk rating categories; and (10) estimation of inherent credit losses in the portfolio. In support of collateral values, Regions obtains updated valuations for non-performing loans on at least an annual basis.
Credit Review, Commercial and Consumer Credit Risk Management, and Special Assets are all involved in the credit risk management process to assess the accuracy of risk ratings, the quality of the portfolio and the estimation of inherent credit losses in the loan portfolio. This comprehensive process also assists in the prompt identification of problem credits. The Company has taken a number of measures to manage the portfolios and mitigate losses, particularly in the more problematic portfolios. In addition, a strong consumer Customer Assistance Program (“CAP”) is in place which educates customers about options and initiates early contact with customers to discuss solutions when a consumer loan first becomes delinquent.
For the majority of the loan portfolio, management uses information from its ongoing review processes to stratify the loan portfolio into pools sharing common risk characteristics. Loans that share common risk characteristics are assigned a portion of the allowance for credit losses based on the assessment process described above. Credit exposures are categorized by type and assigned estimated amounts of inherent loss based on several factors, including current and historical loss experience for each pool and management’s judgment of current economic conditions and their expected impact on credit performance. Adjustments to the allowance for credit losses calculated using a pooled approach are recorded through the provision for loan losses.
As a matter of business practice, Regions may require some form of credit support, such as a guarantee. Guarantees are legally binding and simultaneous with the primary loan agreements. Regions underwrites the ability of each guarantor to perform under its guarantee in the same manner and to the same extent as would be required to underwrite the repayment plan of a direct obligor. This entails obtaining sufficient information on the guarantor, including financial and operating information, to sufficiently measure a guarantor’s ability to perform, under the guarantee. However, the benefit assigned to credit support within the calculation of the allowance for credit losses is not material to the consolidated financial statements.
53
Table of Contents
The allowance for loan losses totaled $3.2 billion at September 30, 2010, $3.1 billion at December 31, 2009 and $2.6 billion at September 30, 2009. The allowance for loan losses as a percentage of net loans was 3.77 percent at September 30, 2010 compared to 3.43 percent at December 31, 2009 and 2.83 percent at September 30, 2009. The reserve for unfunded credit commitments was $71 million at September 30, 2010 compared to $74 million at December 31, 2009 and $63 million at September 30, 2009. The increase in the allowance for loan losses from December 31, 2009, was attributable to losses incurred in the commercial, investor real estate (primarily land, retail and multi-family), residential first mortgage, and home equity lending portfolios. Non-performing loans, excluding loans held for sale, decreased $116 million from December 31, 2009. As compared to June 30, 2010, total non-performing loans, excluding loans held for sale, decreased $101 million. However, gross inflows to non-performing loans increased during the third quarter of 2010 as compared to the previous quarters, reflecting the slow pace of economic recovery. Importantly, an increasing and substantial portion of new non-performing loan inflows was attributable to loans that are currently paying as agreed, but have been classified as non-performing due to concerns regarding borrowers’willingness and/or ability to meet contractually due principal and interest.
Net charge-offs as a percentage of average loans (annualized) were 3.22 percent and 2.19 percent in the first nine months of 2010 and 2009, respectively. Charge-off ratios were higher across all major categories, period over period. Investor real estate losses were the largest contributor, reflecting increased charge-offs in the land, single-family and retail components of investor real estate. Increased charge-offs reflect the impact of opportunistic asset dispositions.
Management considers the current level of allowance for credit losses adequate to absorb losses inherent in the loan portfolio and unfunded commitments. Management’s determination of the adequacy of the allowance for credit losses, which is based on the factors and risk identification procedures previously discussed, requires the use of judgments and estimations that may change in the future. Changes in the factors used by management to determine the adequacy of the allowance or the availability of new information could cause the allowance for credit losses to be increased or decreased in future periods. In addition, bank regulatory agencies, as part of their examination process, may require changes in the level of the allowance based on their judgments and estimates.
Given current economic pressures, management expects that net loan charge-offs for all portfolios will continue at an elevated level during 2010. Details regarding the allowance and net charge-offs, including an analysis of activity from the previous year’s totals, are included in Table 5 “Allowance for Credit Losses.”
54
Table of Contents
Activity in the allowance for credit losses is summarized as follows:
Table 5—Allowance for Credit Losses
55
Nine Months Ended
September 30 2010 2009 (Dollars in millions)
Allowance for loan losses at beginning of year $ 3,114 $ 1,826 Loans charged-off:
Commercial and industrial 293 299 Commercial real estate mortgage—owner occupied 142 49 Commercial real estate construction—owner occupied 20 9 Commercial investor real estate mortgage 673 378 Commercial investor real estate construction 464 329 Residential first mortgage 184 149 Home equity 336 324 Indirect 26 52 Other consumer 63 59
2,201 1,648 Recoveries of loans previously charged-off:
Commercial and industrial 25 20 Commercial real estate mortgage—owner occupied 7 5 Commercial real estate construction—owner occupied 1 — Commercial investor real estate mortgage 9 5 Commercial investor real estate construction 9 4 Residential first mortgage 2 2 Home equity 13 22 Indirect 12 15 Other consumer 13 14
91 87 Net charge-offs:
Commercial and industrial 268 279 Commercial real estate mortgage—owner occupied 135 44 Commercial real estate construction—owner occupied 19 9 Commercial investor real estate mortgage 664 373 Commercial investor real estate construction 455 325 Residential first mortgage 182 147 Home equity 323 302 Indirect 14 37 Other consumer 50 45
2,110 1,561 Provision for loan losses 2,181 2,362
Allowance for loan losses at September 30 $ 3,185 $ 2,627
Reserve for unfunded credit commitments at January 1 74 74 Provision for unfunded credit commitments (3 ) (11 )
Reserve for unfunded credit commitments at September 30 71 63
Allowance for credit losses at end of period $ 3,256 $ 2,690
Loans, net of unearned income, outstanding at end of period $ 84,420 $ 92,754 Average loans, net of unearned income, outstanding for the period $ 87,520 $ 95,453 Ratios:
Allowance for loan losses at end of period to loans, net of unearned income 3.77 % 2.83 % Net charge-offs as percentage of:
Average loans, net of unearned income 3.22 2.19 Provision for loan losses 96.74 66.10
Table of Contents
Loans deemed to be impaired include troubled debt restructurings (“TDRs”), plus commercial and investor real estate non-accrual loans. Commercial and investor real estate impaired loans with outstanding balances equal to or greater than $2.5 million are evaluated individually for impairment. For these loans, Regions measures the level of impairment based on the present value of the estimated projected cash flows, the estimated value of the collateral or, if available, observable market prices. For consumer TDRs, Regions measures the level of impairment based on pools of loans stratified by common risk characteristics. If current valuations are lower than the current book balance of the credit, the negative differences are reviewed for possible charge-off. In instances where management determines that a charge-off is not appropriate, a specific reserve is established for the individual loan in question. This specific reserve is incorporated as a part of the overall allowance for credit losses. The recorded investment in impaired loans was approximately $4.5 billion at September 30, 2010, compared to $5.0 billion at December 31, 2009. The allowance allocated to specifically evaluated impaired loans, excluding TDRs, totaled $429 million and $403 million at September 30, 2010 and December 31, 2009, respectively. Loans that were characterized as TDRs totaled $1.8 billion and $1.9 billion at September 30, 2010 and December 31, 2009, respectively. The allowance allocated to TDRs, excluding specifically-impaired loans referred to above, totaled $161 million at September 30, 2010 and $38 million at December 31, 2009.
Regions continues to work to meet the individual needs of consumer borrowers to stem foreclosure through CAP. Regions designed the program to allow for customer-tailored modifications with the goal of keeping customers in their homes and avoiding foreclosure where possible. Modification may be offered to any borrower experiencing financial hardship—regardless of the borrower’s payment status. Under the CAP, Regions may offer a short-term deferral, a term extension, an interest rate reduction, a new loan product, or a combination of these options. Regions evaluates the success of the modification program (the “recidivism rate”). Our recidivism rate is the 60-day and greater delinquency rate inclusive of non-accruing loans for all TDRs which were restructured six months or prior to the reporting period. For CAP modifications, this rate is currently approximately 21%. For loans restructured under CAP, Regions expects to collect the original contractually due principal. The gross original contractual interest may be collectible, depending on the terms modified. The length of the CAP modifications ranges from temporary payment deferrals of three months to term extensions for the life of the loan. All such modifications are considered TDRs regardless of the term if there is a concession to a borrower experiencing financial difficulty. Modified loans are subject to policies governing accrual/nonaccrual evaluation consistent with all other loans of the same product type. Consumer loans are subject to objective accrual/nonaccrual decisions. Under these policies, loans subject to CAP are assessed for charge down to estimated value and placed on nonaccrual status, unless they are well-secured and in the process of collection, on or before the month in which the loan becomes 180 days past due. Because the program was designed to evaluate potential CAP participants as early as possible in the lifecycle of the troubled loan, many of the modifications are finalized without the borrower ever reaching 180 days past due, and with the loans having never been placed on nonaccrual. Accordingly, given the positive impact of the restructuring on the likelihood of recovery of cash flows due under the modified terms, accrual status continues to be appropriate for these loans. None of the modified consumer loans listed in our TDR disclosures were collateral-dependent at the time of modification. At September 30, 2010, approximately $146 million in residential first mortgage TDRs and approximately $8 million in home equity TDRs were in excess of 180 days past due and are considered collateral-dependent.
56
Table of Contents
Residential first mortgage, home equity and other consumer TDRs are consumer loans modified under the CAP. Commercial and investor real estate are not the result of a formal program, but represent situations where modification was offered as a workout alternative. The following table summarizes TDRs for the periods ending September 30, 2010 and December 31, 2009:
Table 6—Troubled Debt Restructurings
If loans characterized as TDRs perform according to the restructured terms for a satisfactory period of time, the TDR designation may be removed in a new calendar year if the loan yields a market rate. A minimum of six months’ consecutive payments is required in order to demonstrate a performance history sufficient to remove the TDR designation. The improved performance of residential first mortgage loans which were characterized as TDRs in 2009 drove the decrease in TDR balances during 2010.
57
September 30, 2010 December 31, 2009
Loan
Balance Allowance for Credit Losses
Loan Balance
Allowance for Credit Losses
(In millions)
Accruing:
Commercial $ 23 $ 2 $ 24 $ 2 Investor real estate 150 6 1 — Residential first mortgage 746 82 1,291 29 Home equity 314 42 241 5 Other consumer 66 1 51 1
$ 1,299 $ 133 $ 1,608 $ 37 Non-accrual status or 90 days past due:
Commercial $ 71 $ 23 $ 17 $ 2 Investor real estate 159 24 75 16 Residential first mortgage 222 25 178 1 Home equity 26 3 17 1
478 75 287 20
$ 1,777 $ 208 $ 1,895 $ 57
Note 1. All loans listed in the table above are considered impaired under applicable accounting literature. Note 2.
Netcharge-offs on commercial TDRs were approximately $47 million and $5 million for the nine months ended September 30, 2010 and 2009, respectively.
Netcharge-offs on investor real estate TDRs were approximately $34 million and $3 million for the nine months ended September 30, 2010 and 2009, respectively.
Netcharge-offs on residential first mortgage TDRs were approximately $60 million and $27 million for the nine months ended September 30, 2010 and 2009, respectively.
Netcharge-offs on home equity TDRs were approximately $30 million and $7 million for the nine months ended September 30, 2010 and 2009, respectively.
Netcharge-offs on other consumer TDRs were approximately $5 million and $2 million for the nine months ended September 30, 2010 and 2009, respectively.
Table of Contents
NON-PERFORMING ASSETS
Non-performing assets are summarized as follows:
Table 7—Non-Performing Assets
58
September 30
2010
December 31
2009
September 30
2009 (Dollars in millions)
Non-performing loans:
Commercial and industrial $ 502 $ 427 $ 381 Commercial real estate mortgage—owner occupied 616 560 450 Commercial real estate construction—owner occupied 35 50 47
Total commercial 1,153 1,037 878 Commercial investor real estate mortgage 1,347 1,203 1,184 Commercial investor real estate construction 561 1,067 992
Total investor real estate 1,908 2,270 2,176 Residential first mortgage 267 180 162 Home equity 44 1 —
Total non-performing loans, excluding loans held for sale 3,372 3,488 3,216 Foreclosed properties 461 607 503
Total non-performing assets* excluding loans held for sale 3,833 4,095 3,719 Non-performing loans held for sale 393 317 380
Total non-performing assets* including loans held for sale $ 4,226 $ 4,412 $ 4,099
Non-performing loans*, excluding loans held for sale, to loans, net of unearned income 3.99 % 3.85 % 3.47 %
Non-performing assets* excluding loans held for sale, to loans, net of unearned income, and foreclosed properties 4.52 % 4.49 % 3.99 %
Non-performing assets* to loans, net of unearned income, and foreclosed properties 4.98 % 4.83 % 4.40 %
Allowance for loan losses to non-performing loans* 0.94 x 0.89 x 0.82 x Accruing loans 90 days past due:
Commercial and industrial $ 5 $ 24 $ 12 Commercial real estate mortgage—owner occupied 6 16 10 Commercial real estate construction—owner occupied — 2 1
Total commercial 11 42 23 Commercial investor real estate mortgage 6 22 30 Commercial investor real estate construction 2 8 11
Total investor real estate 8 30 41 Residential first mortgage 369 361 347 Home equity 198 241 222 Indirect 2 6 4 Other consumer 5 8 6
$ 593 $ 688 $ 643
Restructured loans not included in the categories above $ 1,299 $ 1,608 $ 1,416 * Exclusive of accruing loans 90 days past due
Table of Contents
Total non-performing assets were $4.2 billion at September 30, 2010 compared to $4.4 billion at December 31, 2009 and $4.1 billion at September 30, 2009. Excluding loans held for sale, non-performing assets at September 30, 2010 were $3.8 billion compared to $4.1 billion at December 31, 2009 and $3.7 billion at September 30, 2009. Commercial investor real estate construction was the largest driver of the decreases since year-end, partially offset by increases in commercial and industrial, commercial real estate mortgage—owner occupied, and commercial investor real estate mortgage.
Loans past due 90 days or more and still accruing were $593 million at September 30, 2010, a decrease from $688 million at December 31, 2009.
At September 30, 2010 and December 31, 2009, Regions had approximately $1.0 billion and $1.2 billion, respectively, of potential problem commercial and investor real estate loans that were not included in non-accrual loans or in the accruing loans 90 days past due categories, but for which management had concerns as to the ability of such borrowers to comply with their present loan repayment terms.
SECURITIES
The following table details the carrying values of securities:
Table 8—Securities
Securities totaled $23.6 billion at September 30, 2010, a decrease of $519 million from year-end 2009 levels. As part of the Company’s asset/liability management process, in the first quarter of 2010, Regions sold approximately $1.4 billion of residential agency securities available for sale and recognized a gain of approximately $59 million. The proceeds were reinvested into newer issue residential agency securities with slightly longer durations.
Federal Reserve open market actions to maintain low interest rates have resulted in a higher level of prepayments on agency mortgage-backed securities, negatively impacting the net interest margin. In order to mitigate this risk, in the fourth quarter of 2010, the Company sold forward approximately $1.9 billion of available for sale agency securities. The forward contracts expire in December and may be net settled. The Company currently expects to realize a pre-tax gain of approximately $52 million if the securities are delivered. If the contracts are net settled, no gain will be recognized and the basis of the securities will be adjusted by approximately $52 million. The forward sales are designated in a fair value hedge relationship. In addition, in the fourth quarter of 2010, as part of the Company’s asset/liability management process, Regions sold approximately $1.2 billion of available for sale agency securities, realizing a pre-tax gain of approximately $28 million and purchased approximately $1.5 billion of agency mortgage-backed securities.
Securities available for sale, which comprise nearly all of the securities portfolio, are an important tool used to manage interest rate sensitivity and provide a primary source of liquidity for the Company (see INTEREST RATE SENSITIVITY, Exposure to Interest Rate Movements and LIQUIDITY).
59
September 30
2010
December 31
2009
September 30
2009 (In millions)
U.S. Treasury securities $ 98 $ 57 $ 63 Federal agency securities 46 51 54 Obligations of states and political subdivisions 38 70 314 Mortgage-backed securities
Loans held for sale totaled $1.6 billion at September 30, 2010 compared to $1.5 billion at December 31, 2009. Fluctuations in this balance relate primarily to mortgage origination activity, which was high in the third quarter of 2010 due to low interest rates. Movement of non-performing loans, primarily secured by investor real estate, to the held for sale category also drove the increase.
OTHER INTEREST-EARNING ASSETS
All other interest-earning assets decreased approximately $2.1 billion from year-end 2009 to September 30, 2010 primarily due to a reduction in trading assets, driven by a change in strategy in mitigating the changes in the fair value of mortgage servicing rights. Trading assets were used to mitigate changes in valuation of mortgage servicing rights in late 2009; however, in early 2010 the Company exited these trading positions, replacing them with derivatives. A decrease in interest-bearing deposits in other banks also impacted the period over period change, representing an asset/liability management strategy whereby funds were utilized to repay certain FHLB advances. These decreases were partially offset by increases in federal funds sold and securities purchased under agreements to resell and other interest-earning assets.
GOODWILL
Goodwill totaled $5.6 billion at September 30, 2010 and December 31, 2009. Regions performed an interim test of goodwill for impairment during the third quarter of 2010. Regions’ Step One analysis indicated that the estimated fair value of the Banking/Treasury reporting unit was less than its carrying amount. Therefore, Step Two was performed and, based on the full purchase price allocation performed as if a business combination had occurred as outlined in Note 8 “Goodwill” to the consolidated financial statements, goodwill was not impaired as of September 30, 2010.
During the fourth quarter of 2008, the fair value of the Banking/Treasury reporting unit was calculated as required under Step One of the annual goodwill impairment test. The long-term fair value of our equity was determined using both income and market approaches. The results of these calculations indicated that the fair value of our Banking/Treasury reporting unit was less than its carrying amount. Therefore, Step Two of the goodwill impairment test was performed. In Step Two, the fair value of the Company’s assets and liabilities, including the loan portfolio, intangible assets, time deposits, debt, etc., was calculated. Once the fair values were determined, deferred tax adjustments were calculated as applicable. Step Two resulted in an implied fair value of goodwill of this reporting unit of approximately $4.6 billion at December 31, 2008 and resulted in an impairment charge of $6 billion at December 31, 2008. Throughout 2009 in the Banking/Treasury reporting unit, the credit quality of Regions’ loan portfolio declined, which contributed to increased losses as well as increased non-performing loan levels. During the quarters ended June 30 and September 30, 2009, the annual test in the fourth quarter of 2009 and the quarters ended March 31, June 30 and September 30, 2010, Regions conducted tests of impairment of goodwill in the same manner as the annual test in the fourth quarter of 2008. The results of Step One during each of these periods indicated a decline in market value below the Banking/Treasury unit’s carrying value. As a result, Regions performed Step Two, valuing assets and liabilities as described above. The after-tax effect of the Step Two adjustments, which are primarily driven by write-downs of assets to fair value, exceeded any decrease in the value of common equity determined in Step One, resulting in no impairment for the Banking/Treasury reporting unit. Should the fair value of net assets increase more rapidly than the fair value of the equity within Regions’ Banking/Treasury reporting unit, the outcome of the goodwill impairment test could be negatively affected in future periods.
See Note 8 “Goodwill” to the consolidated financial statements for a detail of goodwill allocated to each reportable segment and a discussion of goodwill impairment testing. See Note 11 “Fair Value Measurements” to the consolidated financial statements, for the fair value measurements of certain assets and liabilities and the valuation methodology of such pricing, which is also used for testing goodwill for impairment.
60
Table of Contents
Refer to Note 22 “Fair Value Measurements” to the 2009 consolidated financial statements filed on Form 10-K, for a detailed discussion of the Company’s methodology for determining the fair value of financial instruments.
DEPOSITS
Regions competes with other banking and financial services companies for a share of the deposit market. Regions’ ability to compete in the deposit market depends heavily on the pricing of its deposits and how effectively the Company meets customers’ needs. Regions employs various means to meet those needs and enhance competitiveness, such as providing a high level of customer service, competitive pricing and providing convenient branch locations for its customers. Regions also serves customers through providing centralized, high-quality banking services and alternative product delivery channels such as internet banking.
The following table summarizes deposits by category:
Table 9—Deposits
Total deposits at September 30, 2010 decreased approximately $3.7 billion compared to year-end 2009 levels. The change was primarily driven by a decrease in time deposit accounts, primarily due to maturities. The decrease was somewhat offset by an increase in domestic money market accounts. There has also been a shift from interest-bearing transaction accounts to non-interest-bearing demand accounts since year-end. While overall deposit balances decreased during the nine months ended September 30, 2010, Regions has experienced a positive shift in its overall deposit mix as low-cost deposits increased by approximately $3.6 billion while higher-cost time deposit balances decreased by approximately $7.3 billion.
Regions elected to exit the Federal Deposit Insurance Corporation’s (“FDIC”) Transaction Account Guarantee (“TAG”) program on July 1, 2010. The TAG program is a component of the Temporary Liquidity Guarantee Program, whereby the FDIC guarantees all funds held at participating institutions beyond the $250,000 deposit insurance limit in qualifying transaction accounts. Regions’ decision to exit the program did not have a significant impact on liquidity. Effective immediately, the Dodd-Frank Act permanently increased the FDIC coverage limit to $250,000. Also as a result of the Dodd-Frank Act, effective as of December 31, 2010, unlimited coverage for non-interest bearing demand transaction accounts will be provided until January 1, 2013.
The following is a summary of short-term borrowings:
Table 10—Short-Term Borrowings
COMPANY FUNDING SOURCES
Federal funds purchased and securities sold under agreements to repurchase used for funding purposes totaled $380 million at September 30, 2010 compared to $478 million at December 31, 2009. The level of these borrowings can fluctuate significantly on a day-to-day basis, depending on funding needs and which sources of funds are used to satisfy those needs. All such arrangements are considered typical of the banking and brokerage industries and are accounted for as borrowings.
As another source of funding, the Company utilized short-term borrowings through the issuance of FHLB advances. FHLB borrowings are used to satisfy short-term borrowing requirements and can also fluctuate between periods. There were no short-term FHLB borrowings outstanding at September 30, 2010 compared to $1.0 billion at December 31, 2009. See the “Liquidity” section for discussion of Regions’borrowing capacity with the FHLB.
Other short-term borrowings are related to Morgan Keegan and include certain lines of credit that Morgan Keegan maintains with unaffiliated banks totaling $108 million and $0 at September 30, 2010 and December 31, 2009, respectively. The lines of credit provide for maximum borrowings of $585 million as of September 30, 2010.
Selected data for short-term borrowings used for funding purposes for the quarter ended September 30, 2010 is presented below (dollars in millions):
62
September 30
2010
December 31
2009
September 30
2009 (In millions)
Company funding sources:
Federal funds purchased $ 19 $ 30 $ 27 Securities sold under agreements to repurchase 361 448 1,051 Federal Home Loan Bank structured advances — 1,000 1,500 Other short-term borrowings 108 — 135
488 1,478 2,713
Customer-related borrowings:
Securities sold under agreements to repurchase 2,071 1,415 1,555 Treasury, tax and loan notes 158 7 137 Brokerage customer liabilities 455 424 365 Short-sale liability 377 266 407 Customer collateral 112 78 109
3,173 2,190 2,573
$ 3,661 $ 3,668 $ 5,286
Federal funds purchased:
Balance at quarter-end $ 19 Average outstanding (based on average daily balances) 27 Maximum amount outstanding at any month-end during the quarter 26 Weighted-average interest rate at quarter-end 0.13 %
Securities sold under agreements to repurchase:
Balance at quarter-end $ 361 Average outstanding (based on average daily balances) 290 Maximum amount outstanding at any month-end during the quarter 361 Weighted-average interest rate at quarter-end 0.44 %
Table of Contents
CUSTOMER-RELATED BORROWINGS
Repurchase agreements are also offered as commercial banking products as short-term investment opportunities for customers. The balance totaled $2.1 billion at September 30, 2010 compared to $1.4 billion at December 31, 2009. The level of these borrowings can fluctuate significantly on a day-to-day basis.
At September 30, 2010, Regions had $158 million outstanding in the Federal Reserve’s Treasury, Tax and Loan Program, compared to $7 million at December 31, 2009. See the “Liquidity” section for further detail of Regions’ borrowing capacity with the Federal Reserve.
Regions, through Morgan Keegan, maintains two types of liabilities for its brokerage customers that are classified as short-term borrowings since Morgan Keegan pays its customers interest related to these liabilities. The brokerage customer position liability represents liquid funds in customers’ brokerage accounts. Balances due to brokerage customers totaled $455 million at September 30, 2010 compared to $424 million at December 31, 2009. The short-sale liability, which represents trading obligations related to customer accounts, was $377 million at September 30, 2010 compared to $266 million at December 31, 2009. The balances of these liabilities fluctuate frequently based on customer activity.
Customer collateral increased $34 million to $112 million at September 30, 2010 from $78 million at December 31, 2009. This balance includes cash collateral posted by customers related to derivative transactions.
LONG-TERM BORROWINGS
Long-term borrowings are summarized as follows:
Table 11—Long-Term Borrowings
63
September 30
2010
December 31
2009
September 30
2009 (In millions)
Federal Home Loan Bank structured advances $ 769 $ 2,884 $ 2,396 Other Federal Home Loan Bank advances 2,016 4,520 5,270 6.375% subordinated notes due May 2012 599 598 598 7.75% subordinated notes due March 2011 504 512 515 7.00% subordinated notes due March 2011 500 500 500 7.375% subordinated notes due December 2037 300 300 300 6.75% subordinated debentures due November 2025 163 163 163 7.75% subordinated notes due September 2024 100 100 100 7.50% subordinated notes due May 2018 (Regions Bank) 750 750 750 6.45% subordinated notes due June 2037 (Regions Bank) 497 497 497 4.85% subordinated notes due April 2013 (Regions Bank) 494 491 491 5.20% subordinated notes due April 2015 (Regions Bank) 346 346 346 3.25% senior bank notes due December 2011 2,000 2,001 2,001 2.75% senior bank notes due December 2010 1,000 999 999 LIBOR floating rate senior bank notes due June 2010 — 250 250 LIBOR floating rate senior bank notes due December 2010 500 500 500 7.75% senior notes due November 2014 692 690 — 4.375% senior notes due December 2010 500 497 497 5.75% senior notes due June 2015 494 — — 4.875% senior notes due April 2013 249 — — LIBOR floating rate senior notes due June 2012 350 350 350 6.625% junior subordinated notes due May 2047 498 498 498 8.875% junior subordinated notes due June 2048 345 345 345 Other long-term debt 384 454 459 Valuation adjustments on hedged long-term debt 285 219 268
$ 14,335 $ 18,464 $ 18,093
Table of Contents
Long-term borrowings decreased approximately $4.1 billion since year-end 2009 due primarily to decreases in Federal Home Loan Bank (FHLB) advances. Long-term FHLB structured advances have stated maturities ranging from October 2010 to June 2013, but are convertible quarterly at the option of the FHLB. The FHLB structured advances have a weighted-average interest rate of 4.7%, 3.1% and 3.7% at September 30, 2010, December 31, 2009 and September 30, 2009, respectively. Other FHLB advances have a weighted-average interest rate of 1.4%, 3.4% and 3.6% at September 30, 2010, December 31, 2009 and September 30, 2009, respectively.
During the first nine months of 2010, $250 million of LIBOR floating rate senior bank notes matured. Regions also issued $250 million (gross of discount) of 4.875% senior notes due April 2013 and $500 million (gross of discount) of 5.75% senior notes due June 2015. Regions prepaid approximately $1.5 billion of FHLB advances during the first nine months of 2010, realizing a $53 million pre-tax loss on early extinguishment. In October 2010, Regions prepaid approximately $500 million of FHLB advances, realizing a $55 million pre-tax loss on early extinguishment. These extinguishments were part of the company’s asset/liability management process.
STOCKHOLDERS’ EQUITY
Stockholders’ equity was $17.2 billion at September 30, 2010 compared to $17.9 billion at December 31, 2009. During the first nine months of 2010, net losses reduced stockholders’ equity by $628 million, cash dividends declared reduced equity by $36 million for common stock and $144 million for preferred stock, and changes in accumulated other comprehensive income increased equity by $78 million.
Regions’ ratio of stockholders’ equity to total assets was 12.86 percent at September 30, 2010, compared to 12.56 percent at December 31, 2009. Regions’ ratio of tangible common stockholders’ equity to tangible assets was 6.13 percent at September 30, 2010, compared to 6.03 percent at December 31, 2009 (see Table 14 “GAAP to Non-GAAP Reconciliation” for further discussion).
See Note 3 “Stockholders’ Equity and Comprehensive Income (Loss),” for further information related to common shares available for repurchase and dividends.
REGULATORY CAPITAL REQUIREMENTS
Regions and Regions Bank are required to comply with capital adequacy standards established by banking regulatory agencies. Currently, there are two basic measures of capital adequacy: risk-based measures and a leverage measure.
The risk-based capital standards are designed to make regulatory capital requirements more sensitive to differences in credit risk profiles among banks and bank holding companies, to account for off-balance sheet exposure and interest rate risk, and to minimize disincentives for holding liquid assets. Assets and off-balance sheet items are assigned to broad risk categories, each with specified risk-weighting factors. The resulting capital ratios represent capital as a percentage of total risk-weighted assets and off-balance sheet items. Banking organizations that are considered to have excessive interest rate risk exposure are required to maintain higher levels of capital.
The minimum standard for the ratio of total capital to risk-weighted assets is 8%. At least 50% of that capital level must consist of common equity, undivided profits and non-cumulative perpetual preferred stock, less goodwill and certain other intangibles (“Tier 1 Capital”). The remainder (“Tier 2 Capital”) may consist of a limited amount of other preferred stock, mandatory convertible securities, subordinated debt, and a limited amount of the allowance for loan losses. The sum of Tier 1 Capital and Tier 2 Capital is “total risk-based capital” or total capital.
64
Table of Contents
The banking regulatory agencies also have adopted regulations that supplement the risk-based guidelines to include a minimum ratio of 3% of Tier 1 Capital to average assets less goodwill (the “Leverage ratio”). Depending upon the risk profile of the institution and other factors, the regulatory agencies may require a Leverage ratio of 1% to 2% above the minimum 3% level.
The following chart summarizes the applicable holding company and bank regulatory capital requirements. Regions’ capital ratios at September 30, 2010, December 31, 2009 and September 30, 2009 substantially exceeded all regulatory requirements.
Table 12—Regulatory Capital Requirements
The increase in the Tier 1 Common risk based ratio during 2010 includes the impact of an additional $259 million of common equity due to the early conversion of the Series B shares, the reduction in risk-weighted assets from $103.3 billion at December 31, 2009 to $97.1 billion at September 30, 2010, and a reduction in the disallowed deferred tax asset from $947 million at December 31, 2009 to $427 million at September 30, 2010, partially offset by the impact of the net loss during the nine months ended September 30, 2010. All of these items also impacted the Tier 1 Capital ratio with the exception of the early conversion of the Series B shares.
Regions is evaluating the anticipated impact of Basel III. The Company’s Tier 1 Common ratio is currently 7.6 percent, above the Basel III minimum 7 percent guideline. Regions’ Tier 1 Capital ratio is currently 12.1 percent, above the Basel III minimum 8.5 percent guideline. Regions also expects to meet the Basel III liquidity requirements in its current form. However, there is still need for some clarification of the Basel III rules and implementation by U.S. banking regulators, so the ultimate impact on Regions is not completely known at this point. See the “Risk Factors” section of this Form 10-Q for more information.
LIQUIDITY
GENERAL
Liquidity is an important factor in the financial condition of Regions and affects Regions’ ability to meet the borrowing needs and deposit withdrawal requirements of its customers. Assets, consisting principally of loans and securities, are funded by customer deposits, purchased funds, borrowed funds and stockholders’ equity. The challenges of the current market environment demonstrate the importance of having and using various sources of liquidity to satisfy the Company’s funding requirements. See Note 12 “Commitments and Contingencies” to the consolidated financial statements for additional discussion of the Company’s funding requirements.
65
September 30,
2010 Ratio
December 31,
2009 Ratio
September 30,
2009 Ratio
To Be Well
Capitalized Tier 1 Common (non-GAAP):
Regions Financial Corporation 7.63 % 7.15 % 7.88 % NA (1) Tier 1 Capital:
Regions Financial Corporation 12.07 % 11.54 % 12.15 % 6.00 % Regions Bank 11.39 10.36 10.89 6.00
Total Capital:
Regions Financial Corporation 15.96 % 15.78 % 16.28 % 10.00 % Regions Bank 14.60 13.65 14.10 10.00
Leverage:
Regions Financial Corporation 9.24 % 8.90 % 9.68 % 5.00 % Regions Bank 8.79 8.05 8.77 5.00
(1) The Board of Governors of the Federal Reserve System has identified 4% as the level of Tier 1 Common capital sufficient to withstand
adverse economic scenarios.
Table of Contents
In order to ensure an appropriate level of liquidity is maintained, Regions performs specific procedures including scenario analyses and stress testing at the bank, holding company and affiliate levels. Regions’ policy is to maintain a sufficient level of funding to meet projected cash needs, including all debt service and maturities, for the subsequent two years at the parent company and acceptable periods for the bank and other affiliates. The Company’s funding and contingency planning does not currently include any reliance on unsecured sources. Regions has continued to test those markets and has entered them only when opportunistic borrowing is available. Regions has chosen to focus on using short-term secured sources of funding until longer term organic balance sheet solutions can be implemented.
The securities portfolio is one of Regions’ primary sources of liquidity. Maturities, principal payments, and interest earned on securities provide a constant flow of funds available for cash needs (see Note 6 “Securities” to the consolidated financial statements). Maturities and interest collections in the loan portfolio also provide a steady flow of funds. Additional funds are provided from payments on consumer loans and one-to-four family residential mortgage loans. Historically, Regions’ high levels of pre-provision earnings have also contributed to cash flow. In addition, liquidity needs can also be met by borrowing funds in state and national money markets. Historically, Regions’ liquidity has been enhanced by its relatively stable deposit base. During 2010 and 2009, Regions’ customer base grew substantially in response to competitive offers and customers’ desire to lock-in rates in the falling rate environment, as well as the introduction of new consumer and business checking products.
Regions elected to exit the FDIC’s TAG program on July 1, 2010. The TAG program is a component of the Temporary Liquidity Guarantee Program, whereby the FDIC guarantees all funds held at participating institutions beyond the $250,000 deposit insurance limit in qualifying transaction accounts. Regions does not expect its decision to exit the program to have a significant impact on liquidity. The Dodd-Frank Act permanently increased the FDIC coverage limit to $250,000. As a result of the Dodd-Frank Act, effective as of December 31, 2010, unlimited coverage for non-interest bearing demand transaction accounts will be provided until January 1, 2013.
Regions’ borrowing availability with the Federal Reserve Bank as of September 30, 2010, based on assets available for collateral at that date, was $15.8 billion.
Regions periodically accesses funding markets through sales of securities with agreements to repurchase. Repurchase agreements are also offered as commercial banking products as short-term investment opportunities for customers. All such arrangements are considered typical of the banking and brokerage industries and are accounted for as borrowings.
Regions’ financing arrangement with FHLB Atlanta adds additional flexibility in managing its liquidity position. As of September 30, 2010 Regions’ borrowing availability from FHLB Atlanta totaled $3.8 billion. FHLB borrowings are contingent upon the amount of collateral pledged to the FHLB. Regions has additional collateral available and, accordingly, has additional capacity to borrow from the FHLB. Regions Bank and its subsidiaries have pledged certain residential first mortgage loans on one-to-four family dwellings and home equity lines of credit as collateral for the FHLB advances outstanding. Additionally, investment in FHLB stock is required in relation to the level of outstanding borrowings. Regions held $437 million in FHLB stock at September 30, 2010. The FHLB has been and is expected to continue to be a reliable and economical source of funding.
In February 2010, Regions filed a shelf registration statement with the U.S. Securities and Exchange Commission. This shelf registration does not have a capacity limit and can be utilized by Regions to issue various debt and/or equity securities. The registration statement will expire in February 2013. During the second quarter of 2010, Regions issued from the shelf $250 million (gross of discount) of 4.875% senior notes due April 2013 and $500 million (gross of discount) of 5.75% senior notes due June 2015.
66
Table of Contents
Regions’ Bank Note program allows Regions Bank to issue up to $20 billion aggregate principal amount of bank notes outstanding at any one time. No issuances have been made under this program as of September 30, 2010. Notes issued under the program may be senior notes with maturities from 30 days to 15 years and subordinated notes with maturities from 5 years to 30 years. These notes are not deposits and they are not insured or guaranteed by the FDIC.
Regions may, from time to time, consider opportunistically retiring its outstanding issued securities, including subordinated debt, trust preferred securities and preferred shares in privately negotiated or open market transactions for cash or common shares. Regions would obtain concurrence from its banking regulators before any such retirements.
Regions’ ability to access capital markets is impacted by actions of ratings agencies. See the “Ratings” section below and the “Risk Factors” section of this Form l0-Q for more information.
Morgan Keegan maintains certain lines of credit with unaffiliated banks to manage liquidity in the ordinary course of business. See the “Short-Term Borrowings” section for further detail.
See the “Stockholders’ Equity” section for discussion of the Federal Reserve’s Supervisory Capital Assessment Program.
RATINGS
Regions experienced rating actions by Standard & Poor’s (“S&P”) and Dominion Bond Rating Service (“DBRS”) on March 11, 2010 and March 26, 2010, respectively. The agencies downgraded obligations of Regions Financial Corporation and Regions Bank. In general, ratings agencies base their ratings on many quantitative and qualitative factors, including capital adequacy, liquidity, asset quality, business mix, probability of government support, and level and quality of earnings. Any decrease in credit ratings by one or more ratings agencies could impact Regions’ access to the capital markets or short-term funding and/or increase our financing costs, thereby adversely impacting Regions’financial condition and liquidity. The following tables present debt ratings information of Regions Financial Corporation and Regions Bank by S&P, Moody’s Investors Service, Fitch Ratings and DBRS as of September 30, 2010 and December 31, 2009.
Short-term debt A-2 P-2 F2 R-1L Long-term bank deposits BBB Baa1 A- AL Long-term debt BBB Baa1 BBB+ AL Subordinated debt BBB- Baa2 BBB BBBH
Table of Contents
During October 2010, S&P and DBRS affirmed their current ratings. On November 1, 2010, Moody’s downgraded the obligations of Regions Financial Corporation and Regions Bank. The following table presents ratings information of Regions Financial Corporation and Regions Bank subsequent to the ratings actions:
Moody’s based their assessment on the lower likelihood of systemic support from governmental agencies. The one notch downgrade of Moody’s ratings for the holding company lowered Regions Financial Corporation’s long-term debt rating to below investment grade. However, the two notch downgrade of Regions Bank did not reduce the bank’s long-term debt rating below investment grade.
Many obligations of Regions and Regions Bank remain on negative watch or negative outlook by the agencies referred to above, including Moody’s. Credit watch with negative implications, negative outlook, negative watch, and other similar terms mean that a future downgrade is possible. See the “Risk Factors” section of this Form 10-Q for more information.
A security rating is not a recommendation to buy, sell or hold securities, and the ratings above are subject to revision or withdrawal at any time by the assigning rating agency. Each rating should be evaluated independently of any other rating.
OPERATING RESULTS
The tables below present computations of earnings and certain other financial measures excluding the regulatory charge (non-GAAP). The regulatory charge is included in financial results presented in accordance with generally accepted accounting principles (GAAP). Regions believes that the exclusion of the regulatory charge in expressing earnings and certain other financial measures, including “earnings (loss) per common share, excluding regulatory charge”, “return on average assets, excluding regulatory charge”, and “return on average tangible common stockholders’ equity, excluding regulatory charge” (explained below) provides a meaningful base for period-to-period comparisons, which management believes will assist investors in analyzing the operating results of the Company and predicting future performance. These non-GAAP financial measures are also used by management to assess the performance of Regions’ business, because management does not
consider the regulatory charge to be relevant to ongoing operating results. Management and the Board of Directors utilize these non-GAAP financial measures for the following purposes:
Regions believes that presenting these non-GAAP financial measures will permit investors to assess the performance of the Company on the same basis as that applied by management and the Board of Directors.
The following tables also provide calculations of “return on average tangible common stockholders’ equity” and end of period “tangible common stockholders’ equity” ratios and a reconciliation of stockholders’ equity to Tier 1 capital and to “Tier 1 common equity” all of which are non-GAAP. Tangible common stockholders’ equity ratios have become a focus of some investors and management believes they may assist investors in analyzing the capital position of the Company absent the effects of intangible assets and preferred stock. Traditionally, the Federal Reserve and other banking regulators have assessed a bank’s capital adequacy based on Tier 1 capital, the calculation of which is codified in federal banking regulations. In connection with the SCAP, these regulators began supplementing their assessment of the capital adequacy of a bank based on a variation of Tier 1 Capital, known as Tier 1 common equity. While not codified, analysts and banking regulators have assessed Regions’ capital adequacy using the tangible common stockholders’ equity and/or the Tier 1 common equity measure. Because tangible common stockholders’ equity and Tier 1 common equity are not formally defined by GAAP or codified in the federal banking regulations, these measures are considered to be non-GAAP financial measures, and other entities may calculate them differently than Regions’ disclosed calculations. Since analysts and banking regulators may assess Regions’ capital adequacy using tangible common stockholders’ equity and Tier 1 common equity, Regions believes that it is useful to provide investors the ability to assess Regions’ capital adequacy on these same bases.
Tier 1 common equity is often expressed as a percentage of risk-weighted assets. Under the risk-based capital framework, a company’s balance sheet assets and credit equivalent amounts of off-balance sheet items are assigned to one of four broad risk categories. The aggregated dollar amount in each category is then multiplied by the risk weighting assigned to that category. The resulting weighted values from each of the four categories are added together and this sum is the risk-weighted assets total that, as adjusted, comprises the denominator of certain risk-based capital ratios. Tier 1 Capital is then divided by this denominator (risk-weighted assets) to determine the Tier 1 Capital ratio. Adjustments are made to Tier 1 Capital to arrive at Tier 1 common equity. Tier 1 common equity is also divided by the risk-weighted assets to determine the Tier 1 common equity ratio. The amounts disclosed as risk-weighted assets are calculated consistent with banking regulatory requirements.
Non-GAAP financial measures have inherent limitations, are not required to be uniformly applied and are not audited. To mitigate these limitations, Regions has policies and procedures in place to identify and address expenses that qualify for non-GAAP presentation, including authorization and system controls to ensure accurate period to period comparisons. Although these non-GAAP financial measures are frequently used by stakeholders in the evaluation of a company, they have limitations as analytical tools, and should not be considered in isolation, or as a substitute for analyses of results as reported under GAAP. In particular, a measure of earnings that excludes the regulatory charge does not represent the amount that effectively accrues directly to stockholders (i.e., the regulatory charge is a reduction in earnings and stockholders’equity).
The following tables provide: 1) a reconciliation of net income (loss) available to common shareholders (GAAP) to net income (loss) available to common shareholders, excluding regulatory charge (non-GAAP), 2) a reconciliation of earnings (loss) per common share (GAAP) to earnings (loss) per common share, excluding
69
• Preparation of Regions’ operating budgets • Monthly financial performance reporting • Monthly close-out “ flash” reporting of consolidated results (management only) • Presentations to investors of Company performance.
Table of Contents
regulatory charge (non-GAAP), 3) a reconciliation of return on average assets (GAAP) to return on average assets, excluding regulatory charge (non-GAAP), 4) a reconciliation of average and ending stockholders’ equity (GAAP) to average and ending tangible common stockholders’equity with and without regulatory charge (non-GAAP), and 5) a reconciliation of stockholders’ equity (GAAP) to Tier 1 Capital (regulatory) and to Tier 1 common equity (non-GAAP).
Table 14—GAAP to Non-GAAP Reconciliation
70
Three Months Ended
September 30 Nine Months Ended
September 30 2010 2009 2010 2009 (Dollars in millions, except per share data)
INCOME (LOSS)
Net income (loss) (GAAP) $ (155 ) $ (377 ) $ (628 ) $ (488 ) Preferred dividends and accretion (GAAP) (54 ) (60 ) (171 ) (167 )
Net income (loss) available to common shareholders (GAAP) A $ (209 ) $ (437 ) $ (799 ) $ (655 ) Regulatory charge, net of tax — — 200 —
Net income (loss) available to common shareholders, excluding regulatory charge (non-GAAP) B $ (209 ) $ (437 ) $ (599 ) $ (655 )
Weighted-average diluted shares C 1,257 1,189 1,217 921 Earnings (loss) per common share—diluted (GAAP) A/C $ (0.17 ) $ (0.37 ) $ (0.66 ) $ (0.71 )
Loans held for sale 1,213 10 3.11 1,522 12 3.25 Loans, net of unearned income (1)(2) 85,616 926 4.29 94,354 1,053 4.43 Other interest-earning assets 4,308 6 0.55 6,841 7 0.40
Total interest-earning assets 117,349 1,166 3.94 124,055 1,322 4.23 Allowance for loan losses (3,223 ) (2,393 )
Total interest-bearing liabilities 89,292 290 1.29 97,283 469 1.91
Net interest spread 2.65 2.32
Non-interest-bearing deposits (3) 23,706 21,122
Other liabilities 3,349 3,288
Stockholders’ equity 17,382 18,612
$ 133,729 $ 140,305
Net interest income/margin on a taxable-equivalent basis (4) $ 876 2.96 % $ 853 2.73 %
(1) Loans, net of unearned income include non-accrual loans for all periods presented. (2) Interest income includes net loan fees of $6 million and $9 million for the quarters ended September 30, 2010 and 2009, respectively. (3) Total deposit costs may be calculated by dividing total interest expense on deposits by the sum of interest-bearing deposits and non-interest
bearing deposits. The rates for total deposit costs equal 0.70% and 1.26% for the three months ended September 30, 2010 and 2009, respectively.
(4) The computation of taxable-equivalent net interest income is based on the statutory federal income tax rate of 35%, adjusted for applicable state income taxes net of the related federal tax benefit.
Table of Contents
The following table presents an analysis of net interest income/margin for the nine months ended September 30:
Table 16—Consolidated Average Daily Balances and Yield/Rate Analysis
Notes:
73
Nine Months Ended September 30 2010 2009
(Dollars in millions; yields on taxable-equivalent basis) Average Balance
Income/
Expense
Yield/
Rate Average Balance
Income/
Expense
Yield/
Rate Assets
Interest-earning assets:
Federal funds sold and securities purchased under agreements to resell $ 608 $ 2 0.45 % $ 550 $ 2 0.57 % Trading account assets 1,229 31 3.33 1,185 34 3.80 Securities:
Loans held for sale 1,212 27 3.03 1,709 43 3.37 Loans, net of unearned income (1)(2) 87,520 2,814 4.30 95,453 3,232 4.53 Other interest-earning assets 5,669 21 0.51 7,385 21 0.38
Total interest-earning assets 120,126 3,576 3.98 126,115 4,069 4.31 Allowance for loan losses (3,194 ) (2,061 )
Total interest-bearing liabilities 92,690 998 1.44 102,110 1,559 2.04
Net interest spread 2.54 2.27
Non-interest-bearing deposits (3) 23,407 20,154
Other liabilities 3,163 3,430
Stockholders’ equity 17,578 17,613
$ 136,838 $ 143,307
Net interest income/margin on a taxable-equivalent basis (4) $ 2,578 2.87 % $ 2,510 2.66 %
(1) Loans, net of unearned income include non-accrual loans for all periods presented. (2) Interest income includes net loan fees of $28 million and $16 million for the nine months ended September 30, 2010 and 2009, respectively. (3) Total deposit costs may be calculated by dividing total interest expense on deposits by the sum of interest-bearing deposits and non-interest
bearing deposits. The rates for total deposit costs equal 0.83% and 1.42% for the nine months ended September 30, 2010 and 2009, respectively.
(4) The computation of taxable-equivalent net interest income is based on the statutory federal income tax rate of 35%, adjusted for applicable state income taxes net of the
Table of Contents
For the third quarter of 2010, net interest income (taxable-equivalent basis) totaled $876 million compared to $853 million in the third quarter of 2009. The net interest margin (taxable-equivalent basis) was 2.96 percent in the third quarter of 2010, compared to 2.73 percent during the third quarter of 2009. For the first nine months of 2010, net interest income (taxable-equivalent basis) totaled $2.6 billion compared to $2.5 billion for the first nine months of 2009. The net interest margin (taxable-equivalent basis) was 2.87 percent in the first nine months of 2010, compared to 2.66 percent during the first nine months of 2009. Improved deposit pricing as well as a favorable mix shift to lower cost deposits has driven the improvement in net interest margin. Additionally improving spreads on newly originated and renewed loans also contributed to the increase in the net interest margin for the third quarter and first nine months of 2010 versus prior periods. The Company expects the net interest margin to continue improving gradually throughout the year reaching 3.00 percent by year-end 2010. Federal Reserve open market actions to maintain low interest rates have resulted in a higher level of prepayments on agency mortgage-backed securities, negatively impacting the net interest margin. In order to mitigate this risk, in the fourth quarter of 2010, the Company sold forward approximately $1.9 billion of available for sale agency securities. The forward contracts expire in December and may be net settled. The Company currently expects to realize a pre-tax gain of approximately $52 million if the securities are delivered. If the contracts are net settled, no gain will be recognized and the basis of the securities will be adjusted by approximately $52 million. The forward sales are designated in a fair value hedge relationship. In addition, in the fourth quarter of 2010, as part of the Company’s asset/liability management process, Regions sold approximately $1.2 billion of available for sale agency securities, realizing a pre-tax gain of approximately $28 million and purchased approximately $1.5 billion of agency mortgage-backed securities.
MARKET RISK
Market risk is the risk of loss arising from adverse changes in the fair value of financial instruments due to changes in interest rates, exchange rates, commodity prices, equity prices or the credit quality of debt securities.
INTEREST RATE SENSITIVITY
Regions’ primary market risk is interest rate risk, including uncertainty with respect to absolute interest rate levels as well as uncertainty with respect to relative interest rate levels, which is impacted by both the shape and the slope of the various yield curves that affect the financial products and services that the Company offers. To quantify this risk, Regions measures the change in its net interest income in various interest rate scenarios compared to a base case scenario. Net interest income sensitivity is a useful short-term indicator of Regions’ interest rate risk.
Sensitivity Measurement —Financial simulation models are Regions’ primary tools used to measure interest rate exposure. Using a wide range of sophisticated simulation techniques provides management with extensive information on the potential impact to net interest income caused by changes in interest rates. Models are structured to simulate cash flows and accrual characteristics of Regions’ balance sheet. Assumptions are made about the direction and volatility of interest rates, the slope of the yield curve, and the changing composition of the balance sheet that result from both strategic plans and from customer behavior. Among the assumptions are expectations of balance sheet growth and composition, the pricing and maturity characteristics of existing business and the characteristics of future business. Interest rate-related risks are expressly considered, such as pricing spreads, the lag time in pricing deposit accounts, prepayments and other option risks. Regions considers these factors, as well as the degree of certainty or uncertainty surrounding their future behavior.
Historically, Regions’ balance sheet has consisted of a relatively rate-sensitive deposit base that funds a predominantly floating rate commercial and consumer loan portfolio. This mix of Regions’ core business activities creates a naturally asset sensitive balance sheet, meaning that increases (decreases) in interest rates would likely have a positive (negative) cumulative impact on Regions’ net interest income. To manage the balance sheet’s interest rate risk, Regions maintains a portfolio of largely fixed-rate discretionary investments, loans and derivatives. The market risk of these discretionary instruments attributable to variation in interest rates is fully incorporated into the simulation results in the same manner as all other balance sheet instruments.
74
Table of Contents
The primary objective of asset/liability management at Regions is to coordinate balance sheet composition with interest rate risk management to sustain a reasonable and stable net interest income throughout various interest rate cycles. In computing interest rate sensitivity for measurement, Regions compares a set of alternative interest rate scenarios to the results of a base case scenario based on “market forward rates.” The standard set of interest rate scenarios includes the traditional instantaneous parallel rate shifts of plus 100 and 200 basis points. Regions also prepares a minus 100 basis points scenario; a minus 200 basis scenario is not considered realistic in the current rate environment. Up-rate scenarios of greater magnitude are also analyzed, and are of increased importance provided that current and historic low levels of interest rates increase the relative likelihood of a rapid and substantial increase in interest rates. Regions also includes simulations of gradual interest rate movements that may more realistically mimic potential interest rate movements. These gradual scenarios include curve steepening, flattening, and parallel movements of various magnitudes phased in over a six-month period, and include rate shifts of plus and minus 100 basis points and plus 200 basis points.
Exposure to Interest Rate Movements— Regions continues to observe that the pace of economic recovery is at risk of being exceptionally slow, which may result in a continuation of this period of low interest rates. To partially offset the adverse impact on net interest income and net interest margin attributable to an extended period of low interest rates, Regions entered into a series of receive-fixed interest rate swaps. These instruments have a final maturity in December 2012. Inclusive of all interest-rate risk hedging activities, as of September 30, 2010, Regions was moderately asset sensitive to both gradual and instantaneous rate shifts as compared to the base case for the measurement horizon ending in September 2011. Over the past few months, Regions has seen its estimated asset sensitivity increase somewhat. This is primarily due to an increase in the contribution to sensitivity from mortgages and other fixed-rate loans and securities. Propensity of such loans and securities to accelerate/decelerate payment (i.e. prepayment) depends in large part on the level of interest rates. As rate levels decline, generally mortgage portfolios exhibit an increase in prepayment levels as well as an increased sensitivity to changes in the level of interest rates. Recently, long-term interest rates have declined, and have prompted an increase in the expected level of prepayment and prepayment sensitivity for these portfolios. The consolidated net interest income sensitivity inclusive of the impact of prepayment behavior as well as the impacts of the aforementioned receive-fixed swaps is summarized in the table below. Note that where scenarios would indicate negative interest rates, a minimum of zero is applied.
Table 17—Interest Rate Sensitivity
USE OF DERIVATIVES TO MANAGE INTEREST RATE RISK
Regions uses financial derivative instruments for management of interest rate sensitivity. The Asset and Liability Committee (“ALCO”), which consists of members of Regions’ senior management team, in its oversight role for the management of interest rate sensitivity, approves the use of derivatives in balance sheet
hedging strategies. The most common derivatives Regions employs are forward rate contracts, Eurodollar futures contracts, interest rate swaps, options on interest rate swaps, interest rate caps and floors, and forward sale commitments. Derivatives are also used to offset the risks associated with customer derivatives, which include interest rate, credit and foreign exchange risks. Refer to Note 10 “Derivative Instruments and Hedging Activities” for further discussion.
Regions manages the credit risk of these instruments in much the same way as it manages credit risk of the loan portfolios by establishing credit limits for each counterparty and through collateral agreements for dealer transactions. For non-dealer transactions, the need for collateral is evaluated on an individual transaction basis and is primarily dependent on the financial strength of the counterparty. Credit risk is also reduced significantly by entering into legally enforceable master netting agreements. When there is more than one transaction with a counterparty and there is a legally enforceable master netting agreement in place, the exposure represents the net of the gain and loss positions with and collateral received from and/or posted to that counterparty.
The primary objective of Regions’ hedging strategies is to mitigate the impact of interest rate changes, from an economic perspective, on net interest income and the net present value of its balance sheet. The overall effectiveness of these hedging strategies is subject to market conditions, the quality of Regions’ execution, the accuracy of its valuation assumptions, counterparty credit risk and changes in interest rates. As a result, Regions’ hedging strategies may be ineffective in mitigating the impact of interest rate changes on its earnings.
On January 1, 2009, Regions began accounting for mortgage servicing rights at fair market value with any changes to fair value being recorded within mortgage income. Also, in early 2009, Regions entered into derivative transactions to mitigate the impact of market value fluctuations related to mortgage servicing rights. Derivative instruments entered into in the future could be materially different from the current risk profile of Regions’ current portfolio.
BROKERAGE AND MARKET MAKING ACTIVITY
References below, and elsewhere in this Form 10-Q, to “Morgan Keegan” are intended to include not only Morgan Keegan & Company, Inc. but also certain of its affiliates and subsidiaries. You should not assume or infer that any specific activity mentioned is carried on by any particular Morgan Keegan entity.
Morgan Keegan’s business activities, including its securities inventory positions and securities held for investment, expose it to market risk.
Morgan Keegan trades for its own account in corporate and tax-exempt securities and U.S. Government agency and Government-sponsored securities. Most of these transactions are entered into to facilitate the execution of customers’ orders to buy or sell these securities. In addition, it trades certain equity securities in order to “make a market” in these securities. Morgan Keegan’s trading activities require the commitment of capital. All principal transactions place the subsidiary’s capital at risk. Profits and losses are dependent upon the skills of employees and market fluctuations. In order to mitigate the risks of carrying inventory and as part of other normal brokerage activities, Morgan Keegan assumes short positions on securities.
In the normal course of business, Morgan Keegan enters into underwriting and forward commitments. As of September 30, 2010, the contractual amount of forward commitments was approximately $535 million. Morgan Keegan typically settles its position by entering into equal but opposite contracts and, as such, the contract amounts do not necessarily represent future cash requirements. Settlement of the transactions relating to such commitments is not expected to have a material effect on Regions’ consolidated financial position. Transactions involving future settlement give rise to market risk, which represents the potential loss that can be caused by a change in the market value of a particular financial instrument. Regions’ exposure to market risk is determined by a number of factors, including the size, composition and diversification of positions held, the absolute and relative levels of interest rates, and market volatility.
76
Table of Contents
Additionally, in the normal course of business, Morgan Keegan enters into transactions for delayed delivery, to-be-announced securities, which are recorded in trading account assets on the consolidated balance sheets at fair value. Risks arise from the possible inability of counterparties to meet the terms of their contracts and from unfavorable changes in interest rates or the market values of the securities underlying the instruments. The credit risk associated with these contracts is typically limited to the cost of replacing all contracts on which Morgan Keegan has recorded an unrealized gain. For exchange-traded contracts, the clearing organization acts as the counterparty to specific transactions and, therefore, bears the risk of delivery to and from counterparties.
Interest rate risk at Morgan Keegan arises from the exposure of holding interest-sensitive financial instruments such as government, corporate and municipal bonds, and certain preferred equities. Morgan Keegan manages its exposure to interest rate risk by setting and monitoring limits and, where feasible, entering into offsetting positions in securities with similar interest rate risk characteristics. Securities inventories recorded in trading account assets on the consolidated balance sheets, are marked to market, and, accordingly, there are no unrecorded gains or losses in value. While a significant portion of the securities inventories have contractual maturities in excess of five years, these inventories, on average, turn over in excess of twelve times per year. Accordingly, the exposure to interest rate risk inherent in Morgan Keegan’s securities inventories is less than that of similar financial instruments held by firms in other industries. Morgan Keegan’s equity securities inventories are exposed to risk of loss in the event of unfavorable price movements. Also, Morgan Keegan is subject to credit risk arising from non-performance by trading counterparties, customers and issuers of debt securities owned. This risk is managed by imposing and monitoring position limits, monitoring trading counterparties, reviewing security concentrations, holding and marking to market collateral, and conducting business through clearing organizations that guarantee performance. Morgan Keegan regularly participates in the trading of some derivative securities for its customers; however, this activity does not involve Morgan Keegan acquiring a position or commitment in these products and this trading is not a significant portion of Morgan Keegan’s business.
To manage trading risks arising from interest rate and equity price risks, Morgan Keegan uses a Value at Risk (“VAR”) model along with other risk management methods to measure the potential fair value the Company could lose on its trading positions given a specified statistical confidence level and time-to-liquidate time horizon. The end-of-period VAR was approximately $1 million at both September 30, 2010 and December 31, 2009. Maximum daily VAR utilization during the third quarter of 2010 was $1 million and average daily VAR during the same period was $1 million.
Morgan Keegan has been an underwriter and dealer in auction rate securities. See Note 12 “Commitments and Contingencies” to the consolidated financial statements for more details regarding regulatory action related to Morgan Keegan auction rate securities. As of September 30, 2010, customers of Morgan Keegan owned approximately $61 million of auction rate securities, and Morgan Keegan held approximately $217 million of auction rate securities on the balance sheet.
PROVISION FOR LOAN LOSSES
The provision for loan losses is used to maintain the allowance for loan losses at a level that in management’s judgment is adequate to cover losses inherent in the portfolio at the balance sheet date. In the third quarter of 2010, the provision for loan losses was $760 million, essentially equal to net charge-offs for the quarter. In the same quarter of 2009, the provision was $1.0 billion, while net charge-offs were $680 million. Net charge-offs as a percent of average loans (annualized) were 3.52 percent for the third quarter of 2010 compared to 2.86 percent for the corresponding period in 2009. Non-performing loans, excluding loans held for sale, decreased $116 million from December 31, 2009.
CREDIT RISK
The commercial and industrial loan portfolio primarily consists of loans to middle market commercial customers doing business in Regions’ geographic footprint. Loans in this portfolio are generally underwritten individually and usually secured with the assets of the borrowing entity and/or the personal guarantee of the business owners.
77
Table of Contents
The commercial real estate portfolio includes various loan types. A large portion consists of owner-occupied loans to businesses for long-term financing of land and buildings. These loans are generally underwritten and managed in the commercial business line because the primary repayment source is the cash flow from the business. Regions attempts to minimize risk on owner-occupied properties by requiring collateral values that exceed the loan amount, adequate cash flow to service the debt, and, in many cases, the personal guarantees of the principals of the borrowers. Another large component of commercial real estate loans consists of loans to real estate developers and investors for the financing of land or buildings, where the repayment is generated from the sale of the real estate or income generated by the real estate property.
Construction loans are primarily extensions of credit to real estate developers or investors where repayment is dependent on the sale of real estate or income generated from the real estate collateral. A construction loan may also be to a commercial business for the development of land or construction of a building where the repayment is usually derived from revenues generated from the business of the borrower. These loans are generally underwritten and managed by a specialized real estate group that also manages loan disbursements during the construction process. Credit quality of the construction portfolio is sensitive to risks associated with construction loans such as cost overruns, project completion risk, general contractor credit risk, environmental and other hazard risks, and market risks associated with the sale or rental of completed properties.
Loans on one-to-four family residential properties are secured principally by single-family residences. Loans of this type are generally smaller in size and are geographically dispersed throughout Regions’ market areas, with some guaranteed by government agencies or private mortgage insurers. Equity loans and lines, while not included in this category, are similar in nature to one-to-four family loans, except that approximately 57 percent of the balances of equity loans and lines are in a second lien position (refer to Table 4 “Selected Home Equity Portfolio Information”). Losses on the residential and equity line and loan portfolios depend, to a large degree, on the level of interest rates, the unemployment rate, economic conditions and collateral values, and thus are difficult to predict.
Loans within the indirect portfolio consist mainly of automobile, marine and recreational vehicle loans originated through third-party business relationships. Other consumer loans consist primarily of borrowings for home improvements, student loans, automobiles, overdrafts and other personal household purposes. Losses within this grouping vary according to the specific type of loan. Certain risks, such as a general slowing of the economy, rising unemployment rates and changes in consumer demand, may impact future loss rates.
NON-INTEREST INCOME
The following tables present a summary of non-interest income:
Table 18—Non-Interest Income
78
Three Months Ended
September 30 2010 2009 (In millions)
Service charges on deposit accounts $ 294 $ 300 Brokerage, investment banking and capital markets 257 252 Mortgage income 66 76 Trust department income 49 49 Securities gains, net 2 4 Insurance commissions and fees 25 25 Bank owned life insurance 22 21 Commercial credit fee income 22 16 Leveraged lease termination gains — 4 Other miscellaneous income 13 25
$ 750 $ 772
Table of Contents
Non-interest income for the third quarter of 2010 decreased by $22 million compared to the third quarter of 2009. Lower mortgage income and service charges on deposit accounts drove the decrease, partially offset by higher brokerage, investment banking, and capital markets income. Non-interest income for the first nine months of 2010 decreased $719 million when compared to the first nine months of 2009. However, the 2009 period included securities gains, leveraged lease termination gains, a gain on sale of Visa shares, and a gain on early extinguishment of debt, all of which did not repeat or were substantially smaller in the 2010 period. Mortgage income was also lower for the first nine months of 2010 as compared to the corresponding 2009 period. The decreases were partially offset by increases in income from service charges on deposit accounts and brokerage, investment banking, and capital markets.
Service charges on deposit accounts— Service charges income decreased $6 million in the third quarter of 2010 when compared to the third quarter of 2009. The quarter over quarter decrease was primarily driven by policy changes resulting in the elimination of overdraft fees for all transactions when customers overdraw their accounts by less than $5 and a limit on the maximum number of overdrafts charged per day, as well as changes related to Regulation E. Service charges increased $27 million during the first nine months of 2010 as compared to the same period in 2009. This increase was due to a higher level of customer transactions and new account growth that began in 2009 and continued into 2010. These factors were slightly offset by the previously mentioned policy and regulatory changes. Service charges will continue to be negatively impacted going forward by the policy and regulatory changes. See the “Risk Factors” section of this Form 10-Q for more information.
Brokerage, investment banking and capital markets —Brokerage, investment banking and capital markets income increased $5 million for the three months ended September 30, 2010 as compared to the same period in 2009. Brokerage, investment banking and capital markets income increased $15 million for the nine months ended September 30, 2010 as compared to the same period in 2009. The majority of this category of income is generated by Morgan Keegan. See Note 7 “Business Segment Information” for details of net income contributed by Morgan Keegan. See Table 19 “Morgan Keegan Breakout of Revenue by Division” for more detail as to components of revenue. Under a new leadership team and more favorable market conditions, the investment banking division increased revenues $8 million and $26 million during the three and nine month periods ended September 30, 2010, respectively, as compared to the same periods of 2009. Additionally, private client revenue has increased $13 million and $47 million during the three and nine month periods ended September 30, 2010, respectively, as compared to the same periods of 2009 due to more favorable market conditions. These increases were partially offset by decreases in asset management revenue of $15 million and $24 million during the three and nine month periods ended September 30, 2010, respectively, as compared to the same periods of 2009.
79
Nine Months Ended
September 30 2010 2009 (In millions)
Service charges on deposit accounts $ 884 $ 857 Brokerage, investment banking and capital markets 747 732 Mortgage income 196 213 Trust department income 146 143 Securities gains, net 61 165 Insurance commissions and fees 78 80 Bank owned life insurance 63 53 Commercial credit fee income 55 52 Leveraged lease termination gains 19 517 Gain on sale of Visa shares — 80 Gain on early extinguishment of debt — 61 Other miscellaneous income 69 84
$ 2,318 $ 3,037
Table of Contents
The following table details the breakout of revenue by division contributed by Morgan Keegan:
Table 19—Morgan Keegan
Breakout of Revenue by Division (1)
Mortgage income— Mortgage income decreased $10 million in the third quarter of 2010 when compared to the same period of 2009. Mortgage income benefited during the third quarters of 2010 and 2009 from a $2 million and $19 million gain, respectively, resulting from market valuation adjustments for mortgage servicing rights and related derivatives. Without the effect of the market value adjustments, mortgage income increased in the third quarter of 2010, compared to the third quarter of 2009, primarily driven by higher origination volume of $2.4 billion due to the low rate environment during the third quarter of 2010 compared to $1.8 billion in originations during the third quarter of 2009. Mortgage income decreased $17 million in the first nine months of 2010 compared to the same period in 2009. The 2010 period benefited from a $30 million gain resulting from market valuation adjustments for mortgage servicing rights and related derivatives, compared with a $16 million gain for the nine months ended September 30, 2009. Without the effect of the market valuation adjustments, mortgage income decreased due to lower origination volume of $5.6 billion in the first nine months of 2010, compared to $7.7 billion in the corresponding period in 2009.
Securities gains, net— Securities gains decreased from $4 million and $165 million in the three and nine months ended September 30, 2009, respectively, to $2 million and $61 million during the same periods of 2010, respectively. During the first quarter of 2010, Regions sold approximately $1.4 billion of shorter duration collateralized mortgage obligations (“CMOs”) and recognized a gain of approximately $59 million. The proceeds were reinvested in newer issue CMOs with slightly longer durations. In the first quarter of 2009, Regions sold approximately $656 million of U.S. Treasury securities available for sale and recognized a gain of approximately $53 million. The proceeds were reinvested in U.S. government agency mortgage-backed securities classified as available for sale. In the second quarter of 2009, Regions sold approximately $1.4 billion of agency debentures available for sale and recognized a gain of approximately $108 million. The proceeds were reinvested in U.S. Government Agency mortgage-backed securities classified as available for sale, as part of Regions’ asset/liability management strategy.
Gross revenue $ 44 $ 269 $ 68 $ 305 $ 148 $ 36 $ 74 Percent of gross revenue 4.7 % 28.5 % 7.2 % 32.3 % 15.7 % 3.8 % 7.8 % (1) Certain amounts in prior periods have been reclassified to reflect current period presentation
Table of Contents
Leveraged lease termination gains —A 2008 settlement with the IRS negatively impacted the economics of Regions’ leveraged lease portfolio. In addition, there was a mutual desire with lessees to terminate certain leases within this portfolio. Therefore, Regions terminated certain leveraged leases during the first quarter of 2010 resulting in a $19 million gain. There were no such terminations in the second and third quarters of 2010. During the third quarter and first nine months of 2009, leveraged lease terminations resulted in gains of $4 million and $517 million, respectively. The termination gains included in non-interest income were largely offset by increases in income tax expense of $4 million for the third quarter of 2009, and $18 million and $515 million for the first nine months of 2010 and 2009, respectively.
NON-INTEREST EXPENSE
The following tables present a summary of non-interest expense. For expanded discussion of certain significant non-interest expense items, refer to the discussion of each component following the tables presented.
Table 20—Non-Interest Expense
81
Three Months Ended September 30 2010 2009 (In millions)
Salaries and employee benefits $ 582 $ 578 Net occupancy expense 110 121 Furniture and equipment expense 75 83 Marketing 22 20 Professional and legal fees 71 98 Amortization of core deposit intangible 27 30 Other real estate owned expense 65 61 FDIC premiums 51 56 Other-than-temporary impairments, net 1 3 Valuation charges associated with branch consolidations — 25 Other miscellaneous expenses 159 168
$ 1,163 $ 1,243
Nine Months Ended September 30 2010 2009 (In millions)
Salaries and employee benefits $ 1,717 $ 1,703 Net occupancy expense 340 340 Furniture and equipment expense 228 237 Marketing 54 57 Professional and legal fees 212 201 Amortization of core deposit intangible 82 91 Other real estate owned expense 148 111 Loss on early extinguishment of debt 53 — FDIC premiums 168 109 FDIC premiums—special assessment — 64 Other-than-temporary impairments, net (1) 2 75 Regulatory charge 200 — Valuation charges associated with branch consolidations — 25 Other miscellaneous expenses 515 519
$ 3,719 $ 3,532
(1) Includes $266 million for the nine months ended September 30, 2009 of gross charges, net of $191 million non-credit portion reported in
other comprehensive income (loss).
Table of Contents
Non-interest expense for the third quarter of 2010 decreased by $80 million compared to the third quarter of 2009. Lower occupancy, furniture and equipment, and professional and legal expenses drove the decrease. Non-interest expense for the first nine months of 2010 increased $187 million when compared to the first nine months of 2009. This increase was primarily driven by higher other real estate owned and FDIC premium expense offset by lower other-than-temporary impairments on securities. Additionally, the 2009 and 2010 periods included expenses which did not repeat or were substantially smaller in the corresponding period including an FDIC premium special assessment and valuation charges associated with branch consolidations in the first nine months of 2009, and debt extinguishment expense and a regulatory charge during the first nine months of 2010.
Salaries and employee benefits— During the third quarter of 2010, salaries and employee benefits were relatively flat when compared to the same period in 2009. For the nine months ended September 30, 2010, salaries and employee benefits increased $14 million when compared to the same period in 2009. This increase is primarily related to first quarter 2010 increases in salaries and the reinstatement of pension service accruals in 2010.
Net occupancy expense— Net occupancy expense for the third quarter of 2010 decreased $11 million when compared to the same period in 2009. This decrease is primarily due to branch consolidation charges of $9 million in the third quarter of 2009. For the nine months ended September 30, 2010, net occupancy expense was flat when compared to September 30, 2009.
Professional and legal fees— Professional and legal fees decreased $27 million during the third quarter of 2010 when compared to the same period of 2009 and increased $11 million during the first nine months of 2010 as compared to the same period of 2009. The changes are primarily due to the timing of Morgan Keegan-related legal expenses and credit-related legal costs.
Other real estate owned (“OREO”) expense —OREO expense increased in the third quarter and the first nine months of 2010 as compared to corresponding periods in 2009 by $4 million and $37 million, respectively. The increase in both periods is related to continuing declines in property valuations. Also, in the third quarter of 2010, $23 million of charges related to a bulk sale of foreclosed properties were incurred.
Loss on early extinguishment of debt —As discussed in the “Long Term Borrowings” section, during the first quarter of 2010, Regions prepaid approximately $1.5 billion of FHLB advances, recognizing an expense of $53 million. There was no corresponding expense in the third quarter or first nine months of 2009 nor were there additional expenses related to the extinguishment during the third quarter of 2010.
FDIC premiums— FDIC premiums decreased by $5 million in the third quarter of 2010 as compared to the corresponding period in 2009 and increased $59 million during the first nine months of 2010 as compared to the corresponding period in 2009. The decrease quarter over quarter resulted from lower insured deposit balances. During 2009, Regions utilized its remaining assessment credits, which, along with higher assessments, resulted in the increase in premiums for the nine months ended 2010 as compared to the corresponding 2009 period.
In the second quarter of 2010, the FDIC proposed a new deposit assessment system, based on risk as measured by newly-developed scorecards and on various measures of performance. Regions is currently evaluating the impact of the proposal. Provisions of the Dodd-Frank Act also affect the amount of FDIC assessment fees. Regions expects FDIC premiums to remain elevated in future years.
FDIC premiums—special assessment —During the second quarter of 2009, a premium of $64 million was incurred to help replenish the Deposit Insurance Fund. There was no corresponding assessment during 2010. It is possible that additional special assessments will be incurred in the future.
Other-than-temporary impairments, net (OTTI) —In the third quarter and the first nine months of 2010, other-than-temporary impairment charges decreased as compared to corresponding periods in 2009 by $2 million and $73 million, respectively. Regions recorded other-than-temporary impairment charges of $3 million and $75
82
Table of Contents
million in the third quarter and first nine months of 2009, respectively, related to the securities portfolio. These charges are net of the non-credit portion recorded in other comprehensive income (loss). Other-than-temporary impairment charges have been minimal in the first nine months of 2010 due to the Company’s efforts to de-risk the portfolio and the resulting portfolio composition.
Regulatory charge —As previously disclosed, on April 7, 2010, the SEC, a joint state task force of securities regulators from Alabama, Kentucky, Mississippi, and South Carolina and FINRA announced that they were commencing administrative proceedings against Morgan Keegan, Morgan Asset Management and certain of their employees for violations of federal and state securities laws and NASD rules relating to certain funds previously administered by Morgan Keegan and Morgan Asset Management. Based on the status of settlement negotiations, Regions believed that a loss on the matter was probable and reasonably estimable. Accordingly, at June 30, 2010, Morgan Keegan recorded a non-tax deductible $200 million charge representing the estimate of probable loss. Settlement negotiations and hearing preparations are ongoing.
INCOME TAXES
The Company’s income tax benefit for the three months ended September 30, 2010 was $150 million compared to $274 million for the same period in 2009, resulting in an effective tax rate of 49.2 percent and 42.1 percent, respectively. The decrease in the income tax benefit reflects the impact of the decrease in the consolidated pre-tax loss.
Income tax benefit for the nine months ended September 30, 2010 was $399 million compared to income tax expense of $116 million for the same period in 2009, resulting in an effective tax rate of 38.9 percent and 31.2 percent, respectively. The increase in the income tax benefit reflects the impact of the increase in the consolidated pre-tax loss and the decline in the number and amount of leveraged lease terminations, offset by the recognition of the nondeductible regulatory charge .
Income taxes for financial reporting purposes differs from the amount computed by applying the statutory federal income tax rate of 35 percent for the three and nine months ended September 30, for the reasons below:
Table 21—Income Taxes
83
Three Months Ended September 30 2010 2009 (In millions)
Tax on income (loss) computed at statutory federal income tax rate $ (107 ) $ (228 ) Increase (decrease) in taxes resulting from:
State income tax, net of federal tax effect (12 ) (25 ) Affordable housing credits and other credits (28 ) (20 ) Bank-owned life insurance (8 ) (8 ) Lease financing 6 10 Tax-exempt income from obligations of states and political subdivisions (5 ) (5 ) Other, net 4 2
$ (150 ) $ (274 )
Effective tax rate 49.2 % 42.1 %
Table of Contents
Management’s determination of the realization of the net deferred tax asset, $1.1 billion at September 30, 2010, is based upon our judgment of various future events and uncertainties, including the timing, nature and amount of future taxable income earned by certain subsidiaries and the potential implementation of various plans to maximize realization of deferred tax assets and the reversal of taxable temporary differences. In making our determination of the realization of the net deferred tax asset, we have considered all positive and negative evidence available as of September 30, 2010.
The Company’s strong capital position and history of significant pre-tax earnings, among other items, provide positive evidence supporting realization of the deferred tax assets, which management believes outweighs the negative evidence of recent pre-tax losses. The majority of the net deferred tax asset is produced by differences between the financial statement carrying amounts and the corresponding tax bases of assets and liabilities. Of this amount, a significant portion relates to the allowance for loan losses that has not yet reduced taxable income and therefore, does not have a set expiration date as of September 30, 2010. At September 30, 2010, $171 million of the deferred tax asset relate to state net operating loss and state tax credit carryforwards, with various expiration periods beginning after the tax year 2012 extending through 2032 and $158 million relate to federal tax credit carryforwards with expiration periods beginning after the tax year 2028.
After considering all available evidence, management believes that the Company will generate sufficient income to realize the recognized net deferred tax asset. However, management does not believe that a portion of the state net operating loss carryforwards and state tax credit carryforwards will be realized. Accordingly, a valuation allowance has been established in the amount of $29 million against such benefits at September 30, 2010 compared to $25 million at September 30, 2009.
The Company is subject to taxation by multiple jurisdictions. It is reasonably possible that in the next twelve months the Internal Revenue Service will complete the field examination of the U.S. federal income tax returns for the tax years 2007, 2008 and 2009 and issue Revenue Agents’ Reports. With few exceptions, the Company is no longer subject to state and local income tax examinations for tax years before 2003. Currently, there are disputed tax positions taken in previously filed tax returns with certain states, including positions regarding investment and intellectual property subsidiaries. Management continues to evaluate these positions and intends to defend adjustments made by tax authorities. The Company does not anticipate the ultimate resolution would result in a material change to its financial position or results of operations.
As of September 30, 2010 and December 31, 2009, the liability for unrecognized tax benefits was approximately $33 million and $26 million, respectively. The balance of the Company’s unrecognized tax benefits as of September 30, 2010 and December 31, 2009 that would reduce the Company’s effective tax rate, if recognized, was $23 million and $18 million, respectively.
84
Nine Months Ended September 30 2010 2009 (In millions)
Tax on income (loss) computed at statutory federal income tax rate $ (360 ) $ (130 ) Increase (decrease) in taxes resulting from:
State income tax, net of federal tax effect (37 ) (35 ) Regulatory charge 70 — Affordable housing credits and other credits (77 ) (60 ) Bank-owned life insurance (23 ) (22 ) Lease financing 31 380 Tax-exempt income from obligations of states and political subdivisions (16 ) (17 ) Other, net 13 —
$ (399 ) $ 116
Effective tax rate 38.9 % 31.2 %
Table of Contents
For the three and nine months ended September 30, 2010, the Company recognized interest expense, before the impact of the federal and state deductions, related to prior years’ unrecognized tax benefits of $1 million, net of interest income. As of September 30, 2010 and December 31, 2009, the Company recognized a liability of approximately $10 million and $5 million, respectively, for interest related to unrecognized tax benefits, before the impact of the federal and state deductions.
Reference is made to pages 74 through 77 included in Management’s Discussion and Analysis.
Based on an evaluation, as of the end of the period covered by this Form 10-Q, under the supervision and with the participation of Regions’ management, including its Chief Executive Officer and Chief Financial Officer, the Chief Executive Officer and Chief Financial Officer have concluded that Regions’ disclosure controls and procedures (as defined in Rule 13a-15(e) under the Securities Exchange Act of 1934) are effective. During the quarter ended September 30, 2010, there have been no changes in Regions’ internal control over financial reporting that have materially affected, or are reasonably likely to materially affect, Regions’ internal control over financial reporting.
85
Item 3. Quantitative and Qualitative Disclosures about Market Risk
Item 4. Controls and Procedures
Table of Contents
PART II. OTHER INFORMATION
Information required by this item is set forth in Note 12 “Commitments and Contingencies” in the Notes to the Consolidated Financial Statements (Unaudited) in Part I. Item 1. of this report, which is incorporated herein by reference.
Recent legislation regarding the financial services industry may have a significant adverse effect on our operations.
On July 21, 2010, the Dodd-Frank Wall Street Reform and Consumer Protection Act was signed into law (the “Dodd-Frank Act”). The Dodd-Frank Act implements a variety of far-reaching changes and has been called the most sweeping reform of the financial services industry since the 1930s. Many of the provisions of the Dodd-Frank Act will directly affect our ability to conduct our business including:
Many provisions in the Dodd-Frank Act remain subject to regulatory rule-making and implementation, the effects of which are not yet known, including mandates requiring the Federal Reserve to establish compensation guidelines covering regulated financial institutions. In addition, further legislative and regulatory changes are still being considered, including the so called “bank tax” on institutions with greater than $50 billion in assets, such as Regions. The provisions of the Dodd-Frank Act and any rules adopted to implement those provisions as well as any additional legislative or regulatory changes may impact the profitability of our business activities, require that we change certain of our business practices, materially affect our business model or affect retention of key personnel, require us to raise additional regulatory capital, including additional Tier 1 Capital, and could expose us to additional costs (including increased compliance costs). These and other changes may also require us to invest significant management attention and resources to make any necessary changes and may adversely affect our ability to conduct our business as previously conducted or our results of operations or financial condition.
86
Item 1. Legal Proceedings
Item 1A. Risk Factors
• Imposition of higher prudential standards, including more stringent risk-based capital, leverage, liquidity and risk-management
requirements, and numerous other requirements on “systemically significant institutions,” currently defined to include, among other things, all bank holding companies with assets of at least $50 billion (which would include Regions);
• Mandates requiring the Federal Reserve to establish standards for determining whether interchange fees charged by certain financial
institutions are reasonable and proportional to the costs incurred by such institution;
• Imposition of additional costs and fees, including fees to be set by the Federal Reserve and charged to “systemically significant
institutions” to cover the cost of regulating such institutions and any FDIC assessment made to cover the costs of any regular or special examination of Regions or its affiliates;
• Establishment of a consumer financial protection bureau with broad authority to implement new consumer protection regulations and
to examine and enforce compliance with federal consumer laws;
• Application to bank holding companies of regulatory capital requirements similar to those applied to banks, which requirements exclude, on a phase-out basis, all trust preferred securities and cumulative preferred stock from Tier 1 Capital (except for preferred stock issued under the TARP, such as Regions Fixed Rate, Cumulative Perpetual Preferred Stock, Series A, which will continue to qualify as Tier 1 capital as long as it remains outstanding); and
• Establishment of new rules and restrictions regarding the origination of mortgages.
Table of Contents
We may be subject to more stringent capital requirements.
The Dodd-Frank Act requires the federal banking agencies to establish stricter risk-based capital requirements and leverage limits to apply to banks and bank holding companies. Under the legislation, the federal banking agencies would be required to develop capital requirements that address systemically risky activities. The capital rules must address, at a minimum, risks arising from significant volumes of activity in derivatives, securitized products, financial guarantees, securities borrowing and lending and repurchase agreements; concentrations in assets for which reported values are based on models; and concentrations in market share for any activity that would substantially disrupt financial markets if the institutions were forced to unexpectedly cease the activity. These requirements, and any other new regulations, could adversely affect our ability to pay dividends, or could require us to reduce business levels or to raise capital, including in ways that may adversely affect our results of operations or financial condition.
In addition, recent proposals published by the Basel Committee on Banking Supervision (the “Basel Committee”), if adopted, could lead to significantly higher capital requirements, higher capital charges and more restrictive leverage and liquidity ratios. In July and December 2009, the Basel Committee published proposals relating to, respectively, enhanced capital requirements for market risk and new capital and liquidity risk requirements for banks. On July 26, 2010, the Basel Committee announced that it had reached “broad agreement” on the December 2009 proposals and published a set of amendments to these proposals. On September 12, 2010, the Group of Governors and Heads of Supervisors of the Basel Committee, the oversight body of the Basel Committee, published its “calibrated” capital standards for major banking institutions (“Basel III”). Under these standards, when fully phased-in on January 1, 2019, banking institutions will be required to maintain heightened Tier 1 common equity, Tier 1 Capital and Total Capital ratios, as well as maintaining a “capital conservation buffer.” The Tier 1 common equity and Tier 1 Capital ratio requirements will be phased-in incrementally between January 1, 2013 and January 1, 2015; the deductions from common equity made in calculating Tier 1 common equity will be phased-in incrementally over a four-year period commencing on January 1, 2014; and the capital conservation buffer will be phased-in incrementally between January 1, 2016 and January 1, 2019. The Basel Committee also announced that a “countercyclical buffer” of 0% to 2.5% of common equity or other fully loss-absorbing capital “will be implemented according to national circumstances” as an “extension” of the conservation buffer. The final package of Basel III reforms will be considered in November 2010 by the leaders of the Group of 20, and then will be subject to individual adoption by member nations, including the United States. The ultimate impact of the new capital and liquidity standards on us cannot be determined at this time and will depend on a number of factors, including the treatment and implementation by the U.S. banking regulators.
Any reduction in our credit rating could increase the cost of our funding from the capital markets and/or place limitations on business activities related to credit support provided to customers.
The major rating agencies regularly evaluate us and their ratings of our long-term debt based on a number of factors, including our financial strength and conditions affecting the financial services industry generally. Over the past approximately 18 months, all of the major ratings agencies downgraded Regions’ and Regions Bank’s credit ratings. In addition, many of our ratings remain on negative watch or negative outlook. Negative outlook, negative watch or other similar terms mean that a future downgrade is possible. The ratings assigned to Regions and Regions Bank remain subject to change at any time, and it is possible that any ratings agency will take action to downgrade Regions, Regions Bank or both in the future. During April 2010, Moody’s Investor Services (“Moody’s”) announced, among other things, that the debt and deposit ratings of the seventeen largest U.S. banking institutions, including Regions and Regions Bank, could be negatively affected by the loss of implicit government support contained in the financial regulatory reform legislation that was then being debated in Congress. In its April announcement, Moody’s stated that its rating of Regions Bank benefited by 2 notches and its rating of Regions benefited by 1 notch from Moody’s assumption regarding government support. After the passage of the Dodd-Frank Act in July 2010, Moody’s indicated that it was reviewing for possible downgrade the ratings of the ten largest U.S. regional banks and their affiliated holding companies, including Regions and Regions Bank. Moody’s stated that it had incorporated extraordinary support into the banks’ ratings in 2009 when the U.S. banking system was in turmoil and the government clearly stated that there would be extraordinary
87
Table of Contents
support for the larger regional banks. Now that the U.S. banking system has moved beyond the depths of the financial crisis, the probability of government support for these banks could be lower, in Moody’s view. Additionally, although government authorities had the power to resolve these institutions prior to the recent enactment of the Dodd-Frank Act, Moody’s believes that the new law signals the potential that government support for these banks will be reduced. On November 1, 2010, Moody’s downgraded the obligations of Regions Financial Corporation and Regions Bank. As a result of the downgrade, the long-term debt rating of Regions Financial Corporation is below investment grade.
In general, ratings agencies base their ratings on many quantitative and qualitative factors, including capital adequacy, liquidity, asset quality, business mix and level and quality of earnings, and we may not be able to maintain our current credit ratings. In addition, ratings agencies have themselves been subject to scrutiny arising from the financial crisis such that the rating agencies may make or may be required to make substantial changes to their ratings policies and practices. Such changes may, among other things, adversely affect the ratings of our securities or other securities in which we have an economic interest. Any decrease in credit ratings to a non-investment grade rating by one or more ratings agencies, could impact our access to the capital markets or short-term funding and/or increase our financial costs, and thereby adversely affect Regions’ financial condition and liquidity. Currently, ratings on Regions’ parent company senior notes from Standard & Poor’s, Fitch Ratings and Dominion Bond Ratings Service are 1, 3 and 3 notches, respectively, above non-investment grade ratings. As stated above, on November 1, 2010, Moody’s downgraded the obligations of Regions Financial Corporation and Regions Bank. As a result of the downgrade, the long-term debt rating of Regions Financial Corporation is below investment grade. Where Regions is providing forms of credit support such as letters of credit, standby lending arrangements or other forms of credit support, a decline in short-term credit ratings may require that customers of Regions seek replacement credit support from a higher rated institution. Our counterparties are also sensitive to the risk of a ratings downgrade and have the ability to terminate or may be less likely to engage in transactions with us, or may only engage in them at a substantially higher cost, if our ratings were downgraded to below investment grade. We cannot predict whether customer relationships or opportunities for future relationships could be adversely affected by customers who choose to do business with a higher rated institution.
Future adverse regulatory developments could impact the carrying value of goodwill.
During the second quarter of 2010, Regions recorded a $200 million regulatory charge in the Investment Banking/Brokerage/Trust reporting unit. Future adverse developments related to the regulatory matter could develop which could negatively impact the carrying value of goodwill.
Information concerning Regions’ repurchases of its outstanding common stock during the three-month period ended September 30, 2010, is set forth in the following table:
Issuer Purchases of Equity Securities
On January 18, 2007, Regions’ Board of Directors authorized the repurchase of 50 million shares of Regions’ common stock through open market or privately negotiated transactions and announced the authorization of this repurchase. As indicated in the table above, approximately 23.1 million shares remain available for repurchase under the existing plan.
88
Item 2. Unregistered Sales of Equity Securities and Use of Proceeds
Period Total Number of Shares Purchased
Average Price Paid
per Share
Total Number of Shares
Purchased as Part of Publicly Announced Plans or Programs
Maximum Number
of Shares that May
Yet Be Purchased Under the Plans or
Programs
July 1 – 31, 2010 — — — 23,072,300 August 1 – 31, 2010 — — — 23,072,300 September 1 – 30, 2010 — — — 23,072,300 Total — — — 23,072,300
Table of Contents
Restrictions on Dividends and Repurchase of Stock
Holders of Regions common stock are only entitled to receive such dividends as Regions’ Board of Directors may declare out of funds legally available for such payments. Furthermore, holders of Regions common stock are subject to the prior dividend rights of any holders of Regions preferred stock then outstanding. As of September 30, 2010, there were 3,500,000 shares of Regions’ Fixed Rate Cumulative Perpetual Preferred Stock Series A (the “Series A Preferred Stock”) with a liquidation amount of $1,000 per share, issued and outstanding. Under the terms of the Series A Preferred Stock, Regions’ ability to declare and pay dividends on or repurchase Regions’ common stock will be subject to restrictions in the event Regions fails to declare and pay (or set aside for payment) full dividends on the Series A Preferred Stock.
As long as the Series A Preferred Stock is outstanding, dividend payments and repurchases or redemptions relating to certain equity securities, including Regions common stock, are prohibited during any period there are accrued and unpaid dividends on such preferred stock, subject to certain limited exceptions. In addition, prior to November 14, 2011, unless Regions has redeemed all of the Series A Preferred Stock or the U.S. Treasury has transferred all of the Series A Preferred Stock to third parties, the consent of the U.S. Treasury will be required for Regions to, among other things, increase its common stock dividend above $0.10 except in limited circumstances. Regions has reduced its quarterly dividend to $0.01 per share and does not expect to increase its quarterly dividend above such level for the foreseeable future. Also, Regions is a bank holding company, and its ability to declare and pay dividends is dependent on certain federal regulatory considerations, including the guidelines of the Federal Reserve regarding capital adequacy and dividends.
In addition, the terms of Regions’ outstanding junior subordinated debt securities prohibit it from declaring or paying any dividends or distributions on Regions’ capital stock, including its common stock, or purchasing, acquiring, or making a liquidation payment on such stock, if Regions has given notice of its election to defer interest payments but the related deferral period has not yet commenced or a deferral period is continuing. Regions has not elected to defer interest payments on its junior subordinated debt securities.
The following is a list of exhibits including items incorporated by reference
89
Item 6. Exhibits
3.1
Amended and Restated Certificate of Incorporation filed as Exhibit 3.1 to Form 8-K Current Report filed by registrant on May 14, 2010, incorporated herein by reference
3.2
Certificate of Designations filed as Exhibit 3.1 to Form 8-K Current Report filed by registrant on November 18, 2008, incorporated herein by reference
3.3
By-laws as amended and restated filed as Exhibit 3.2 to Form 8-K Current Report filed by registrant on May 14, 2010, incorporated herein by reference
10.1 Amendment, effective August 31, 2010, to Regions Financial Corporation 2010 Long Term Incentive Plan
12 Computation of Ratio of Earnings to Fixed Charges
31.1 Certification of Chief Executive Officer pursuant to Section 302 of the Sarbanes-Oxley Act of 2002
31.2 Certification of Chief Financial Officer pursuant to Section 302 of the Sarbanes-Oxley Act of 2002
32 Certification pursuant to 18 U.S.C. Section 1350, as adopted pursuant to Section 906 of the Sarbanes- Oxley Act of 2002
101 Interactive Data File
Table of Contents
SIGNATURES
Pursuant to the requirements of the Securities Exchange Act of 1934, the registrant has duly caused this report to be signed on its behalf by undersigned thereunto duly authorized.
90
Regions Financial Corporation DATE: November 3, 2010
/s/ H ARDIE B. K IMBROUGH , JR .
Hardie B. Kimbrough, Jr. Executive Vice President and Controller
(Chief Accounting Officer and Authorized Officer)
EXHIBIT 10.1
REGIONS FINANCIAL CORPORATION 2010 LONG TERM INCENTIVE PLAN
Section 12 of the Plan is hereby amended in its entirety to read as follows:
12. OTHER A WARDS
The Committee may grant other types of equity-based or equity-related Awards (including unrestricted shares of Stock) in such amounts and subject to such terms and conditions as the Committee will determine and may include, without limitation, Awards that upon grant are fully vested and non-forfeitable. However, the Committee’s ability to grant Other Awards is limited to those situations where such grant is made in lieu of cash compensation. Such Other Awards may entail the issue or transfer of actual shares of Stock or otherwise of amounts based on the value of shares of Stock. The terms and conditions applicable to Other Awards will be as determined by the Committee and set forth in an Award Agreement.
EXHIBIT 12
Regions Financial Corporation
Computation of Ratio of Earnings to Fixed Charges
(Unaudited)
Three Months Ended
September 30 Nine Months Ended
September 30 2010 2009 2010 2009 (Amounts in millions)
Excluding Interest on Deposits
Income (loss) before income taxes $ (305 ) $ (651 ) $ (1,027 ) $ (372 ) Fixed charges excluding preferred stock dividends and accretion 139 188 446 616
Income (loss) for computation excluding interest on deposits (166 ) (463 ) (581 ) 244
Interest expense excluding interest on deposits 123 168 395 562 One-third of rent expense 16 20 51 54 Preferred stock dividends and accretion 54 60 171 167
Fixed charges including preferred stock dividends and accretion 193 248 617 783
Ratio of earnings to fixed charges, excluding interest on deposits (0.86 )x (1.87 )x (0.94 )x 0.31x
Including Interest on Deposits
Income (loss) before income taxes $ (305 ) $ (651 ) $ (1,027 ) $ (372 ) Fixed charges excluding preferred stock dividends and accretion 306 489 1,049 1,613
Income (loss) for computation including interest on deposits 1 (162 ) 22 1,241
Interest expense including interest on deposits 290 469 998 1,559 One-third of rent expense 16 20 51 54 Preferred stock dividends and accretion 54 60 171 167
Fixed charges including preferred stock dividends and accretion 360 549 1,220 1,780
Ratio of earnings to fixed charges, including interest on deposits 0.00x (0.30 )x 0.02x 0.70x
EXHIBIT 31.1
CERTIFICATION
I, O.B. Grayson Hall, Jr., certify that:
1. I have reviewed this quarterly report on Form 10-Q of Regions Financial Corporation; 2. Based on my knowledge, this report does not contain any untrue statement of a material fact or omit to state a material fact necessary to
make the statements made, in light of the circumstances under which such statements were made, not misleading with respect to the period covered by this report;
3. Based on my knowledge, the financial statements, and other financial information included in this report, fairly present in all material respects the financial condition, results of operations and cash flows of the registrant as of, and for, the periods presented in this report;
4. The registrant’s other certifying officer and I are responsible for establishing and maintaining disclosure controls and procedures (as defined in Exchange Act Rules 13a-15(e) and 15d-15(e)) and internal control over financial reporting (as defined in Exchange Act Rules 13a-15(f) and 15d-15(f)) for the registrant and have:
a) Designed such disclosure controls and procedures, or caused such disclosure controls and procedures to be designed under our
supervision, to ensure that material information relating to the registrant, including its consolidated subsidiaries, is made known to us by others within those entities, particularly during the period in which this report is being prepared;
b) Designed such internal control over financial reporting, or caused such internal control over financial reporting to be designed under
our supervision, to provide reasonable assurance regarding the reliability of financial reporting and the preparation of financial statements for external purposes in accordance with generally accepted accounting principles;
c) Evaluated the effectiveness of the registrant’s disclosure controls and procedures and presented in this report our conclusions about
the effectiveness of the disclosure controls and procedures, as of the end of the period covered by this report based on such evaluation; and
d) Disclosed in this report any change in the registrant’s internal control over financial reporting that occurred during the registrant’s
most recent fiscal quarter (the registrant’s fourth fiscal quarter in the case of an annual report) that has materially affected, or is reasonably likely to materially affect, the registrant’s internal control over financial reporting; and
5. The registrant’s other certifying officer and I have disclosed, based on our most recent evaluation of internal control over financial reporting, to the registrant’s auditors and the audit committee of the registrant’s board of directors (or persons performing the equivalent functions):
a) All significant deficiencies and material weaknesses in the design or operation of internal control over financial reporting which are
reasonably likely to adversely affect the registrant’s ability to record, process, summarize and report financial information; and
b) Any fraud, whether or not material, that involves management or other employees who have a significant role in the registrant’s
internal control over financial reporting.
Date: November 3, 2010 /s/ O. B. G RAYSON H ALL , J R . O. B. Grayson Hall, Jr. Chief Executive Officer
EXHIBIT 31.2
CERTIFICATION
I, David J. Turner, Jr., certify that:
1. I have reviewed this quarterly report on Form 10-Q of Regions Financial Corporation; 2. Based on my knowledge, this report does not contain any untrue statement of a material fact or omit to state a material fact necessary to
make the statements made, in light of the circumstances under which such statements were made, not misleading with respect to the period covered by this report;
3. Based on my knowledge, the financial statements, and other financial information included in this report, fairly present in all material respects the financial condition, results of operations and cash flows of the registrant as of, and for, the periods presented in this report;
4. The registrant’s other certifying officer and I are responsible for establishing and maintaining disclosure controls and procedures (as defined in Exchange Act Rules 13a-15(e) and 15d-15(e)) and internal control over financial reporting (as defined in Exchange Act Rules 13a-15(f) and 15d-15(f)) for the registrant and have:
a) Designed such disclosure controls and procedures, or caused such disclosure controls and procedures to be designed under our
supervision, to ensure that material information relating to the registrant, including its consolidated subsidiaries, is made known to us by others within those entities, particularly during the period in which this report is being prepared;
b) Designed such internal control over financial reporting, or caused such internal control over financial reporting to be designed under
our supervision, to provide reasonable assurance regarding the reliability of financial reporting and the preparation of financial statements for external purposes in accordance with generally accepted accounting principles;
c) Evaluated the effectiveness of the registrant’s disclosure controls and procedures and presented in this report our conclusions about
the effectiveness of the disclosure controls and procedures, as of the end of the period covered by this report based on such evaluation; and
d) Disclosed in this report any change in the registrant’s internal control over financial reporting that occurred during the registrant’s
most recent fiscal quarter (the registrant’s fourth fiscal quarter in the case of an annual report) that has materially affected, or is reasonably likely to materially affect, the registrant’s internal control over financial reporting; and
5. The registrant’s other certifying officer and I have disclosed, based on our most recent evaluation of internal control over financial reporting, to the registrant’s auditors and the audit committee of the registrant’s board of directors (or persons performing the equivalent functions):
a) All significant deficiencies and material weaknesses in the design or operation of internal control over financial reporting which are
reasonably likely to adversely affect the registrant’s ability to record, process, summarize and report financial information; and
b) Any fraud, whether or not material, that involves management or other employees who have a significant role in the registrant’s
internal control over financial reporting.
Date: November 3, 2010 /s/ D AVID J. T URNER , J R . David J. Turner, Jr. Chief Financial Officer
EXHIBIT 32
CERTIFICATION PURSUANT TO 18 U.S.C. SECTION 1350,
AS ADOPTED PURSUANT TO SECTION 906 OF THE SARBANES-OXLEY ACT OF 2002
In connection with the Quarterly Report of Regions Financial Corporation (the “Company”) on Form 10-Q for the quarter ending September 30, 2010 (the “Report”), I, O.B. Grayson Hall, Jr., Chief Executive Officer of the Company, and David J. Turner, Jr., Chief Financial Officer of the Company, certify, pursuant to 18 U.S.C. § 1350, as adopted pursuant to § 906 of the Sarbanes-Oxley Act of 2002, that to our knowledge:
November 3, 2010
A signed original of this written statement required by Section 906, or other document authenticating, acknowledging, or otherwise adopting the signatures that appear in typed form within the electronic version of this written statement required by Section 906, has been provided to Regions Financial Corporation and will be retained by Regions Financial Corporation and furnished to the Securities and Exchange Commission or its staff upon request.
1) The Report fully complies with the requirements of Section 13(a) or 15(d) of the Securities Exchange Act of 1934; and
2) The information contained in the Report fairly presents, in all material respects, the financial condition and results of operations of
the Company.
/s/ O. B. G RAYSON H ALL , J R . /s/ D AVID J. T URNER , J R . O. B. Grayson Hall, Jr. David J. Turner, Jr. Chief Executive Officer Chief Financial Officer