Gibson Institute for Land, Food and Environment Institute for a Sustainable World Marco Boeri Gibson Institute for Land, Food and the Environment, Queens University Belfast T.: +44(0)28 9097 2102, F: +44(0)28 9097 5877 E: [email protected]FEEM Seminar - Monday 13 February 2012 - h. 12.00 - Milan Milan: FEEM, Sala Consiglio Venice: FEEM, Sala Riunioni (videoconference) Regret minimization and utility maximization: the approach and four case studies
Transcript
Gibson Institute for Land, Food and Environment Institute for a Sustainable World
Marco BoeriGibson Institute for Land, Food and the Environment,
Queens University BelfastT.: +44(0)28 9097 2102, F: +44(0)28 9097 5877
People may aim to minimize regret when choosing (Chorus et al., 2006, 2008, Chorus, 2010, Chorus and de Jong, 2011, Thiene
et al, 2011)
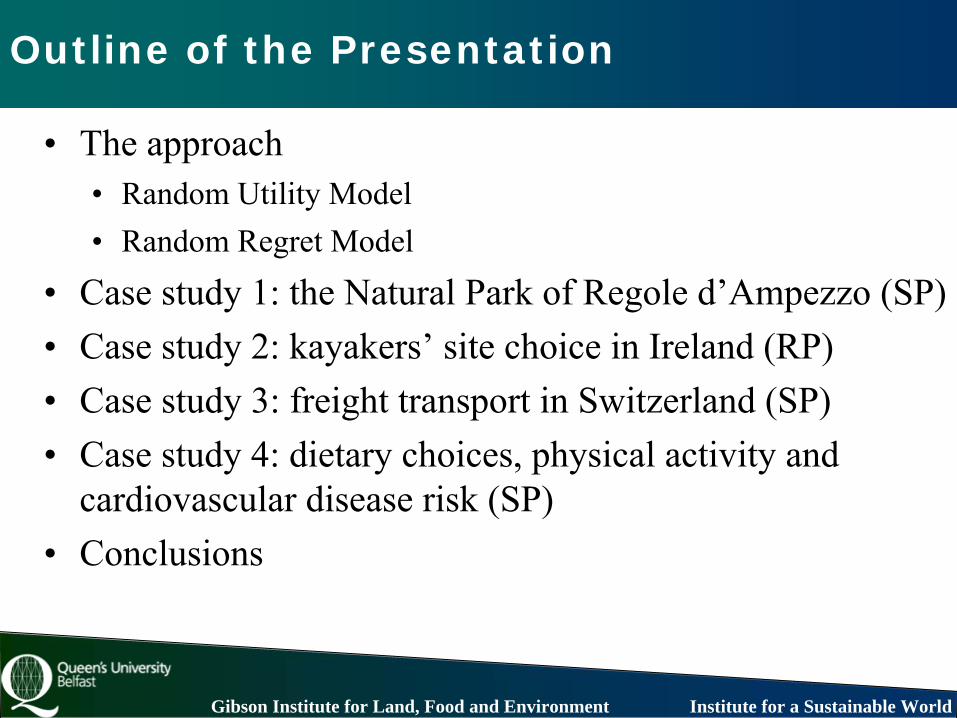
The Random Utility Model
Gibson Institute for Land, Food and Environment Institute for a Sustainable World
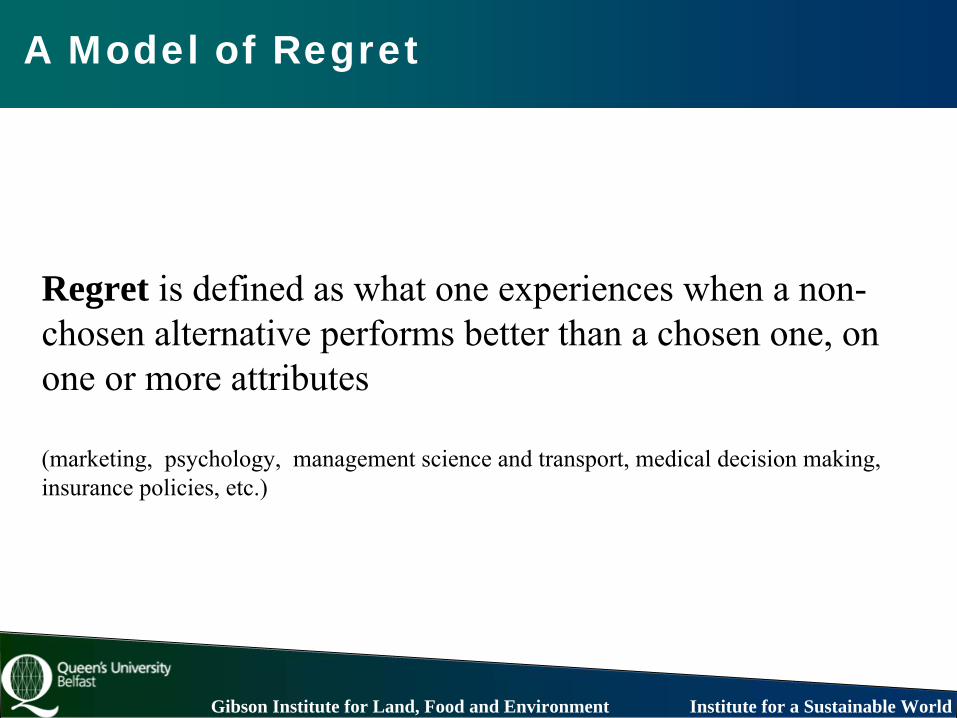
Regret is defined as what one experiences when a non- chosen alternative performs better than a chosen one, on
one or more attributes
(marketing, psychology, management science and transport, medical decision making, insurance policies, etc.)
A Model of Regret
Gibson Institute for Land, Food and Environment Institute for a Sustainable World
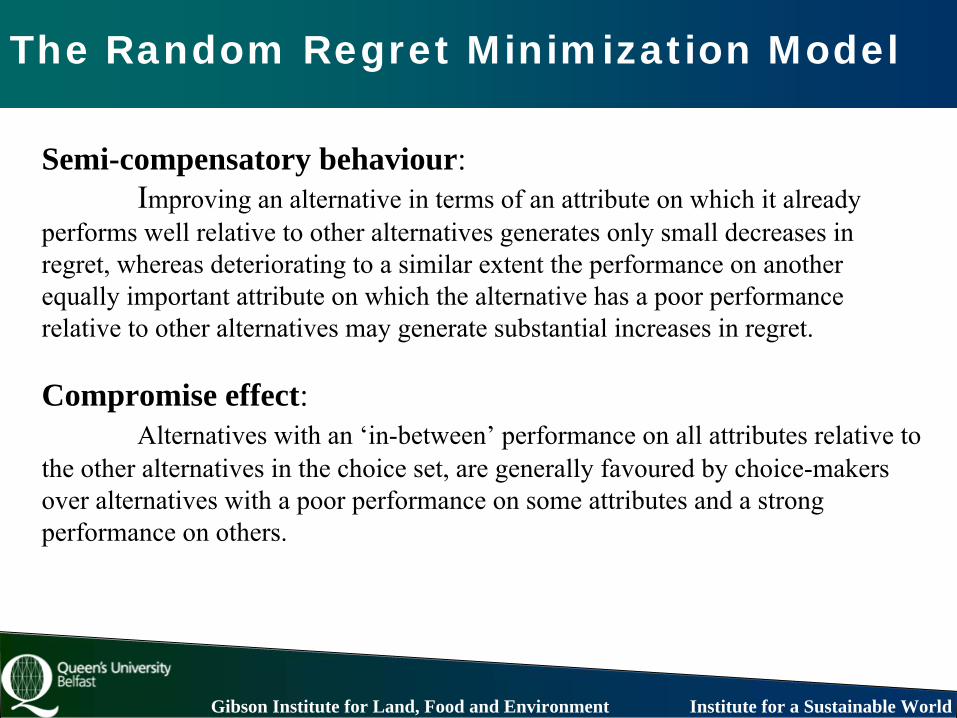
Semi-compensatory behaviour: Improving an alternative in terms of an attribute on which it already
performs well relative to other alternatives generates only small decreases in regret, whereas deteriorating to a similar extent the performance on another equally important attribute on which the alternative has a poor performance relative to other alternatives may generate substantial increases in regret.
Compromise effect: Alternatives with an ‘in-between’
performance on all attributes relative to
the other alternatives in the choice set, are generally favoured
by choice-makers over alternatives with a poor performance on some attributes and
a strong
performance on others.
The Random Regret Minimization Model
Gibson Institute for Land, Food and Environment Institute for a Sustainable World
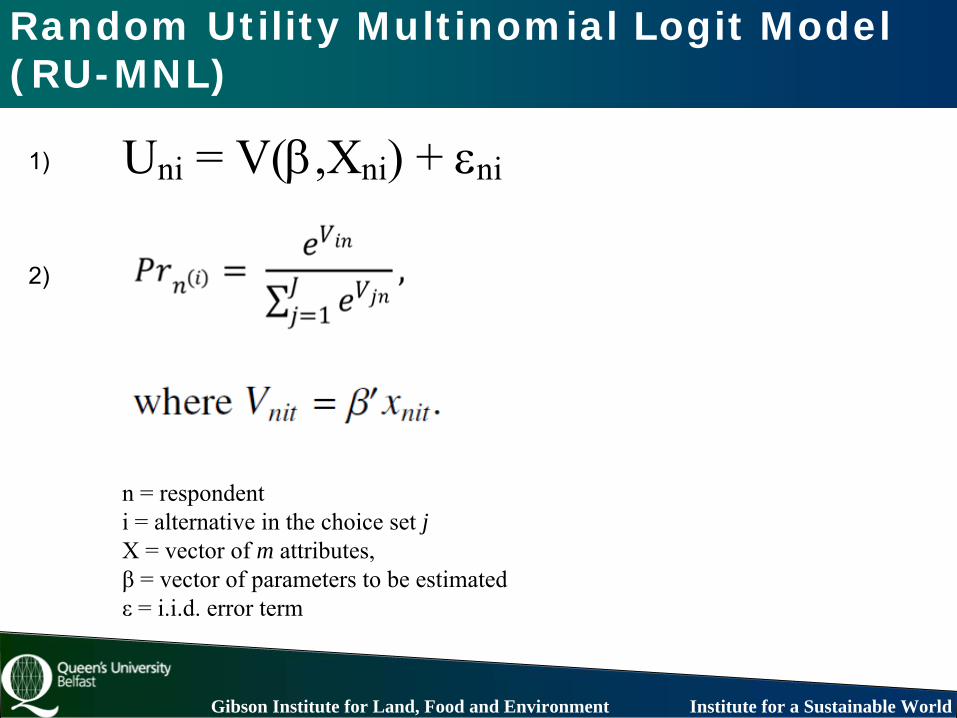
Random Utility Multinomial Logit Model (RU-MNL)
Uni = V(β,Xni) + εni
n = respondenti = alternative in the choice set jX = vector of m attributes, β
= vector of parameters to be estimated
ε
= i.i.d. error term
1)
2)
Gibson Institute for Land, Food and Environment Institute for a Sustainable World
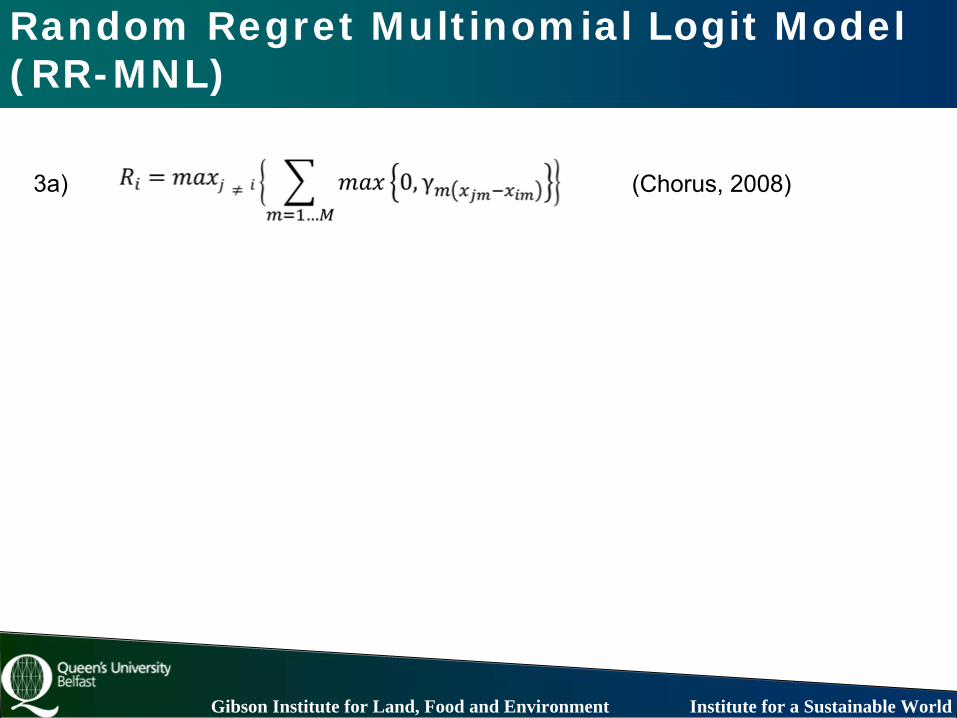
Random Regret Multinomial Logit Model (RR-MNL)
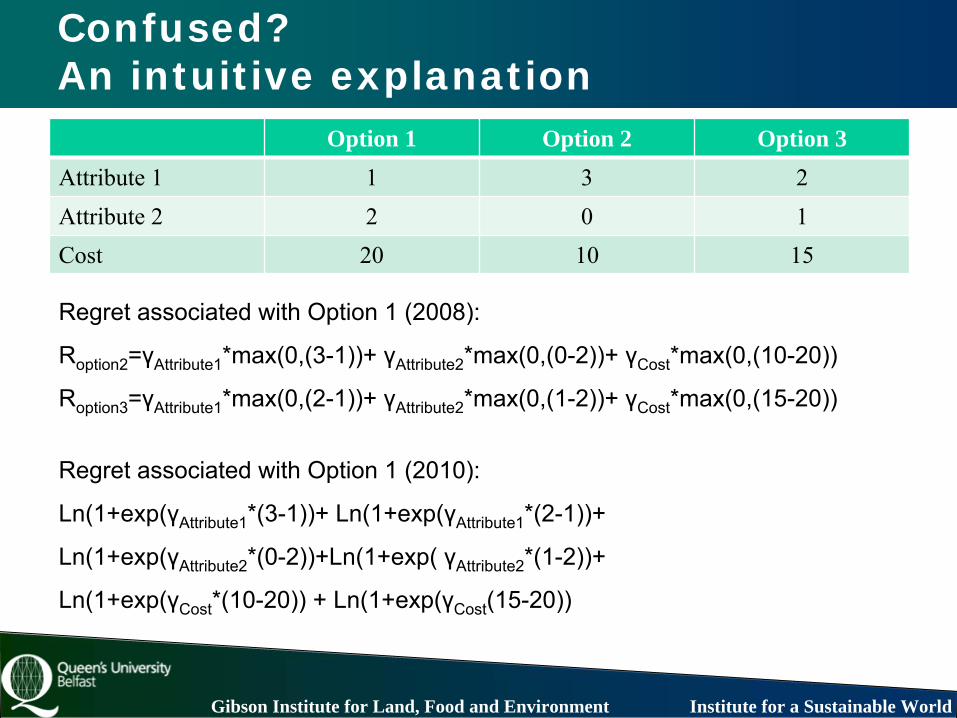
3a) (Chorus, 2008)
Gibson Institute for Land, Food and Environment Institute for a Sustainable World
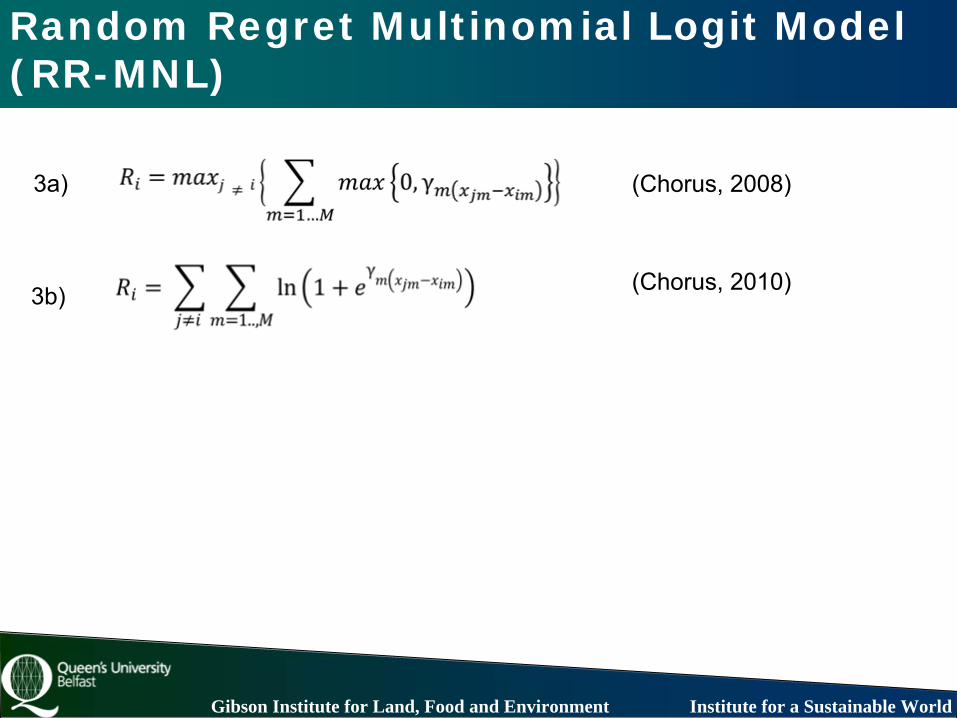
Random Regret Multinomial Logit Model (RR-MNL)
3b)
3a) (Chorus, 2008)
(Chorus, 2010)
Gibson Institute for Land, Food and Environment Institute for a Sustainable World
Gibson Institute for Land, Food and Environment Institute for a Sustainable World
RUM RRM
Change in choice
probability
Total
change
Change in choice
probability
Total
change
Alternative affected (Average effect) -3.10% -100.00% -2.06% -100.00%
Other Alternative (Average effect) 1.52% 48.81% 0.98% 47.53%
Status Quo (Average effect) 1.58% 51.19% 1.08% 52.47%
POLICY SCENARIO:
Predicted change in choice probabilities due to an Predicted change in choice probabilities due to an increase of entrance fee by 15 % increase of entrance fee by 15 %
Gibson Institute for Land, Food and Environment Institute for a Sustainable World
Marco Boeri,* Alberto Longo,* Edel Doherty,** Stephen Hynes**
*Gibson Institute for Land, Food and the Environment, Queens University Belfast
**National University of Ireland, Galway
Site Choices in Recreational Demand: A Matter of Utility
Maximization or Regret Minimization?
Gibson Institute for Land, Food and Environment Institute for a Sustainable World
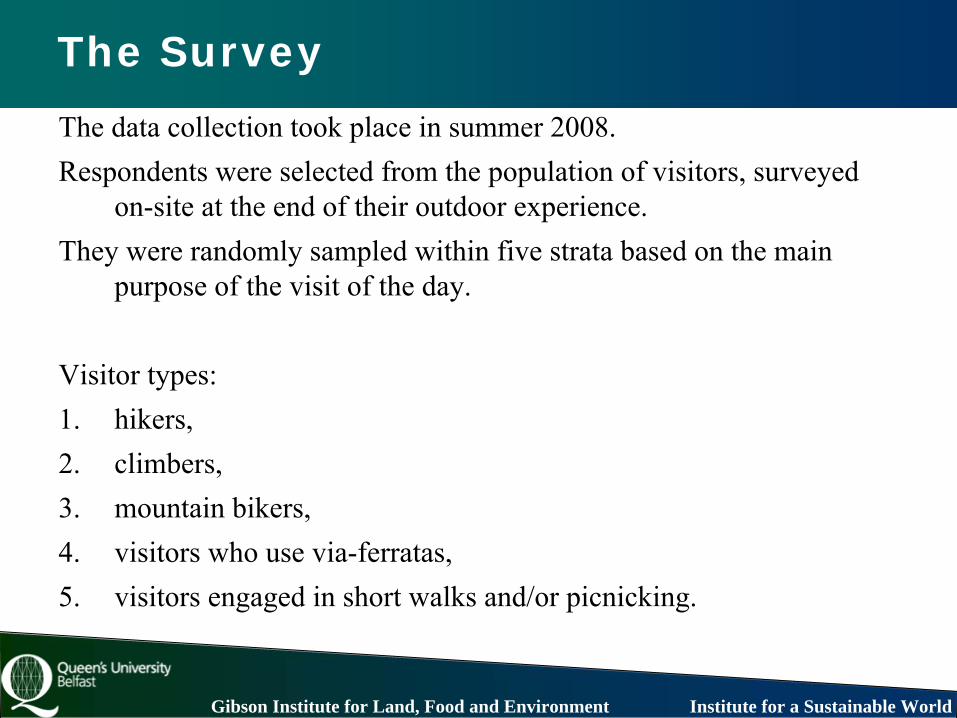
Kayakers’ site choice in IrelandMulti-site travel cost model. Respondents were asked to indicate how
many trips they had made to each of the eleven whitewater sites in the previous year.
Attributes used:•
Quality of parking at the site
•
Degree of expected crowding at the site •
Quality of the kayaking experience as measured by the star rating system used in the Irish Whitewater
Guidebook
•
Water quality •
Scenic quality
•
Reliability of water information•
Travel cost
Gibson Institute for Land, Food and Environment Institute for a Sustainable World
Sample
•
Kayakers were surveyed from lists obtained from the Irish Kayakers Association, from the Outdoor Adventure Store, and the Irish kayaking instruction company H2O Extreme
•
279 useable responses from kayakers •
3,466 usable choices
Gibson Institute for Land, Food and Environment Institute for a Sustainable World
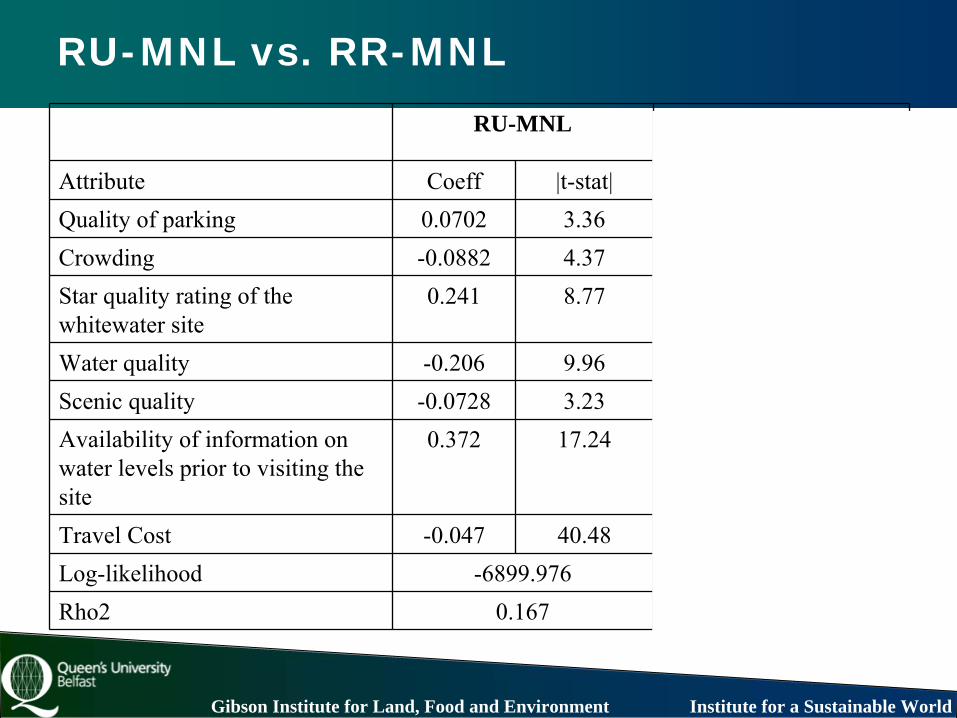
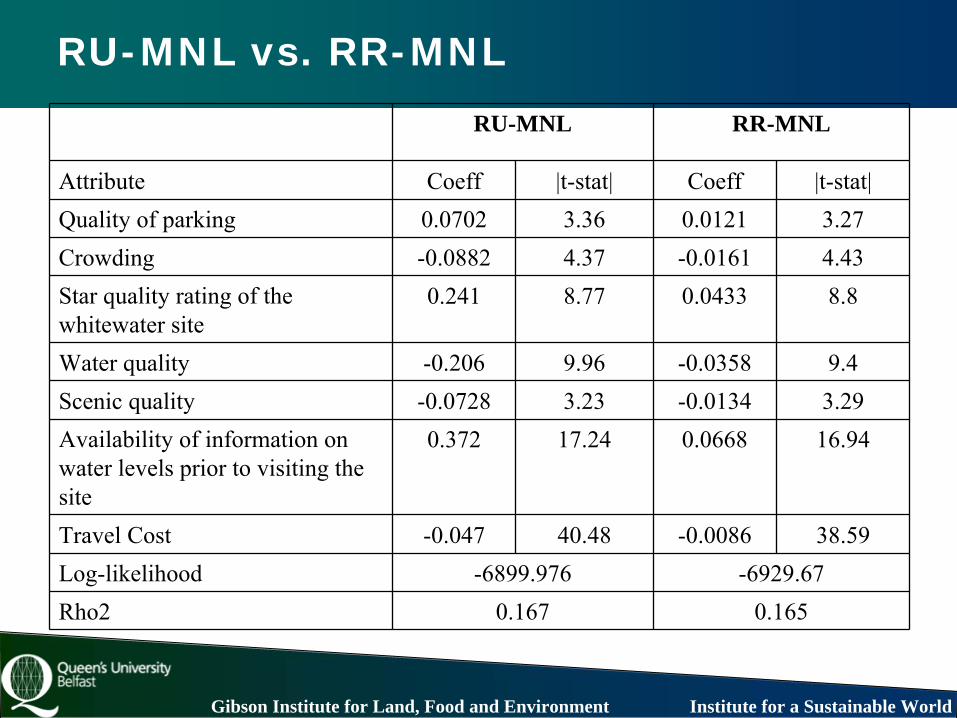
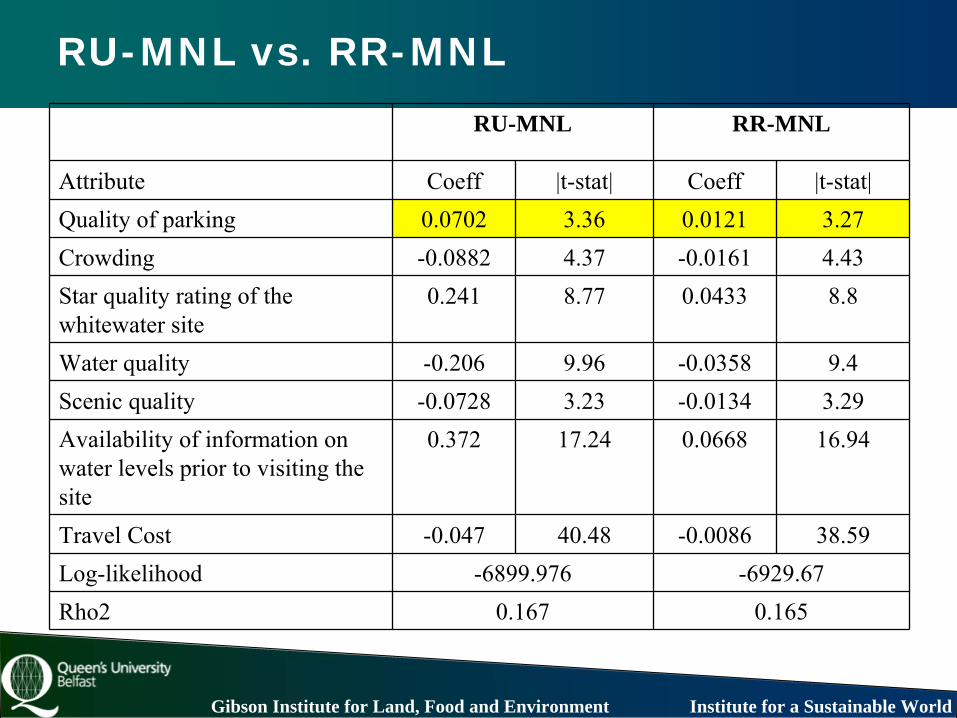
RU-MNL vs. RR-MNLRU-MNL RR-MNL
Attribute Coeff |t-stat| Coeff |t-stat|Quality of parking 0.0702 3.36 0.0121 3.27Crowding -0.0882 4.37 -0.0161 4.43Star quality rating of the whitewater
site
0.241 8.77 0.0433 8.8
Water quality -0.206 9.96 -0.0358 9.4Scenic quality -0.0728 3.23 -0.0134 3.29Availability of information on water levels prior to visiting the site
Gibson Institute for Land, Food and Environment Institute for a Sustainable World
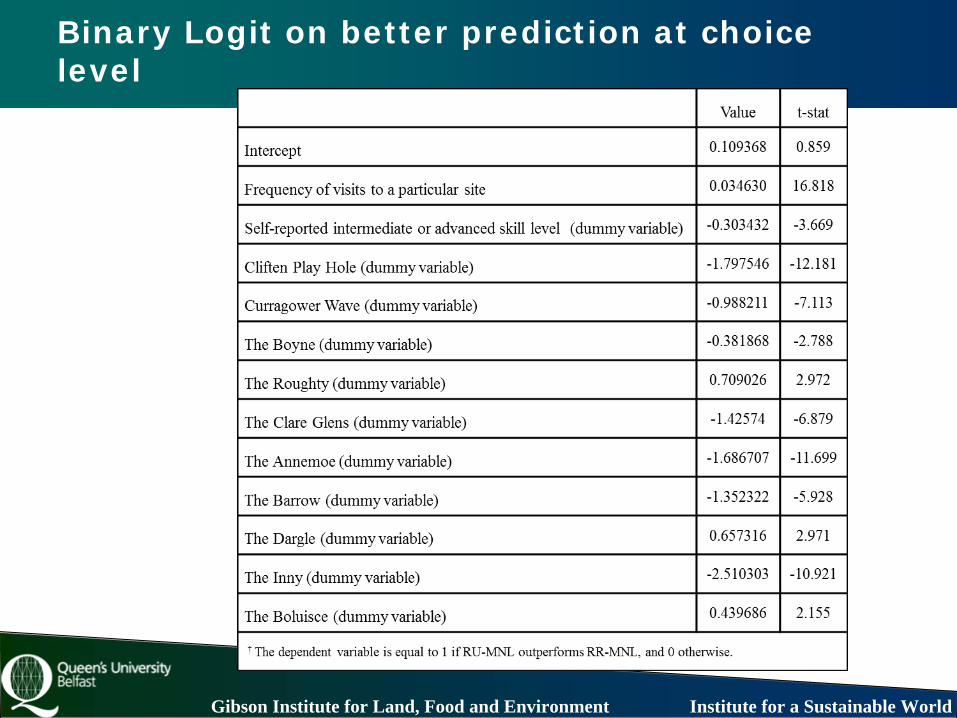
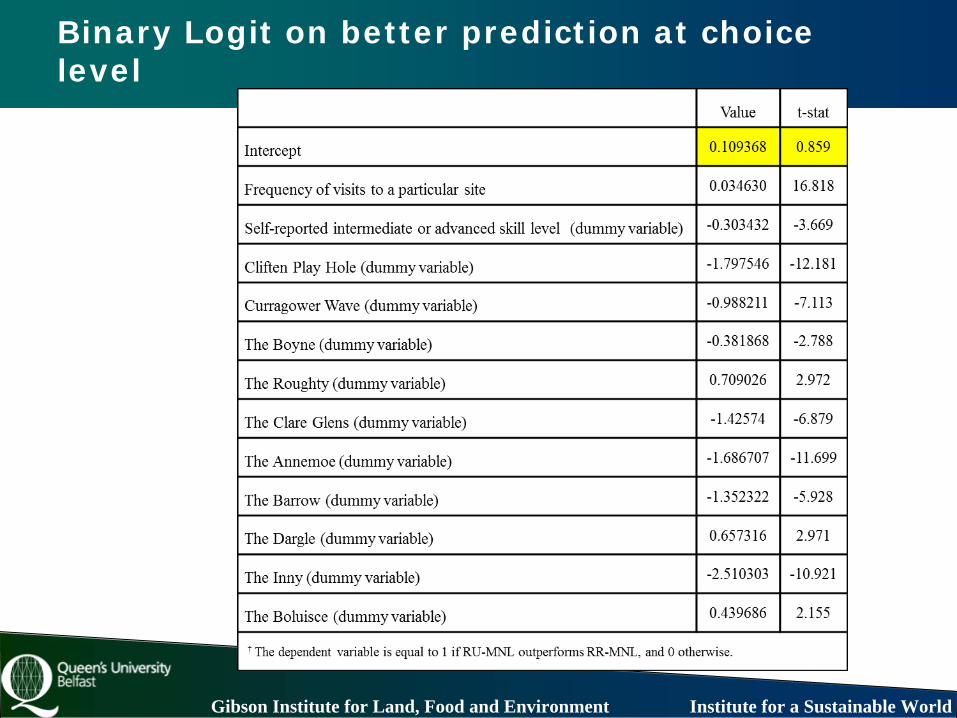
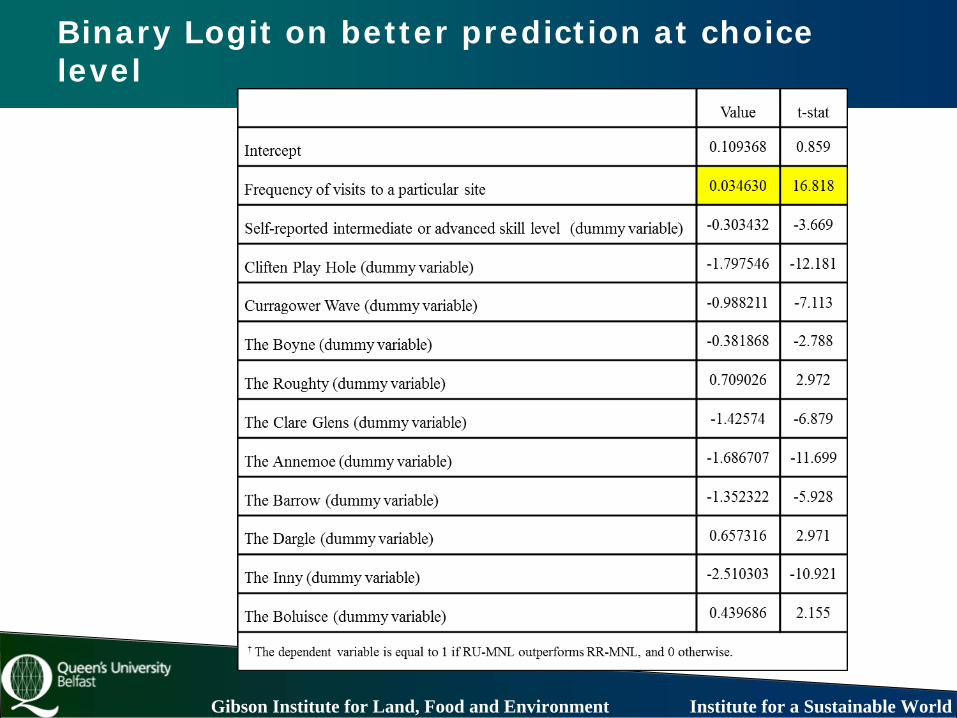
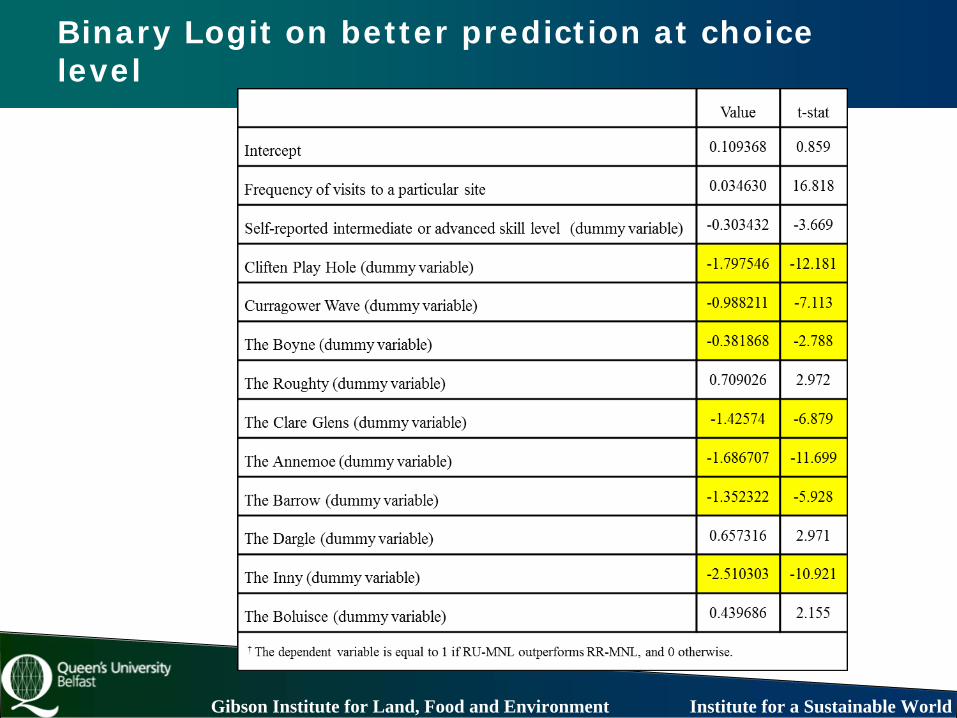
Which model is better?
…difficult question…We compute the contribution to the value of the Log-likelihood
function for each choice under both the RU-MNL and the RR-MNL. We create a dummy variable equal to 1 when the Log-likelihood of the
RU-MNL outperforms the Log-likelihood of the RR-MNL, and 0 otherwise.
We run a logit
regression on this variable where the characteristics of the choice, respondent and chosen site are used as explanatory variables:
P(d)nti = 1/(1+exp(-α+γ'Znti)) 5)
Gibson Institute for Land, Food and Environment Institute for a Sustainable World
Binary Logit on better prediction at choice level
Gibson Institute for Land, Food and Environment Institute for a Sustainable World
Binary Logit on better prediction at choice level
Gibson Institute for Land, Food and Environment Institute for a Sustainable World
Binary Logit on better prediction at choice level
Gibson Institute for Land, Food and Environment Institute for a Sustainable World
Binary Logit on better prediction at choice level
Gibson Institute for Land, Food and Environment Institute for a Sustainable World
Binary Logit on better prediction at choice level
Gibson Institute for Land, Food and Environment Institute for a Sustainable World
Policy analysis: Logsum
6)
7)
Gibson Institute for Land, Food and Environment Institute for a Sustainable World
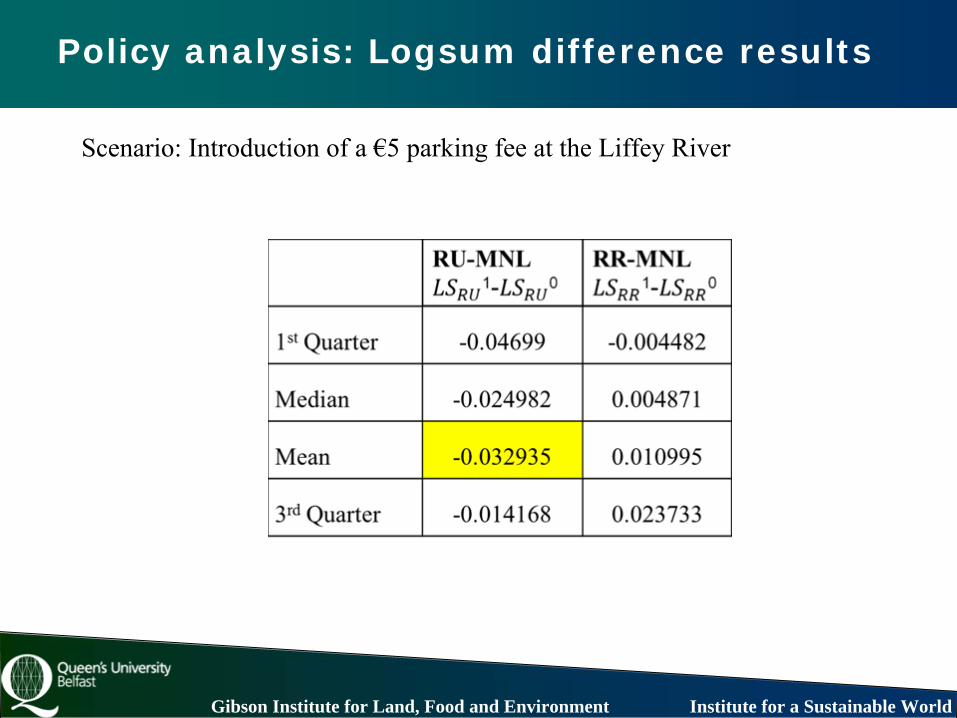
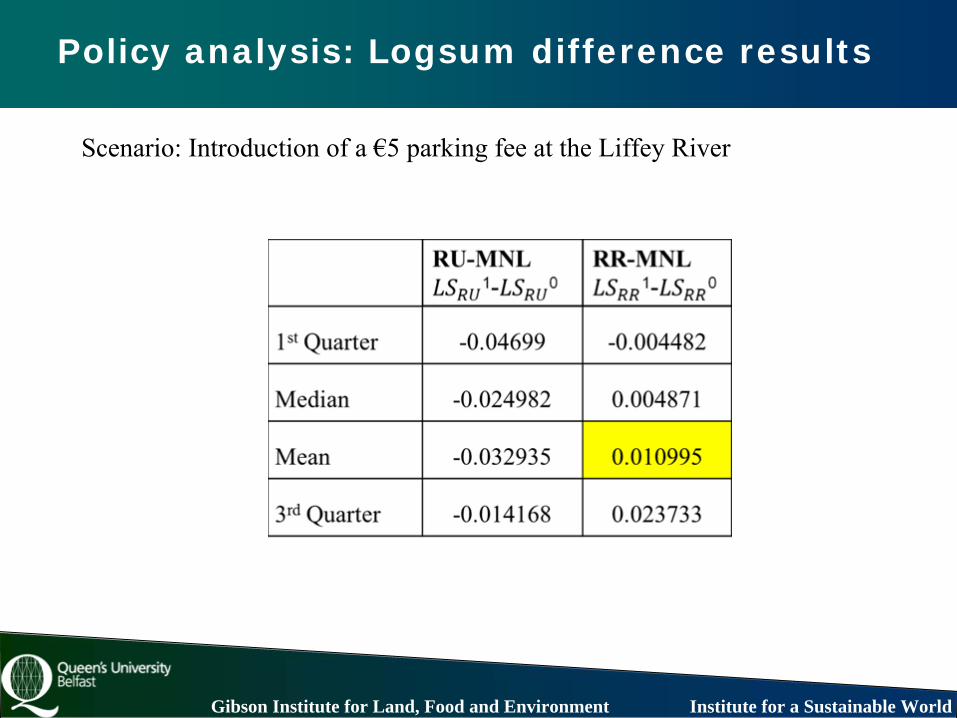
Policy analysis: Logsum difference results
Scenario: Introduction of a €5 parking fee at the Liffey
River
Gibson Institute for Land, Food and Environment Institute for a Sustainable World
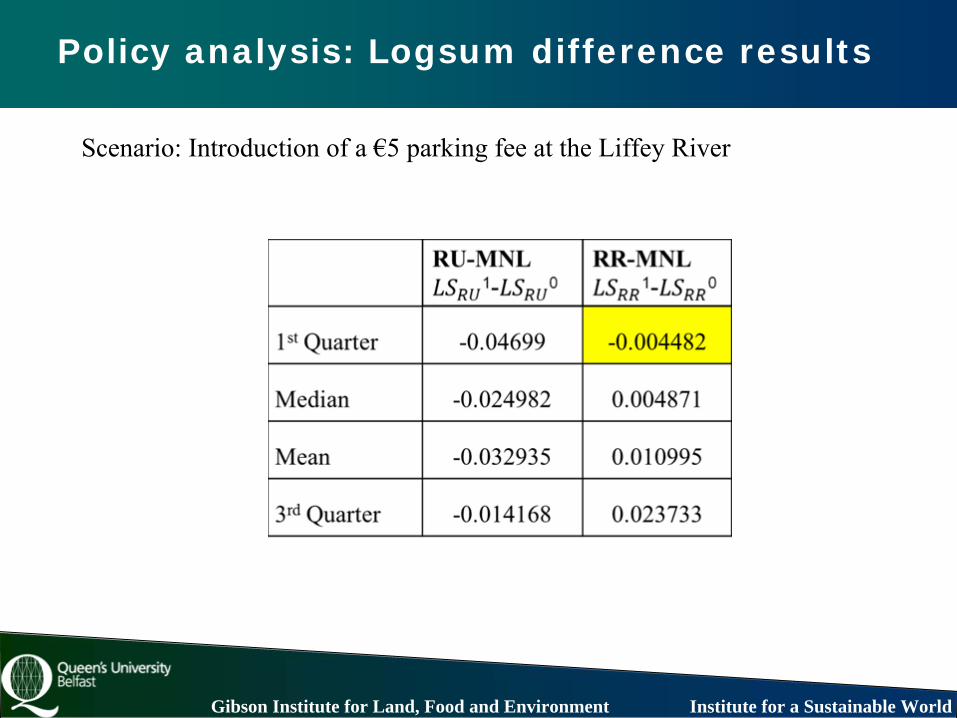
Policy analysis: Logsum difference results
Scenario: Introduction of a €5 parking fee at the Liffey
River
Gibson Institute for Land, Food and Environment Institute for a Sustainable World
Policy analysis: Logsum difference results
Scenario: Introduction of a €5 parking fee at the Liffey
River
Gibson Institute for Land, Food and Environment Institute for a Sustainable World
Policy analysis: Logsum difference results
Scenario: Introduction of a €5 parking fee at the Liffey
River
Gibson Institute for Land, Food and Environment Institute for a Sustainable World
Policy analysis: Logsum difference results
Scenario: Introduction of a €5 parking fee at the Liffey
River
Gibson Institute for Land, Food and Environment Institute for a Sustainable World
Marco Boeri*, Lorenzo Masiero***Gibson Institute for Land, Food and the Environment,
Queens University Belfast**Istituto
Ricerche
Economiche
(IRE), Faculty of
Economics, University of Lugano
Regret minimization and utility maximization in a freight transport
context: an application from two stated choice experiments
Gibson Institute for Land, Food and Environment Institute for a Sustainable World
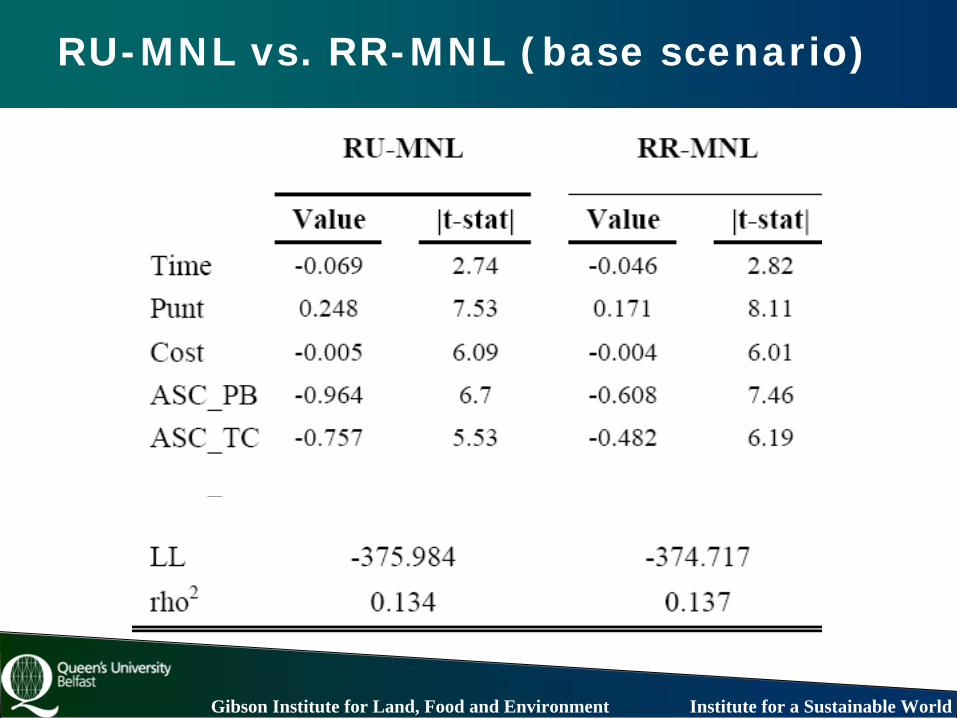
An application to freight transport
•
Two stated preference experiments conducted in 2008
•
Labelled alternatives describing freight transport services in terms of transportation mode, transport time, transport cost and punctuality
•
The main difference between the two experiments is in the reference values used for the setting of the scenarios
–
the first experiment (base scenario) is created around the actual values stated by logistics managers for the typical transport service
–
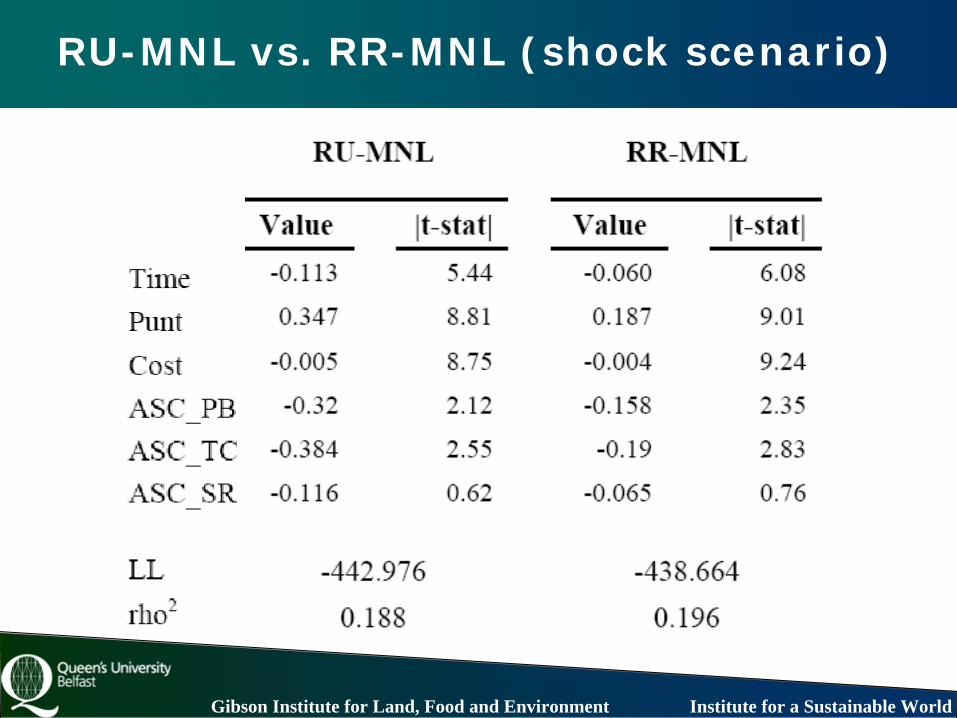
the second experiment (shock scenario) is created around transitional values reflecting a temporary and worsening manipulation of the stated values
Gibson Institute for Land, Food and Environment Institute for a Sustainable World
Sample
In total, 60 medium to large firms were contacted and asked for their participation in the survey.
The final sample is composed by 27 firms (18 medium and 9 large in size).
The entire sample successfully completed both experiments proposed, resulting in 405 choice observations for each scenario.
Gibson Institute for Land, Food and Environment Institute for a Sustainable World
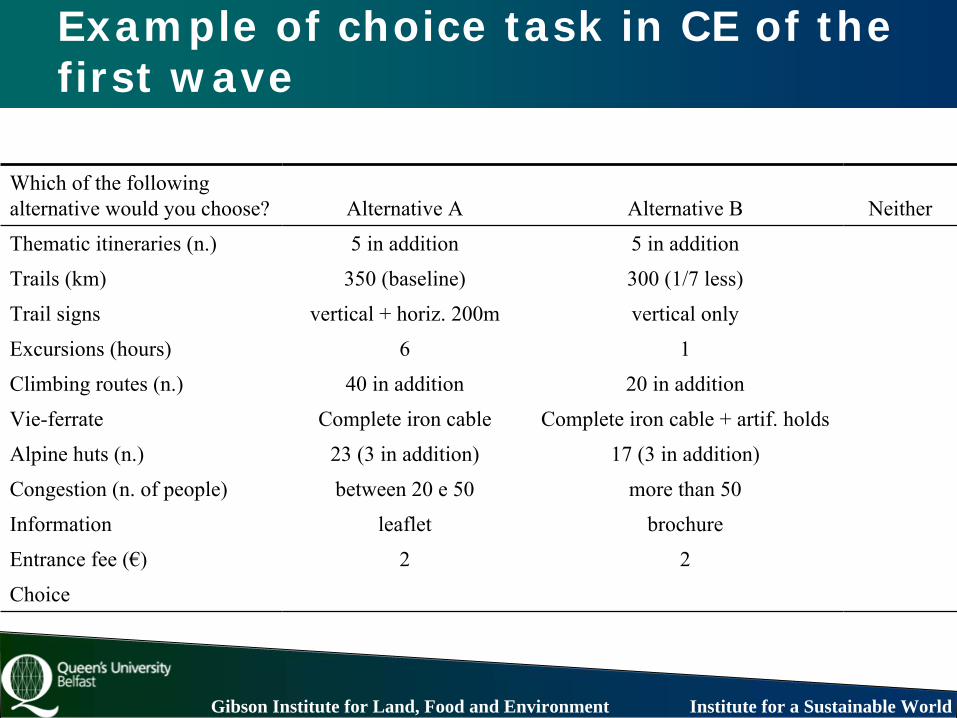
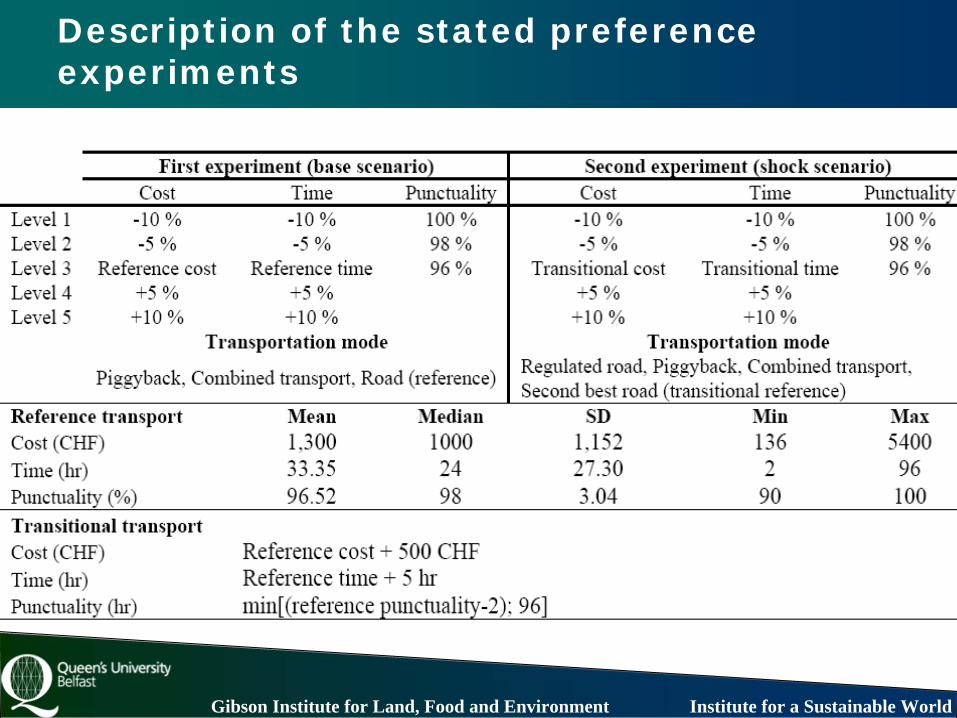
Description of the stated preference experiments
Gibson Institute for Land, Food and Environment Institute for a Sustainable World
RU-MNL vs. RR-MNL (base scenario)
Gibson Institute for Land, Food and Environment Institute for a Sustainable World
RU-MNL vs. RR-MNL (shock scenario)
Gibson Institute for Land, Food and Environment Institute for a Sustainable World
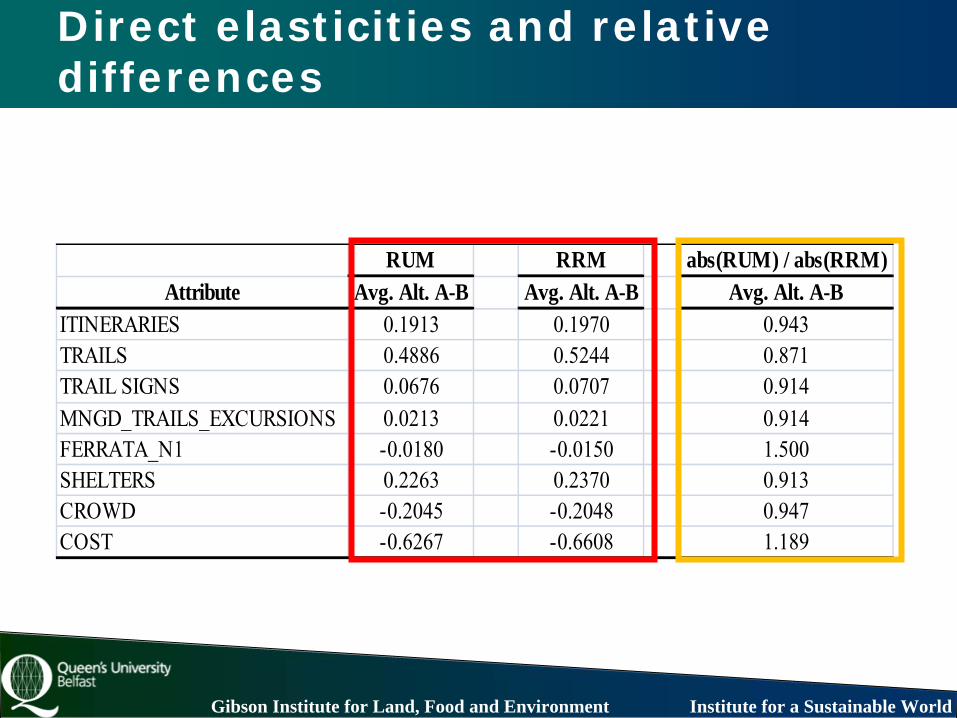
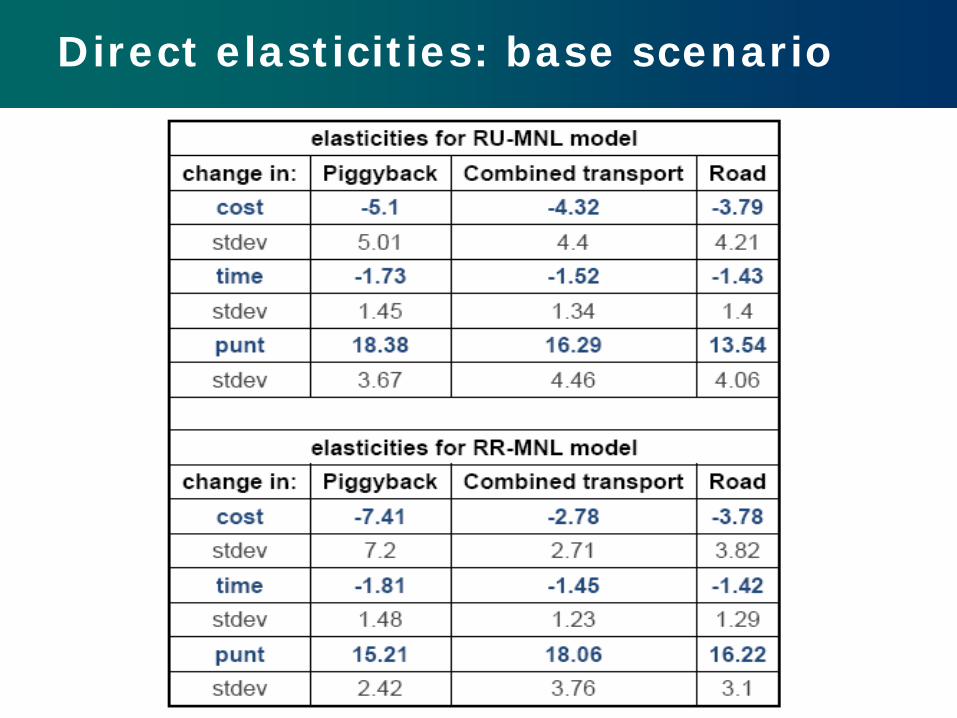
Direct elasticities: base scenario
Gibson Institute for Land, Food and Environment Institute for a Sustainable World
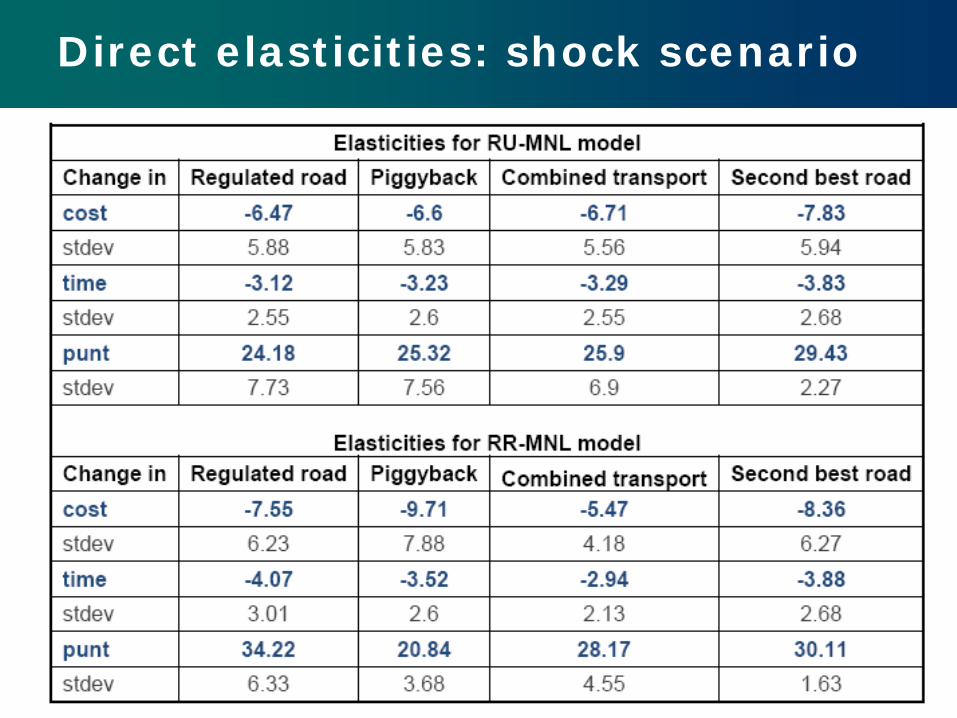
Direct elasticities: shock scenario
Gibson Institute for Land, Food and Environment Institute for a Sustainable World
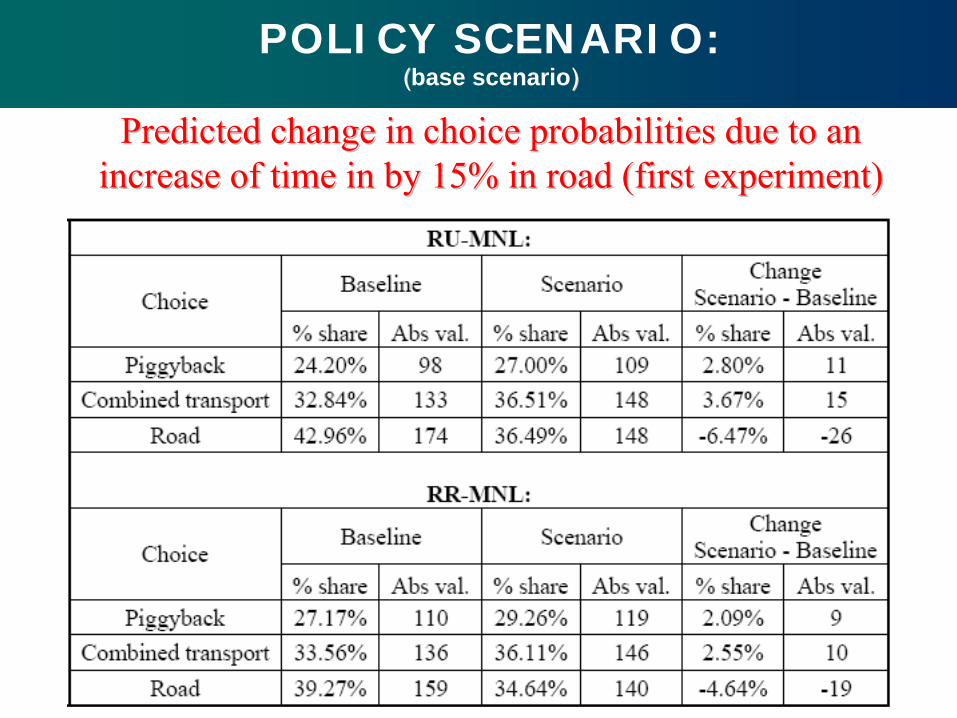
POLICY SCENARIO:((base scenario))
Predicted change in choice probabilities due to an Predicted change in choice probabilities due to an increase of time in by 15% in road (first experiment)increase of time in by 15% in road (first experiment)
Gibson Institute for Land, Food and Environment Institute for a Sustainable World
POLICY SCENARIO:((shock scenario))
Predicted change in choice probabilities due to an Predicted change in choice probabilities due to an increase of time in by 15% in second best roadincrease of time in by 15% in second best road
Gibson Institute for Land, Food and Environment Institute for a Sustainable World
Marco Boeri, Alberto Longo**Gibson Institute for Land, Food and the Environment,
Queens University Belfast
Utility maximizes vs. Regret minimizers in trading-off between
dietary choices, physical activity and cardiovascular disease risk
Gibson Institute for Land, Food and Environment Institute for a Sustainable World
The study
•
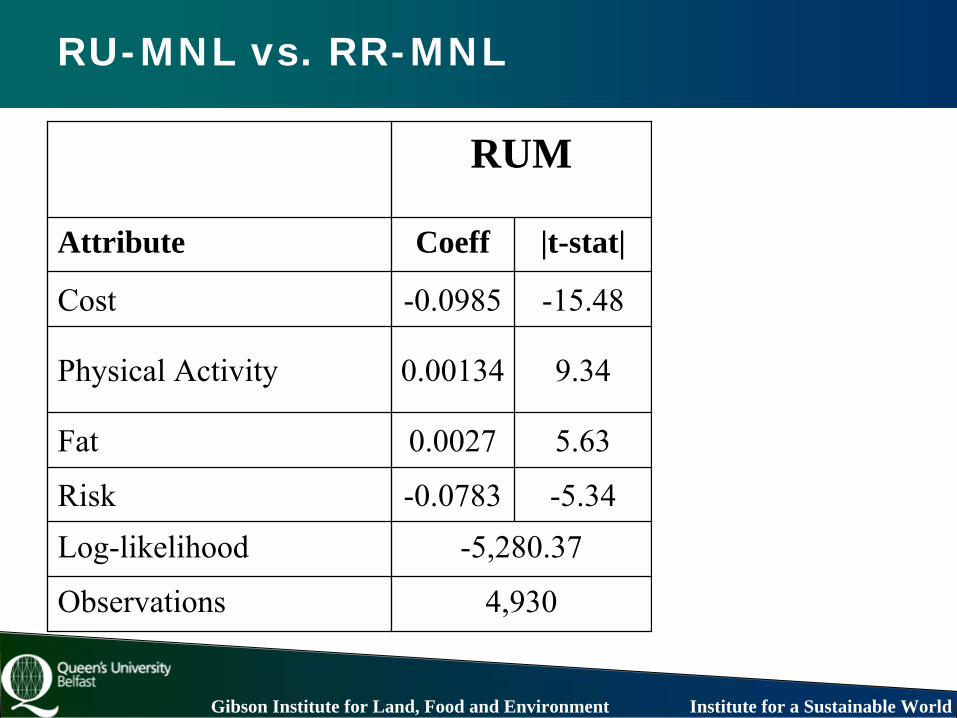
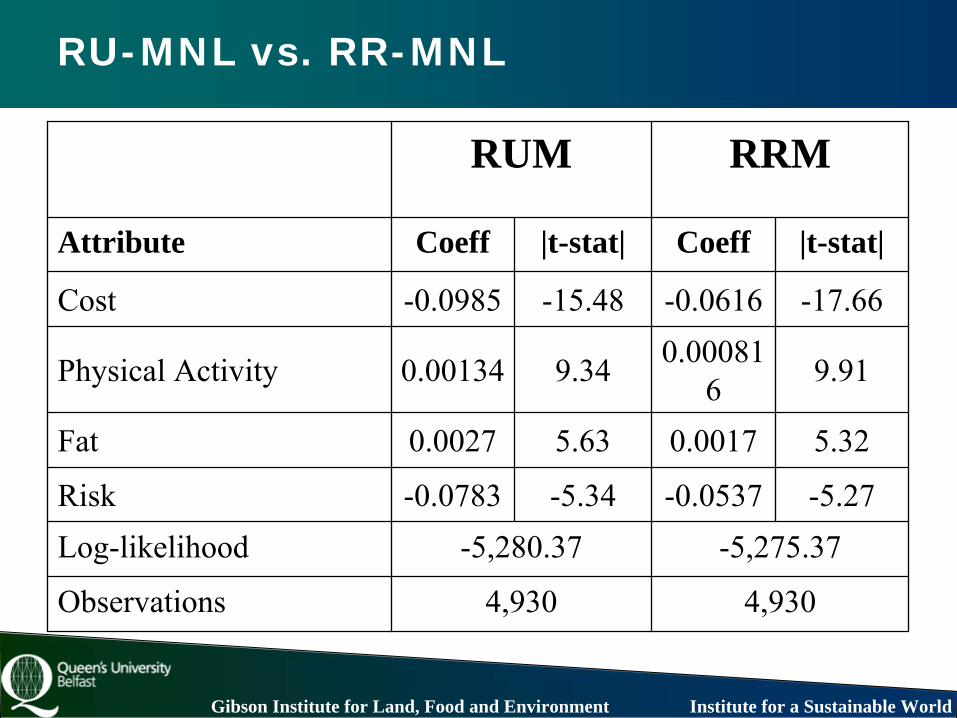
Data from a discrete choice experiment to study the trade-off people are willing to make between dietary choices, physical activity and cardiovascular disease risk
•
Data collected from a representative sample of the Northern Irish adult (40-65)
•
Bayesian Db
-error efficient design (Ferrini
and Scarpa, 2007), in two waves
•
A total of 5,090 observations from 509 respondents used for the analysis
Gibson Institute for Land, Food and Environment Institute for a Sustainable World
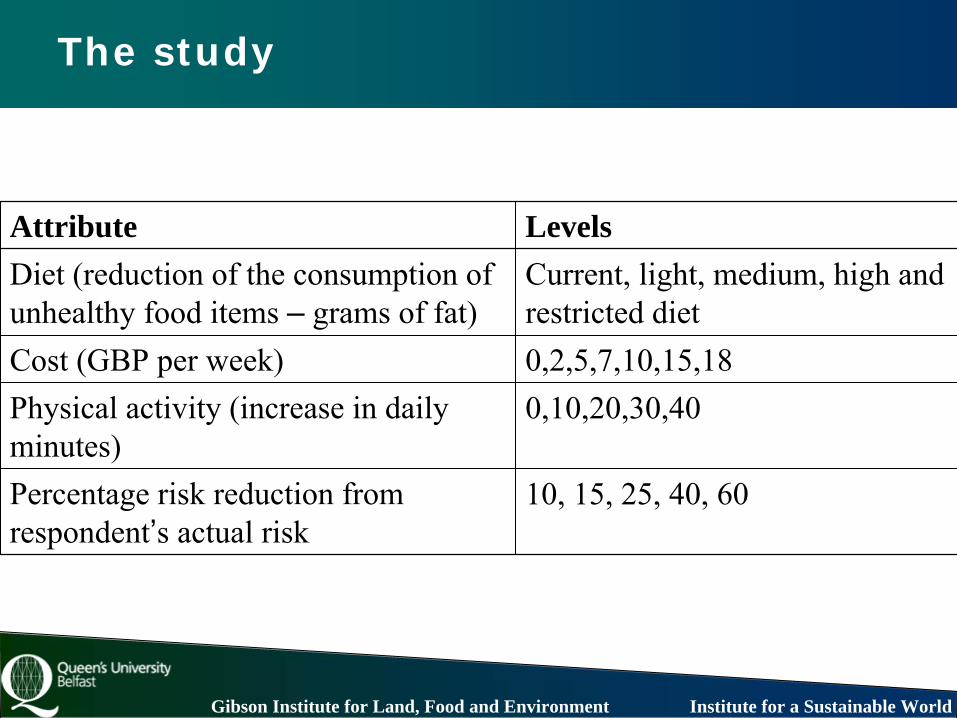
The study
Attribute LevelsDiet (reduction of the consumption of unhealthy food items –
grams of fat)
Current, light, medium, high and restricted diet
Cost (GBP per week) 0,2,5,7,10,15,18Physical activity (increase in daily minutes)
0,10,20,30,40
Percentage risk reduction from respondent’s actual risk
10, 15, 25, 40, 60
Gibson Institute for Land, Food and Environment Institute for a Sustainable World
An example of choice card
Gibson Institute for Land, Food and Environment Institute for a Sustainable World
Gibson Institute for Land, Food and Environment Institute for a Sustainable World
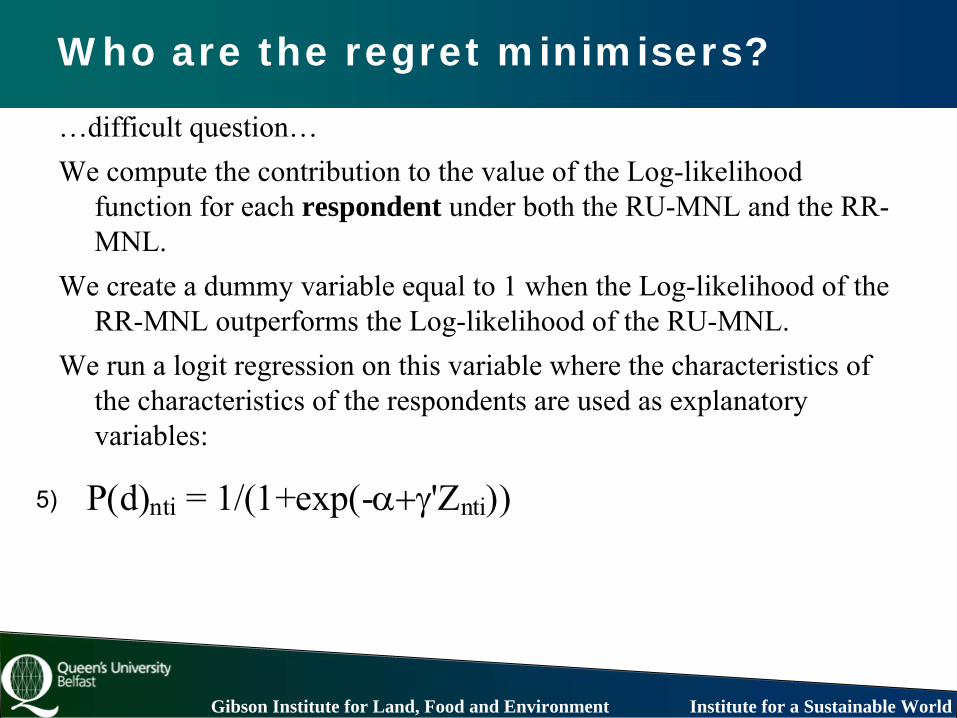
Who are the regret minimisers?
…difficult question…We compute the contribution to the value of the Log-likelihood
function for each respondent under both the RU-MNL and the RR- MNL.
We create a dummy variable equal to 1 when the Log-likelihood of the RR-MNL outperforms the Log-likelihood of the RU-MNL.
We run a logit
regression on this variable where the characteristics of the characteristics of the respondents are used as explanatory variables:
P(d)nti = 1/(1+exp(-α+γ'Znti)) 5)
Gibson Institute for Land, Food and Environment Institute for a Sustainable World
Binary Logit to understand who are the regret minimisers
Value t-stat
(Intercept) 9.75883 6.741Male (dummy variable) -0.09729 -1.555Underweight (dummy variable) -0.15718 -1.065Overweight (dummy variable) -0.30836 -4.167Obese (dummy variable) -0.25177 -3.158Good and very good health (dummy variable) 0.52703 12.224High education (dummy variable) 0.04144 3.731Sport person (dummy variable) -0.30782 -4.813smoker (dummy variable) -0.33195 -4.419Age -0.43642 -7.694Age2 0.004569 8.366†
The dependent variable is equal to 1 if RR-MNL outperforms RU-MNL, and 0 otherwise.
Gibson Institute for Land, Food and Environment Institute for a Sustainable World
Conclusions
Gibson Institute for Land, Food and Environment Institute for a Sustainable World
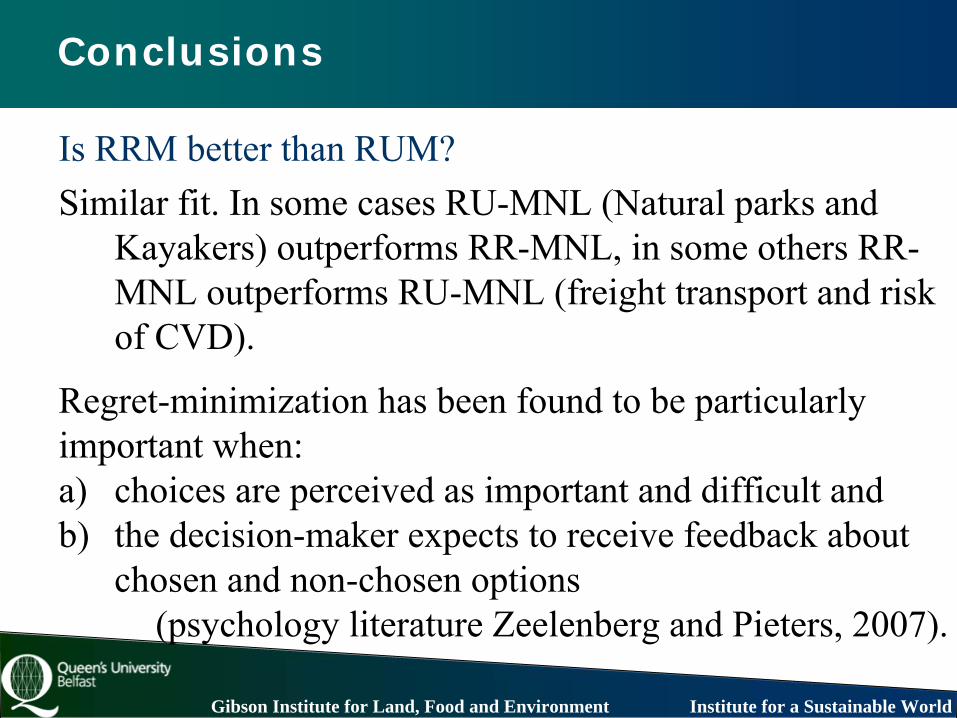
Conclusions
Is RRM better than RUM?Similar fit. In some cases RU-MNL (Natural parks and
Kayakers) outperforms RR-MNL, in some others RR- MNL outperforms RU-MNL (freight transport and risk
of CVD).
Gibson Institute for Land, Food and Environment Institute for a Sustainable World
Conclusions
Is RRM better than RUM?Similar fit. In some cases RU-MNL (Natural parks and
Kayakers) outperforms RR-MNL, in some others RR- MNL outperforms RU-MNL (freight transport and risk
of CVD).
Regret-minimization has been found to be particularlyimportant when:a)
choices are perceived as important and difficult and
b)
the decision-maker expects to receive feedback about chosen and non-chosen options
(psychology literature Zeelenberg
and Pieters, 2007).
Gibson Institute for Land, Food and Environment Institute for a Sustainable World
RRM allows to explore interesting aspects of choice behaviour: • Equally parsimonious as linear-additive MNL• Displays semi-compensatory choice-behaviour
-
Compromising effect• Allows to analyse choices from a different prospective
•
Elasticities
and choice probability forecasts differ substantially between the two choice-modelling paradigms•
One can test managerial implications obtained from RU-MNL
model comparing with conclusions from RR-MNL model
Conclusions
Gibson Institute for Land, Food and Environment Institute for a Sustainable World
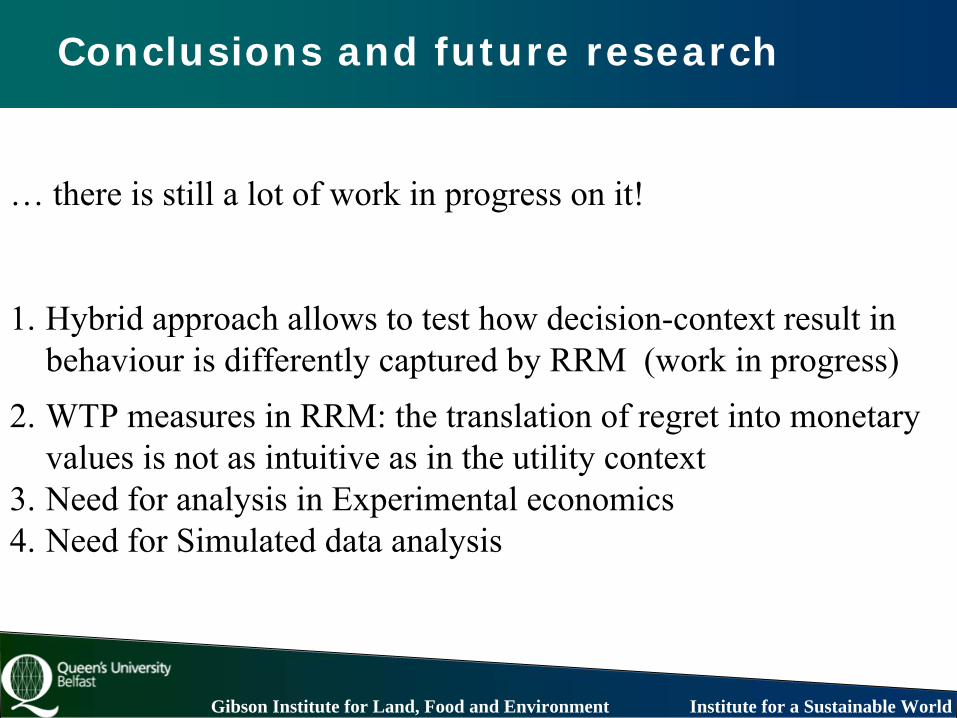
… there is still a lot of work in progress on it!
1.
Hybrid approach allows to test how decision-context result in behaviour is differently captured by RRM (work in progress)
2.
WTP measures in RRM: the translation of regret into monetary values is not as intuitive as in the utility context
3.
Need for analysis in Experimental economics 4.
Need for Simulated data analysis
Conclusions and future research
Gibson Institute for Land, Food and Environment Institute for a Sustainable World
The analyst should consider applying both modelling approaches to their data.
Take away message…
Gibson Institute for Land, Food and Environment Institute for a Sustainable World
The analyst should consider applying both modelling approaches to their data.
The results suggest that since some choices are better described
by utility maximization and some by regret minimization, then it may be prudent to apply the model that best reflects the particular choice behaviour. This approach would capture the behavioural influences on choices more accurately than assuming in all instances that individuals always make choices within a utility maximization framework. It would also allow for more robust policy appraisals.
Take away message…
Gibson Institute for Land, Food and Environment Institute for a Sustainable World