33
Regular Versus Shorter University Orientations: A Comparison of Attendee Make- up Carla Abreu-Ellis & Jason Brent Ellis
| Date post: | 28-Dec-2015 |
| Category: |
Documents |
| Upload: | ashley-lambert |
| View: | 213 times |
| Download: | 0 times |

Regular Versus Shorter University Orientations: A Comparison of Attendee
Make-up Carla Abreu-Ellis & Jason Brent Ellis

Purpose of the Study
The purpose of this study was to compare the characteristics of students who attended both the regular and shorter orientation sessions at a four-year state university in Northwest, Ohio.
This study was developed to investigate the premise that students who attended the shorter orientation session and registration were harder to retain than the students who attended the regular orientation.

Research Questions
What is the difference between students who attended regular orientation and students who attended the shorter orientation?
Is there a significant difference between first-to-second semester retention for those who attended the shorter orientation compared to those who attended regular orientation and registration sessions?

Methodology
A total of 14,526 students participated in this study. Students were divided into two groups, those who attended regular orientation and registration (n = 14,088) and those who attended the shorter orientation session (n = 438) during a total of four years.
A descriptive research design was used to provide a profile of the students who attended both types of orientation. This project used existing data collected through secondary sources such as administrative records.

Gender
57.852.3
42.247.7
0
10
20
30
40
50
60
70
80
90
100
Fre
qu
ency
in
Per
cen
tag
e
Female Male
Gender Demographics of Orientation Attendance
Reg
Short
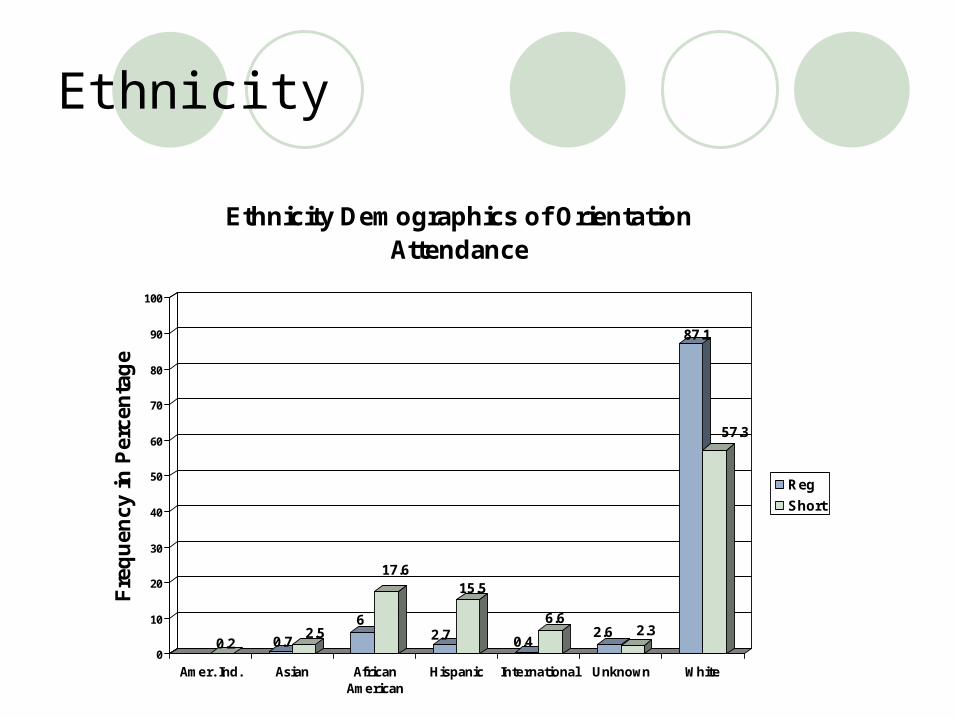
Ethnicity
0.2 0.72.5
6
17.6
2.7
15.5
0.4
6.62.6 2.3
87.1
57.3
0
10
20
30
40
50
60
70
80
90
100
Fre
qu
ency
in
Per
cen
tag
e
Amer. Ind. Asian AfricanAmerican
Hispanic International Unknown White
Ethnicity Demographics of Orientation Attendance
Reg
Short

Age
Age Demographics of Orientation Attendance
07.3
97.2 92.7
0102030405060708090
100
17-19 20 & older
Fre
qu
ency
in
Per
cen
tag
e
Reg
Short

Living Arrangements
Living Arrangement Demographics of Orientation Attendance
7.8
80.4
19.6
92.2
0
20
40
60
80
100
On Campus Off Campus
Fre
qu
ency
in
Per
cen
tag
e
Reg
Short

Residency Status
Residency Status Demographics of Orientation Attendance
0.37.76.6
24.9
68.5
91.9
0
20
40
60
80
100
International non-OhioResidents
Ohio Residents
Fre
qu
ency
in
Per
cen
tag
e
Reg
Short
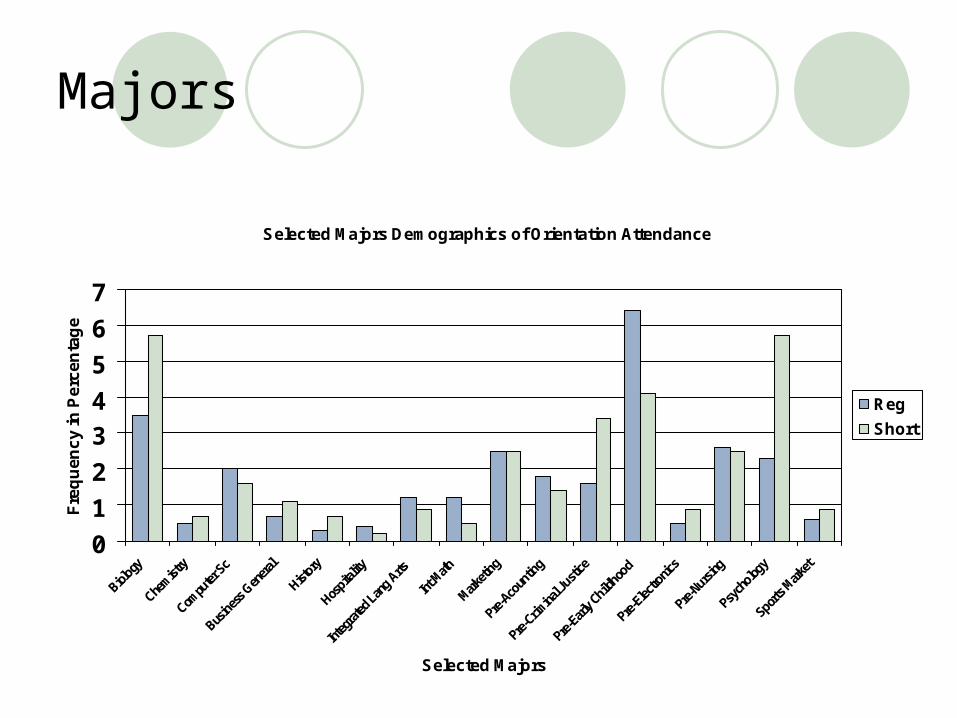
Majors
Selected Majors Demographics of Orientation Attendance
0
1
2
3
4
5
6
7
Selected Majors
Fre
qu
en
cy
in P
erc
en
tag
e
Reg
Short
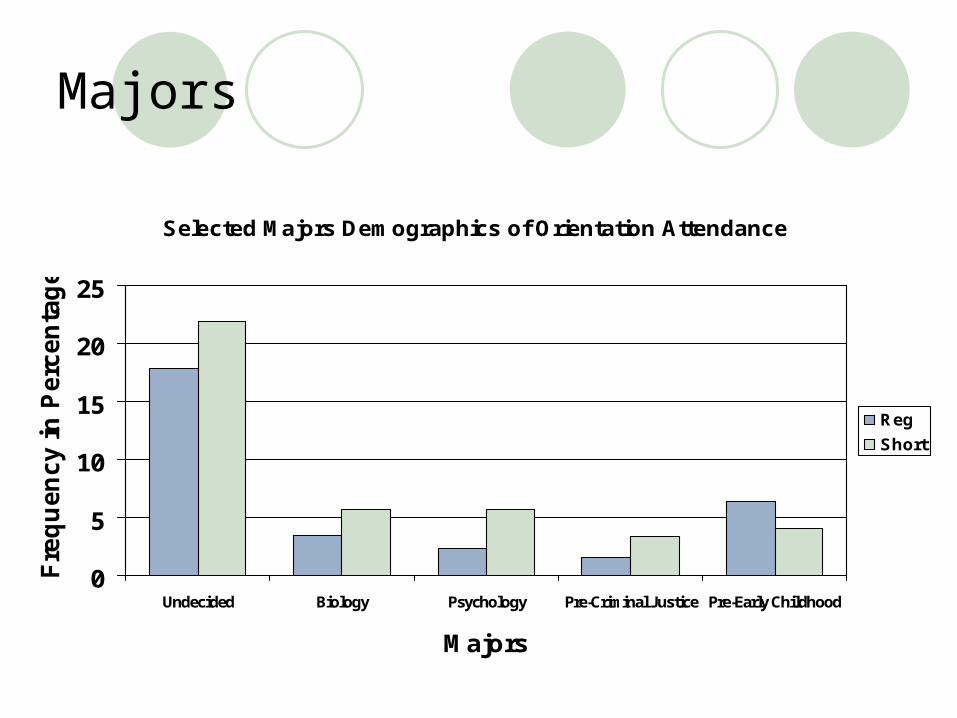
Majors
Selected Majors Demographics of Orientation Attendance
0
5
10
15
20
25
Undecided Biology Psychology Pre-Criminal Justice Pre-Early Childhood
Majors
Fre
qu
en
cy i
n P
erc
en
tag
e
Reg
Short

Developmental English Placement
Frequency of Developmental ENG Placement
0102030405060708090
100
Yes No
Fre
qu
ency
in
Per
cen
tag
e
Reg
Short

Developmental Math Placement
Frequency of Developmental Math Placement
0102030405060708090
100
Yes No
Fre
qu
ency
in
Per
cen
tag
e
Reg
Short

Living Learning Communities
Frequency of Orientation Atendees in Learning Communities
0
1
2
3
4
5
6
7
8
Living Learning Community Honors Learning Community
Learning Community
Fre
qu
en
cy
in P
erc
en
tag
e
Reg
Short

Campus Wide Programs
Frequency of Enrollment in Campus-Wide Programs
0
5
10
15
20
25
30
Community literacyprograms
Multiculturalprograms
Moral values andcritical thinking
program
UNIV 101
Program Type
Fre
qu
en
cy
in P
erc
en
tag
e
Reg
Short

Academic Status – Fall Semester
Academic Standing by Orientation Type
1.5
16.2
63.4
10.98.1
2.7
54.1
106.8
26.3
0
10
20
30
40
50
60
70
Withdrawl Deans List Good Standing Probation Warning
Fre
qu
ency
in
Per
cen
tag
e
Reg
Short

Credit Hours
Credit Hours Attempted and Completed
15.09 14.7914.75
12.64
0
2
4
6
8
10
12
14
16
Fall credit hours attempted Fall credit hours completed
Ave
rag
e C
red
it L
oad
Reg
Short

Fall GPA
Mean Fall GPA by Orientation Type
2.69
2.16
0
0.5
1
1.5
2
2.5
3
3.5
4
Fall GPA
GP
A o
n a
4.0
Sc
ale
Reg
Short

Spring GPA
Spring GPA by Orientation Type
2.4952.769
0
0.5
1
1.5
2
2.5
3
Spring GPA
GP
A o
n a
4.0
Scale
Reg
Short

Fall Retention
Fall Retention by Orientation Type
75.8
24.2
60.9
39.1
0
10
20
30
40
50
60
70
80
Retained Not retained
Fre
qu
en
cy
in
Pe
rce
nta
ge
Reg
Short

Findings
In relation to first-to-second semester retention between those who attended the shorter orientation session compared to those who attended regular orientation and registration sessions, it was found that students who attended the shorter orientation session were harder to retain than those who attended the regular orientation.

Discussion
In relation to high school GPA and ACT scores, no significant difference was found between the two groups. This finding was confirmed by other researchers (Mannan & Preusz, 1976). This could be due to the high academic criteria set for admission to the institution.

Discussion
All students who attended the regular orientation were traditional students. Other researchers have found similar results (Belcher & Patterson, 1990).
Discussion
In a study of community colleges Belcher & Patterson (1990) found that students who register late were more likely to be African American, non-Hispanic, and least likely to be from a Hispanic background.
This study found that students who attended the shorter orientation session were more likely to be African American, and contrary to what the literature stated – of Hispanic decent.

Discussion
Belcher and Patterson (1990) noted that students registered late because of their late arrival into town. This could be an explanation for the late orientation attendance of international and out of state students.
This research found that 19.6% of the students who attended shorter orientation session lived off campus. This could be related to the fact that a great number of these students were non-traditional students.

Discussion
Twenty one (4.8%) students (of the shorter orientation) were undecided about their majors but knew that they wanted to be in the College of Arts and Sciences, and 6.8% of these students were enrolled in the university program for academic success. This program assists students who enter the University with lower ACT scores and high school GPAs at the time of application. This finding showed that this group of students was unsure of their career goals and expectations (Weiss, 1999).

Discussion
The review of the literature indicated that attendance in living-learning communities and participation in campus wide programs can enhance academic performance.
This study found that students who attended the shorter orientation session were less likely to live in learning communities. However, students who attended the shorter orientation session were more likely to join multicultural programs. Since a great number of the students who attend this orientation were from a Hispanic and African American heritage, perhaps they were motivated to participate in these types of program.

Discussion
Smith, Street, and Olivarez (2002) studied time of registration and academic success of community college students and found that students who register late were less likely to continue their studies to the spring semester than were students who register early (returning students) or on time (regular registrants). Further, a significant difference was found between withdraw rates between students who register on time versus those who registered late.

Discussion
This study found that students who attend regular orientation have a higher retention rate … 75.8% (Regular Orientation) 60.9% (Late Orientation).

Further Analysis
Results of logistic regression indicated that these students were not harder to retain because of their input characteristics such as age, high school GPA, ethnicity, and gender or shorter orientation attendance.
The failure to retain these students could be related to their experiences, or lack of participation in the campus community, uncertainty of career goals, and difficulty in deciding a major.

Research Recommendations
It may be useful to conduct focus groups with students who attended shorter orientation session to find out more about their college experiences (participation in activities and learning communities) during their first semester in higher education.
Inquiry should be made into the decision process of how shorter orientation session attendance influence students’ choice of major and college.

Recommendations for Professional Practice
Advisors should encourage students attending the shorter orientation session to register for career exploration courses or take advantage of career assessment at the career center.
Use a proactive approach with the incoming freshman. During the shorter orientation session distribute a survey in which will serve as a diagnostic identifying individuals lacking in strong commitment to vocational choice and lacking in interest and motivation in becoming involved in campus life.

Recommendations for Professional Practice
An intervention can be planed for the spring semester in order to increase retention of these students. Interventions could include registration in campus wide programs allowing these students to integrate into the campus community.


