1 www.eandis.be Regulated information Melle, 30 March 2018 FINANCIAL REPORT OF THE EANDIS SYSTEM OPERATOR-GROUP 1 AS PER 31 DECEMBER 2017 2 HIGHLIGHTS • Eandis System Operator and its peer Infrax are working on a merger of both companies, which would create one single operating company, to be called Fluvius System Operator, for the entire Flemish region. • Eandis successfully issues a new retail bond for the refinancing of a maturing retail bond. • A further decrease in Eandis System Operator’s headcount. • Operating revenue for the Eandis Consolidated Group increased by 2,9 per cent, while its operating expenses increased by 3,2 per cent. • No profit or loss, since all costs are fully passed on to the distribution system operators (abbreviated to DSOs) based on the ‘transfer at cost’ principle. MANAGEMENT REPORT The Flemish energy distribution sector is undergoing a major restructuring. Eandis System Operator and Infrax have formally announced their intention to fully integrate and merge both companies into one single entity, Fluvius System Operator. The merger plan will be submitted to both companies’ General Assemblies at the end of June 2018. Once the approvals have been obtained, Fluvius will start its operations on 1 July 2018. 1 The Eandis System Operator Group comprises Eandis System Operator cvba and its consolidated subsidiaries De Stroomlijn cvba, Atrias cvba and Synductis cvba. As per 31 December 2017, the subsidiaries Warmte@Vlaanderen cvba and Fluvius cvba have not been consolidated, since there have not yet been any activities at these companies. 2 All comparisons are with the figures reported as per 31 December 2016, unless stated otherwise.
Transcript
1
www.eandis.be
Regulated information Melle, 30 March 2018
FINANCIAL REPORT OF THE EANDIS SYSTEM OPERATOR-GROUP1
AS PER 31 DECEMBER 20172
HIGHLIGHTS
• Eandis System Operator and its peer Infrax are working on a merger of both companies,
which would create one single operating company, to be called Fluvius System Operator, for
the entire Flemish region.
• Eandis successfully issues a new retail bond for the refinancing of a maturing retail bond.
• A further decrease in Eandis System Operator’s headcount.
• Operating revenue for the Eandis Consolidated Group increased by 2,9 per cent, while its
operating expenses increased by 3,2 per cent.
• No profit or loss, since all costs are fully passed on to the distribution system operators
(abbreviated to DSOs) based on the ‘transfer at cost’ principle.
MANAGEMENT REPORT
The Flemish energy distribution sector is undergoing a major restructuring. Eandis System Operator
and Infrax have formally announced their intention to fully integrate and merge both companies into
one single entity, Fluvius System Operator. The merger plan will be submitted to both companies’
General Assemblies at the end of June 2018. Once the approvals have been obtained, Fluvius will
start its operations on 1 July 2018.
1 The Eandis System Operator Group comprises Eandis System Operator cvba and its consolidated subsidiaries De Stroomlijn
cvba, Atrias cvba and Synductis cvba. As per 31 December 2017, the subsidiaries Warmte@Vlaanderen cvba and Fluvius cvba have not been consolidated, since there have not yet been any activities at these companies.
2 All comparisons are with the figures reported as per 31 December 2016, unless stated otherwise.
Consolidated statement of profit or loss .......................................................................................3 Consolidated statement of comprehensive income .....................................................................4 Consolidated statement of financial position ................................................................................5 Consolidated statement of changes in equity ..............................................................................6 Consolidated statement of cash flows ..........................................................................................7
NOTES TO THE CONSOLIDATED FINANCIAL STATEMENTS ...................................................8 1 Corporate information ..........................................................................................................8 2 Summary of significant accounting policies .........................................................................9 2.1 Statement of compliance and basis of presentation .......................................................9 2.2 Principles of consolidation ...............................................................................................9 2.3 Segment reporting ........................................................................................................ 10 2.4 Significant accounting policies ..................................................................................... 10 2.5 Summary of changes in accounting policies applicable as from 2017 ........................ 14 2.6 Use of estimates and judgments .................................................................................. 14 2.7 Standards issued but not yet effective ......................................................................... 15
PERFORMANCE OF THE YEAR ................................................................................................. 17 3 Operating revenue ............................................................................................................ 17 4 Cost for services and other consumables ........................................................................ 18 5 Employee benefit expenses ............................................................................................. 18 6 Financial results ................................................................................................................ 19 7 Income tax expenses ........................................................................................................ 19
ASSETS ........................................................................................................................................ 21 8 Intangible assets ............................................................................................................... 21 9 Property, plant and equipment ......................................................................................... 22 10 Investments in other companies ....................................................................................... 23 11 Other investments............................................................................................................. 23 12 Rights to reimbursement on post-employment employee benefits .................................. 23 13 Short- and long-term receivables, other ........................................................................... 24 14 Inventories ........................................................................................................................ 24 15 Trade and other receivables, receivables cash pool activities ......................................... 25 16 Cash and cash equivalents .............................................................................................. 25
LIABILITIES .................................................................................................................................. 26 17 Equity ................................................................................................................................ 26 18 Interest-bearing loans and borrowings ............................................................................. 27 19 Employee benefit liability .................................................................................................. 29 20 Trade payables and other liabilities, liabilities cash pool activities, current tax liabilities . 37
OTHER INFORMATION ................................................................................................................ 43 22 Related parties.................................................................................................................. 43 23 Commitments and contingencies ..................................................................................... 45 24 Events after the reporting date ......................................................................................... 45 25 List of group entities included in the consolidation ........................................................... 46
INFORMATION CONCERNING THE PARENT COMPANY ........................................................ 47
Eandis System Operator Group – IFRS – 2017 3 / 47
Financial Statements
Consolidated statement of profit or loss
(In thousands of EUR) Notes 2017 2016
Operating revenue 1.027.178 998.121
Revenue 3 1.006.062 975.843
Other operating income 3 21.116 22.278
Operating expenses −1.009.886 −978.829
Cost of trade goods −89.056 −88.851
Cost for services and other consumables 4 −554.667 −522.885
Employee benefit expenses 5 −367.179 −360.963
Depreciation, amortization, impairments and changes in provisions 1.672 −5.473
Other operational expenses −656 −657
Result from operations 17.292 19.292
Finance income 6 107.918 109.107
Finance costs 6 −115.790 −119.206
Profit before tax 9.420 9.193
Income tax expenses 7 −9.420 −9.193
Profit for the period 0 0
Eandis System Operator Group – IFRS – 2017 4 / 47
Consolidated statement of comprehensive income
(In thousands of EUR) Notes 2017 2016
Profit for the period 0 0
Other comprehensive income
Items not to be reclassified to profit or loss in subsequent periods
Actuarial gains (losses) on long-term employee benefits 19 5.147 −5.311 Actuarial gains (losses) on rights to reimbursement on post-employment
employee benefits 12 −5.147 5.311
Net other comprehensive income not being reclassified to profit or
loss in subsequent periods 0 0
Total comprehensive income for the period 0 0
Eandis System Operator Group – IFRS – 2017 5 / 47
Consolidated statement of financial position
(In thousands of EUR) Notes 2017 2016
Non-current assets 3.685.531 3.534.199
Intangible assets 8 469 780
Property, plant and equipment 9 2.392 2.303
Investment in joint ventures and associates 10 30 30
Other investments 11, 21 832 832
Rights to reimbursement on post-employment employee benefits 12 210.947 259.363
Long-term receivables, other 13 3.470.861 3.270.891
Current assets 375.109 818.190
Inventories 14 33.646 35.295
Short-term receivables, other 13 0 150.000
Trade and other receivables 15, 21 290.671 322.646
Receivables cash pool activities 19.402 307.587
Cash and cash equivalents 16, 21 31.390 2.662
TOTAL ASSETS 4.060.640 4.352.389
EQUITY 17 1.099 1.099
Total equity attributable to owners of the parent 1.006 1.006
Share capital, reserves and retained earnings 1.006 1.006
Non-controlling interest 93 93
LIABILITIES 4.059.541 4.351.290
Non-current liabilities 3.660.276 3.506.515
Interest bearing loans and borrowings 18, 21 3.449.329 3.247.152
Employee benefit liabilities 19 210.947 259.363
Current liabilities 399.265 844.775
Interest bearing loans and borrowings 18, 21 0 561.321
Trade payables and other current liabilities 20, 21 289.535 269.868
Liabilities cash pool activities 20, 21 96.415 0
Current tax liabilities 20, 21 13.315 13.586
TOTAL EQUITY AND LIABILITIES 4.060.640 4.352.389
Eandis System Operator Group – IFRS – 2017 6 / 47
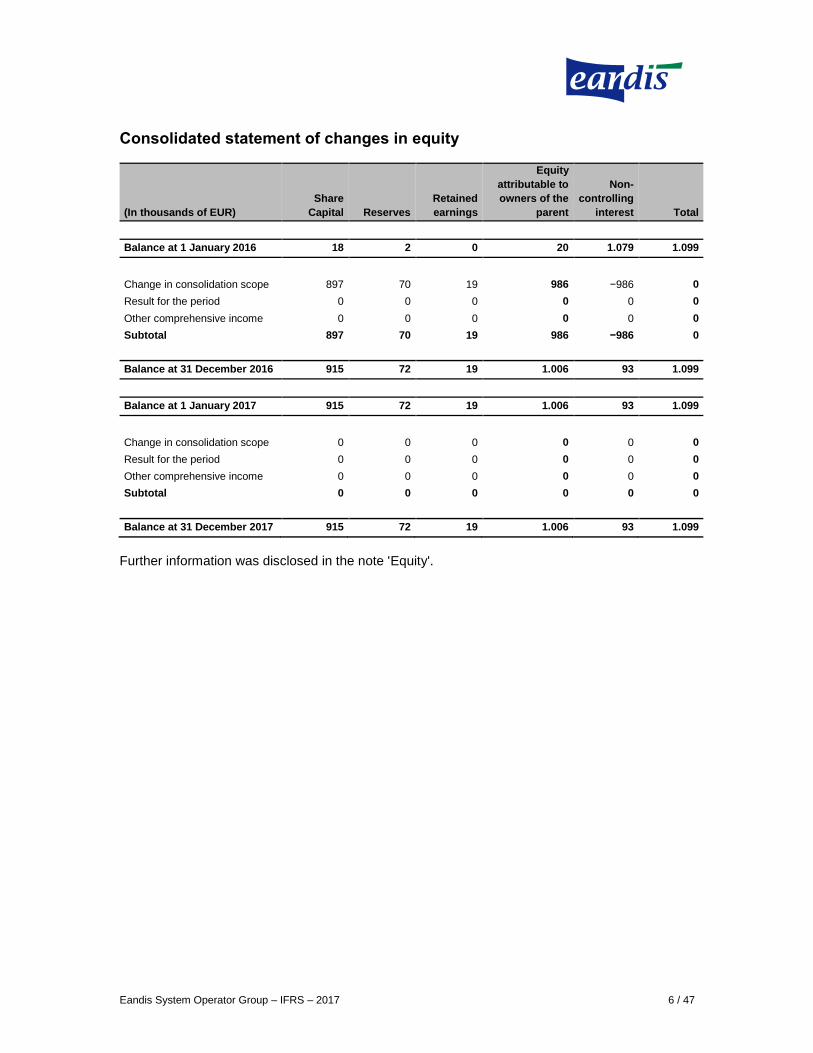
Consolidated statement of changes in equity
(In thousands of EUR)
Share
Capital Reserves
Retained
earnings
Equity
attributable to
owners of the
parent
Non-
controlling
interest Total
Balance at 1 January 2016 18 2 0 20 1.079 1.099
Change in consolidation scope 897 70 19 986 −986 0
Result for the period 0 0 0 0 0 0
Other comprehensive income 0 0 0 0 0 0
Subtotal 897 70 19 986 −986 0
Balance at 31 December 2016 915 72 19 1.006 93 1.099
Balance at 1 January 2017 915 72 19 1.006 93 1.099
Change in consolidation scope 0 0 0 0 0 0
Result for the period 0 0 0 0 0 0
Other comprehensive income 0 0 0 0 0 0
Subtotal 0 0 0 0 0 0
Balance at 31 December 2017 915 72 19 1.006 93 1.099
Further information was disclosed in the note 'Equity'.
Eandis System Operator Group – IFRS – 2017 7 / 47
Consolidated statement of cash flows
(In thousands of EUR) Notes 2017 2016
Profit for the period 0 0
Amortization of intangible assets 8 330 428
Depreciation on property, plant and equipment 9 853 920
Impairment current assets (Reversal -; Recognition +) 21 −2.855 4.125
Gains or losses on realization receivables 223 106
Net finance costs 6 7.872 10.099
Gains or losses on sale of property, plant and equipment 22 23
Income tax expense 7 9.420 9.193
Operating cash flow before change in working capital and provisions
for employee benefits 15.865 24.894
Change in inventories 14 1.649 10.022
Change in trade and other receivables 15 40.784 −71.289
Change in trade payables and other current liabilities 20 13.490 32.999
Net operating cash flow 55.923 −28.268
Interest paid −107.186 −116.792
Interest received 101.376 108.652
Financial discount on debts 6 365 291
Income tax paid 7 −9.691 −1.596
Net cash flow from operating activities 56.652 −12.819
Proceeds from sale of property, plant and equipment 9 2 10
Purchase of intangible assets 8 −19 −4
Purchase of property, plant and equipment 9 −966 −744
Acquisition of companies and other investments 10 0 −19
Proceeds from sale of other investments 11 0 168
Net investments in long term receivables 13 30 −141
Net cash flow used in investing activities −953 −730
Repayment of borrowings 18 −150.000 0
Proceeds from bonds/borrowings 18 199.737 0
Change in current liabilities 18 −411.308 186.071
Change in cash pool 15, 20 384.600 −173.495
Provide long-term loans 13 −200.000 0
Repayment provided long-term loans 13 150.000 0
Net cash flow from/used in financing activities −26.971 12.576
Net increase/decrease in cash 16 28.728 −973
Cash and cash equivalents at the beginning of period 2.662 3.635
Cash and cash equivalents - at the end of period 31.390 2.662
Eandis System Operator Group – IFRS – 2017 8 / 47
Notes to the consolidated financial statements
1 Corporate information Eandis System Operator, formerly Eandis, a limited liability partnership (‘coöperatieve vennootschap met beperkte aansprakelijkheid’/’société coopérative à responsabilité limitée’) under Belgian law, is registered in Belgium, at Brusselsesteenweg 199, 9090 Melle. It is registered under number 0477.445.084 in the central enterprise register of Ghent (section Ghent). The consolidated financial statements of Eandis System Operator for the year ended 31 December 2017 contain the information of the company and its subsidiary, investments in joint ventures and associates (see note 'List of group entities included in the consolidation '), and together they form the 'Group'. The shareholders of Eandis System Operator are seven Distribution System Operators or DSOs in the Flemish region (Gaselwest, IMEA, Imewo, Intergem, Iveka, Iverlek and Sibelgas), that are distributing both electricity and gas. The role of Eandis System Operator is limited mainly to the development, the operation and the maintenance for the Flemish DSOs of the low voltage and mid voltage distribution networks for electricity as well as their low pressure and mid pressure distribution networks for gas. The grid assets themselves remain owned by the Flemish DSOs that are also the holders of the electricity and gas distribution system operator licences granted by the Flemish energy regulatory authority, VREG. Eandis System Operator cvba operates in 229 cities and municipalities in the Flemish Region (Belgium) but also in 4 municipalities of the Walloon region. The Group employed on average 4.262 persons during 2017. The company carries out its operational activities at cost price without charging any commercial margin to the Distribution System Operators. This means that all costs incurred are passed through to the DSOs according to fixed allocation rules. Each month Eandis System Operator invoices each of the DSOs for the operational services rendered. The result of the Group is without profit or loss. The DSOs have appointed Eandis System Operator as their operating company. The Flemish energy regulator (VREG) decided in 2015 to grant permission to the distribution system operators Gaselwest, IMEA, Imewo, Intergem, Iveka, Iverlek and Sibelgas to call on the services of the operating company Eandis System Operator for electricity and gas. This authorisation shall apply from 5 September 2014 for electricity and from 14 October 2015 for gas for a period of twelve years. For more information, visit our website www.eandis.be In October 2011, Eandis System Operator obtained an A1 rating (negative outlook) from the rating agency ‘Moody's Investors Service Ltd.' (Moody's). On 14 December 2016 this rating was downgraded to A3 with a stable outlook as a result of the non-execution of the merger of the seven DSOs in Eandis Assets and the discontinuation of the process to attract a private partner for this merged company. Despite the downgrade, Eandis System Operator remains a solid issuer with a rating that aligns with many of its European peers. See also the press releases of Eandis System Operator dated 14 December 2016 and 3 October 2016 on www.eandis.be. On 18 January 2017, Eandis System Operator obtained a second rating. The German credit rating agency Creditreform Rating AG granted Eandis System Operator an A+ rating with stable outlook. On 19 January 2018 this rating was reconfirmed. On 27 March 2017, the press reported on some policy initiatives introduced by the Flemish Energy Minister Tommelein regarding the future structure of the Flemish energy distribution and of Eandis
Eandis System Operator Group – IFRS – 2017 9 / 47
System Operator, and more particularly about an integration of the operating companies Eandis System Operator and Infrax. The Board of Directors of Eandis System Operator took note of this and ascertained that the ideas expressed by the Minister fit the vision of Eandis System Operator and the steps already taken to establish Fluvius, a joint company of Eandis System Operator and Infrax. Therefore, Eandis System Operator stated that it was looking forward to working on the future of the sector in consultation with the Flemish government. The Boards of Directors of both companies approved the proposed merger on 1 July 2018 on 4 (Eandis System Operator) and 5 (Infrax) October 2017 respectively. The management committees of both companies were instructed to take the necessary preparatory measures for the realization, including the procedure towards the Belgian Competition Authority. For the legal establishment of the integrated Fluvius a merger by acquisition of Infrax by Eandis System Operator was chosen, whereby Eandis System Operator cvba will change its name to Fluvius System Operator cvba. The existing joint venture of Eandis System Operator and Infrax, the cvba Fluvius that acted as a purely supporting and non-operational vehicle, will be dissolved with liquidation. The legal transaction chosen (merger by acquisition) offers the most advantages in the realization of the integration of the two operating companies in the areas of human resources, current financial obligations and legal aspects. This financial report for the financial year ended 31 December 2017 was approved on 28 March 2018 by the Board of Directors.
2 Summary of significant accounting policies
2.1 Statement of compliance and basis of presentation
The consolidated financial statements have been prepared in accordance with International Financial Reporting Standards (IFRS), as published by the International Accounting Standard Board (IASB) and endorsed by the European Union. The Group has not early adopted any new IFRS standard that is effective after 2017. The consolidated financial statements were expressed in thousands of euro, which is the functional currency and presentation currency of the Group. They have been prepared with the assumption that business activities will be continued and under the historical cost convention method unless otherwise stated.
2.2 Principles of consolidation
The consolidated financial statements comprise all subsidiaries over which the Group has control. There is control when the Group has the power to govern the financial and operating policies of the entity so as to obtain benefits from its activities. Such a form of control is supposed to exist if Eandis System Operator, directly or indirectly, holds more than half of the voting rights in the entity. The existence and impact of potential voting rights that were exercisable or convertible at that time, are being taken into consideration when judging whether the Group has the control to determine the financial and operating policies of another entity. Subsidiaries are fully consolidated from the date on which the Group obtains control until the date on which control ends. Investments in associates are companies in which a significant influence is exercised over the financial and operational policy, but for which there is no control. This is usually evidenced by the ownership of 20 % up to 50 % of the voting rights. A joint venture is a joint arrangement whereby the Group has joint control of that arrangement.
Eandis System Operator Group – IFRS – 2017 10 / 47
These investments and joint ventures are accounted for in the consolidation using the equity method as from the date that significant influence or joint control is obtained until the date that the significant control or joint control ceases. The financial reporting of the subsidiaries, investments in joint ventures and associates is prepared for the same reporting year as that of the parent company, using consistent accounting principles. All intercompany transactions, balances and unrealized gains and losses between group companies have been eliminated. Non-controlling interest in the net assets of the consolidated subsidiaries has been individually reported in equity of the parent company. Non-controlling interest consists of the amount of that interest at the acquisition date and the non-controlling share in the equity changes since the date of the business combination. Losses relative to the minority higher than the non-controlling interests in the subsidiary’s equity have been allocated to the Group’s interests with the exception of those cases in which the minority has a binding obligation to make additional investments to compensate for the losses and is able to do so. An overview of the subsidiaries of the Group is set out in note ‘List of group entities included in the consolidation’.
2.3 Segment reporting
The Group does not distinguish between different segments, neither at the level of activities, nor geographically, since the Group generates income as the operating company for Flemish DSOs.
2.4 Significant accounting policies
The accounting policies are consistently applied with last year’s accounting principles.
a) Revenue recognition Revenue is recognized when it is probable that the economic benefits associated with the transaction will flow to the company provided that the income can be measured reliably and its collection is likely. Goods sold and services rendered The proceeds from the sale of goods and services rendered are recognized in the statement of profit or loss when the significant risks and rewards of ownership have been transferred to the buyer. Revenue is recognised at the moment the incurred costs are invoiced via a monthly management fee. The vast majority of these costs are passed on to the shareholders, Distribution System Operators. Finance income includes mainly interest realized from lending on funds from the bond issuances and from the cash pool activities. This interest is recognized when acquired and for the period to which it refers (taking into account the effective interest rate of the asset), unless collectability is doubtful. Dividends received are recognized in the statement of profit or loss at the moment they are granted.
b) Expenses Expenses are recognized in the statement of profit or loss in the year in which they occur.
Eandis System Operator Group – IFRS – 2017 11 / 47
The premiums for Rational Energy Use (RUE) paid to private individuals and companies are recognized as an expense in the statement of profit or loss. These premiums are granted to individuals and companies that invest in energy-efficient applications such as installing insulation, high-efficiency glazing, solar water heater, and others. These premiums are evaluated every year in consultation with the Flemish government and can vary in size and application. A REG action plan is agreed on per calendar year. The finance costs include interest on loans, calculated using the effective interest rate method, and bank charges. All interest and other costs incurred in connection with loans or other financial transactions such as hedging options are recognized as financial expenses when they occur. The income tax of the year comprises the tax charge payable. The tax on profit is recognized in the statement of profit or loss. The current tax expenses are the expected current taxes payable on the taxable income for the year, based on tax rates in effect at the statement of financial position date and any adjustment to current taxes payable from previous years.
c) Intangible assets Intangible assets are measured at cost less any accumulated amortizations and impairment losses. Intangible assets with a finite useful life are amortized on a straight-line basis over the expected useful life. The following amortization percentage based on the estimated useful life is used: Software 20,00 %
d) Property, plant and equipment Property, plant and equipment is measured at historical cost less accumulated depreciation and impairment losses. The historical cost comprises the initial purchase price and any costs directly attributable to bringing the asset to the condition necessary for it to be operational in the manner intended by management. Depreciation Depreciation is recognized monthly in the statement of profit or loss on a straight-line basis as of the month following the date of bringing into use. Depreciation is calculated over the estimated useful life of each component of an item of property, plant and equipment. The applied depreciation percentages on the basis of the average useful life are as follows: Office furniture and equipment 10,00 % Leasehold improvement 11,12 % Computer equipment and hardware 20,00 % and 33,33 % Test equipment (Electronic Vehicles in Action) 50,00 % Charging stations for electric vehicles 10,00 % Motor- & bicycles 20,00 % Repair and maintenance costs that do not increase the future economic benefits, are recognized in the statement of profit or loss as expenses incurred. Gains and losses on sale Any gain or loss arising from the sale of property, plant and equipment is included in the statement of profit or loss. They are recognized when the significant risks and rewards of ownership have been transferred to the buyer, recovery of the consideration is probable, the associated costs can be estimated reliably, and there is no continuing managerial involvement with the property, plant and equipment.
Eandis System Operator Group – IFRS – 2017 12 / 47
Leasing Lease of assets under which all the risks and rewards incidental to ownership are substantially retained by the lessor, is classified as operational lease. Lease payments based on operational leases are expensed on a straight-line basis, unless another systematic method is more representative for the time pattern of the benefits for the user. Impairment For each of the Group’s property, plant and equipment it is assessed on each statement of financial position date whether there are any indications of impairment for a particular asset. If any such indications exist, the recoverable amount of the asset has to be estimated. Impairment has been recognized if an asset’s carrying amount exceeds the recoverable value. Impairment has been charged directly to the statement of profit or loss.
e) Investments in joint ventures and associates Investments are accounted for at trade date. These investments are at initial recognition measured at fair value, unless the fair value cannot be reliably determined in which case they are measured at cost. An impairment is recognized if the carrying amount exceeds the expected realizable value.
f) Other investments Investments are accounted for at trade date. Investments in equity securities are undertakings in which the Group does not have significant influence or control. This is the case for companies where the Group holds less than 20% of the voting rights. Such investments are designated as available for sale financial assets and are at initial recognition measured at fair value, unless the fair value cannot be reliably determined in which case they are measured at cost. An impairment is recognized if the carrying amount exceeds the expected realizable value.
g) Inventories Inventories are measured at purchase cost. Their value is determined using the moving weighted average method. An impairment is carried out for consumption goods or necessities that, due to their obsoleteness, are no longer usable for operational purposes or of which the estimated sale price is below the net realizable value. If items of inventory have not been used for more than a year, a loss of 100,00 % is recorded. This impairment loss is recognized as an expense in the statement of profit or loss.
h) Trade and other receivables Trade and other receivables are measured at their amortized cost. In the case of a bankruptcy or judicial reorganization the receivable is immediately impaired and the value added tax recovered, on the basis of a certificate obtained from the curator or a publication of the closing of the bankruptcy in the annex to the Belgian State Gazette. The receivable of the work carried out and services delivered, with the exception of, on the one hand, the damages handled by the legal department and, on the other hand, the receivables from the affiliated municipalities, which are overdue for more than 6 months are recognized as doubtful and are therefore impaired at 100,00 % (excluding VAT). Receivables are permanently impaired (written off) using the provision for bad debts that was set up for this purpose as soon as certificates, provided by bailiffs, lawyers or debt collection agencies can demonstrate that recoverability is not possible. Also when it can be revealed that the revenue associated with a possible recovery does not compensate (i.e. is not economically justified) the costs for this recovery, the receivable is completely impaired using the provision which was set up for this purpose.
Eandis System Operator Group – IFRS – 2017 13 / 47
The impairment losses are recognized in the statement of profit or loss.
i) Cash and cash equivalents Cash and cash equivalents comprise the readily available cash resources, deposits that can be immediately withdrawn from credit institutions and other short-term, highly liquid investments (with a maximum maturity of 3 months), that are readily convertible to known amounts of cash. They are stated at face value, which approximates their fair value. For the purpose of the cash flow statement, they are presented as cash and cash equivalents.
j) Loans and borrowings Interest bearing loans are recognized initially at fair value. Subsequent to initial recognition, interest bearing loans are valued at amortized cost, in which any difference between the proceeds and the reimbursement is charged to the statement of profit or loss using the effective interest method over the maturity of the loans.
k) Employee benefit liability Pension plans and other post-employment benefits The contributions for defined contribution plans have been recognized as an expense at the moment when incurred. Up to 2015 these kinds of pension plans were valued by using the intrinsic value and any individual difference between the mathematical reserve and the minimum guaranteed amount was recorded as a liability in the financial statements. The law was amended on 18 December 2015 and from 1 January 2016 the guaranteed yield was changed to a variable yield (see note 'Pensions and other post-employment benefit plans'). Hence, the provision for defined contribution pension plans is valued as from 2016 according to the ‘Projected Unit Credit’-method (PUC) without projection of the future premiums. The amount recognized in the balance sheet is the difference between this provision and the fair value of plan assets. The Group’s liabilities for the defined benefit plans, as well as for the subsequent costs, have been valued on the basis of the ‘Projected Unit Credit’ method. The amount recognized in the balance sheet represents the present value of the pension liabilities (Defined Benefit Obligation) mentioned, less the fair value of plan assets. Remeasurements comprise actuarial gains and losses, and the return on plan assets (excluding interest) which is reflected in the statement of financial position with a charge or credit recognized in other comprehensive income in the period in which they occur. They are included in the statement of comprehensive income, as items not to be reclassified to profit or loss in subsequent periods. Past service costs are recognized in the statement of profit or loss in the period of a plan amendment. Net interest is calculated by applying the discount rate at the beginning of the period to the net defined benefit liability. The amounts recognized in the statement of profit or loss comprise service costs (including current service costs, past service costs, gains and losses on other long-term employee benefits as well as curtailments and settlements), net interest expense or income and remeasurement. The Group presents the first two components of the defined benefit costs in the statement of profit or loss on the line item Employee benefit expenses and Financial expenses. Other long-term employee benefits contain provisions for retirement and jubilee bonuses. These benefits are treated in the same manner as pension plans; however, past service costs and actuarial gains and losses have immediately been recognized in the statement of profit or loss. Right to reimbursement on post-employment employee benefits A right of reimbursement on post-employment employee benefits has been recognized as an asset, since it is absolutely certain that another party (the shareholders, Distribution System Operators)
Eandis System Operator Group – IFRS – 2017 14 / 47
will take over all obligations relating to the personnel rights of the company's employees or retired employees. The reimbursement rights are therefore recognized at the same value as the recognized employee benefit liabilities (fair value). The adjustments in the period as a result of changes in the assumptions or experience adjustments are all recognized as other comprehensive income as well as these adjustments for the reimbursement rights.
l) Trade and other liabilities Trade and other liabilities have been stated at amortized cost.
m) Current tax liabilities Taxes on the result of the financial year include the taxes due. The taxes contain the expected tax liability on the taxable income of the year and adjustments to the tax liability of prior years. For the calculation of the taxes on the taxable income of the year, the tax rates were used that were enacted (or substantially enacted) by the end of the reporting period.
2.5 Summary of changes in accounting policies applicable as from 2017
The new and amended standards and interpretations applicable from 1 January 2017 do not affect the consolidated financial statements of the Group. These new and amended standards and interpretations applicable for the accounting year beginning on 1 January 2017 were the following:
• Amendments to IAS 7 Statement of Cash Flows – Disclosure Initiative, applicable from 1 January 2017 The amendments are part of the Disclosure Initiative of the IASB; they require entities to provide disclosures about changes in their liabilities arising from financing activities, including both changes arising from cash flows and non-cash changes (such as foreign exchange gains or losses). On initial application of the amendment, entities are not required to provide comparative information for preceding periods.
• Amendments to IAS 12 Income Taxes – Recognition of Deferred Tax Assets for Unrealised Losses, applicable from 1 January 2017 The amendments clarify that an entity needs to consider whether tax law restricts the sources of taxable profits against which it may make deductions on the reversal of that deductible temporary difference. Furthermore, the amendments provide guidance on how an entity should determine future taxable profits and explain the circumstances in which taxable profit may include the recovery of some assets for more than their carrying amount.
• Annual Improvements Cycle - 2014-2016 (published in December 2016), applicable from 1 January 2017. The improvements relate to amendments of the scope of disclosure requirements in IFRS 12 and clarify that the disclosure requirements (other than those in paragraphs B10–B16) apply to an entity’s interest in a subsidiary, a joint venture or an associate that is classified as held for sale.
2.6 Use of estimates and judgments
The preparation of the consolidated financial statements in conformity with IFRS requires management to make judgments, estimates and assumptions that affect the reported amounts of assets and liabilities, and the amounts of revenue and expenses. The estimates and the underlying assumptions have been based on past experience and several other factors that are believed to be reasonable given the circumstances. The results thereof form the basis for the judgment on the carrying amount of assets and liabilities that could not be deduced in a simple way from other sources. The actual results could differ from these estimates.
Eandis System Operator Group – IFRS – 2017 15 / 47
The estimates and underlying assumptions are reviewed on an ongoing basis. Revisions to accounting estimates are recognized in the period in which the estimate is revised, if the revision affects only that period, or the period of the revision and future periods, if the revision affects both current and future periods. Pensions and other post-employment benefit plans The cost of the pension plans and other long-term employee benefits and the present value of the pension obligation are determined using actuarial valuations. This involves making various assumptions that may differ from actual developments in the future. Due to the complexity of the actuarial calculations and the long-term nature of the obligation, the defined benefit obligation is highly sensitive to changes in the assumptions. The major assumptions and the sensitivity analysis are disclosed in note ‘Pensions and other post-employment benefit plans’.
2.7 Standards issued but not yet effective
The standards and interpretations that are issued, but not yet effective, up to the date of issuance of the Group’s financial statements are disclosed below. The Group intends to adopt these standards and interpretations, if applicable, when they become effective. The Group runs a project to assess the impact of the new standards IFRS 9, IFRS 15 and IFRS 16 and to evaluate any system adjustments.
• Amendments to IFRS 2 Share-based Payment - Classification and Measurement of Share-based Payment Transactions, effective 1 January 2018
• Amendments to IFRS 4 Insurance Contracts – Applying IFRS 9 Financial instruments with IFRS 4 Insurance Contracts, effective 1 January 2018
• IFRS 9 Financial Instruments, effective from 1 January 2018 This standard was issued in the framework of a wider project to replace IAS 39 Financial Instruments: Recognition and Measurement. IFRS 9 brings together all three aspects of the accounting for financial instruments project: classification and measurement, impairment and hedge accounting. IFRS 9 is effective for annual periods beginning on or after 1 January 2018, with early application permitted. The Group intends to apply the new standard on the required effective date and will not apply the standard early. The Group has carried out a preliminary impact analysis for all three aspects of IFRS 9: ➢ Classification and valuation: the main financial assets of the Group include loans, lent on
to the DSOs and currently recorded at amortized cost. These loans are held to obtain contractual cash flows and it is expected to obtain cash flows that only consist of receipts of principal and interest. The Group has analyzed the characteristics of the contractual cash flows of each of these loans in detail and concluded that these instruments meet the criteria of IFRS 9 for valuation at amortized cost. Consequently, the current accounting treatment can be preserved under the new standard.
➢ Impairments: all trade receivables of the Group are short term receivables. The currently used depreciation principles may be maintained under the new standard. The impairment for the receivables of social customers will be adjusted. The additional costs for impairment that will be recognized will also be passed on to the shareholders, DSOs, and will therefore not affect the Group's results.
➢ Hedge accounting: the Group has no derivatives, hence hedge accounting does not apply.
• Amendments to IFRS 9 Financial Instruments - Prepayment Features with Negative Compensation, effective 1 January 2019
Eandis System Operator Group – IFRS – 2017 16 / 47
• IFRS 15 Revenue from Contracts with Customers, including amendments to IFRS 15: Effective date of IFRS 15 and Clarifications to IFRS 15, effective 1 January 2018 IFRS 15 establishes a five-step model to account for revenue arising from contracts with customers. Under IFRS 15, revenue is recognized at an amount that reflects the consideration to which an entity expects to be entitled in exchange for transferring goods or services to a customer. The new revenue standard will supersede all current revenue recognition requirements under IFRS. IFRS 15 shall apply to financial years beginning on or after 1 January 2018. The Group intends to apply the new standard on the required effective date retrospectively and will not apply the standard earlier. The Group has carried out an impact analysis of which the main findings are; the main revenue stream of the Group results from passing on the costs of development, management and maintenance of the distribution networks to its shareholders, the seven DSOs. IFRS 15 has no effect on the processing of these proceeds. Consequently, the current accounting treatment will be preserved under the new standard.
• IFRS 16 Lease, effective 1 January 2019 IFRS 16 sets out the principles for the recognition, measurement, presentation and disclosure of leases and requires lessees to account for all leases under a single on-balance sheet model similar to the accounting for finance leases under IAS 17 Leases. The standard includes two recognition exemptions for lessees – leases of ’low-value’ assets (e.g. personal computers) and short term leases (i.e. leases with a lease term of 12 months or less). At the commencement date of a lease, a lessee will recognize a liability to make lease payments (i.e. the lease liability) and an asset representing the right to use the underlying asset during the lease term (i.e. the right-of-use asset). Lessees will be required to separately recognize the interest expense on the lease liability and the depreciation expense on the right-of-use asset in the profit or loss statement. Lessees will also be required to remeasure the lease liability upon the occurrence of certain events (e.g. a change in the lease term, a change in future lease payments resulting from a change in an index or rate used to determine those payments). The lessee will generally recognize the amount of the remeasurement of the lease liability as an adjustment to the right-of-use asset. During 2018, the Group will continue to carry out its assessment of the possible impact of IFRS 16 on the consolidated financial statements.
• IFRS 17 Insurance Contracts, effective 1 January 2021
• Amendments to IAS 28 Investments in Associates and Joint Ventures – Long term Interests on Associates and Joint Ventures, effective 1 January 2019
• Amendments to IAS 40 Investment Property – Transfers of Investment Property, effective 1 January 2018
• IFRIC 22 Foreign Currency Transactions and Advance Consideration, effective 1 January 2018
• IFRIC 23 Uncertainty over Income Tax Treatments, effective 1 January 2019
• Annual Improvements Cycle - 2014-2016, effective 1 January 2018
• Annual Improvements Cycle – 2015-2017, effective 1 January 2019
• Amendments to IAS 19 Amendments, Curtailment or Settlement, effective 1 January 2019
Eandis System Operator Group – IFRS – 2017 17 / 47
Performance of the year
3 Operating revenue
(In thousands of EUR) 2017 2016
Recharge of costs to the distribution system operators 1.000.481 970.053
Construction works for third parties 5.581 5.790
Revenue 1.006.062 975.843
Other operating revenue 21.116 22.278
Total 1.027.178 998.121
The total operating revenue has increased, when compared to 2016, with 29.057 k EUR from 998.121 k EUR to 1.027.178 k EUR. The Group realized most of its revenue from management fees invoiced mainly to the Distribution System Operators. The pass-through via the management invoices reflects all costs necessary in order to carry out its duties as an independent service delivery company for the operation of the electricity and gas grids. The billing of ‘Construction works for third parties’ comprises revenue from various executed works for third parties for. energy services to local authorities (ESLA) and public lighting. Hereunder is the detail of the pass-through to the customers:
2017 2016
Company
Revenue in k
EUR
% relative to
revenue
Revenue in k
EUR
% relative to
revenue
Gaselwest 194.037 19,3% 194.954 20,0%
IMEA 109.799 10,9% 98.409 10,1%
Imewo 233.164 23,2% 216.260 22,2%
Iveka 137.880 13,7% 141.924 14,5%
Iverlek 203.820 20,3% 200.081 20,5%
Other 127.362 12,7% 124.215 12,7%
Total 1.006.062 100,0% 975.843 100,0%
The ‘Other operating revenue’ mainly comprises groundworks in synergy, whereby their respective share in the costs is charged to the other utility companies as well as repayments of general costs of contractors, insurance companies and other entities.
Eandis System Operator Group – IFRS – 2017 18 / 47
4 Cost for services and other consumables
(In thousands of EUR) 2017 2016
Cost contractors for grid construction and maintenance 234.880 208.037
Cost for direct purchases 68.115 65.471
Fee for usage of installations including charges 63.283 64.269
Subsidy for rational use of energy (RUE) 62.804 72.595
Contracts and administration costs 12.584 8.581
Consultancy and other services 58.222 51.220
Other 48.107 45.136
Total 554.667 522.885
The cost for services and other consumables increases with 31.782 k EUR compared to 522.885 k EUR in 2016 and amounts to 554.667 k EUR in 2017. The costs for the rational use of energy (RUE) amount to 62.804 k EUR in 2017 and 72.595 k EUR in 2016. These costs reflect the payment of the premiums for RUE applied for by individuals and companies. For 2017, the Flemish Government provided for the payment of the same RUE premiums as for 2016. The subsidy amounts are lower for certain applications in 2017 as well as stricter technical conditions apply in the field of energy. The item ‘Other’ comprises the costs for rent, communication, transportation, insurance, seminars and other. All of these costs have been recharged mainly to the Distribution System Operators.
5 Employee benefit expenses
(In thousands of EUR) 2017 2016
Remunerations 261.585 257.575
Social security contributions 67.326 70.644
Contributions to defined benefit plans and other insurances 16.610 14.850
Other personnel costs 21.658 17.894
Total 367.179 360.963
The employee benefit expenses amounted to 367.179 k EUR in 2017, an increase of 6.216 k EUR compared to 360.963 k EUR in 2016. The average number of employees amounted to 4.262 persons in 2017.
Eandis System Operator Group – IFRS – 2017 19 / 47
6 Financial results
(In thousands of EUR) 2017 2016
Interest income distribution system operators 107.454 108.623
Interest income banks 5 1
Other financial income 459 483
Total financial income 107.918 109.107
Interest expenses distribution system operators 68 89
Interest expenses banks 965 1.004
Interest expenses bond loans 107.371 108.510
Other financial expenses 7.386 9.603
Total financial expenses 115.790 119.206
The interest income was principally realized from the interest on the loans to the Distribution System Operators, as well as the interest on the cash pool activities with the Distribution System Operators. Other financial income mainly comprises financial discounts (365 k EUR in 2017; 291 k EUR in 2016), income from the sale of ‘investments in other companies’ (0 k EUR in 2017; 81 k EUR in 2016). The interest expenses were the result of the interest on the bond loans, loans with the banks and partly from the cash pool activities with the Distribution System Operators. The other financial expenses comprise costs related to debt, financial costs for rent, interest costs on pension liabilities and various bank costs.
7 Income tax expenses
(In thousands of EUR) 2017 2016
Current income tax expenses −10.062 −9.200
Current income tax expenses on previous year result 642 7
Total income tax expenses −9.420 −9.193
Eandis System Operator Group – IFRS – 2017 20 / 47
(In thousands of EUR) 2017 2016
Profit before tax 9.420 9.193
Effect non-deductible expenses 20.182 17.877
Effect deductible expenses −1 −3
Tax basis 29.601 27.067
Total current income tax expenses −10.062 −9.200
* Subject to the Belgian legal tax rate of 33,99 % Total income tax expenses amount to 9.420 k EUR at the end of 2017 and 9.193 k EUR at the end of 2016. This increase is the result of the higher amount of non-deductible expenses on which the tax calculation is based. The income tax expenses consist of prepaid taxes for the financial year 2017 (4.337 k EUR; 2016: 1.569 k EUR), the estimated income taxes for 2017 (5.725 k EUR; 2016: 7.631 k EUR) and a regularization for the 2015 financial year (-642 k EUR). Also in 2017 the amount of 5.354 k euro was paid that relates to 2015. As a result, the total of taxes paid amount to 9.691 k EUR (2016: 1.569 k EUR). On 22 December 2017, the Federal Parliament approved the corporate income tax reform that will lead to a step-by-step reduction of the current tax rate of 33,99 % from 2018 onwards. The tax rate will be 29,58 % as from tax year 2019 (financial year 2018) and 25,00 % as from tax year 2021 (financial year 2020). Compensatory measures were also introduced as this reform had to be budget neutral.
Eandis System Operator Group – IFRS – 2017 21 / 47
Assets
8 Intangible assets
(In thousands of EUR)
Licences and
similar rights Total
Acquisition value at 1 January 2017 4.749 4.749
Acquisitions 19 19
Acquisition value at 31 December 2017 4.768 4.768
Amortization and impairment at 1 January 2017 3.969 3.969
Amortization 330 330
Amortization and impairment at 31 December 2017 4.299 4.299
Net book value at 31 December 2017 469 469
(In thousands of EUR)
Licences and
similar rights Total
Acquisition value at 1 January 2016 4.745 4.745
Acquisitions 4 4
Acquisition value at 31 December 2016 4.749 4.749
Amortization and impairment at 1 January 2016 3.541 3.541
Amortization 428 428
Amortization and impairment at 31 December 2016 3.969 3.969
Net book value at 31 December 2016 780 780
Eandis System Operator Group – IFRS – 2017 22 / 47
9 Property, plant and equipment
(In thousands of EUR)
Installation,
machinery and
equipment
Furniture and
vehicles Others Total
Acquisition value at 1 January 2017 70 68 799 1 490 70 359
Acquisitions 115 709 142 966
Sales and disposals 0 −144 −68 −212
Acquisition value at 31 December 2017 185 69 364 1 564 71 113
Depreciation and impairment at 1 January 2017 25 67 401 630 68 056
Depreciation 15 729 109 853
Sales and disposals 0 −120 −68 −188
Depreciation and impairment at 31 December
2017 40 68 010 671 68 721
Net book value at 31 December 2017 145 1 354 893 2 392
(In thousands of EUR)
Installation,
machinery and
equipment
Furniture and
vehicles Others Total
Acquisition value at 1 January 2016 70 68.749 1.913 70.732
Acquisitions 0 50 694 744
Sales and disposals 0 0 −1.117 −1.117
Acquisition value at 31 December 2016 70 68.799 1.490 70.359
Depreciation and impairment at 1 January 2016 18 66.528 1.674 68.220
Depreciation 7 873 40 920
Sales and disposals 0 0 −1.084 −1.084
Depreciation and impairment at 31 December
2016 25 67.401 630 68.056
Net book value at 31 December 2016 45 1.398 860 2.303
As of 31 December 2017 and 2016 there were no limitations on ownership and on property, plant and equipment which serve as guarantee for obligations. There were no engagements for the acquisition of property, plant and equipment at the end of 2017 and 2016.
Eandis System Operator Group – IFRS – 2017 23 / 47
10 Investments in other companies The investments in other companies amount to 30 k EUR at the end of 2017 and 30 k EUR at the end of 2016. These investments are held in Atrias cvba, Synductis cvba, Warmte@Vlaanderen cvba and Fluvius cvba. On 9 May 2011, Atrias cvba was established as a joint initiative of Belgium's five largest distribution system operators Eandis, Infrax, Ores, Sibelga and RESA. Atrias is a central clearing house for the Distribution System Operators and charged with the development of a Message Implementation Guide (MIG), the development of a clearing house application, and the management and maintenance of this application. MIG describes how the communication flow between the various players of the energy market should happen. The Group has acquired 25 % of the shares representing an amount of 5 k EUR. Atrias is an unlisted company and has no official price quotation. Synductis cvba was founded on 21 December 2012 and aims to coordinate the infrastructure works by various utility companies in the Flemish cities and municipalities and so reduce nuisance of the works. Eandis System Operator participates in the 'implementation coordination' and 'planning coordination' sectors. The Group held an investment of 7 k EUR or 33,23 % of the shares during 2017 (2016: 33,24 %). Synductis is an unlisted company and has no official price quotation. The Group receives its share of the operating costs of Atrias and Synductis. But the Group also grants services and funding (see note ‘Related parties’). During 2016, the Group participates for 50,00 % in the newly formed company Warmte@Vlaanderen cvba (amounting to 9 k EUR) and also for 50,00 % in the company Fluvius cvba (amounting to 9 k EUR). These companies are commonly owned by Eandis System Operator and Infrax (distribution operator for natural gas, electricity, cable television and sewerage in the Flemish region) but are not yet operational.
11 Other investments The other investments comprise the participations still held by the Group in the business centres situated in the distribution area of Gaselwest (business centres Kortrijk, Roeselare, Flemish Ardennes and Waregem) and Imewo (business centres Bruges, Ghent, Meetjesland and Ostend). The other investments amount to 832 k EUR at the end of 2017 (2016: 832 k EUR).
12 Rights to reimbursement on post-employment employee benefits The costs related to the employee benefit liabilities are recoverable from the Distribution System Operators. At the end of 2017 the rights to reimbursement on the long-term employee benefits amounted to 210.947 k EUR and 259.363 k EUR at the end of 2016 (see note ‘Pensions and other post-employment benefit plans’).
Eandis System Operator Group – IFRS – 2017 24 / 47
13 Short- and long-term receivables, other
(In thousands of EUR) 2017 2016
Receivable from DSO following lending-on funds from issuance bonds with private
investors (retail) 0 150.000
Total short-term receivables 0 150.000
Receivable from DSO following lending-on funds from issuance bonds with private
investors (retail) 370.000 170.000
Receivable from DSO following lending-on funds from issuance bonds with
institutional investors (stand alone) 440.000 440.000
Receivable from DSO following lending-on funds from issuance bonds with European
*Euro Medium Term Note (EMTN) programme – see note ‘Financial instruments’
The long-term receivables increase from 3.270.891 k EUR at the end of December 2016 to 3.470.861 k EUR at the end of December 2017 because of the issuance of a retail bond amounting to 200.0000 k EUR in June 2017 that is lent on to the DSOs. The short-term receivables, on the other hand, decreased by 150.000 k EUR from 150.000 k EUR to 0 k EUR due to the repayment of the retail bond by the DSOs to Eandis System Operator, who in turn had to repay its bondholders. The terms of the long-term loans to the Distribution System Operators were identical to those of the respective bond loans (see note ‘Interest bearing loans and borrowings’).
14 Inventories
(In thousands of EUR) 2017 2016
Trade receivables - gross 39 526 41 207
Impairments on trade receivables −5 880 −5 912
Total 33 646 35 295
The impairment losses (charge back) amounted to 32 k EUR in 2017 (2016: 5.247 k EUR netted write back). These amounts were included in the profit or loss account.
Eandis System Operator Group – IFRS – 2017 25 / 47
15 Trade and other receivables, receivables cash pool activities
(In thousands of EUR) 2017 2016
Trade receivables - gross 159.006 217.693
Impairments on trade receivables −3.586 −6.440
Trade receivables - net 155.420 211.253
Other receivables 135.251 111.393
Total trade and other receivables 290.671 322.646
Receivables cash pool activities 19.402 307.587
The trade receivables consist mainly of receivables with the Distribution System Operators and amount to 117.309 k EUR in 2017 and 176.564 k EUR in 2016. This decrease in the receivables from the Distribution System Operators is the result of the larger amount of charges at year end 2016 to be invoiced to the DSOs and the DSOs paying these management fees at their due date instead of direct payments. Besides, receivables are recorded amounting to 37.413 k EUR (2016: 33.836 k EUR) relating to an external customer group. Based on the valuation principles, an impairment of 3.586 k EUR (2016: 6.440 k EUR) was to be recorded. The increase in the ‘Other receivables’ is mainly due to an increase of the receivable amounting to 71.275 k EUR (2016: 52.941 k EUR) for a VAT amount to be recovered from the members of the VAT group. The other receivables also contain accrued interest from the Distribution System Operators on the bonds that were recharged. The item ‘Receivables cash pool activities’ comprises the balances on the accounts of the Distribution System Operators related to the cash pool and should be evaluated together with the item 'Liabilities cash pool activities'. The information regarding outstanding balances with the associate was included in note ‘Related parties’
16 Cash and cash equivalents Cash resources amount to 31.390 k EUR in 2017 (2016: 2.662 k EUR) and comprise bank deposits, cash resources and fund investments that are readily exchangeable into cash. All resources are reported in euro. As a result of the low (and even negative) interest on deposit accounts, the surplus of cash received from the sale of heat and power certificates, the green energy certificates and the intervention by the Flemish Energy Agency in particular of the sale of the aforementioned green energy certificates for the DSOs, is held as cash and cash equivalents.
Eandis System Operator Group – IFRS – 2017 26 / 47
Liabilities
17 Equity The separate components of shareholders’ equity and the movements therein from 1 January 2016 until 31 December 2017 are included in the ‘Statement of changes in equity’. The share capital amounts to 915.124,84 EUR (unchanged since 2016) and was fully subscribed and paid up. It is represented by 17.189.104 shares without indication of nominal value. Each share represents 1/17.189.104th part of the capital. The shares are nominative in the name of the Distribution System Operators and are distributed as follows:
Distribution System Operator
Amount in
EUR
Number of
shares %
Gaselwest 151.886 2.852.920 16,60
IMEA 125.921 2.365.216 13,76
Imewo 205.136 3.853.144 22,42
Intergem 100.169 1.881.507 10,95
Iveka 131.258 2.465.460 14,34
Iverlek 177.811 3.339.885 19,43
Sibelgas 22.944 430.972 2,51
Total 915.125 17.189.104 100,00
The total share capital consists of the fixed part, amounting to € 18.550,00 and the variable part, amounting to € 896.574,84. The variable part of the capital is the result of the acquisition of the activities and employees of the subsidiary Indexis cvba as at 1 January 2016. The minority interest of 30 %, held by ORES, was transferred to the DSOs. The merger was part of a reorganization of the energy market, in which all gridoperators of Atrias wanted to establish a federal clearing house. Therefore, the company Atrias cvba was founded by the distribution system operators. The activities of Indexis overlapped with those of Atrias. Partly due to the introduction of an important application at ORES, the Indexis application will be used exclusively by and for Eandis System Operator. Therefore it was decided that Eandis System Operator would merge with Indexis. Consequently, all the assets and liabilities were merged into Eandis System Operator at 1 January 2016 but excluding the French-speaking staff who are transferred to ORES, but are seconded to Eandis System Operator. The reserves amount to 72 k EUR at the end of 2017 2016: 72 k EUR). The legal reserve was formed out of profits to be distributed at a rate of 5,00 % up to a maximum of 10,00 % of the assigned capital. The Group’s results are in all cases without profits or losses, since all operational costs can be billed through to mainly the Distribution System Operators. The non-controlling interest at the end of 2017 amounts to 93 k EUR (2016: 93 k EUR) comprising the participation held by Farys/TMVW in De Stroomlijn.
Eandis System Operator Group – IFRS – 2017 27 / 47
18 Interest-bearing loans and borrowings
(In thousands of EUR) 2017 2016
Long-term loans 3.449.329 3.247.152
Current portion of long-term loans 0 150.012
Short-term loans 0 411.309
Short-term loans 0 561.321
Total 3.449.329 3.808.473
At the balance sheet date of 2017, the interest bearing loans and borrowings decrease with 359.144 k EUR from 3.808.473 k EUR in 2016 to 3.449.329 k EUR in 2017. The retail bond loan of 150.000 k EUR repaid in 2017 was refinanced with a new issue of a retail bond loan of 200.000 k EUR. The successful sale by the Distribution System Operators of mainly green energy certificates and additionally, the purchase of green energy certificates and heat and power certificates by the Flemish Energy Agency resulted for Eandis System Operator to a full reduction of the short term financing for the Distribution System Operators. The movements of the long- and short-term loans can be analyzed as follows:
(In thousands of EUR) 2017 2016
Cash Non-cash Cash Non-cash
Total as at 1 January 3.808.473 3.619.998
Movements on non-current loans (LT)
Proceeds of non-current loans 199.737 0 0 0
Change in non-current loans 0 2.440 0 2.404
Transfer of short-term portion of LT loan to ST 0 0 0 −150.012
Movements on current loans (ST)
Proceeds of current loans 0 0 411.309 0
Transfer of short-term portion from LT loan to
ST 0 0 0 150.012
Change in current loans 0 −12 0 0
Repayment of short-term portion of long-term
loan −150.000 0 0 0
Repayment current loans −411.309 0 −225.238 0
Total movements −361.572 2.428 186.071 2.404
Total at end of reporting period 3.449.329 3.808.473
Eandis System Operator Group – IFRS – 2017 28 / 47
Loans on long-term All outstanding loans are expressed in euro and have a fixed interest rate. For all the bond loans, each of the DSOs is guarantor on a several but non-joint basis, but limited to its proportional share in the capital of Eandis System Operator. At the end of 2017
Bond issue - retail 319.958 320.000 4,00 - 4,25 2017-2020
Bond issue - EMTN* 2.642.164 2.660.500 1,75 - 4,50 2021-2033
Bond issue - private** 435.042 440.000 2,60 - 3,55 2027-2044
Total 3.397.164 3.420.500
Current portion of long-term debt −150.012 −150.000
Total long-term loans 3.247.152 3.270.500
* EMTN: Euro Medium Term Note (is a programme to provide to the Group the flexibility to issue bond loans with different maturities) ** Private: bond issues according to German law: Schuldschein and Namensschuldverschreibung as well as private issues to institutionals (stand alone) The yield at issue price represents the gross actuarial yield at issue. The capital of the debenture is repayable at maturity. During the first half of 2017, one additional bond for the general public (retail issue) was issued with a nominal value of 200.000 k EUR, an annual coupon of 2,00 % with a net yield of 1,153 % and for a period of 8 years until 23 June 2025 to replace the retail bond of 2010 that was repayable on 23 June 2017 which had a coupon of 4,00 %.
Eandis System Operator Group – IFRS – 2017 29 / 47
Loans on short-term The loans on short-term contain the portion of the long-term loans which are repayable within one year (0 k EUR on year-end 2017, 411.309 k EUR on year-end 2016) and the loans drawn with financial institutions as reported below:
(In thousands of EUR) Maturity
Available
amounts
Amounts
used
Amounts
not used
Average
interest
rate*
Commercial paper NA 522.000 0 522.000 NA
Fixed advances NA 200.000 0 200.000 NA
Fixed loans/Bank overdraft NA 200.000 0 200.000 NA
Fixed loans NA 100.000 0 100.000 NA
Total on 31 December 2017 1.022.000 0 1.022.000
Commercial paper (1) 522.000 355.000 167.000 0,06%
Total on 31 December 2016 1.022.000 411.309 610.691
* The average interest rate of the used amounts at the end of the period (1) 50.000 k€ at 13/1/2017, 50.000 k€ at 31/1/2017, 155.000 k€ at 7/2/2017 and 100.000 k€ at 13/2/2017 NA Not applicable
All short-term loans are subscribed by Eandis System Operator in the name and on behalf of the Distribution System Operators who stand surety for their part and act as joint co-debtor except for the bank overdrafts.
19 Employee benefit liability Defined contribution plans Employees hired after 1 January 2002 and the executive staff hired after 1 May 1999 are entitled to defined contribution plans: these pension plans provide in a lump sum on retirement resulting from the contributions paid and the return granted by the pension institutions, as well as a lump sum and orphan interests in case of decease before retirement. The financing is carried out by employee contributions and employer contributions that are deposited in pension funds (Powerbel and Enerbel) and group insurances. The assets are managed within a Luxembourg Fund (Esperides), divided in 4 investment zones, each representing a different risk profile (low risk, medium risk, high risk and dynamic asset allocation). The risk level also has to be managed taking into account the age of the members. This is why the trustees of Powerbel have proposed to the members a new option (2015) to manage their assets. This option, called ‘Life-Cycle’, offers an evolution of the risk exposure from growth to more defensive throughout the member’s career. Each year the participant has the opportunity to change his investment strategy, for the future allowances of the employer or for the totality of the accumulated sums in his account. Due to the declining level of the interest rates of the bonds, pension institutions, managing the DC-plans, faced the challenge to continue to cover the level of the guaranteed interest rates. A reform
Eandis System Operator Group – IFRS – 2017 30 / 47
was imposed and was announced with the publication on 24 December 2015 of the Act of 18 December 2015 guaranteeing the sustainability and the social character of supplementary pensions and strengthening the complementary nature with respect to the retirement pension plans. This law entered into force on 1 January 2016. The amendment implies that the DC pension plans are to be valued as from 1 January 2016 according to the Projected Unit Credit (PUC) method without projection of future contributions. Until 2015 the intrinsic valuation method was applied. The guaranteed interest will now be variable and each year aligned to the average return over the last 24 months of linear bonds of the Belgian State (OLOs) with a duration of 10 years (at least 1,75 % and maximum 3,75 %). The new interest rate for 2017 and 2016 is 1,75 % and is applied, according to the vertical method, for all contributions paid to the pension funds and in the insurance company (products of TAK 21 with interest guarantee). The pension funds are not subject to the Solvency II regulation of insurance companies and can obtain better expected returns by diversification of their investments. Hence, the reserves and a compensation of the group insurance was transferred during 2016 to a pension fund (OFP Powerbel/OFP Enerbel) as a cash-balance plan with a minimum guaranteed return of 3,25 % (see table Classification of the plan investments on the balance sheet date). Defined benefit plans The Collective Labour Agreement of 2 May 1952 stipulated an additional pension equal to 75 % of the last annual salary after deduction of the legal pension at the end of a complete career, as well as a survival pension and an orphan allowance. This defined benefit plan has been fully paid up by the employer and the pensions have been paid out directly to the beneficiaries. The remaining subsequent obligations are for the largest part related to current pensions. The majority of the employees hired before 1 January 2002 and the executive staff hired before 1 May 1999 are entitled to defined benefit plans which provide in the payment of a lump sum on retirement, and a lump sum and orphan interest in case of decease before retirement. These benefits are calculated taking into account the last annual salary and past service. The financing is carried out by employee contributions and employer contributions that are deposited in pension funds (OFP Elgabel and OFP Pensiobel) and group insurances. Due to changes to the pension regulation in Belgium, the members of the pension plan Pensiobel were offered the opportunity to move as from 1 January 2015 to the defined contribution plan Powerbel. The accumulated and improved acquired rights (in Pensiobel) are capitalized at market returns but with a minimum return equal to 3,25 % (cash-balance plan). The Group also grants post-retirement allowances being reimbursement of healthcare costs and tariff benefits. The other long-term employee benefits contain provisions for retirement and jubilee bonuses. The current defined benefit plans are financed through pension funds in which the assets, dedicated to specific plans, are identified. The Belgian legislation and the pension regulations provide that the dedicated assets should only finance the relevant benefits. This results for 2017 in determining an asset ceiling for two pension plans. The determination of the asset ceiling takes into consideration the projected total benefit payable under the assumptions and as per the pension plan rules. Right of reimbursement Since the expenses related to the employee benefits are reclaimable from the Distribution System Operators, rights of reimbursement, equal to the employee benefit liability reported in the balance sheet, are recognized.
Eandis System Operator Group – IFRS – 2017 31 / 47
Actuarial risks The defined benefit plans expose the Group to various actuarial risks: Investment risk The present value of the defined benefit plan liability is calculated using a discount rate determined to high quality corporate bond yields. If the return on plan asset is below this rate, it will create a plan deficit. Currently the plan has a relatively balanced investment which is reported in the table below ‘Classification of the plan investments on the balance sheet date’. Due to the long-term nature of the plan liabilities, the board of the pension fund considers it appropriate that a reasonable portion of the plan assets should be invested in equity securities to leverage the return generated by the funds. Interest rate risk A decrease in the bond interest rate will increase the plan liability. However, this will be partially offset by an increase in the return on the plan’s debt investments. Longevity risk The present value of the defined benefit plan liability is calculated by reference to the best estimate of the mortality of plan participants both during and after their employment. An increase in the life expectancy of the plan participants will increase the plan’s liability. From 2015 onwards, new prospective mortality tables are used as proposed by the Institute of Actuaries in Belgium (IA|BE). Salary risk
The present value of the defined benefit plan liability is calculated by reference to the future salaries of plan participants. As such, an increase in the salary of the plan participants will increase the plan’s liability.
Eandis System Operator Group – IFRS – 2017 32 / 47
The major actuarial assumptions used at balance sheet date to determine the provision for employee benefits and other allowances:
2017 2016
Discount rate - pensions DB 1,01% 1,28%
Discount rate - pensions DC 1,66% 1,28%
Discount rate - others 1,55% 1,77%
Expected average salary increase (inflation excluded) 0,85% 0,85%
Expected inflation 1,75% 1,65%
Expected increase of health benefits (inflation included) 2,75% 2,65%
Expected increase of tariff advantages 1,75% 0,25%
Average assumed retirement age 63 63
Mortality table used
IA|BE
Prospective
Tables
IA|BE
Prospective
Tables
Turnover 0% to 3,18% 0,00%
Life expectancy in years of a pensioner retiring at age 65:
For a Person aged 65 at closing date:
- Male 20 20
- Female 24 24
For a Person aged 65 in 20 years:
- Male 22 22
- Female 26 26
Eandis System Operator Group – IFRS – 2017 33 / 47
Amounts recognized in comprehensive income
(In thousands of EUR) 2017 2016
Service cost
Current service cost −26.790 −34.741
Cost of early retirement −133 −26
Actuarial gains/(losses) on other long-term benefits 4.404 −8.069
Net interest on the net defined benefit liability/(asset)
Interest cost on defined benefit obligation −12.120 −16.851
Interest income on plan assets 8.623 11.229
Defined benefit costs recognized in profit or loss −26.016 −48.457
Actuarial gains/(losses) on defined benefit obligation arising from
i) changes in demographic assumptions 7.342 26.827
ii) changes in financial assumptions 7.484 −81.571
iii) changes from experience adjustments 26.279 −40.669
Return on plan assets (excluding interest income) 8.220 90.102
Change in the effect of the asset ceiling −44.178 0
Remeasurements of net defined benefit liability/(asset) recognised in Other
Comprehensive Income (OCI) 5.147 −5.311
Total −20.869 −53.769
Amounts recognized in the balance sheet
(In thousands of EUR)
Present value
of funded
defined benefit
obligation
Fair value of
plan assets Funded status
Pensions - funded status 622.763 −645.527 −22.764
Pensions - unfunded status 25.547 0 25.547
Healthcare costs, tariff benefits - unfunded status 160.828 0 160.828
Other long-term employee benefits - funded status 62.525 −15.189 47.336
Total defined benefit obligation and longterm employee
benefits at 31 December 2017 871.663 −660.716 210.947
Pensions - funded status 670.981 −657.662 13.319
Pensions - unfunded status 25.134 0 25.134
Healthcare costs, tariff benefits - unfunded status 165.464 0 165.464
Other long-term employee benefits - funded status 69.304 −13.858 55.446
Total defined benefit obligation and longterm employee
benefits at 31 December 2016 930.883 −671.520 259.363
Eandis System Operator Group – IFRS – 2017 34 / 47
Changes in the present value of the obligation
(In thousands of EUR) 2017 2016
At the beginning of the period 930.883 842.791
Current service cost 24.396 30.960
Interest cost/income 12.120 16.851
Contributions from plan participants 2.394 3.781
Cost of early retirement 133 26
Remeasurement (gains)/losses in Other Comprehensive Income (OCI) arising from
i) changes in demographic assumptions −18.009 −23.827
ii) changes in financial assumptions −3.155 87.769
iii) changes from experience adjustments −25.266 39.391
Taxes on contributions paid −1.321 −2.087
Payments from the plan −50.512 −64.772
At the end of the period 871.663 930.883
Changes in the fair value of the plan assets
(In thousands of EUR) 2017 2016
Total at 1 January −671.520 −511.541
Interest income −8.623 −11.229
Return on plan assets (excluding amounts included in net interest expense) −7.300 −89.953
Effect of the asset ceiling 44.178 0
Contributions from employer −65.569 −119.787
Contributions from plan participants −2.394 −3.781
Benefit payments 50.512 64.771
Total at 31 December −660.716 −671.520
Actual return on plan assets −15.923 −101.182
Eandis System Operator Group – IFRS – 2017 35 / 47
Classification of the plan investments on the balance sheet date The classification of the plan investments in function of the major category at the end of 2017
Category Currency
Elgabel
%
Pensiobel
%
Insurance
companies
%
Powerbel
and
Enerbel % Total %
Investments quoted in an active
market 79,70 80,16 77,28 86,55 80,42
Shares Eurozone 15,88 17,45 6,62 13,16 15,79
Shares
Outside
eurozone 21,55 21,14 0 25,16 21,11
Government bonds Eurozone 4,16 4,08 20,47 5,34 4,75
Other bonds Eurozone 29,80 29,32 50,19 33,04 30,61
The results of the sensitivity analysis are included below to explain the impact of the assumptions.
(In thousands of EUR)
Effect: increase
(+) / decrease (-)
Increase of discount rate (0,5%) −39.786
Average salary increase - excluding inflation (0,5%) 30.791
Increase of inflation (0,25% movement) 13.741
Increase of healthcare care benefits (1,0%) 16.918
Increase of tariff advantages (0,5% movement) 4.980
Increase of life expectancy of male pensioners (1 year) 4.794
Increase of life expectancy of female pensioners (1 year) 9.675
The annual balance of the defined benefit lump sum is financed by the Group through a recurrent allocation expressed as a percentage of the total payroll. This percentage is defined by the aggregate cost method and is reviewed annually. This method of financing is used to smooth out future costs over the remaining period of the plan. The costs are estimated on projected bases (salary growth and inflation taken into account). The assumptions related to salary increase, inflation, employee turnover and age-term are defined on the basis of historical statistics of the Group. The mortality tables used are the ones corresponding to the observed experience within the financing vehicle. The discount rate is set up with regard to the investment strategy of the company. These assumptions are challenged on a regular basis. Exceptional events (such as modification of the plan, change of assumptions, too short degree of coverage...) can eventually lead to additional payments by the Group. The average duration of the defined benefit obligation at 31 December 2017 is 9 years (2016: 9 years). The Group estimates to contribute 39.836 k EUR to the defined benefit pension plans in 2017 and 11.113 k EUR to the defined contribution plans.
Eandis System Operator Group – IFRS – 2017 37 / 47
20 Trade payables and other liabilities, liabilities cash pool activities, current tax liabilities
(In thousands of EUR) 2017 2016
Trade debts 87 021 81 572
Invoices to be received 34 630 37 561
Subtotal 121 651 119 133
VAT 36 587 24 405
Taxes payable on remuneration 1 587 1 767
Remuneration and social security 70 791 76 483
Other current liabilities 58 919 48 080
Total trade payables and other current liabilities 289 535 269 868
Liabilities cash pool activities 96 415 0
Current tax liabilities 13 315 13 586
The items relating to trade payables and other current liabilities decreased with 19.667 k EUR from 269 868 EUR at end 2016 to 289 535 k EUR at end 2017, mainly due to the increase of the VAT balances payable and the other current liabilities. These other current liabilities mainly comprise the costs to be attributed, principally relating to the finance costs for issuing bonds, car fleet and Information & Communication Technology projects. The payable cash pool activities amount to 96 415 k EUR at year end 2017 (2016: 0 k EUR as only receivables were recorded then) (see note Trade and other receivables, receivables cash pool activities). The payment term and conditions for these payables are as follows: For the standard trade contracts the average payment term was 39 days and for contractors 30 days after invoice date. The Value Added Tax payable and the withholding tax payable were due 20 and 15 days respectively after the end of the month. All amounts were paid on their expiry date.
Eandis System Operator Group – IFRS – 2017 38 / 47
Financial instruments
21 Financial instruments: policy Risks It is the Group’s intention to understand all risks separately, as well as their mutual connections, and to define strategies in order to manage the economic impact on the Group’s results. The Audit Committee is responsible for reviewing the risk analysis, for the approval of the recommended risk management strategies, for compliance with the guidelines on risk management and reporting. The Group’s functioning as the operating company for the Distribution System Operators limits to a large degree the risks and their possible negative impact. Equity structure The Group’s equity structure consists of equity and the financial liabilities. Apart from the legally required minimum levels for equity that are applicable for Eandis System Operator and its subsidiary, investments in joint ventures and associates the Group is not subject to any external required qualifications for its capital structure. Within the Group short-term financing has been called upon to support the working capital. The long-term loans are contracted by Eandis System Operator to finance the DSOs and are lent through at the same conditions as the contracted loans. Credit risk
The credit risk comprises the risk that one party to a financial instrument will cause a financial loss for the other party by failing to discharge an obligation. The maximum credit risk is each financial asset’s balance sheet value. The Group recharges its costs mainly to its shareholders, its non-controlling interests and the associates, whereby it limits its credit risk. Ageing analysis of trade receivables past due, but not impaired
(In thousands of EUR) 2017 2016
0 - 30 days 6.915 2.625
31 - 60 days 1.919 2.115
61 - 90 days 1.084 1.093
91 - 120 days 1.213 1.024
>120 days 6.624 2.436
Total overdue 17.755 9.293
Eandis System Operator Group – IFRS – 2017 39 / 47
Movements in accumulated impairments on trade receivables
(In thousands of EUR) 2017 2016
Total at 1 January −6.440 −2.315
Charge of impaired receivables −3.688 −6.089
Write back of impaired receivables 6.542 1.964
Total at 31 December −3.586 −6.440
Currency risk The Group is not substantially exposed to currency risk since transactions in currencies other than the euro are limited. Liquidity risk The liquidity risk implies the risk that the Group will encounter difficulties in meeting its obligations associated with financial liabilities. The Group limits this risk by continually scrutinizing cash flows and by taking care that a sufficient number of credit facilities are available. The Group calls upon several banks to attract resources on short term. Commercial paper was issued within the framework of a treasury bill programme. Fixed advances and commercial papers can be called on with a maturity of one week up to twelve months, as well as fixed loans (straight loans) with a maturity between one day up to one year. All loans have fixed interest rates during the term of the loan except for the bank overdraft that has a variable interest rate. The Group enters into long-term loans to finance the DSOs. These long-term loans were fully lent on at the same conditions as the contracted loans. The DSOs use these resources to finance the investments in the distribution grids, to refinance loans and to pay interest. Eandis System Operator, however, also used a part of the net proceeds of these loans at the end of 2014 to pay the fee in the name and on behalf of the public administrations to Electrabel as part of the latter’s exit out of the DSOs. In 2010 the first bond loans were issued for private investors in Belgium and the Grand Duchy of Luxembourg. To diversify and broaden its funding resources, so that a safe, reliable, efficient and innovative distribution of energy to the customers can be assured, Eandis System Operator has requested a rating from ‘Moody's Investors Service Ltd.’ (Moody’s). In October 2011, Moody's granted Eandis System Operator an ‘A1’ credit rating ‘with a negative outlook’. This rating was reconfirmed by Moody's on 5 July 2016. On 14 December 2016, however, Moody's reviewed the rating to A3 (stable outlook) as the merger of the seven DSOs in Eandis Assets was not accomplished and so attracting a private partner for this merged company had to be stopped. On 18 January 2017, Eandis obtained a second rating. The German credit rating agency Creditreform Rating AG granted Eandis System Operator an A+ rating with stable outlook. On 19 January 2018 this rating was reconfirmed. Eandis System Operator successfully issued bonds in the framework of its € 5 billion Euro Medium Term Note (EMTN) programme launched in 2011 and runs through 2021. There has always been
Eandis System Operator Group – IFRS – 2017 40 / 47
a large interest from European investors for the bond issuances and also interest from private investors to whom several bond loans were issued. In the framework of the € 5 billion EMTN programme an amount of € 2.660,5 million or 53,21 % was issued at the end of 2017. Since year end 2014 no more bonds were issued under this programme. All funds of the bond loans were fully lent on to the DSOs at the same conditions as the bond loans. The resulting receivables for the Group are included in notes ‘Short-term receivables, other’ and ‘Long-term receivables, other’. An overview of the loans is included in note ‘Interest-bearing loans and borrowings’. The following schedule shows the maturity schedule of the different loans. At the end of 2017
(In thousands of EUR) 2017
1 year or
less 2-3 year 4-5 year
More than
5 year
Bond issue - retail 369.714 0 169.960 0 199.754
Bond issue - EMTN 2.644.335 0 0 996.093 1.648.242
Bond issue - private 435.280 0 0 0 435.280
Total 3.449.329 0 169.960 996.093 2.283.276
At the end of 2016
(In thousands of EUR) 2016
1 year or
less 2-3 year 4-5 year
More than
5 year
Bond issue - retail 319.958 150.012 0 169.946 0
Bond issue - EMTN 2.642.164 0 0 498.821 2.143.343
Bond issue - private 435.042 0 0 0 435.042
Total 3.397.164 150.012 0 668.767 2.578.385
Interest rate risk The Group has entered into long-term loans with a fixed interest rate. The resulting financial costs for Eandis System Operator are all passed on to DSOs and are reported as a financial income.
Eandis System Operator Group – IFRS – 2017 41 / 47
The interest payment for the following years, calculated on the basis of the current interest rate is as follows:
(In thousands of EUR) 2017 2016
In 2017 0 108.424
In 2018 106.424 102.424
In 2019 106.424 102.424
In 2020 106.424 102.424
In 2021 99.199 95.199
In 2022 76.699 72.698
In 2023 and beyond 477.869 465.870
Total 973.039 1.049.463
Other More information about the risks of the Group and the shareholders is included in the prospectus of 2 June 2017 concerning the issuance of a bond loan (retail) and the investor presentation of 1 September 2017. These documents can be consulted on our website www.eandis.be.
Fair value The fair value is the amount for which an asset could be exchanged or a liability settled between knowledgeable, willing parties that are independent in a transaction at arm’s length and not in a forced sale or liquidation sale. Fair value hierarchy The Group uses the following fair value hierarchy classification to determine and classify the fair value of the financial instruments by a valuation technique: Level 1: valuation is based on quoted (unadjusted) prices in an active market for identical assets or liabilities Level 2: other techniques for which all input with a significant impact on the recorded fair value can be observed either directly or indirectly Level 3: techniques that use input with a significant impact on the recorded fair value that is not based on observable market data The following methods and assumptions were used to estimate the fair values: Cash and short-term deposits, trade receivables, trade payables and other current liabilities approximate the carrying amounts as to the short-term maturity of these instruments. The fair value of the unquoted other investments is based on the latest available financial information. The fair value of the quoted bond loans is based on the indicative quotations on Bloomberg (Bloomberg is a prominent provider of business and financial market news. It delivers world economic news, quotes for stock futures, stocks and other) at the reporting date.
Eandis System Operator Group – IFRS – 2017 42 / 47
The fair value of the quoted bonds, issued for a total amount of € 3.030,5 million varies according to the market interest rate. The fair value at 31 December 2017 amounts to € 3.407,6 million and differs from the amount that will be reimbursed and the carrying value.
2017 2016
(In thousands of EUR) Fair value Book value Fair value Book value
Other investments 984 832 987 832
Cash and cash equivalents 31.390 31.390 2.662 2.662
Eandis System Operator Group – IFRS – 2017 43 / 47
Other information
22 Related parties Transactions between Eandis System Operator and its subsidiaries have been eliminated in the consolidation process and are therefore not included in the present note.The total remunerations paid to the management committee and the directors for 2017 amounted to € 3.698.619 and € 3.318.972 for 2016. The post-employment benefits included in the total remuneration mentioned amounted to € 697.823 for 2017 and € 624.971,31 for 2016. There are no other benefits in kind, share options, credits or advances in favour of the directors. Transactions of the Group with companies with a non-controlling interest (Farys/TMVW) were as follows:
(In thousands of EUR) 2017 2016
Amount of the transactions
Recharge of costs to non-controlling interest companies 4.471 4.804
Recharge of costs from non-controlling interest companies 454 116
Amount of outstanding balances
Trade receivables 569 605
Trade payables 10 3
Transactions of the Group with other companies (Atrias and Synductis) were as follows:
(In thousands of EUR) 2017 2016
Amount of the transactions
Recharge of costs to associates 2 026 2 330
Recharge of costs from associates 11 475 7 654
Amount of outstanding balances
Trade receivables 18 830 16 478
Trade payables 1 847 2 745
Eandis System Operator Group – IFRS – 2017 44 / 47
Transactions of the Group with its shareholders (Distribution System Operators) were as follows:
(In thousands of EUR) 2017 2016
Amount of the transactions
Recharge of costs to the Distribution System Operators 1 000 535 970 053
Recharge of costs from the Distribution System Operators 20 340 20 671
Interest income Distribution System Operators 107 454 108 623
Interest expenses Distribution System Operators 68 89
Trade receivables, invoices to be issued 117 309 176 564
Other receivables, cash pool −77 013 307 587
Other receivables, accrued financial income bond loan 37 690 31 518
Trade payables 19 703 20 370
Receivable VAT-unit 70 591 52 902
Guarantees and securities received
Concerning financial obligations 822 000 822 000
All invoices to and from the Distribution System Operators are payable within 30 days after invoice date. Membership of professional organisations Eandis System Operator is a member of Synergrid vzw, which is the Belgian common interest federation of the electricity and gas transport and distribution grid operators. Eandis System Operator is a member of the European Distribution System Operators for Smart Grids (EDSO for Smart Grids). During 2017 the parent company paid fees of 47 k EUR to the statutory auditor and an amount of 409 k EUR for other assignments. The fee for other assignments was approved by the Audit Committee.
Eandis System Operator Group – IFRS – 2017 45 / 47
23 Commitments and contingencies
(In thousand of EUR) 2017 2016
Rent deposits, buildings 1.463 1.463
Other bank guarantees 125 125
Total guarantees given 1.588 1.588
Guarantees obtained from contractors and suppliers 25.485 26.553
Committed orders in 2017 amounted to 16.311 k EUR (2016: 21.132 k EUR). The Group rented several buildings and adjoining parking lots for a total value of 6.063 k EUR in 2017 and 6.259 k EUR in 2016, as well as vehicles for a value of 4.681 k EUR in 2017 and 4.796 k EUR in 2016. The future minimum lease payments (included as operational lease liability) relate to buildings, vehicles and other material. The contracts relating to buildings contain renewal clauses and have an average duration of two years. The future minimum lease payments under non-cancellable finance leases are as follows:
(in thousands EUR) 2017
In 2018 9.795
In 2019 and 2020 11.610
In 2021 and 2022 3.170
In 2023 and later 180
Total 24.755
The Group is involved in legal disputes for which the risk of loss is possible but not likely. Currently, the possible timing of the settlements cannot be estimated reliably.
24 Events after the reporting date Integration Eandis System Operator and Infrax in Fluvius System Operator At the end of 2017 there were still some reservations regarding the proposed merger of Eandis System Operator cvba and Infrax cvba into the integrated entity Fluvius System Operator cvba. The reason for this was a possible decision by the Belgian Competition Authority (BMA). At the beginning of 2018, however, it became clear that this reservation was no longer valid. This is an important step towards the actual realization of one integrated operating company for the whole of Flanders, from 1 July 2018.
Eandis System Operator Group – IFRS – 2017 46 / 47
As a result of the application of the concept ‘control’ in the IFRS standards, the IFRS consolidated financial statements will only be prepared as an integrated operating company as at 31 December 2018. The half-yearly figures as at 30 June 2018 will therefore be prepared at the level of the operating company Eandis System Operator cvba (non-integrated).
25 List of group entities included in the consolidation
Subsidiary Registered office
Number of
shares
owned voting rights
Parent
Eandis System Operator
cvba Brusselsesteenweg 199, B-9090 Melle
Subsidiary
De Stroomlijn cvba Brusselsesteenweg 199, B-9090 Melle 64,03 64,03
Fluvius cvba Koning Albert II laan 37, B-1030 Brussel 50,00 50,00
The subsidiaries Warmte@Vlaanderen cvba and Fluvius cvba were established during 2016 but do not contain any activity. On 7 February 2018, the Board of Directors of Warmte@Vlaanderen cvba decided to liquidate the company as soon as possible. As a consequence, this means that the company Warmte@Vlaanderen cvba is currently in discontinuation. Since the company does not contain any activities, IFRS 5 Non-current assets held for sale and discontinued operations is not applicable. On 17 March 2018, the Board of Directors of Fluvius cvba decided to liquidate the company as soon as possible. This means that this company is currently in discontinuation.
Eandis System Operator Group – IFRS – 2017 47 / 47
Information concerning the parent company The following information is extracted from the statutory Belgian GAAP financial statements of the parent company, Eandis System Operator cvba. These statutory financial statements, together with the report of the Board of Directors to the General Assembly of Shareholders as well as the auditors’ report, will be filed with the National Bank of Belgium within the legally foreseen time limits. These documents are also available as from 30 March 2018 on the website www.eandis.be or on request at the following address: Brusselsesteenweg 199, 9090 Melle. The statutory auditor’s report is unqualified and certifies that the financial statements of Eandis System Operator cvba are prepared in accordance with Belgian GAAP.
Condensed balance sheet
In thousands of EUR, at 31 December 2017 2016
Fixed assets 1.705 2.160
Tangible fixed assets 317 743
Financial fixed assets 1.388 1.417
Current assets 4.058.300 4.348.846
Amounts receivable after more than one year 3.470.500 3.270.500
Stocks and contracts in progress 33.646 35.295
Amounts receivable within one year 267.920 738.055
Cash at bank and in hand 32.132 9.405
Deferred charges and accrued income 254.102 340.702
Total assets 4.060.005 4.351.006
Equity 1.007 1.007
Capital 915 915
Other equity components: reserves, share premium, retained earnings 92 92
Provisions for liabilities and charges 210.947 259.363
Amounts payable 3.848.051 4.090.636
Amounts payable after more than one year 3.449.329 3.247.152
Amounts payable within one year 343.585 798.373
Accrued charges and deferred income 55.137 340.702