REGULATING CONSUMER FINANCIAL PRODUCTS:EVIDENCE FROM CREDIT CARDS
Sumit AgarwalSouphala Chomsisengphet
Neale MahoneyJohannes Stroebel
Working Paper 19484http://www.nber.org/papers/w19484
NATIONAL BUREAU OF ECONOMIC RESEARCH1050 Massachusetts Avenue
Cambridge, MA 02138September 2013
We thank our discussants Effie Benmelech, Olivier de Jonghe, Brigitte Madrian, Victor Stango, andJialan Wang for thoughtful comments. We are grateful to John Campbell, Chris Carroll, Raj Chetty,Liran Einav, Alexander Frankel, Matthew Gentzkow, Andra Ghent, Benjamin Keys, Theresa Kuchler,Andres Liberman, Monika Piazzesi, Jesse Shapiro, Richard Thaler, Alessandra Voena, and Glen Weyl.Seminar participants at the University of Chicago, New York University, Harvard University, HarvardBusiness School, Arizona State University, the University of Michigan, Texas A&M University, theNBER meetings in Industrial Organization and Law & Economics, the Boston Fed Conference onPayment Systems, the Empirical Macro Workshop in New Orleans, the Consumer Financial ProtectionBureau, the Sloan Conference on Benefit-Cost Analysis of Financial Regulation, the Bonn/Bundesbankconference for Regulating Financial Intermediaries, the Office of the Comptroller of the Currency,the FDIC, Kansas University, University of Virginia, Johns Hopkins University, and the College ofWilliamand Mary provided helpful comments. We thank Regina Villasmil for truly outstanding and dedicatedresearch assistance. Mahoney and Stroebel thank the Fama-Miller Center at Chicago Booth for financialsupport. The views expressed are those of the authors alone and do not necessarily reflect those ofthe Office of the Comptroller of the Currency or the National Bureau of Economic Research.
NBER working papers are circulated for discussion and comment purposes. They have not been peer-reviewed or been subject to the review by the NBER Board of Directors that accompanies officialNBER publications.
Regulating Consumer Financial Products: Evidence from Credit CardsSumit Agarwal, Souphala Chomsisengphet, Neale Mahoney, and Johannes StroebelNBER Working Paper No. 19484September 2013JEL No. D0,D14,G0,G02,G21,G28,L0,L13,L15
ABSTRACT
We analyze the effectiveness of consumer financial regulation by considering the 2009 Credit CardAccountability Responsibility and Disclosure (CARD) Act in the United States. Using a difference-in-differences research design and a unique panel data set covering over 160 million credit card accounts,we find that regulatory limits on credit card fees reduced overall borrowing costs to consumers byan annualized 1.7% of average daily balances, with a decline of more than 5.5% for consumers withFICO scores below 660. Consistent with a model of low fee salience and limited market competition,we find no evidence of an offsetting increase in interest charges or a reduction in volume of credit,although we are unable to analyze longer-run effects on investments or industry structure. Taken together,we estimate that the CARD Act fee reductions have saved U.S. consumers $12.6 billion per year. Wealso analyze the CARD Act requirement to disclose the interest savings from paying off balances in 36months rather than only making minimum payments. We find that this “nudge” increased the numberof account holders making the 36-month payment value by 0.5 percentage points on a base of 5.7%.
Sumit AgarwalProfessor of Finance and Real EstateNUS Business SchoolMochtar Raidy Building, BIZ115 Kent Ridge RoadSingapore, [email protected]
Souphala ChomsisengphetOffice of the Comptroller of the CurrencyDepartment of TreasuryWashington, [email protected]
Neale MahoneyBooth School of BusinessUniversity of Chicago5807 South Woodlawn AvenueChicago, IL 60637and [email protected]
Johannes StroebelNew York UniversityLeonard N. Stern School of Business44 West 4th Street, KCM 9-98New York, NY [email protected]
1 Introduction
The recent financial crisis triggered a surge of interest in regulating consumer financial products
(e.g., Campbell et al., 2011; Posner and Weyl, 2013). In the United States, the Dodd-Frank “Wall
Street Reform and Consumer Protection Act” of 2010 established a Consumer Financial Protection
Bureau to monitor and regulate mortgages, student loans, credit cards, and other similar products. In
July 2013, the European Commission followed suit and proposed new consumer financial protection
legislation to simplify disclosures and tighten guidance requirements related to financial products.
Proponents of this type of regulation argue that consumer financial markets have become in-
creasingly unfair. Firms take advantage of consumers’ behavioral biases—such as myopia, present
bias, and inattention—to earn large profits, especially from unsophisticated and poor consumers.1
These proponents suggest that regulation and additional information can protect less sophisticated
consumers and reduce aggregate borrowing costs.
Critics have expressed skepticism about the effectiveness of consumer financial regulations. While
limits on hidden fees, for example, can shift surplus from more sophisticated to less sophisticated
consumers (Gabaix and Laibson, 2006), there is less evidence that regulators can bring about an
across-the-board reduction in consumer costs. Regulators, these critics attest, are naively playing a
game of regulatory Whac-A-Mole – efforts to limit certain fees will simply lead firms to offset reduced
revenue with higher prices on other product dimensions and to restrict the supply of credit (Ameri-
can Bankers Association, 2013).2 Even proponents of regulating late fees, such as Mullainathan, Barr
and Shafir (2009), worry that “the reduced revenue stream to lenders from these fees would mean
that other rates and fees would be adjusted to compensate.”
This paper aims to advance this debate in the context of the Credit Card Accountability Respon-
sibility and Disclosure (CARD) Act of 2009, which was drafted to “implement needed reforms and
help protect consumers by prohibiting various unfair, misleading and deceptive practices in the [U.S.]
credit card market” (U.S. Senate, 2009b). We focus on analyzing the effectiveness of two key aspects
of the CARD Act: (i) regulatory limits on the ability of banks to charge certain types of credit card
fees, which became effective in February and August of 2010, and (ii) attempts to affect consumers’
1Senator Chris Dodd, lead sponsor of the CARD Act in the U.S. Senate, has noted that “My colleague from New York,Senator Schumer, has called this ‘trip-wire pricing,’ saying the whole business model of the credit card industry is notdesigned to extend credit but to induce mistakes and trap consumers into debt. I think he is absolutely right, unfortunately.This is an industry that has been thriving on misleading its consumers and its customers” (U.S. Senate, 2009a).
2Whac-A-Mole is an arcade game in which hitting a mechanical mole with a mallet causes another mole to appear.
1
repayment behavior by requiring that monthly credit card statements provide clear information on
the costs of making only the minimum payment, which became effective in February 2010.
We conduct a quantitative analysis of the effects of the CARD Act’s provisions using a unique
panel dataset on the near universe of credit card accounts held by the eight largest U.S. banks. These
data, assembled by the Office of the Comptroller of the Currency (OCC), provide us with account-
level information on contract terms, utilization, and payments at the monthly level from January
2008 to December 2012. We observe fees at a disaggregated level, allowing us to isolate effects on
categories such as over limit and late fees. Our data cover 160 million consumer and small business
accounts and a significant share of total industry assets during our period of study.
We estimate the intended and possible unintended consequences of the CARD Act by using a
difference-in-differences research design that compares changes in outcomes over time for consumer
credit cards, which were subject to the new regulations, to changes in outcomes for small business
credit cards, which the law did not cover. The identifying assumption is that, in the absence of the
CARD Act, outcomes for consumer and small business accounts would have maintained parallel
trends. This approach filters out possibly confounding macroeconomics events, and allows us to
interpret differential changes in outcomes for consumer cards (treatment group) relative to small
business cards (control group) as evidence on the effects of the CARD Act.
To argue that our identifying assumption is valid, we show that outcomes for consumer and
small business credit cards move together in the pre-CARD Act period, with parallel trends in fees,
interest charges, and measures of credit volume such as average daily balances (ADB), credit limits,
and the number of new accounts. This is consistent with a high degree of institutional similarity
between consumer and small business cards. Both types of cards are guaranteed by the personal
financial assets of the account holder, and applicants for both types of cards are screened on their
personal FICO scores. The main difference between consumer and small business cards is that small
business account holders must claim to use their cards for “business” purposes only. Banks in most
circumstances do not monitor this behavior, and survey evidence indicates that a significant percent-
age of charges are used for personal expenditure (Federal Reserve Board of Governors, 2010).
Using this difference-in-differences strategy, we find that regulations to reduce fees were highly
effective. For borrowers with a FICO score below 660, total fees declined by 5.5 percentage points of
ADB, or $59.86 per account per year, led by a large decline in over limit fees (3.3 percentage points)
2
and a smaller decline in late fees (1.5 percentage points). Account holders with a FICO score above
660 had lower pre-CARD Act fee levels, and experienced a qualitatively similar but smaller decline
in fees of 0.5 percentage points of ADB, or $7.90 per account. Combined across the low and high
FICO score accounts, the CARD Act reduced overall fee costs by an annualized 1.7% of borrowing
volume, or $23.44 per account each year.3 This represents a drop in total fees of 22.4% relative to
the pre-CARD Act period. Extrapolating this number to the total outstanding credit card balances of
$744 billion in the first quarter of 2010 (FRBNY, 2013) yields annual cost savings for U.S. credit card
users of $12.6 billion per year.
The CARD Act also included provisions to affect the repayment behavior of credit card borrow-
ers. In particular, it required monthly credit card statements to prominently display the cost of repay-
ing the balance when only making minimum payments, and to compare this to the cost of repaying
the balance when making payments that would pay off the balance within 36 months. The aim was
to “nudge” consumers toward paying off a larger fraction of their balance and reduce their overall
interest payments (Thaler and Sunstein, 2008). While countries such as the United Kingdom have set
up “Nudge Units” to “encourage people to make better choices for themselves,” there has been skep-
ticism as to whether nudges in isolation can make a “real difference to society’s biggest problems”
(House of Lords, 2011).4 The CARD Act provides a rare opportunity to analyze the impact of framing
in financial decision making in a nationally representative and economically important context.5
We find that these disclosure requirements had a small but significant effect on borrowers’ repay-
ment behavior. The number of account holders paying at a rate that would repay the balance within
36 months increased by 0.5 percentage points on a base of 5.7%. Cyclical and seasonal variation in
repayment behavior makes it hard to determine whether this shift came from borrowers who had
previously been making higher or lower payments. We estimate as an upper bound that the nudge
reduced aggregate interest payments by no more than 0.01% of ADB, or approximately $71 million
per year.
3We use the term “borrow” to refer to average daily balances (ADB). As we discuss in Section 2, ADB do not includepurchase volume that is paid off before the end of the consumer’s grace period.
4The report finds that nudges, “used in isolation, will often not be effective in changing the behaviour [sic] of the pop-ulation. Instead, a whole range of measures—including some regulatory measures—will be needed to change behaviourin a way that will make a real difference to society’s biggest problems.” It concludes that “a lot more could, and should, bedone to improve the evaluation of interventions. This is not only good practice but would help to build a body of researchthat could inform effective policies targeting population-level behaviour change.”
5Similar disclosure rules have been studied in small, experimental settings (Stewart, 2009; Navarro-Martinez et al.,2011).
3
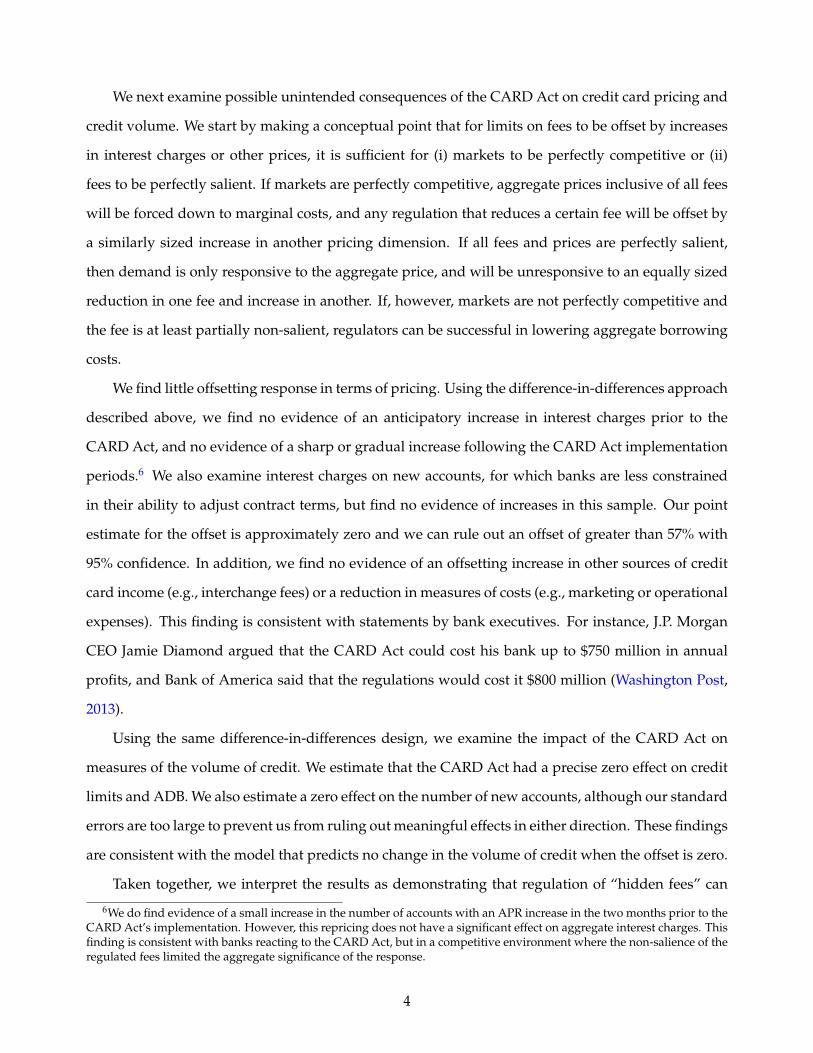
We next examine possible unintended consequences of the CARD Act on credit card pricing and
credit volume. We start by making a conceptual point that for limits on fees to be offset by increases
in interest charges or other prices, it is sufficient for (i) markets to be perfectly competitive or (ii)
fees to be perfectly salient. If markets are perfectly competitive, aggregate prices inclusive of all fees
will be forced down to marginal costs, and any regulation that reduces a certain fee will be offset by
a similarly sized increase in another pricing dimension. If all fees and prices are perfectly salient,
then demand is only responsive to the aggregate price, and will be unresponsive to an equally sized
reduction in one fee and increase in another. If, however, markets are not perfectly competitive and
the fee is at least partially non-salient, regulators can be successful in lowering aggregate borrowing
costs.
We find little offsetting response in terms of pricing. Using the difference-in-differences approach
described above, we find no evidence of an anticipatory increase in interest charges prior to the
CARD Act, and no evidence of a sharp or gradual increase following the CARD Act implementation
periods.6 We also examine interest charges on new accounts, for which banks are less constrained
in their ability to adjust contract terms, but find no evidence of increases in this sample. Our point
estimate for the offset is approximately zero and we can rule out an offset of greater than 57% with
95% confidence. In addition, we find no evidence of an offsetting increase in other sources of credit
card income (e.g., interchange fees) or a reduction in measures of costs (e.g., marketing or operational
expenses). This finding is consistent with statements by bank executives. For instance, J.P. Morgan
CEO Jamie Diamond argued that the CARD Act could cost his bank up to $750 million in annual
profits, and Bank of America said that the regulations would cost it $800 million (Washington Post,
2013).
Using the same difference-in-differences design, we examine the impact of the CARD Act on
measures of the volume of credit. We estimate that the CARD Act had a precise zero effect on credit
limits and ADB. We also estimate a zero effect on the number of new accounts, although our standard
errors are too large to prevent us from ruling out meaningful effects in either direction. These findings
are consistent with the model that predicts no change in the volume of credit when the offset is zero.
Taken together, we interpret the results as demonstrating that regulation of “hidden fees” can
6We do find evidence of a small increase in the number of accounts with an APR increase in the two months prior to theCARD Act’s implementation. However, this repricing does not have a significant effect on aggregate interest charges. Thisfinding is consistent with banks reacting to the CARD Act, but in a competitive environment where the non-salience of theregulated fees limited the aggregate significance of the response.
4
bring about a substantial reduction in borrowing costs without necessarily leading to an offsetting
increase in interest charges or a reduction in access to credit. We think an alternative interpretation
in which banks resisted raising interest rates because of concerns over future regulation is unlikely,
since the industry’s main lobby group was advancing the argument that the CARD Act raised interest
charges and lowered access to credit (American Bankers Association, 2013). Although our results do
not speak to the persistence of these savings, even over a modest time horizon, the estimated annual
savings of $12.6 billion are quantitatively significant.
Our two years of post-CARD Act data do not allow us to investigate the longer-run effects of
the CARD Act on industry exit or entry, or effects on margins with multi-year contracts (e.g., promo-
tional agreements ) or lumpy long-run investments (e.g., IT infrastructure and credit-scoring models).
These elements are important to consider in a complete benefit-cost analysis of the regulation.
Our paper contributes to a literature analyzing credit card usage and pricing (Ausubel, 1991;
Calem and Mester, 1995; Gross and Souleles, 2002; Agarwal et al., 2006; Kuchler, 2013; Stango and
Zinman, 2013) and the debate about regulating consumer financial products (Campbell, 2006; Bar-Gill
and Warren, 2008; Mullainathan, Barr and Shafir, 2009; Campbell et al., 2011). Our paper also adds
to a body of research that analyzes the effectiveness of nudges and default options in influencing
consumer decision-making (Madrian and Shea, 2001; Thaler and Benartzi, 2004; Choi, Laibson and
Madrian, 2005; Carroll et al., 2009).
To our knowledge, Debbaut, Ghent and Kudlyak (2013) and Jambulapati and Stavins (2013) are
the only other papers empirically analyzing the CARD Act. Debbaut, Ghent and Kudlyak (2013)
focus on the restriction of lending to borrowers under the age of 21. They find that those borrowers
were in fact less likely to default, challenging the notion that young borrowers are bad borrowers in
need of protection. Jambulapati and Stavins (2013) consider whether banks closed consumer credit
card accounts or otherwise restricted access to credit in advance of the CARD Act. Consistent with
our findings, they do not find evidence that banks closed credit card accounts or increased interest
rates between the time the CARD Act was signed and its provisions became law.
The rest of the paper proceeds as follows: Section 2 provides background on the U.S. credit card
industry and describes the key provisions of the 2009 CARD Act. Section 3 describes the data, and es-
tablishes important facts about profitability in the pre-CARD Act period sample. Section 4 describes
our research design and approach to conducting inference. Section 5 examines the intended effects
5
of the CARD Act, first examining the effect on fees and then turning to the effect of the disclosure
nudge. Section 6 examines unintended consequences, starting with the model of offsets and then
presenting results on the response of interest charges and credit volume. Section 7 concludes.
2 Credit Cards and the 2009 CARD Act
2.1 A Primer on Credit Cards
Account holders use credit cards to make purchases and to borrow. When an account holder carries
a balance from the previous billing cycle, interest charges for the current cycle are given by
Interest Charges = ADB× APR365
×Days in Billing Cycle,
where the right-hand side is the product of the average daily balance (ADB), defined as the arithmetic
mean of end-of-day balances over the billing cycle; the daily interest rate, defined as the annual
percentage rate (APR) divided by 365; and the number of days in the billing cycle.7,8 Account holders
who do not carry a balance into the current period have the possibility of repaying current period
purchase volume without incurring interest charges. If an account holder pays off her purchase
volume completely, interest charges typically fall within a “grace period” and are not assessed by the
bank. If the account holder does not pay her balances in full, she is charged interest starting from the
date of purchase. Account holders that fall under the grace period have no ADB in our data.
Credit limits place an upper bound on consumer purchases and borrowing. Consumers who
exceed their credit limit are assessed an over limit fee or can have transactions declined. Credit cards
have a number of other fees that we discuss below. Credit card borrowing is not secured by collateral,
though lenders may garnish the wages or seize assets of account holders who default. Recovery
rates are low, in part because credit card debt is junior to all forms of secured borrowing. To manage
and price this default risk, most credit card issuers screen applicants using both FICO scores and
internally generated risk measures. Credit cards are marketed to consumers through a number of7The APR measure does not account for compounding. For instance, a consumer with an APR of 15% who carries an
ADB of $1,000 for 12 consecutive 30-day months would have her balance grow to $1, 158 = 1, 000× (0.15/365× 30 + 1)12
instead of $1, 150 = 1, 000× (0.15 + 1).8In the past, some credit card issuers used a method known as “double-cycle billing” to calculate interest payments.
This method calculated average daily balances over two cycles, rather than just considering the current cycle. Double-cycle billing sometimes added significant interest charges to customers whose average balance varied greatly from monthto month. The CARD Act banned this method.
6
channels, including direct mail and TV advertisements. Credit cards often provide consumers with
cash back or reward points, which scale with purchase volume.
For some of our analysis, we compare outcomes for consumer credit cards (referred to in the
industry as “general purpose” credit cards) and small business credit cards. These types of cards are
institutionally similar. Like consumer credit cards, small business credit cards are guaranteed by the
personal financial assets of the account holder and applicants for both types of cards are screened
on their FICO scores.9 Like consumer cards, small business cards have features such as rewards
and are marketed by direct mail and TV advertisements. Because of the similarities in underwriting
and promotion, consumer and small business credit cards are issued by the same business unit and
regulators conduct joint assessments of consumer and small business credit card lending. The main
difference between consumer and small business cards is that small business account holders must
claim to use their cards for “business” and “commercial” purposes only. Banks in most circumstances
do not monitor this behavior, and survey evidence indicates that a significant percentage of charges
are used for personal expenditure (Federal Reserve Board of Governors, 2010).
2.2 The 2009 CARD Act
The Credit Card Accountability Responsibility and Disclosure Act of 2009 or CARD Act was intro-
duced in the 111th United States Congress (H.R. 627).10 On April 30, 2009, it passed the House with
a majority of 357-70. The Senate passed an amended version of the bill on May 19, 2009, also with an
overwhelming majority (90-5). President Obama signed the bill into law on May 22, 2009.
The CARD Act primarily amended the Truth in Lending Act and instituted a number of new
consumer protection and disclosure requirements for consumer credit cards. The regulation excluded
small business credits cards.11 The provisions of the CARD Act were scheduled to take effect in three
phases between August 20, 2009, and August 22, 2010.
9Small business cards are also secured by firm assets. However, for many small business account holders, personalassets such home and vehicle equity tend to be much more important than business assets.
10Congress had previously drafted consumer financial regulation that included many of the same provisions as theCARD Act. The most recent attempt was known as the “Credit Cardholders’ Bill of Rights Act of 2008,” and was introducedin the 110th Congress as H.R. 5244. Whereas the bill had passed 312 to 112 in the House, it was never given a vote in theSenate.
11Legislation has recently been proposed to extend the CARD Act provisions to the small business category. The SmallBusiness Credit Card Act of 2013 (H.R. 2419), amends the CARD Act to include small business credit cards. It was intro-duced in the House Financial Services Committee on June 18, 2013, but as of March 2014, has not advanced.
7
Phase 1 – August 20, 2009: One provision required banks to provide consumers with 45-day ad-
vance notice of rate increases or any other significant changes to terms and conditions. It also re-
quired lenders to (i) inform consumers in the same notice of their right to cancel the credit card
account before the increase or change goes into effect and (ii) mail or deliver periodic statements for
credit cards at least 21 days before payment is due.
Phase 2 – February 22, 2010: The bulk of CARD Act provisions came into effect on February 22,
2010. A key requirement was that no fees could be imposed for making a transaction that would
put the account over its credit limit unless the cardholder explicitly “opts in” for the credit card
company to process rather than decline over-limit transactions. Furthermore, an over limit fee may
be imposed only once during the billing cycle in which the limit is exceeded. The CARD Act also
In particular, it required statements to display the following:
1. The number of months and the total cost to the consumer (including principal and interest) that
it would take to pay the outstanding balance, if the consumer pays only the required minimum
payments and no further advances are made;
2. The monthly payment amount that would eliminate the outstanding balance in 36 months, if no
further advances are made, and the total cost to the consumer, including interest and principal
payments, of paying that balance in full.
Figure 1 provides an example of the way credit card statements display this information.12
The CARD Act also regulated the issuance of credit cards to borrowers below age 21, and in-
cluded a restriction on interest rate increases for new transactions within the first year of opening the
account. Furthermore, it limited the application of increased rates to existing balances, except if the
prior rate was temporary (e.g., an introductory rate), lasting at least six months, or if the minimum
payment has not been received for 60 days. For cards with multiple interest rates (e.g., a balance-
transfer and a new-purchase rate), issuers were required to apply payments to the highest-rate bal-
ances first. Finally, the CARD Act regulated payment due dates and times.13
12This new information might be less salient for individuals who do most of their banking online. Rather than alertingconsumers to the minimum payment warnings when they log on, many banks limited the changes to monthly statements,which means cardholders have to view a PDF copy of their full statements to see the minimum payment warnings.
13Credit card issuers are no longer allowed to set arbitrary deadlines for payments, and must accept payments receivedbefore 5 p.m. on the payment due date. If payments are due on a day during which lenders do not receive payments by
8
Phase 3 – August 22, 2010: The third phase of the CARD Act further regulated the fees banks can
charge by requiring them to be “reasonable and proportional.” Under the new rules, a credit card
company generally cannot charge a late fee of more than $25 unless one of the last six payments
was late (in which case the fee may be $35). Second, the late fee cannot be larger than the minimum
payment. Similarly, over limit fees were capped at the actual over limit amount. An additional
provision prevented issuers from charging more than one penalty fee per violation in a single billing
period. The CARD Act also prohibited the charging of inactivity fees for not using the credit card for
a period of time. Finally, it required lenders to re-evaluate any new rate increases every six months.
3 Data and Pre-CARD Act Industry Overview
3.1 Data
Our main source of data is the Credit Card Metrics (CCM) dataset assembled by the U.S. Office of the
Comptroller of the Currency (OCC). The OCC supervises and regulates nationally chartered banks
and federal savings associations.14 In 2008, the OCC initiated a request to the nine largest banks that
issue credit cards to submit data on general purpose, private label, and small business credit cards.
The purpose of the data collection was to have more timely information for bank supervision.
The CCM dataset has two components. The main dataset contains account-level information
credit limits), charges (e.g., interest, assessed fees), and performance (e.g., chargeoffs, days overdue)
for the near-universe of credit card accounts at these banks. The second dataset is portfolio-level
information for each bank on items such as operational costs and fraud expenses for the credit card
portfolio managed by the bank. Both datasets are submitted monthly. Reporting started in January
2008 and continues through the present, although the reporting in the first few months of 2008 is
incomplete. Due to mergers and other reporting issues, we observe entry and exit of banks during
the time period.
To obtain a balanced panel of banks, while maintaining a sufficiently wide window around the
CARD Act implementation dates, we drop a small bank that enters and exits the sample and restrict
our time period from March 2008 to December 2011. We also restrict attention to general purpose and
mail (including weekends and holidays), a payment received on the next business day cannot be treated as late.14As of 2012, the OCC supervised and regulated 1,955 institutions. Total assets of the OCC-regulated banking institutions
represent about $10 trillion or 69% of all U.S. commercial banking assets.
9
small business credit card accounts.15 Table 1 presents an overview of our sample by reporting quar-
ter. The sample contains data from eight banks and approximately 150 million consumer accounts
and 7 million small business accounts.16
Panel A of Table 2 shows annualized summary statistics for key account-level variables for con-
sumer and small business accounts. For the combined sample, the average account carries an ADB
of $1, 347 and has an annualized purchase volume of $2, 138. Multiplying by the number of accounts
implies that these data account for about $210 billion in ADB, or 30% of total outstanding U.S. credit
card debt over this period.17 The average account holder pays about $168 in interest charges per year
and incurs $58 in fees, of which late fees, over limit fees, and annual fees are the largest components.
Banks charge off an average $175 per account per year, and recover $6 per account per year, or 3.7%
of chargeoffs.18 We use the term “net chargeoffs” to indicate total chargeoffs minus recoveries.
Panel B of Table 2 shows account-level averages for the variables that we construct using the
portfolio data and data from other sources. (See Appendix A for details on these calculations.) Inter-
change fees are charged to merchants for processing credit card transactions and scale with purchase
volume. We assess account-level interchange income as a constant 2.0% of purchase volume, or $38
per account annually. Reward and fraud expenses correspond to about 1.4% of purchase volume on
average, or approximately $28 per account per year. We calculate operational costs as a percentage of
ADB by month in the portfolio data and estimate account-level operational costs assuming they scale
proportionally with ADB. Operational costs are $47 per account per year.19 Banks report the total
interest expense for funding their credit card liabilities at the portfolio level by month. This expense
scales with ADB and varies over time. Over the sample period, funding the average account’s credit
card receivables for one year cost banks $22.
15Our sample does not include private label cards, which can only be used at the issuing retailer’s stores, but does includeaffinity and co-branded cards. We exclude cards from portfolios purchased from third parties, a very small number of jointcredit card accounts backed by more than one individual, and an equally small number of secured credit cards. We alsodrop accounts that do not report a FICO score at origination.
16We do not restrict the analysis to a balanced panel of accounts, because doing so would require us to drop accounts,for example, that were closed in mid-sample due to delinquency, and thereby create sample selection bias.
17ADB are somewhat higher for small business accounts than for consumer accounts, although much of this is driven bya higher average FICO score for small business accounts. Figure 12 shows that conditional on the FICO score being below660, which comprises our primary treatment sample, ADB are very similar across consumer and small business accounts.
18“Chargeoffs” refer to an expense incurred on the lender’s income statement when a debt is considered long enoughpast due to be deemed uncollectible. For an open-ended account such as a credit card, regulatory rules usually require alender to charge off balances after 180 days of delinquency.
19About 14% of total operational costs (an annualized 0.5% of ADB) are marketing and customer acquisition expenses.Extrapolating this to the industry level suggests a total industry advertising spending of about $3.75 billion. This level ofspending is consistent with numbers reported in Consumer Financial Protection Bureau (2013).
10
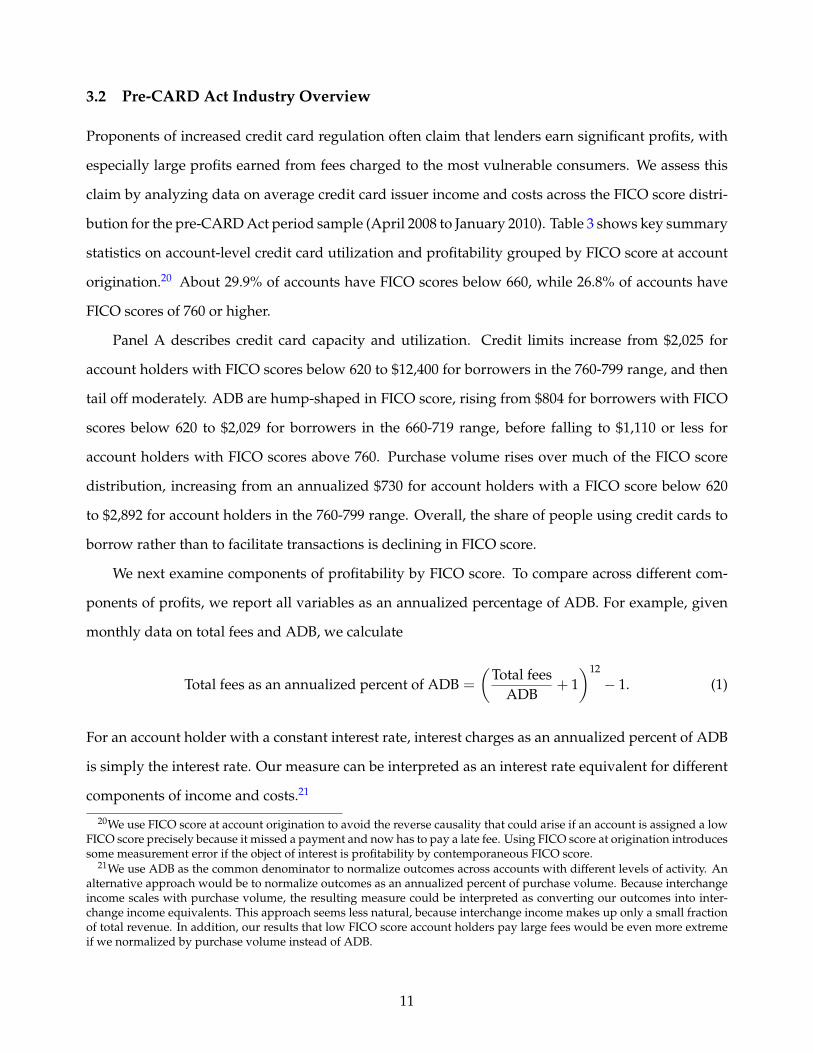
3.2 Pre-CARD Act Industry Overview
Proponents of increased credit card regulation often claim that lenders earn significant profits, with
especially large profits earned from fees charged to the most vulnerable consumers. We assess this
claim by analyzing data on average credit card issuer income and costs across the FICO score distri-
bution for the pre-CARD Act period sample (April 2008 to January 2010). Table 3 shows key summary
statistics on account-level credit card utilization and profitability grouped by FICO score at account
origination.20 About 29.9% of accounts have FICO scores below 660, while 26.8% of accounts have
FICO scores of 760 or higher.
Panel A describes credit card capacity and utilization. Credit limits increase from $2,025 for
account holders with FICO scores below 620 to $12,400 for borrowers in the 760-799 range, and then
tail off moderately. ADB are hump-shaped in FICO score, rising from $804 for borrowers with FICO
scores below 620 to $2,029 for borrowers in the 660-719 range, before falling to $1,110 or less for
account holders with FICO scores above 760. Purchase volume rises over much of the FICO score
distribution, increasing from an annualized $730 for account holders with a FICO score below 620
to $2,892 for account holders in the 760-799 range. Overall, the share of people using credit cards to
borrow rather than to facilitate transactions is declining in FICO score.
We next examine components of profitability by FICO score. To compare across different com-
ponents of profits, we report all variables as an annualized percentage of ADB. For example, given
monthly data on total fees and ADB, we calculate
Total fees as an annualized percent of ADB =
(Total fees
ADB+ 1
)12
− 1. (1)
For an account holder with a constant interest rate, interest charges as an annualized percent of ADB
is simply the interest rate. Our measure can be interpreted as an interest rate equivalent for different
components of income and costs.21
20We use FICO score at account origination to avoid the reverse causality that could arise if an account is assigned a lowFICO score precisely because it missed a payment and now has to pay a late fee. Using FICO score at origination introducessome measurement error if the object of interest is profitability by contemporaneous FICO score.
21We use ADB as the common denominator to normalize outcomes across accounts with different levels of activity. Analternative approach would be to normalize outcomes as an annualized percent of purchase volume. Because interchangeincome scales with purchase volume, the resulting measure could be interpreted as converting our outcomes into inter-change income equivalents. This approach seems less natural, because interchange income makes up only a small fractionof total revenue. In addition, our results that low FICO score account holders pay large fees would be even more extremeif we normalized by purchase volume instead of ADB.
11
We define profits for a credit card account as the difference between total income and total costs.
Total income for an account is the sum of interest payments, fee payments, and interchange fees.
The most basic measure of total costs includes realized net chargeoffs, the cost of funds, rewards and
fraud expenses, and operational costs. We call this measure realized costs.
Panel B of Table 3 examines the components of profits as a percentage of ADB. Borrowers with a
FICO below 620 pay an annualized 20.6% of ADB in interest charges and 23.3% of ADB in total fees.
Interest charges decline modestly in FICO score; total fee payments decline precipitously. Interchange
income is not quantitatively important, except for the highest FICO score borrowers, who generate
interchange income of more than 9.5% of ADB.22 The top two panels of Figure 2 show plots of interest
charges and fees by FICO score.
The main component of realized costs is net chargeoffs. During our time period, account holders
with FICO scores below 620 incurred annualized net chargeoffs of 30.8% of ADB, while account hold-
ers with FICO scores of 760 and above incurred net chargeoffs of 6.3%. Similar to interchange income,
rewards and fraud costs as a share of ADB are larger for higher FICO account holders, who generate
more purchase volume per unit of borrowing. The cost of funds as a share of ADB is relatively low,
at about 2.3%.23 The bottom two panels of Figure 2 show plots of net chargeoffs and interchange
income net of rewards expenses by FICO score.24
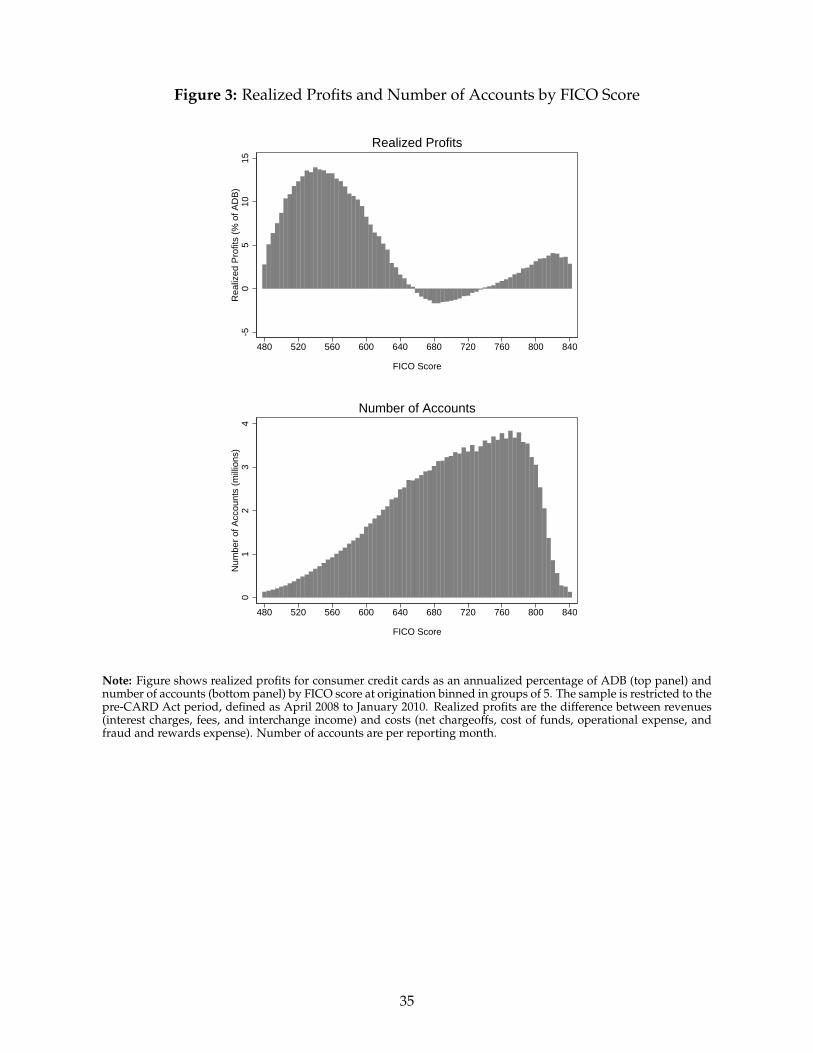
The income and costs data combine to produce a U-shaped distribution of realized profits by
FICO score. Account holders with FICO scores below 620 generated realized profits of 7.9% of ADB.
Realized profits bottom out at -1.6% of ADB for accounts with FICO scores in the 660-719 range. They
rise to above 1.5% for account with the highest FICO scores. Figure 3 plots realized profits and the
number of accounts by FICO score.
While realized profits do not account for ex ante risk, and we have insufficient time-series data
to estimate risk premia across the FICO distribution, the data suggest that credit cards were a very
profitable segment of the banking industry, even at the height of the financial crisis. Table 3 shows
that across all FICO scores, profits average 1.6% of ADB. Adjusting for taxes and bank leverage,
22This is not surprising given the ratio of purchase volume to average daily balances for different FICO score groups. Thehighest FICO score account holders primarily use credit cards to facilitate transactions, not to borrow. Hence, interchangeincome relative to overall receivables managed by the bank increases significantly as FICO rises.
23This might provide at least a partial explanation for the stickiness of credit card rates documented by Ausubel (1991).Given that the cost of funds is less than 10% of the cost of credit card lending, detecting a correlation between the cost offunds and interest rates might be difficult. We thank an anonymous referee for encouraging us to draw this link.
24We do not show the cost of funds and operational expenses because they are defined as a constant fraction of ADB.
12
this translates into a return on equity in excess of 10%, more than five times larger than the average
financial sector return on equity during this time period. (See Appendix A.1.4 for details.) Indeed, at
the same time that bank divisions making subprime home loans were losing large amounts of money,
credit card issuers were earning their largest profits from the subprime segment of the market.25
4 Research Design
Having established basic facts about the importance of fee revenue in the pre-CARD Act period, we
turn to evaluating the intended and unintended consequences of the consumer protections that were
implemented by the CARD Act. The empirical challenge is that the CARD Act was implemented
shortly after the financial crisis when there was much instability in the macroeconomy, which com-
plicates the interpretation of a simple event-study analysis.
4.1 Identification Strategy
We estimate the effects of the CARD Act using a difference-in-differences research design, where
we compare outcomes for consumer credit cards (treatment group) and small business credit cards
(control group) during the different phases of the CARD Act implementation. The role of the control
group is to establish a counterfactual of what would have happened to consumer credit cards if the
CARD Act had not been implemented. The identifying assumption is that, in the absence of the
CARD Act, outcomes for consumer credit cards and small business cards would have maintained
parallel trends.
We argue that the parallel-trends assumption is likely to be valid for two reasons. First, we
show that outcomes for consumer and small business credit cards move together in the pre-CARD
Act period, with parallel trends in fees, interest charges, and measures of credit volume such as
ADB, credit limits, and the number of new accounts. We also show that, conditional on FICO scores,
consumer and small business accounts look similar on observable characteristics such as credit limits
and interest charges. The second reason is that consumer and small business cards are institutionally
similar. As we discuss in Section 2, both types of cards are guaranteed by the personal financial
assets of the account holder, and applicants for both types of cards are screened on their personal
25The data show that earnings increased substantially as the economy recovered from the Great Recession. By the endof our sample in December 2011, annualized realized profits had increased from 1.6% of ABD to 5.2% of ADB, largely dueto a decline in annualized net chargeoffs from a peak of a 18.8% of ADB in May 2009 to 7.8% of ADB in December 2011.
13
FICO scores. Both types of cards are issued by the same business unit of most banks, and regulators
conduct joint assessments of consumer and small business credit card lending. The main difference
between these types of cards is that small business account holders must claim to use their cards
for “business” purposes only, although banks in most circumstances do not monitor this behavior
(Federal Reserve Board of Governors, 2010).
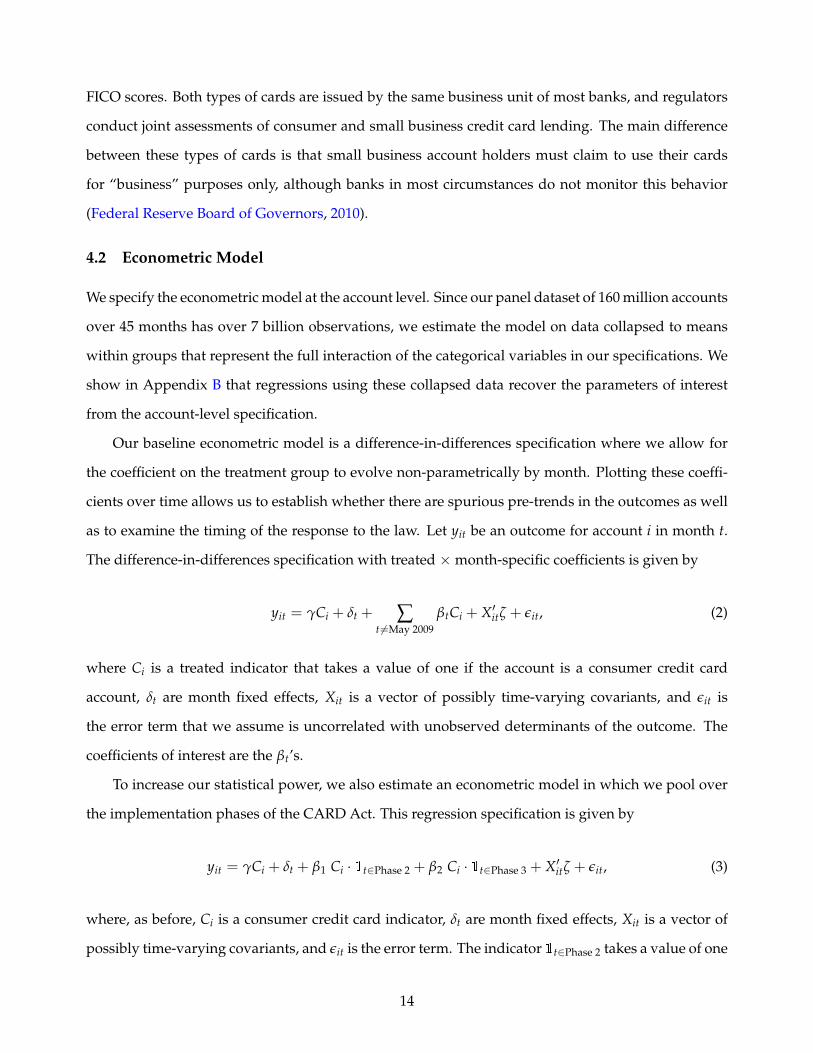
4.2 Econometric Model
We specify the econometric model at the account level. Since our panel dataset of 160 million accounts
over 45 months has over 7 billion observations, we estimate the model on data collapsed to means
within groups that represent the full interaction of the categorical variables in our specifications. We
show in Appendix B that regressions using these collapsed data recover the parameters of interest
from the account-level specification.
Our baseline econometric model is a difference-in-differences specification where we allow for
the coefficient on the treatment group to evolve non-parametrically by month. Plotting these coeffi-
cients over time allows us to establish whether there are spurious pre-trends in the outcomes as well
as to examine the timing of the response to the law. Let yit be an outcome for account i in month t.
The difference-in-differences specification with treated ×month-specific coefficients is given by
yit = γCi + δt + ∑t 6=May 2009
βtCi + X′itζ + εit, (2)
where Ci is a treated indicator that takes a value of one if the account is a consumer credit card
account, δt are month fixed effects, Xit is a vector of possibly time-varying covariants, and εit is
the error term that we assume is uncorrelated with unobserved determinants of the outcome. The
coefficients of interest are the βt’s.
To increase our statistical power, we also estimate an econometric model in which we pool over
the implementation phases of the CARD Act. This regression specification is given by
where, as before, Ci is a consumer credit card indicator, δt are month fixed effects, Xit is a vector of
possibly time-varying covariants, and εit is the error term. The indicator 1t∈Phase 2 takes a value of one
14
for the months between the implementation of Phase 2 and the implementation of Phase 3 (March
2010 to August 2010) and the indicator 1t∈Phase 3 takes a value of one for the months after the imple-
mentation of Phase 3 (after August 2010).26 The time period prior to Phase 2 is the omitted group, so
the coefficients can be interpreted as the differential effect relative to the pre-implementation mean.
For some outcome variables, we also include a consumer account × anticipation period interaction
term to capture anticipatory responses that take place between the month the bill was passed and the
month Phase 2 came into effect (May 2009 to February 2010). In these specifications, the time period
prior to the passage of the law is the omitted group and the coefficients should be interpreted relative
to this period.
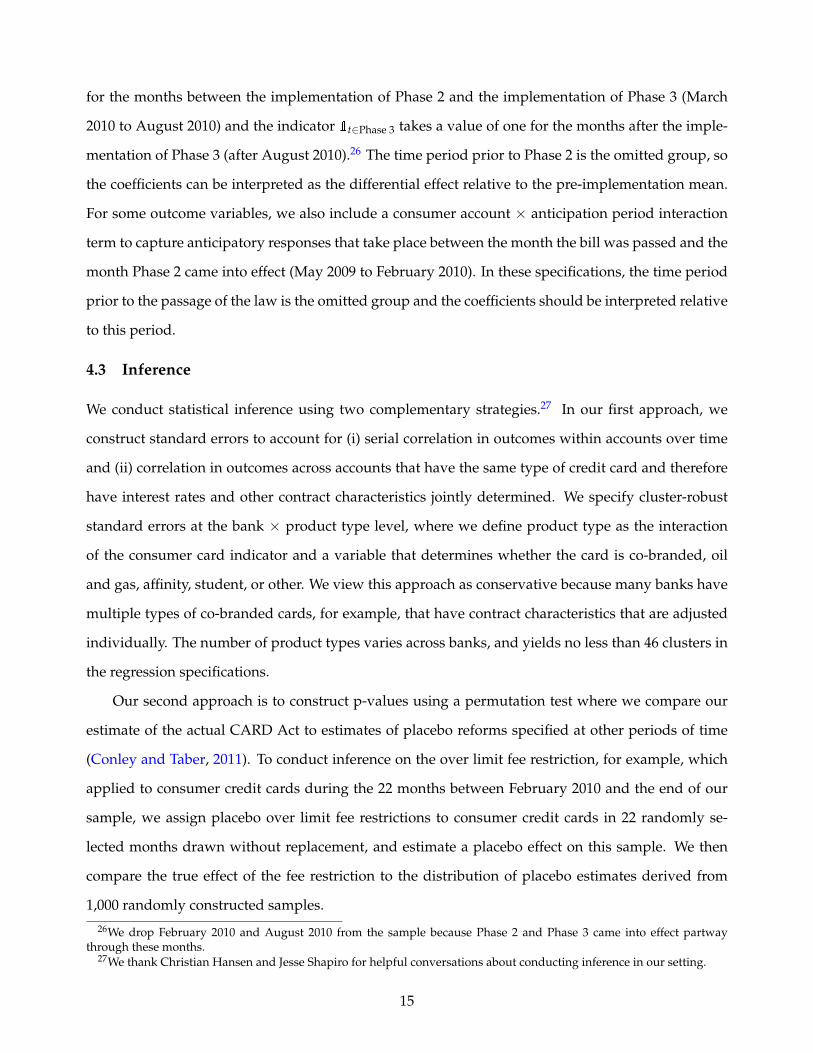
4.3 Inference
We conduct statistical inference using two complementary strategies.27 In our first approach, we
construct standard errors to account for (i) serial correlation in outcomes within accounts over time
and (ii) correlation in outcomes across accounts that have the same type of credit card and therefore
have interest rates and other contract characteristics jointly determined. We specify cluster-robust
standard errors at the bank × product type level, where we define product type as the interaction
of the consumer card indicator and a variable that determines whether the card is co-branded, oil
and gas, affinity, student, or other. We view this approach as conservative because many banks have
multiple types of co-branded cards, for example, that have contract characteristics that are adjusted
individually. The number of product types varies across banks, and yields no less than 46 clusters in
the regression specifications.
Our second approach is to construct p-values using a permutation test where we compare our
estimate of the actual CARD Act to estimates of placebo reforms specified at other periods of time
(Conley and Taber, 2011). To conduct inference on the over limit fee restriction, for example, which
applied to consumer credit cards during the 22 months between February 2010 and the end of our
sample, we assign placebo over limit fee restrictions to consumer credit cards in 22 randomly se-
lected months drawn without replacement, and estimate a placebo effect on this sample. We then
compare the true effect of the fee restriction to the distribution of placebo estimates derived from
1,000 randomly constructed samples.26We drop February 2010 and August 2010 from the sample because Phase 2 and Phase 3 came into effect partway
through these months.27We thank Christian Hansen and Jesse Shapiro for helpful conversations about conducting inference in our setting.
15
5 Intended Effects
In this section, we examine the intended effects of the CARD Act. We first examine the effects of the
fee regulations and then turn to examining the effect of the disclosure nudge.
5.1 Fees
The CARD Act had two primary elements that were targeted at reducing credit card fees. These regu-
lations, described in more detail in Section 2.2, aimed at significantly reducing over limit fees and late
fees. Because fee payments vary substantially by FICO score (see Section 3.2), we separately estimate
the effects of these regulations on accounts with FICO scores below and above 660 at origination,
approximately the 30th percentile of the FICO score distribution in our data.
Figures 4 and 5 examine the effect of the regulation of over limit fees. The vertical axes in these
plots show over limit fee revenue as an annualized percentage of ADB. The horizontal axes show
months, with the vertical bars in May 2009, February 2010 and August 2010 indicating the dates
when the CARD Act was signed, and when Phase 2 and Phase 3 of the provisions came into effect.
Panel A of Figure 4 plots average over limit fees as a percentage of ADB for consumer and small
business accounts with FICO scores below 660 at origination. Over limit fees for consumer and
small business accounts move together over the pre-CARD Act period, confirming the parallel-trends
identifying assumption. In February 2010, when the the law requires consumer accounts to “opt in”
to the processing of over limit transactions, over limit fees for consumer accounts drop from 3.8% of
ADB to virtually zero. Over limit fees for small business accounts, which were not affected by the
CARD Act, trend smoothly through this implementation date.
Panel B of Figure 4 plots the coefficients on the consumer account × month interactions from a
difference-in-differences regression specification (Equation 2) on the same sample of low FICO score
accounts. In this plot, we normalize the coefficient on the month when the bill was signed to the
pre-CARD Act consumer credit card mean. We show coefficients from a baseline specification where
we include consumer account and month fixed effects, and fully interacted fixed effects for bank,
product type, and FICO score group. The difference-in-differences specification confirms the sharp
drop we observed in the means.
Figures 5 shows the same plots for accounts with FICO scores of at least 660 at origination. The
effects are smaller in size but qualitatively identical. Mean over limit fees for consumer and small
16
business accounts move together in the pre-CARD Act period. Over limit fees for consumer accounts
drop to almost zero in February when the law was implemented. Over limit fees for high FICO score
accounts are only 0.4% of ADB in the pre-CARD Act period, compared to 3.8% for low FICO score
accounts, and the resulting 0.3 percentage point drop for these accounts is one tenth of the magnitude
of the drop for account holders with FICO scores below 660.
Table 4 show the corresponding difference-in-differences regression specifications. Column 1
shows the baseline difference-in-differences specification that has consumer card by Phase 2 (March
2010 to August 2010) and Phase 3 (after August 2010) interaction terms, and consumer card and
month fixed effects. The pre-February 2010 period is the omitted category so that the effects can be
interpreted relative to the outcomes prior to the implementation of the CARD Act. Column 2 adds
fully interacted fixed effects for bank, product type, and FICO score group to this specification. Panel
A shows outcomes for accounts with FICO scores below 660, and Panel B shows outcomes with
FICO scores above this level. The point estimate of the decline in over limit fees is 3.3 percentage
points for accounts with FICO scores below 660 and 0.3 percentage points for accounts with FICO
scores this level or above. The estimates are highly stable across specifications and are statistically
distinguishable from zero at conventional levels.
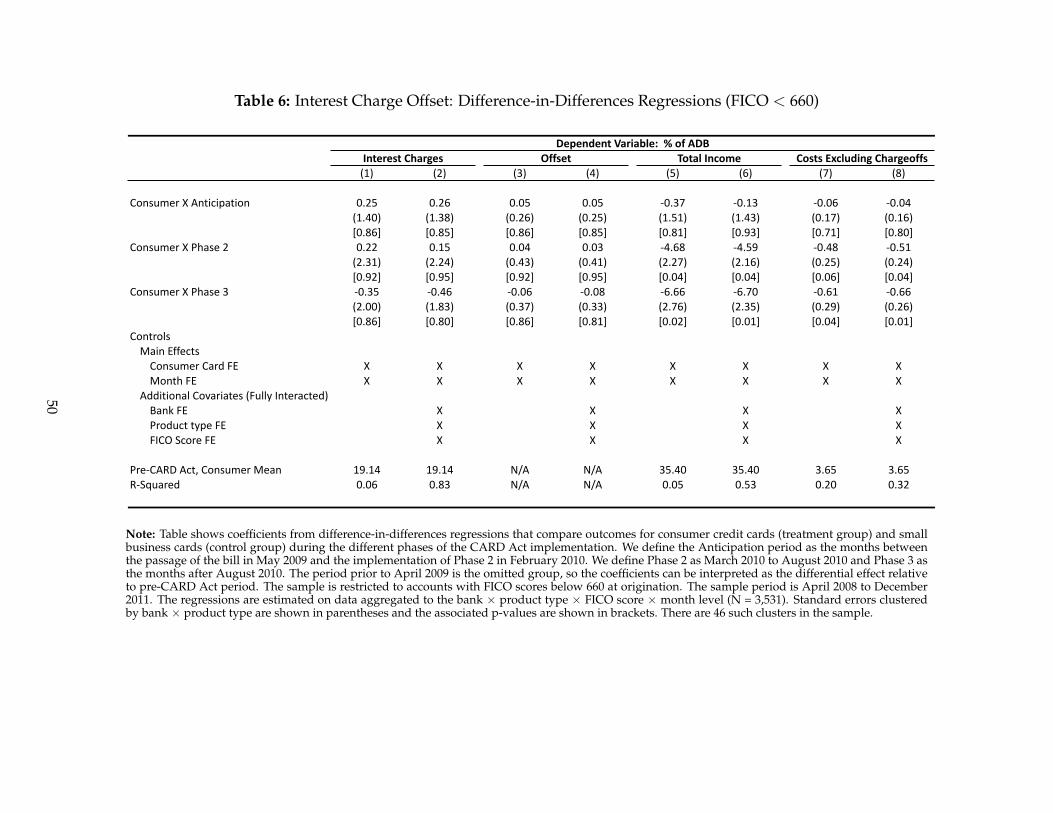
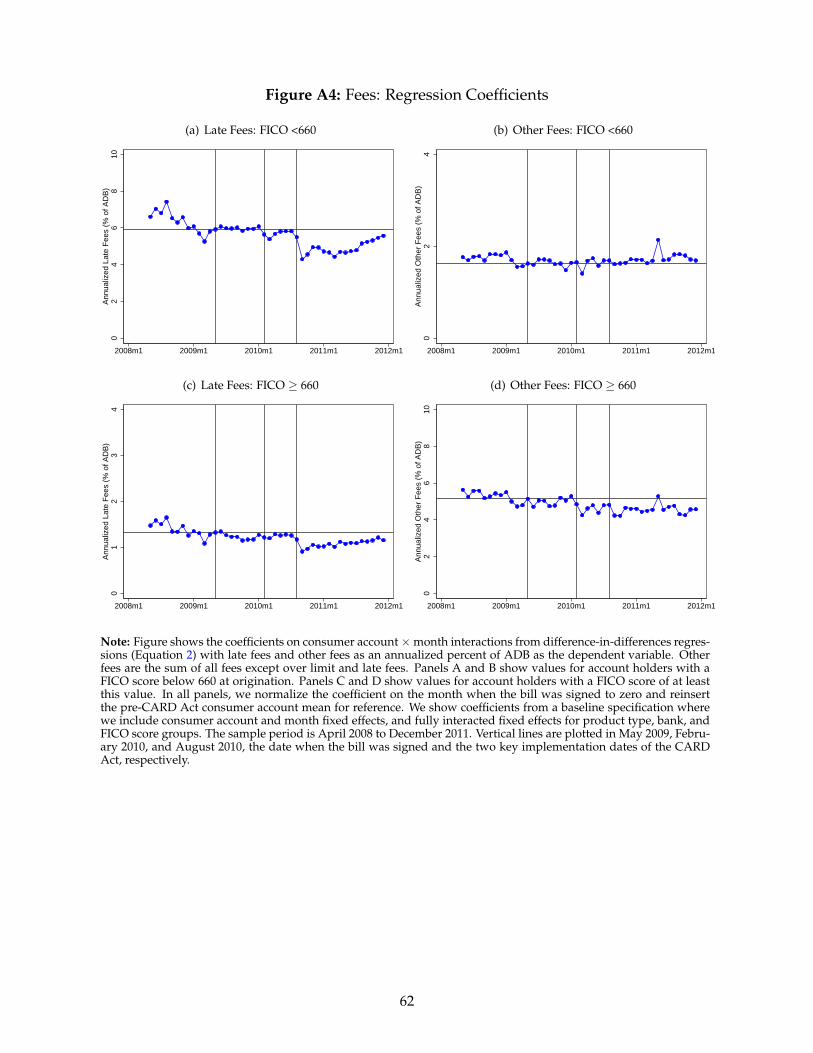
Appendix Figure A4 examines the effects of the CARD Act on late fees and an “other fees” cat-
egory that combines all categories except over limit and late fees. The plots show the coefficients on
the consumer account × month interactions from the baseline difference-in-differences specification
(Equation 2) with late fees and other fees as the dependent variable and are constructed in the same
manner as Figures 4 and 5. Panels A and B show effects on the sample with FICO scores below 660
at origination, and Panels C and D show effects on the sample with FICO scores of 660 or higher.
Panels A and C show suggestive evidence of a small decline in late fees in February 2010, when
restrictions on which payments could be considered late became more stringent, and a sharper drop
in August 2010, when the $25 maximum for late fees came into effect. The regression estimates for
late fees, shown in columns 3 and 4 of Table 4, confirm these results. For accounts with FICO scores
below 660, late fees decline by 1.5 percentage points over both implementation phases, from a pre-
CARD Act mean of 5.9%. The drop for high FICO score account holders is 0.3 percentage points off
a pre-CARD Act mean of 1.3%. The estimates of the late fee decline seem to diminish over time.
Appendix C investigates this further, by splitting up the overall decline into an incidence margin and
17
a price margin. Much of the reversal results from the CARD Act’s provision that allowed credit card
issuers to increase late fees from $25 to $35 if the account holder had been late on one of the last six
payments, which applies to an increasing number of accounts over time.
Panels B and D show that other fees do not respond to the CARD Act. Some industry observers
conjectured that credit card issuers would respond to the loss in over limit fee revenue by increasing
annual fees. The plots show no evidence of an offsetting increase of an economically significant
magnitude. The pooled regression estimates, shown in columns 5 and 6 of Table 4, confirm that, on
average, the regulation does not affect other fee categories. However, while we observe no offsetting
medium-term increase in fee revenue, firms might respond by introducing novel fees in the long run,
as theorized in Heidhues, Koszegi and Murooka (2012).
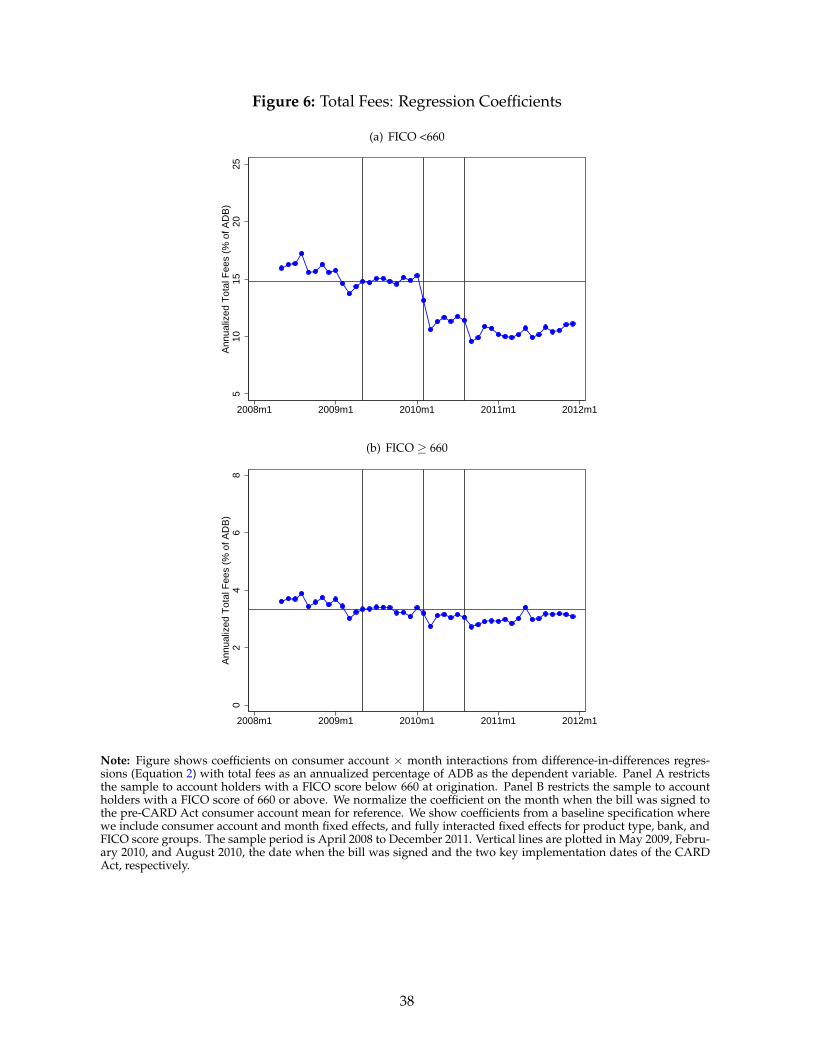
Figure 6 combines the analysis of these different fee categories by showing the effect of the CARD
Act on total fees. The plots show regression coefficients constructed in the same manner as before
using total fees as a percent of ADB as the dependent variable. Panel A shows estimates for the
sample of accounts with FICO scores below 660 at origination. Panel B shows estimates for the sample
with FICO scores of this level or above. The coefficient estimates, shown in columns 7 and 8 of Table
4, indicate that over the implementation phases, total fees dropped by 5.5 percentage points for low
FICO score accounts and by 0.5 percentage points for high FICO score accounts. Both estimates are
statistically distinguishable from zero with p-values of 0.04 and 0.01, respectively.28
The analysis above shows that the CARD Act brought about a sharp drop in late and overall
fees, with drops of 5.5 percentage points of ADB for accounts with a FICO score below 660 and 0.5
percentage points of ADB for accounts with a FICO score above this level. Low and high FICO score
cards account for 24.0% and 76.0% percent of borrowing in our data, so if we take a weighted average,
we calculate a reduction of 1.7% as an annualized percentage of ADB. Given an outstanding volume
of credit card receivables of $744 billion in the first quarter of 2010 (FRBNY, 2013), extrapolating to
the entire market suggests the CARD Act’s fee regulation reduced annual credit card borrowing costs
for U.S. consumers by $12.6 billion per year.
28As an alternative approach to conducting inference, Appendix Figure A5 shows the results from permutation testswhere we compare our estimate of the actual CARD Act to the distribution of placebo estimates derived from 1,000 sampleswhere “treatment” is randomly assigned. For the analysis of over limit fees (Panel A), we compare the actual Phase 2estimate (solid line) to a distribution of placebo Phase 2 estimates. For the analysis of late fees (Panel B) and total fees (PanelC), we compare actual and placebo Phase 3 estimates. None of the actual estimates overlap with the placebo distributions,allowing us to bound the p-values below 0.001 using this approach.
18
5.2 Payoff Nudge
In addition to regulating the fees banks charge, the CARD Act also introduced rules requiring certain
repayment disclosures in monthly credit card statements. The aim of the CARD Act’s disclosure re-
quirements was to provide information on the consequences of making only the minimum payment,
as well as information on the reduction in interest payments that could be achieved by making pay-
ments that would eliminate the balance within 36 months. Indeed, information such as the 36-month
payment amount might be understood by consumers as a payment recommendation or nudge, an-
choring repayment at this level (Navarro-Martinez et al., 2011).29 However, it is not obvious that this
nudge would actually lead to a shift in behavior, both because it is unclear if the nudge would be
sufficiently powerful and because current repayment levels might already be optimal.30
5.2.1 Pre-CARD Act Payoff Behavior
We begin by documenting credit card payoff behavior in the pre-CARD Act period. For this analysis,
we restrict the sample to consumer credit cards and exclude accounts that have a zero cycle-ending
balance. The top panel of Figure 7 shows the share of account holders making full payments by FICO
score at account origination. About 10% of borrowers with a FICO score below 620 fully repay their
balance. This share rises monotonically in FICO score, with about 25% of borrowers with a FICO
score of 720 and about 75% of borrowers with a FICO score above 800 making the full payment. On
average, 30.1% of account holders pay their cycle-ending balance in full, and do not carry balances
from month to month.31
The bottom panel of Figure 7 shows the share of account holders making minimum payments
or less by FICO score. About 60% of borrowers with a FICO score below 620 pay the minimum or
less. The number of account holders making the minimum payment or less declines monotonically,
29Using experimental evidence from the UK, Stewart (2009) shows that presenting a minimum payment requirement oncredit card statements anchors repayment behavior at that level, and reduces overall willingness to repay.
30This point was made by Warren (2011), who argued that “changes that make the credit card market more transparentcan echo throughout our economy. [...] Some consumers may respond by deciding to purchase less, to use a differentcard, or to pay with cash or another financial instrument. Others may pay down more of their credit card debt. Of course,some may go the other way: With confidence that they can assess the real cost of their credit cards going forward, someconsumers may choose to borrow on their card more frequently. In any case, clear information about prices and riskswould make it easier for consumers to sort through their options.”
31This number is similar to estimates from other sources. For example, using data from the 1995 and 1998 Survey ofConsumer Finances, Laibson, Repetto and Tobacman (2007) calculate that 32.2% of households pay their credit card bill infull each month. Note that our data are at the account level and the SCF is a household-level survey, so the numbers arenot directly comparable.
19
with about 25% of borrowers with a FICO score of 720 and 10% of borrowers with a FICO above 800
making payments of only the minimum or less. We calculate that on average 12.7% of borrowers
only make the minimum payment and 13.4% of account holders make no payment whatsoever.
5.2.2 Payoff Nudge
The CARD Act mandates the disclosure of the monthly payment that would eliminate an account
holder’s cycle-ending balance if the account holder makes 36 equal-sized payments and avoids new
purchases. Let T be the number of months it would take to pay off a cycle-ending balance for a
constant payment amount:32
T = 1−ln
(1− APR
12Cycle-Ending Balance−Payment
Payment
)ln(1 + APR
12 ). (4)
Full repayment is indicated by T = 1. At the average pre-CARD Act interest rate of 16.5%, T = 5
implies a payment of 20.5% of the cycle-ending balance; T = 10 implies a payment of 10.6% of the
balance; and T = 83 implies a payment of 2% of the balance, which is a typical minimum payment
amount in our data. The CARD Act requires a disclosure of the payment that would result in T = 36.
At the average interest rate, this implies a payment of 3.7% of the cycle-ending balance. Consumer
credit accounts have a median T of 15. Appendix Figure A6 shows a histogram of T in the year
preceding the implementation of the CARD Act disclosure requirement, both for consumer credit
cards and small business credit cards.33 We top-code T at 99 months and let T = 100 denote account
holders that make no payment.
Figure 8 shows the distribution of months-to-payoff T in the year before and after the CARD Act
for consumer and small business cards. Following the implementation of the CARD Act, there was
a small but significant increase in the share of consumer credit card holders paying the 36-month
payment amount. No such change can be detected for small business card holders, who were not
shown the payoff disclosure.34
32This equation obtains from rearranging the standard monthly payment formula for a series of payments starting in the
current month: Payment =(
APR/121−(1+APR/12)−(T−1)
)(Cycle-Ending Balance− Payment).
33There is seasonality in repayment behavior, so analyzing the 12 months prior to the CARD Act is more representativethan analyzing the entire pre-CARD Act period.
34We would expect increases in a small range around 36 months for a number of reasons. The most important is that weuse the current interest rate for our calculation of T, whereas banks are required to account for contractually determinedchanges in interest rates over the 36-month period. In particular, “if the interest rate in effect on the date on which the dis-
20
We use a difference-in-differences approach to quantify the impact of the nudge, comparing the
change in repayment behavior before and after the February 2010 implementation date for consumer
and small business credit cards. Table 5 shows the results of these regressions. Columns 1 and
2 show the effect on the share of account holders making payments close to the 36-month value
(30 ≤ T ≤ 38). The results show that the nudge increased this share by a precisely estimated 0.5
percentage points on a base of 5.7%.35
The CARD Act restricted the display of the 36-month payment amount to consumers whose
minimum payment is smaller than this value. This restriction primarily excludes accounts with low
balances for which the minimum payment if often set to a nominal lower bound. In column 3, we re-
strict the sample to account holders with more than $1,000 in cycle-ending balances. We find a larger
response in this subsample, with about 0.8% of these accounts shifting to the 36-month payment
amount.
Columns 4 to 6 show the effect on the share of account holders making payments less than the
target amount (T > 38). Determining whether the shift came from these low-payment account hold-
ers is difficult because doing so requires precisely estimating a 0.5 percentage point decline on a base
of 38.0% in a context with substantial cyclical and seasonal variation. The estimates are imprecise rel-
ative to the size of the shift, leaving us unable to conclusively determine whether the nudge increased
or decreased overall payments.
Although we are unable to estimate the exact effect, we can use our estimates to construct an
upper bound of the effect of the nudge on annualized interest payments. Assume that the nudge (i)
shifted account holders from making no payment to paying at the 36-month value and (ii) did not
affect the cycle-ending balance of these account holders. The one-month change in interest payments
for account holders that shift their behavior is given by the product of the change in the percentage
of balance paid, the cycle-ending balance, and the monthly interest rate:
closure is made is a temporary rate (such as an introductory rate) that will change under a contractual provision applyingan index or formula for subsequent interest rate adjustment, the creditor is required to apply the interest rate in effect onthe date on which the disclosure is made for as long as that interest rate will apply under that contractual provision, andthen apply an interest rate based on the index or formula in effect on the applicable billing date” (15 U.S. Code §1637).
35This estimate is relatively small compared to the experimental estimates in Stewart (2009) and Navarro-Martinez et al.(2011). However, one caveat to interpreting our results is that we are unsure which credit card users actually saw the CARDAct disclosures. For example, payment disclosures are only required on monthly credit card statements, which are rarelyviewed by individuals doing online banking. This means that while we pick up the full effect of the CARD Act regulation,we might understate the possible effect of a regulatory design that achieved wider awareness of the disclosures.
21
Account holders making no payment had a pre-CARD Act average cycle-ending balance of $2,957
and an average APR of 21.7%. Plugging this average APR into Equation 4 implies a change in the
percent of balance paid from 0% to 3.7%.36 Taking the product of these numbers and multiplying
by 12 to annualize yields an estimated $24.00 reduction in annualized interest payments for account
holders that shifted their repayment behavior in response to the nudge.
While a reduction in interest payments of this amount would be non-negligible for the account
holders that shift their behavior, the fact that few account holders respond to the nudge leads us to
estimate a small upper bound for the aggregate effect. The estimate of $24.00 annualized savings for
0.5% accounts that switch translates to aggregate savings of 0.0096% (= 0.5%×$24.00$1,251 ) of aggregate aver-
age ADB. If we extrapolate these results to the $744 billion national credit card market, we estimate
an upper bound for the nudge of $71 million (= $744 billion × 0.0096%) in annualized savings.37
6 Unintended Consequences
In this section, we assess possible unintended consequences of the CARD Act, focusing in particular
on whether lenders responded to the decline in fee revenue by increasing other costs such as interest
charges, or by restricting access to credit. We start by presenting a model of such offsetting prices. The
model shows that the extent to which fee limits are offset and credit supply is adjusted is determined
by (i) the degree of competition in the market and (ii) the salience of the regulated fee. We then
examine the response of interest charges and the volume of credit in the data.
6.1 Model
Consider a setting in which n symmetric firms compete to offer a credit card with a salient price
p1 (e.g., interest rate) and a potentially non-salient price p2 (e.g., over limit fee).38 Since firms are
identical, they charge the same prices in equilibrium. Aggregate demand is given by the function
36Assuming these account holders were making positive pre-CARD Act payments would directly reduce this value.37A normative evaluation of the nudge is beyond the scope of this paper. It is not ex ante clear whether account holders
who make larger payments are better off, for example, if they resort to using more expensive sources of credit.38See Stango and Zinman (Forthcoming) and Bar-Gill and Bubb (2012) for discussions of the salience of credit card fees.
Bordalo, Gennaioli and Shleifer (2012) provide a model of choice among goods with different attributes, which may includeprices. They analyze decisions by a consumer who overweighs the most salient attributes of each good in making a choice.The evidence in Appendix C, which shows that there was no increase in the incidence of late fees following the reductionin the allowable fee amount, provides further evidence for the non-salience of these fees.
22
q(p1 + ψp2), where ψ ∈ [0, 1] parameterizes the degree of salience of p2.39 A value of ψ = 1 indicates
perfect salience; a value of ψ = 0 indicates that consumers are completely oblivious to the price. Fol-
lowing Heidhues, Koszegi and Murooka (2012), we assume there is a maximum p2 that is determined
by regulation or some other factor.40
Firms have identical costs structures, which include both the cost of financing consumer lending
and the cost of default. Assume for now that lending to consumers has constant marginal costs c. In
Appendix Section D, we show that the results are similar when we allow for marginal costs to vary,
as they would in an environment with adverse or advantageous selection.
It is optimal for firms to set the potentially non-salient price p2 to the maximum allowable amount
p2.41 Following Weyl and Fabinger (2013), we characterize the first order condition for the salient
price p1 as
p1 + p2 − c = θ µ(p1 + ψp2), (6)
in which the markup of price over marginal cost is set equal to the product of a market competi-
tiveness parameter θ ∈ [0, 1], which indexes the degree of competition in the market (see Bresnahan,
1989) and an absolute markup function µ(p1 + ψp2) ≡ − qq′ , which is the markup that would be
charged by a monopolist.42
The specification is flexible and nests a number of standard cases. Perfect competition is given by
θ = 0 and simplifies the first order condition to the standard “price equals marginal cost” condition
p1 + p2 = c. Monopoly is given by θ = 1 and simplifies the equation to the Lerner Index for optimal
pricing p1+p2−cp1
= 1εp1
, where εp1 is the aggregate elasticity of demand. Cournot competition is given
by θ = 1/n, where n is the number of firms.43
39Our use of the term salience follows Chetty, Looney and Kroft (2009) to characterize the reduced “visibility” of theprice. We are agnostic over whether this limited salience arises from a behavioral micro-foundation (e.g., inattention,myopia) or a non-behavioral model of consumer behavior (e.g., higher search costs on this dimension).
40Alternatively, one could specify demand as a function of q(p1 + ψ(p2)), where ψ(·) is increasing and convex and hasthe property ψ′( p2) = 1. This would result in the firm setting p2 = p2 in equilibrium.
41To see this, suppose a firm sets a p2 < p2. The firm can increase profits by decreasing the salient price by ψdp2 and in-creasing the non-salient price by dp2. This pricing change has no effect on demand because q (p1 − ψdp2 + ψ(p2 + dp2)) =q(p1 + ψp2) but raises total profits by (1− ψ) dp2 q(p1 + ψp2) > 0. This means that p2 < p2 cannot be an equilibrium. Ifp2 is perfectly salient (ψ = 1), the equilibrium is described by a single price p∗ ≡ p1 + p2 and firms are indifferent betweenall combinations of p1 and p2 that sum to this p∗, including the combination with p2 = p2.
42The second order condition for p1 is θ µ′ < 1. We assume that at the optimal price this condition is satisfied.43See Weyl and Fabinger (2013) and Mahoney and Weyl (2013) for discussions of the micro-foundations of this specifica-
tion.
23
6.1.1 Pricing Offset
Consider a regulation that decreases the maximum allowable price p2. We want to know how much
of the decline in p2 is offset by an increase in p1. For small changes in p2, this offset is given by
ω ≡ − dp1dp2
. We will say there is full offset if ω = 1 and no offset if ω = 0.
Assume that θ and ψ are invariant to the price. Totally differentiating the first order conditions
(Equation 6) with respect to p2 and rearranging yields
ω =1− ψ θ µ′
1− θ µ′, (7)
where we have suppressed the arguments of µ for notational simplicity. To gain intuition for the
offset formula, consider two special cases.
Special Case 1. (Perfect Competition) If there is perfect competition (θ = 0), then a limit on p2 will be fully
offset by an increase in p1 (ω = 1).
Since competition drives price to marginal cost, any decrease in p2 must be fully offset by an increase
in p1 to maintain zero markup in equilibrium.
Special Case 2. (Perfect Salience) If p2 is perfectly salient (ψ = 1), then a limit on p2 will be fully offset by
an increase in p1 (ω = 1).
If p2 is perfectly salient, consumers view both prices as equivalent and firms can maintain their de-
sired level of demand by increasing p1 one-for-one with the decline in p2.44
Intuitively, the offset can be less than one-for-one when there is both imperfect competition (θ >
0) and imperfect salience (ψ < 1). Taking derivatives of Equation 7 with respect to θ and ψ yields the
following proposition:
Proposition 1. (Offset) The offset is converging toward full (ω → 1) as (i) the market becomes more compet-
itive (θ → 0) and (ii) p2 becomes more salient (ψ→ 1).
The offset is converging from below for many standard parameterizations of demand, but can
44In Appendix Section D, we show that the offset is relatively larger when there is adverse selection (i.e., marginal costsincreasing in price) and relatively smaller when there is advantageous selection (i.e., marginal costs decreasing in price).The reason the offset is larger with adverse selection is that a higher p1 brings in higher marginal cost consumers, requiringa further increase in the price. The offset is similarly larger when marginal cost is increasing in price due to an effect inwhich higher prices increase debt levels and lead to higher probabilities of default.
24
also converge from above for some parameterizations. Technically, the offset converges from below
when µ′ < 0 or equivalently if log demand is concave, since (log q)′′ = µ′/µ2 < 0 ⇐⇒ µ′ < 0.45
6.1.2 Volume Response
The model also provides guidance on how the equilibrium volume of credit will respond to a regu-
lation that decreases the maximum allowable price p2. For small changes in p2, this volume effect is
given by ν ≡ − dqdp2
. Totally differentiating q with respect to p2 and using the identities ω = − dp1dp2
and∂q
∂p1= ψ
∂q∂p2
to simplify yields:
ν =∂q
∂p1(ω− ψ).
The quantity response is largest (in absolute value) when p2 is non-salient (ψ = 0) and markets
are competitive (θ = 0) because firms fully offset the p2 decline (ω = 1, see Special Case 1) but
consumers only observe the increase in p1 and reduce their demand accordingly. There is no quantity
response when p2 is perfectly salient (ψ = 1) because even though firms fully offset the p2 decline
(ω = 1, see Special Case 2), consumers observe this one-for-one tradeoff between p2 and p1 and do
not change their demand. More broadly, the volume response is increasing in the size of the offset
(ω) and decreasing in the salience of the non-salient price (ψ).
6.2 Interest Charges
We next examine the extent to which lenders offset the observed reduction in fee revenue with in-
creased revenue from interest charges.46 Our baseline analysis restricts the sample to accounts with
a FICO score below 660, since the CARD Act fee restrictions mainly affected these account holders.
Panel A of Figure 9 shows mean interest charges as an annualized percent of ADB for consumer
and small business accounts with a FICO score below 660. Interest charges for both types of cards
45Fabinger and Weyl (2013) prove that µ′ < 0 if demand is linear or if it is based on an underlying willingness-to-paydistribution that is normal, logistic, Type I Extreme Value (logit), Laplace, Type III Extreme Value, or Weibull or Gammawith shape parameter α > 1. They show that µ′ > 0 if demand is based on a willingness-to-pay distribution that is Pareto(constant elasticity), Type II Extreme Value, or Weibull or Gamma with shape parameter α < 1. They show that µ switchesfrom µ′ < 0 to µ′ > 0 for a log-normal distribution of willingness-to-pay.
46Interest charges are the total interest payments made by the borrower. This is a better measure for the cost of credit thanAPRs, because most accounts have a number of different APRs applying to different types of transactions (e.g., balancetransfers, cash advances, etc.) that are in place simultaneously. Interest charges aggregates across these different APRs toprovide a measure of the weighted average cost of credit.
25
move together in the pre-CARD Act period and continue to move together over the rest of the months
in the data. We find no evidence of anticipatory increases for consumer accounts after the May 2009
passage date and no evidence of any increase during the implementation periods.
Panel B shows coefficients on consumer account × month interactions from a difference-in-
differences regressions specification (Equation 2) with interest charges as an annualized percentage
of ADB as the dependent variable. The plot is constructed analogously to the plots for fees (e.g.,
Panel B of Figure 4) with the coefficient normalized to the pre-CARD Act consumer mean during the
month when the bill was signed. The plot shows coefficients from the baseline specification where we
include consumer account and month fixed effects, and fully interacted fixed effects for bank, prod-
uct type, and FICO score group. The dashed horizontal line shows the increase in interest charges
that would be required to offset the 5.5 percentage point decline in fee revenue. The difference-in-
differences coefficients show that there is no evidence of an offsetting increase in interest charges.
Table 6 shows the corresponding difference-in-differences regression specifications. We show
coefficients on consumer cards interacted with indicators for the Anticipation (June 2009 to January
2010), Phase 2 (March 2010 to August 2010), and Phase 3 (after August 2010) time periods. The pre-
May 2009 period is the omitted category so that the effects can be interpreted relative to the outcomes
prior to the passage of the CARD Act. Column 1 shows the baseline specification with the interaction
terms and consumer card and month fixed effects. Column 2 adds fully interacted fixed effects for
bank, product type, and FICO score group. The regression estimates confirm the finding that the
CARD Act had at most a limited effect on interest charges, with point estimates of approximately
zero across the different phases. In Appendix Figure A7, we show evidence of a small spike in the
number of accounts with APR increases of more than 1 percentage point in the two months prior to
the CARD Act. This suggests that banks were reacting to the CARD Act, but that the competitive
environment and the non-salience of fees limited the aggregate significance of the response.
Columns 3 and 4 convert these estimates into an implied offset (ω), which we calculate as the
interest rate estimates from columns 1 and 2 divided by the Phase 3 estimate of the drop in fee
revenue from Table 4 with the same controls.47 The standard errors and corresponding p-values for
the offset are calculated using the Delta Method assuming no covariance in the error terms. The
Phase 3 estimates provide the longest adjustment period and represent our preferred estimates of the
47We use the Phase 3 fee estimate from column 7 of Table 4 to construct the offset estimates in column 3 and the Phase 3fee estimate from column 8 of Table 4 to construct the estimates in column 4.
26
medium-run effects of the law. The Phase 3 estimate of -0.08 from column 4 allows us to rule out
offset effects of greater than 0.57 with 95% confidence.
Credit card issuers in principle have wide latitude to increase interest rates on account holders.
The CARD Act somewhat reduced this flexibility with a set of provisions that came into effect in
August 2009, which (i) required lenders to notify consumers 45 days in advance of rate changes
and (ii) limited lenders’ ability to change interest rates on existing accounts, in particular in the first
year after origination. Lenders, of course, could announce rate changes 45 days in advance, so the
main practical effect of this provision was to make rate increases more salient and to slow down
implementation of rate increases. Nevertheless, we examine interest charges for new accounts to
provide additional evidence from a setting where banks face fewer constraints in their pricing.
Appendix Table A1 shows difference-in-differences estimates of the effect on interest charges as a
percentage of ADB for new accounts. Columns 1 and 2 repeat the estimates on the set of all accounts
with FICO scores below 660 from Table 6 for reference. Columns 3 and 4 show estimates for the
sample of low FICO score new accounts, defined as accounts in their first full month since origination.
Interest charges for new accounts are noisy because promotional rates and marketing campaigns by
a single bank can have a meaningful effect on monthly outcomes. However, the estimates clearly
indicate that interest charges for new accounts did not rise by the 5.5 percentage points needed to
offset the reduction in fee revenue. The preferred Phase 3 estimate with fully interacted controls,
shown in column 4, takes on a value of 0.05, and we can reject an increase of the full 5.5 percentage
point amount with a p-value of p < 0.01.
Appendix Figure A8 shows interest charges as an annualized percentage of ADB for account
holders with FICO scores of 660 or above. Panel A shows means for consumer and small business
accounts. Panel B shows coefficient estimates on consumer account × month interactions from a
difference-in-differences regressions specification with interest charges as a percentage of ADB as
the dependent variable. These specifications can be viewed as placebo tests of the interest charge
response. Since fee revenue barely declines for high FICO score account holders, a large change
in interest charges would suggest that there are other contemporaneous effects that are not being
captured by the difference-in-differences specification. The plots show no evidence of a differential
effect of the CARD Act on high FICO score consumer accounts. Columns 5 to 6 of Appendix Table
A1 show difference-in-differences regression specifications that confirm this finding.
27
6.3 Total Income and Costs
The reduction in fee revenue and lack of offsetting interest charge response suggest that the CARD
Act reduced banks’ total income. Recall from Section 3.2 that we define total income as the sum of
fee payments, interest payments, and interchange fees. While the evidence discussed above shows a
drop in fees and no change in interest charges, the reduction in fee revenue could lead to a “waterbed
effect” where credit card issuers offset the reduction in fees with higher interchange fee revenue from
merchants.
Columns 5 and 6 of Table 6 examine this directly by showing difference-in-differences speci-
fications for the sample of low FICO score accounts with total income as a percentage of ADB as
the dependent variable. The point estimates show a Phase 3 drop in total income of 6.7 percentage
points, similar to the 5.5 percentage point decline in fees. Appendix Figure A2 shows that inter-
change income as a share of purchase volume was a stable 2% over the entire time period. Thus the
combination of the decline in fee revenue and flat interest charges and interchange income translates
directly into a decline in total income from low FICO score account holders.
Another way banks could mitigate their exposure to the CARD Act is by reducing their spending
on awards, marketing, or other credit card costs. We examine this potential response by estimating
difference-in-differences specifications where the dependent variable is costs excluding chargeoffs,
defined using information on the cost of funds, rewards and fraud expenses, and operational costs.48
The estimates, shown in columns 7 and 8 of Table 6, show no evidence of an economically significant
decline in costs.49 However, this does not rule out that the decline in profitability will lead to a
medium-term decline in banks’ investment on IT infrastructure and credit-scoring models.
6.4 Credit Volume
In this final part of the paper, we examine the effects of the CARD Act on the equilibrium volume of
credit, as measured by credit limits, new accounts, and ADB. Figure 10 examines the impact of the
CARD Act on credit limits for accounts with FICO scores below 660 at origination. Panel A shows
mean credit limits for consumer and small business cards. Panel B shows coefficients on the con-
sumer account × month interactions from a difference-in-differences regression (Equation 2) with
48We exclude contemporaneous chargeoffs because they are not controlled in the short term by actions taken by creditcard issuers.
49As an additional piece of evidence, Appendix Figure A1 shows that the ratio of rewards and fraud expenses to inter-change income was constant over the sample and therefore that these costs were approximately constant.
28
credit limits as the dependent variable. Columns 1 and 2 of Table 7 show coefficients from the corre-
sponding difference-in-differences regressions. Panel B of the figure and the regression specifications
are constructed analogously to the plots and regression specifications of fees and interest charges
(e.g., Panel B of Figure 4 and Table 4).
The plots and regressions provide clear evidence that the CARD Act did not bring about a dif-
ferential reduction in credit limits for consumer accounts. The preferred Phase 3 point estimate from
column 2 of Table 7 indicates an increase in consumer account credit limits of $151 or approximately
5% of the $2,808 pre-CARD Act mean. We can rule out a drop in credit limits of greater than than
$520, or 18% of the pre-CARD Act mean, with 95% confidence.
Figure 11 examines the effect on new accounts, which we measure as a percentage of the average
pre-CARD Act number of accounts in the data.50 As before, we focus on the sample of accounts with
FICO scores below 660. Panel A shows that originations of consumer and small business accounts fol-
low a strong U-shaped pattern over the time period. Both types of accounts drop in parallel between
the start of our sample (April 2008) and depth of the financial crisis (early 2009) before recovering
over the final two years of our sample period.
Panel B shows coefficients on the consumer account × month interactions from a difference-in-
differences regression (Equation 2) with the percentage of new accounts as the dependent variable.
Columns 3 and 4 of Table 7 show the corresponding difference-in-differences regression coefficients.
As before, the sample is restricted to accounts with a FICO score below 660. The month-to-month
estimates exhibit considerable noise, reflecting the fact that the percentage of new accounts can be
shifted by large promotional or marketing campaigns at a single bank. The plot of regression coef-
ficients shows no evidence of a differential downturn in consumer card originations. The preferred
Phase 3 point estimate of 0.02 from column 4 of Table 7 indicates that there is virtually zero differen-
tial change in the percentage of new consumer accounts, although the standard error of 0.28 prevents
us from ruling out meaningful effects in either direction.
Figure 12 shows the same figures for ADB for accounts with FICO scores below 660 at origination.
Panel A shows mean ADB for consumer and small business cards. Panel B shows coefficients on
the consumer account × month interactions from a difference-in-differences regression specification
50We use the average pre-CARD Act level of accounts as the denominator, instead of the contemporaneous number ofaccounts, to minimize noise that arises from bank decisions to write off accounts in blocks, which makes the denominatordrop in discrete increments over time.
29
(Equation 2) with ADB as the dependent variable. There is no evidence of a differential change in
consumer credit card ADB. The regression estimates in columns 5 and 6 of Table 7 confirm this result.
The non-response of credit volume is fully consistent with the predictions of the model. Recall
from Section 6.1 that the effect of a decrease in fees p2 on credit volume is given by ν = ∂q∂p1
(ω− ψ).
Thus, our finding of zero offset (ω = 0) and the implied non-salience of fees (ψ = 0) implies that
the CARD Act should not affect the equilibrium quantity of credit (ν = 0). As a result, we think
the findings on credit volume are not only independently informative but should be interpreted as
further validation of our model and offset result.
7 Conclusion
The recent financial crisis has focused considerable attention on regulating consumer financial prod-
ucts, with the newly-created CFPB and other federal agencies given an explicit mission to “promote
fairness and transparency for mortgages, credit cards, and other consumer financial products and
services.” We agree with Campbell et al. (2011) that an important priority for economic research is to
“evaluate both potential and existing regulations to determine whether interventions actually deliver
the desired improvements in the metrics for success.”
This paper aims to take a step in this direction, by providing a quantitative analysis of the impact
of the CARD Act, argued by some to be the most significant piece of credit card legislation in a
generation (Levitin, 2010). We find that the CARD Act successfully reduced borrowing costs, in
particular for borrowers with the lowest FICO scores. We find no evidence for offsetting increases
in other costs or a decline in credit volume. In addition, we find that the disclosure requirements of
the CARD Act had a small but significant impact on borrowers’ repayment behavior. Our two years
of post-CARD Act data do not allow us to investigate the longer-run effects of the CARD Act on
industry exit or entry, or effects on margins with multi-year contracts (e.g., promotional agreements)
or lumpy long-run investments (e.g., IT infrastructure and credit-scoring models).
30
References
Agarwal, Sumit, Souphala Chomsisengphet, Chunlin Liu, and Nicholas Souleles. 2006. “Do Con-sumers Choose the Right Credit Contracts?” Working Paper.
Agarwal, Sumit, Souphala Chomsisengphet, Neale Mahoney, and Johannes Stroebel. 2014. “ASimple Framework for Estimating the Consumer Benefits from Regulating Hidden Fees.” WorkingPaper.
American Bankers Association. 2013. “Response to Request for Information Regarding the CreditCard Market.”
Ausubel, Lawrence M. 1991. “The Failure of Competition in the Credit Card Market.” American Eco-nomic Review, 81(1): 50–81.
Bar-Gill, Oren, and Elizabeth Warren. 2008. “Making Credit Safer.” University of Pennsylvania LawReview, 157(1): 1–101.
Bar-Gill, Oren, and Ryan Bubb. 2012. “Credit Card Pricing: The CARD Act and Beyond.” CornellLaw Review, 97: 11–40.
Bordalo, Pedro, Nicola Gennaioli, and Andrei Shleifer. 2012. “Salience and Consumer Choice.”Working Paper.
Bresnahan, Timothy F. 1989. “Empirical Studies of Industries with Market Power.” In Handbook ofIndustrial Organization. Vol. 2, , ed. R. Schmalensee and R. Willig, Chapter 17, 1011–1057. Elsevier.
Calem, Paul S., and Loretta J. Mester. 1995. “Consumer Behavior and the Stickiness of Credit-CardInterest Rates.” American Economic Review, 85(5): 1327–36.
Campbell, John Y. 2006. “Household Finance.” Journal of Finance, 61(4): 1553–1604.
Campbell, John Y., Howell E. Jackson, Brigitte C. Madrian, and Peter Tufano. 2011. “ConsumerFinancial Protection.” Journal of Economic Perspectives, 25(1): 91–114.
Carroll, Gabriel D., James J. Choi, David Laibson, Brigitte C. Madrian, and Andrew Metrick. 2009.“Optimal Defaults and Active Decisions.” Quarterly Journal of Economics, 124(4): 1639–1674.
Chetty, Raj, Adam Looney, and Kory Kroft. 2009. “Salience and Taxation: Theory and Evidence.”American Economic Review, 99(4): 1145–1177.
Choi, James J., David I. Laibson, and Brigitte C. Madrian. 2005. “Are Empowerment and EducationEnough? Underdiversification in 401 (k) Plans.” Brookings Papers on Economic Activity, 2005(2): 151–213.
Conley, Timothy G, and Christopher R Taber. 2011. “Inference with “Difference in Differences” witha Small Number of Policy Changes.” The Review of Economics and Statistics, 93(1): 113–125.
Consumer Financial Protection Bureau. 2013. “Navigating the Market: A Comparison of Spendingon Financial Education and Financial Marketing.”
Debbaut, Peter, Andra Ghent, and Marianna Kudlyak. 2013. “Are Young Borrowers Bad Borrowers?Evidence from the Credit CARD Act of 2009.” Working Paper.
Fabinger, Michal, and E. Glen Weyl. 2013. “Pass-Through and Demand Forms.” Working Paper.
31
Federal Reserve Board of Governors. 2010. “Report to the Congress on the Use of Credit Cards bySmall Businesses and the Credit Card Market for Small Businesses.”
FRBNY. 2013. “Federal Reserve Bank of New York, Quarterly Report on Household Debt and Credit,May 2013.”
Gabaix, Xavier, and David Laibson. 2006. “Shrounded Attributes, Consumer Myopia, and Informa-tion Suppression in Competitive Markets.” Quarterly Journal of Economics, 121(2): 505–540.
GAO. 2009. “Government Accountability Office: Rising Interchange Fees Have Increased Costs forMerchants, but Options for Reducing Fees Pose Challenges.” GAO-10-45.
Gross, David B., and Nicholas S. Souleles. 2002. “Do Liquidity Constraints and Interest Rates Mat-ter for Consumer Behavior? Evidence from Credit Card Data.” Quarterly Journal of Economics,117(1): 149–185.
House of Lords. 2011. “Behavioral Change.” Science and Technology Select Committee, 2nd Reportof Session 2010-12.
Jambulapati, Vikram, and Joanna Stavins. 2013. “The Credit CARD Act of 2009: What Did BanksDo?” Federal Reserve Bank of Boston Working Paper, 13-7.
Kuchler, Theresa. 2013. “Sticking to Your Plan: Hyperbolic Discounting and Credit Card Debt Pay-down.” Working Paper.
Laibson, David, Andrea Repetto, and Jeremy Tobacman. 2007. “Estimating Discount Functions withConsumption Choices over the Lifecycle.” NBER Working Paper.
Lee, Seung Jung, and Jonathan D. Rose. 2010. “Profits and Balance Sheet Developments at U.S.Commercial Banks in 2009.” Federal Reserve Bulletin, A57–97.
Levitin, Adam. 2010. “The Credit CARD Act: Opportunities and Challenges for Credit Unions.”Filene Research Institute, Research Brief 202.
Madrian, Brigitte C., and Dennis F. Shea. 2001. “The Power of Suggestion: Inertia in 401 (k) Partici-pation and Savings Behavior.” Quarterly Journal of Economics, 116(4): 1149–1187.
Mahoney, Neale, and E. Glen Weyl. 2013. “Imperfect Competition in Selection Markets.” WorkingPaper.
Mullainathan, Sendhil, Michael Barr, and Eldar Shafir. 2009. “The Case for Behaviorally InformedRegulation.” In New Perspectives on Regulation. , ed. David Moss and John Cisternino, 25–62. TheTobin Project.
Navarro-Martinez, Daniel, Linda Court Salisbury, Katherine N. Lemon, Neil Stewart, William JMatthews, and Adam J.L. Harris. 2011. “Minimum Required Payment and Supplemental Infor-mation Disclosure Effects on Consumer Debt Repayment Decisions.” Journal of Marketing Research,48(SPL): S60–S77.
Posner, Eric, and E. Glen Weyl. 2013. “Benefit-Cost Analysis for Financial Regulation.” AmericanEconomic Review, 103(3): 393–97.
32
Stango, Victor, and Jonathan Zinman. 2013. “Borrowing High vs. Borrowing Higher: Sources andConsequences of Dispersion in Individual Borrowing Costs.” Working Paper.
Stango, Victor, and Jonathan Zinman. Forthcoming. “Limited and Varying Consumer Attention:Evidence from Shocks to the Salience of Bank Overdraft Fees.” Review of Financial Studies.
Stewart, Neil. 2009. “The Cost of Anchoring on Credit-Card Minimum Repayments.” PsychologicalScience, 20(1): 39–41.
Sunstein, Cass R. 2006. “Boundedly Rational Borrowing.” The University of Chicago Law Review, 249–270.
Thaler, Richard H, and Cass R. Sunstein. 2008. Nudge: Improving Decisions about Health, Wealth, andHappiness. Yale University Press.
Thaler, Richard H., and Shlomo Benartzi. 2004. “Save More TomorrowTM: Using Behavioral Eco-nomics to Increase Employee Saving.” Journal of Political Economy, 112(S1): S164–S187.
U.S. Senate. 2009a. “S5314.” Congressional Record, 155.
U.S. Senate. 2009b. “Senate Report No. 111-16.”
Warren, Elizabeth. 2011. “Testimony to House Subcommittee on Financial Institutions and Con-sumer Credit Committee on Financial Services.”
Washington Post. 2013. “J.P. Morgan’s Dimon says new laws have hurt his company.”
Weyl, E Glen, and Michal Fabinger. 2013. “Pass-Through as an Economic Tool: Principles of Inci-dence under Imperfect Competition.” Journal of Political Economy, 121(3): 528–583.
33
Figure 1: Payoff Disclosure
If you make no additional
charges using this card
and each month you pay …
You will pay off the
balance shown in this
statement in about …
And you will end up
paying an estimated total of …
Only the minimum payment 10 years $3,284
$62 3 years$2,232
(Savings of $1,052)
Note: Figure provides an example of the disclosure statement on monthly credit card reports required by the CARD Act.
Figure 2: Profit Components by FICO Score
510
1520
25F
inan
ce C
harg
es (
% o
f AD
B)
480 520 560 600 640 680 720 760 800 840
FICO Score
Finance Charge Income0
1020
3040
Tot
al F
ees
(% o
f AD
B)
480 520 560 600 640 680 720 760 800 840
FICO Score
Fee Income
010
2030
4050
Net
Cha
rge-
offs
(%
of A
DB
)
480 520 560 600 640 680 720 760 800 840
FICO Score
Net Charge-offs
01
23
4In
terc
hang
e -
Rew
ards
(%
of A
DB
)
480 520 560 600 640 680 720 760 800 840
FICO Score
Interchange Income - Rewards Expense
Note: Figure shows key components of realized profits for consumer credit cards as an annualized percentage ofADB by FICO score at origination binned in groups of 5. The sample is restricted to the pre-CARD Act period,defined as April 2008 to January 2010.
34
Figure 3: Realized Profits and Number of Accounts by FICO Score
-50
510
15R
ealiz
ed P
rofit
s (%
of A
DB
)
480 520 560 600 640 680 720 760 800 840
FICO Score
Realized Profits
01
23
4N
umbe
r of
Acc
ount
s (m
illio
ns)
480 520 560 600 640 680 720 760 800 840
FICO Score
Number of Accounts
Note: Figure shows realized profits for consumer credit cards as an annualized percentage of ADB (top panel) andnumber of accounts (bottom panel) by FICO score at origination binned in groups of 5. The sample is restricted to thepre-CARD Act period, defined as April 2008 to January 2010. Realized profits are the difference between revenues(interest charges, fees, and interchange income) and costs (net chargeoffs, cost of funds, operational expense, andfraud and rewards expense). Number of accounts are per reporting month.
35
Figure 4: Over Limit Fees: FICO < 660
(a) Means
02
46
Annu
alize
d O
ver L
imit
Fees
(% o
f ADB
)
2008m1 2009m1 2010m1 2011m1 2012m1
Consumer Accounts Small Business Accounts
(b) Regression Coefficients
02
46
Ann
ualiz
ed O
ver
Lim
it F
ees
(% o
f AD
B)
2008m1 2009m1 2010m1 2011m1 2012m1
Note: Figures show over limit fees as an annualized percentage of ADB for account holders with a FICO score lessthan 660 at origination. Panel A shows monthly averages for consumer and small business credit cards. Panel Bshows the coefficients on consumer account ×month interactions from a difference-in-differences regression (Equa-tion 2) with over limit fees as an annualized percentage of ADB as the dependent variable. In Panel B, we normalizethe coefficient on the month when the bill was signed to the pre-CARD Act consumer account mean for reference.We show coefficients from a baseline specification where we include consumer account and month fixed effects, andfully interacted fixed effects for product type, bank, and FICO score groups. The sample period is April 2008 toDecember 2011. Vertical lines are plotted in May 2009, February 2010, and August 2010, the date when the bill wassigned and the two key implementation dates of the CARD Act, respectively.
36
Figure 5: Over Limit Fees: FICO ≥ 660
(a) Means
0.5
1An
nual
ized
Ove
r Lim
it Fe
es (%
of A
DB)
2008m1 2009m1 2010m1 2011m1 2012m1
Consumer Accounts Small Business Accounts
(b) Regression Coefficients
0.5
1A
nnua
lized
Ove
r Li
mit
Fee
s (%
of A
DB
)
2008m1 2009m1 2010m1 2011m1 2012m1
Note: Figures show over limit fees as an annualized percentage of ADB for account holders with a FICO score ofat least 660 at origination. Panel A shows monthly averages for consumer and small business credit cards. Panel Bshows the coefficient on consumer account × month interactions from a difference-in-differences regression (Equa-tion 2) with over limit fees as an annualized percentage of ADB as the dependent variable. In Panel B, we normalizethe coefficient on the month when the bill was signed to the pre-CARD Act consumer account mean for reference.We show coefficients from a baseline specification where we include consumer account and month fixed effects, andfully interacted fixed effects for product type, bank, and FICO score groups. The sample period is April 2008 toDecember 2011. Vertical lines are plotted in May 2009, February 2010, and August 2010, the date when the bill wassigned and the two key implementation dates of the CARD Act, respectively.
37
Figure 6: Total Fees: Regression Coefficients
(a) FICO <660
510
1520
25A
nnua
lized
Tot
al F
ees
(% o
f AD
B)
2008m1 2009m1 2010m1 2011m1 2012m1
(b) FICO ≥ 660
02
46
8A
nnua
lized
Tot
al F
ees
(% o
f AD
B)
2008m1 2009m1 2010m1 2011m1 2012m1
Note: Figure shows coefficients on consumer account × month interactions from difference-in-differences regres-sions (Equation 2) with total fees as an annualized percentage of ADB as the dependent variable. Panel A restrictsthe sample to account holders with a FICO score below 660 at origination. Panel B restricts the sample to accountholders with a FICO score of 660 or above. We normalize the coefficient on the month when the bill was signed tothe pre-CARD Act consumer account mean for reference. We show coefficients from a baseline specification wherewe include consumer account and month fixed effects, and fully interacted fixed effects for product type, bank, andFICO score groups. The sample period is April 2008 to December 2011. Vertical lines are plotted in May 2009, Febru-ary 2010, and August 2010, the date when the bill was signed and the two key implementation dates of the CARDAct, respectively.
38
Figure 7: Payoff Distribution by FICO Score
0.2
.4.6
.8Sh
are
of A
ccou
nt-M
onth
s
480 520 560 600 640 680 720 760 800 840
FICO Score
Full Payment
.1.2
.3.4
.5Sh
are
of A
ccou
nt-M
onth
s
480 520 560 600 640 680 720 760 800 840
FICO Score
Minimum Payment or Less
Note: Figure shows payoff behavior by FICO score at origination in the year preceding the CARD Act, defined asFebruary 2009 to January 2010. The top panel shows the share of account-months making the full payment. The bottompanel shows the share of account-months making the minimum payment or less. The sample excludes accounts thathave a zero cycle-ending balance.
39
Figure 8: Distribution of Months-to-Payoff (T)
(a) Consumer Credit Cards
.005
.006
.007
.008
.009
.01
Sha
re o
f Acc
ount
-Mon
ths
10 20 30 40 50 60Months to Payoff
Pre-CARD Act Post-CARD Act
(b) Small Business Credit Cards
.002
.004
.006
.008
.01
Sha
re o
f Acc
ount
-Mon
ths
10 20 30 40 50 60Months to Payoff
Pre-CARD Act Post-CARD Act
Note: Figure plots distributions of months-to-payoff (T) in the year before (dashed black line) and after (solid blueline) the February 2009 CARD Act implementation date. Months-to-payoff (T) is the number of months it would taketo pay off the cycle-ending balance if the account holder makes constant payments and makes no new purchases, andis calculated using Equation 4. We present the distribution for T between 10 and 60. The “share of account-months”is top-coded at 1% to focus on the distribution around the CARD Act target payoff amount (T = 36). The top panelshows the distribution for consumer credit cards, the bottom panel for small business credit cards.
40
Figure 9: Interest Charges: FICO <660
(a) Means
1214
1618
2022
24An
nual
ized
Inte
rest
Cha
rges
(% o
f ADB
)
2008m1 2009m1 2010m1 2011m1 2012m1
Consumer Accounts Small Business Accounts
(b) Regression Coefficients
Full Offset
No Offset
1015
2025
30An
nual
ized
Inte
rest
Cha
rges
(% o
f ADB
)
2008m1 2009m1 2010m1 2011m1 2012m1
Note: Figures show interest charges as an annualized percentage of ADB for account holders with a FICO score below660 at origination. Panel A shows monthly averages for consumer and small business credit cards. Panel B showsthe coefficients on consumer account × month interactions from a difference-in-differences regression (Equation 2)with interest charges as an annualized percentage of ADB as the dependent variable. In Panel B, we normalize thecoefficient on the month when the bill was signed to the pre-CARD Act consumer account mean for reference. Weshow coefficients from a baseline specification where we include consumer account and month fixed effects, and fullyinteracted fixed effects for FICO score group, product type, and bank. The sample period is April 2008 to December2011. Vertical lines are plotted in May 2009, February 2010, and August 2010, the date when the bill was signed andthe two key implementation dates of the CARD Act, respectively. The dashed horizontal line shows the increase ininterest charges that would be required to offset the 5.5 percentage point reduction in fee revenue.
41
Figure 10: Credit Limits: FICO <660
(a) Means
020
0040
0060
00Cr
edit
Lim
it ($
)
2008m1 2009m1 2010m1 2011m1 2012m1
Consumer Accounts Small Business Accounts
(b) Regression Coefficieints
020
0040
0060
00Cr
edit
Lim
it ($
)
2008m1 2009m1 2010m1 2011m1 2012m1
Note: Figure shows credit limits for account holders with a FICO score below 660 at origination. Panel A showsmonthly averages for consumer and small business credit cards. Panel B shows the coefficients on consumer account× month interactions from a difference-in-differences regression (Equation 2) with credit limits as the dependentvariable. In Panel B, we normalize the coefficient on the month when the bill was signed to the pre-CARD Actconsumer account mean for reference. We show coefficients from a baseline specification where we include consumeraccount and month fixed effects, and fully interacted fixed effects for FICO score group, product type, and bank. Thesample period is April 2008 to December 2011. Vertical lines are plotted in May 2009, February 2010, and August2010, the date when the bill was signed and the two key implementation dates of the CARD Act, respectively.
42
Figure 11: New Accounts: FICO <660
(a) Means
0.5
11.
52
New
Acco
unts
(% o
f Pre
-CAR
D Ac
t Lev
el)
2008m1 2009m1 2010m1 2011m1 2012m1
Consumer Accounts Small Business Accounts
(b) Regression Coefficients
01
2Ne
w Ac
coun
ts (%
of P
re-C
ARD
Act L
evel
)
2008m1 2009m1 2010m1 2011m1 2012m1
Note: Figure shows new accounts for accounts holders with FICO scores below 660 at origination, which we measureas the percentage of new accounts relative to the average pre-CARD Act number of accounts in the data. Panel Ashows monthly averages for consumer and small business credit cards. Panel B shows the coefficients on consumeraccount × month interactions from a difference-in-differences regression (Equation 2) with new accounts as a per-centage of the pre-CARD Act average number of accounts as the dependent variable. In Panel B, we normalize thecoefficient on the month when the bill was signed to the pre-CARD Act consumer account mean for reference. Weshow coefficients from a baseline specification where we include consumer account and month fixed effects, and fullyinteracted fixed effects for FICO score group, product type, and bank. The sample period is April 2008 to December2011. Vertical lines are plotted in May 2009, February 2010, and August 2010, the date when the bill was signed andthe two key implementation dates of the CARD Act, respectively.
43
Figure 12: Average Daily Balances: FICO <660
(a) Means
010
0020
0030
00Av
erag
e Da
ily B
alan
ce ($
)
2008m1 2009m1 2010m1 2011m1 2012m1
Consumer Accounts Small Business Accounts
(b) Regression Coefficients
010
0020
0030
00A
vera
ge D
aily
Bal
ance
($)
2008m1 2009m1 2010m1 2011m1 2012m1
Note: Figure shows average daily balances for account holder with a FICO score below 660 at origination. Panel Ashows monthly averages for consumer and small business credit cards. Panel B shows the coefficients on consumeraccount × month interactions from a difference-in-differences regression (Equation 2) with average daily balancesas the dependent variable. In Panel B, we normalize the coefficient on the month when the bill was signed to thepre-CARD Act consumer account mean for reference. We show coefficients from a baseline specification where weinclude consumer account and month fixed effects, and fully interacted fixed effects for FICO score group, producttype, and bank. The sample period is April 2008 to December 2011. Vertical lines are plotted in May 2009, February2010, and August 2010, the date when the bill was signed and the two key implementation dates of the CARD Act,respectively.
44
Table 1: Sample Description
Quarter Banks Consumer Small Business
2008
Q2 8 146,791,168 7,422,173
Q3 8 149,206,816 7,520,410
Q4 8 150,897,312 7,509,002
2009
Q1 8 156,140,112 7,441,551
Q2 8 153,784,576 7,398,919
Q3 8 151,710,160 7,248,530
Q4 8 150,692,000 7,037,414
2010
Q1 8 148,839,584 6,945,099
Q2 8 148,081,888 6,874,883
Q3 8 147,366,704 6,586,668
Q4 8 145,080,128 6,432,164
2011
Q1 8 145,119,552 6,382,301
Q2 8 145,631,632 6,366,402
Q3 8 147,312,352 6,499,508
Q4 8 137,829,936 6,573,073
Reporting Accounts
Note: Table shows the number of consumer and small business accounts by quarter for the sample period,defined as Q2 2008 to Q4 2011.
45
Table 2: Summary Statistics
Mean Std Dev Mean Std Dev Mean Std Dev
Average Daily Balance $1,346.55 $2,887.52 $1,319.55 $2,840.56 $1,922.76 $3,705.39
Panel A: Using Account-level Data (Annualized $ per Account)
Panel B: Using Portfolio-level Data (Annualized $ per Account)
Small Business Credit Cards
2% of Purchase Volume
Note on Construction
1.4% of Purchase Volume
Share of ADB (Time Varying)
Share of ADB (Time Varying)
Share of ADB (Time Varying)
Share of ADB (Time Varying)
Share of ADB (Time Varying)
Note: Panel A shows summary statistics for key variables for the combined sample of consumer and small business accounts, and separately for consumerand small business accounts. Panel B reports additional variables that are constructed by combining account-level measures of ADB and purchase volumewith information from the portfolio-level data. Values are calculated using all account-months in the sample period. Operational expenses include expensesfor marketing and acquisition, collections, servicing, card-holder billing, processing payments, card issuing and administration. See note on constructionand Appendix A for more details. Except for ADB and repayment statistics, values are annualized. The sample period is April 2008 to December 2011. Allvariables are inflation-adjusted to 2012 using the CPI-U.
∗These statistics are calculated on the sample of account-months with positive cycle-ending balances.
46
Table 3: Pre-CARD Utilization and Realized Profits by FICO Score
Total <620 620-659 660-719 720-759 760-799 800+
Percent of Accounts 100.0% 17.3% 12.6% 24.6% 18.6% 19.2% 7.6%
Panel A: Capacity and Utilization (Annualized $ per Account)
Panel B: Realized Profits (% of ADB)
Note: Table shows income and cost components for consumer accounts during the pre-CARD Act period, defined as April2008 to January 2010. The first column shows averages over all accounts; the other columns show averages by FICO scoresat account origination. Net chargeoffs are the sum of principle and interest/fees chargeoffs minus recoveries. Panel Bshows values as annualized percent of average daily balances. All dollar variables are inflation-adjusted to 2012 using theCPI-U.
Note: Table shows coefficients from difference-in-differences regressions that compare fees for consumer credit cards (treatment group) and small businesscards (control group) during the different phases of the CARD Act implementation. The dependent variables are shown as an annualized percent of ADB andare calculated in the same manner as the values in Panel B of Table 3. We define Phase 2 as March 2010 to August 2010 and Phase 3 as the months after August2010. The period prior to February 2010 is the omitted group, so the coefficients can be interpreted as the differential effect relative to the pre-implementationperiod. The sample period is April 2008 to December 2011. The regressions are estimated on data aggregated to the bank× product type× FICO score×monthlevel (N = 3,531 in Panel A, N = 7,154 in Panel B). Standard errors clustered by bank × product type are shown in parentheses and the associated p-values areshown in brackets. There are 46 such clusters in Panel A and 47 clusters in Panel B.
Pre-CARD Act, Consumer Mean 5.72 5.72 7.50 38.03 38.03 49.83
R-Squared 0.09 0.86 0.76 0.04 0.90 0.87
Dependent Variable: Percent of Payments
Target Range (30 ≤ T ≤ 38) Less than Target (T > 38)
Note: Table shows estimates from difference-in-differences regressions of payoff behavior for consumer credit cards(treatment group) and small business cards (control group) around the implementation of the payoff nudge. In columns1 to 3, the dependent variable is the percent of account holders that make a payment corresponding to the target CARDAct payment nudge amount (30 ≤ T ≤ 38). In columns 4 to 6, the dependent variable is the percent of account holdersthat make payments smaller than the CARD Act payment nudge amount (T > 38). The sample period is April 2008 toDecember 2011. The regressions are estimated on data aggregated to the bank × product type × FICO score × monthlevel (N = 10, 711). In columns 3 and 6, the sample is restricted to accounts with a cycle-ending balance larger than$1, 000. Standard errors clustered by bank × product type are shown in parentheses and the associated p-values areshown in brackets. There are 46 such clusters in the sample.
Interest Charges Offset Total Income Costs Excluding ChargeoffsDependent Variable: % of ADB
Note: Table shows coefficients from difference-in-differences regressions that compare outcomes for consumer credit cards (treatment group) and smallbusiness cards (control group) during the different phases of the CARD Act implementation. We define the Anticipation period as the months betweenthe passage of the bill in May 2009 and the implementation of Phase 2 in February 2010. We define Phase 2 as March 2010 to August 2010 and Phase 3 asthe months after August 2010. The period prior to April 2009 is the omitted group, so the coefficients can be interpreted as the differential effect relativeto pre-CARD Act period. The sample is restricted to accounts with FICO scores below 660 at origination. The sample period is April 2008 to December2011. The regressions are estimated on data aggregated to the bank × product type × FICO score × month level (N = 3,531). Standard errors clusteredby bank × product type are shown in parentheses and the associated p-values are shown in brackets. There are 46 such clusters in the sample.
Consumer X Anticipation 124.31 52.15 0.13 0.17 -105.66 -107.57
(153.63) (174.83) (0.11) (0.11) (59.32) (62.40)
[0.43] [0.77] [0.26] [0.14] [0.10] [0.11]
Consumer X Phase 2 229.37 125.25 0.19 0.26 -98.13 -96.96
(285.75) (316.02) (0.11) (0.14) (142.37) (145.93)
[0.43] [0.70] [0.10] [0.08] [0.50] [0.52]
Consumer X Phase 3 294.20 150.54 -0.09 0.02 16.00 -13.89
(328.38) (342.42) (0.23) (0.28) (192.66) (188.39)
[0.38] [0.67] [0.70] [0.94] [0.93] [0.94]
Controls
Main Effects
Consumer Card FE X X X X X X
Month FE X X X X X X
Additional Covariates (Fully Interacted)
Bank FE X X X
Product type FE X X X
FICO Score FE X X X
Pre-CARD Act, Consumer Mean 2,807.88 2,807.88 0.25 0.25 1,159.29 1,159.29
R-Squared 0.00 0.99 0.04 0.67 0.03 0.89
Credit Limits ($)
New Accounts
(% of Pre-CARD Act Level) Average Daily Balances ($)
Dependent Variable:
Note: Table shows coefficients from difference-in-differences regressions that compare measures of credit volume forconsumer credit cards (treatment group) and small business cards (control group) during the different phases of theCARD Act implementation. Columns 1 and 2 show regressions with credit limits as the dependent variable. Columns3 and 4 show regressions with new accounts as a percentage of the pre-CARD Act average number of accounts as thedependent variable. Columns 5 and 6 shows regressions with average daily balances as the dependent variable. Wedefine the Anticipation period as the months between the passage of the bill in May 2009 and the implementation ofPhase 2 in February 2010. We define Phase 2 as March 2010 to August 2010 and Phase 3 as the months after August 2010.The period prior to April 2009 is the omitted group, so the coefficients can be interpreted as the differential effect relativeto pre-CARD Act period. The sample is restricted to accounts with FICO scores below 660 at origination. The sampleperiod is April 2008 to December 2011. The regressions are estimated on data aggregated to the bank × product type ×FICO score × month level (N = 3,531). Standard errors clustered by bank × product type are shown in parentheses andthe associated p-values are shown in brackets. There are 46 such clusters in the sample.
51
APPENDIX
A Data AppendixA.1 Constructing Revenue and Cost Measures
A number of the important cost and revenue measures for credit cards are not observed at the accountlevel, but only at the credit card portfolio level. These include the cost of funds, operational expenses,interchange income, rewards expenses, and fraud expenses. Since most of these measures broadlyscale with either average daily balances (cost of funds, operational expenses) or purchase volume(interchange income, rewards, and fraud), we can use the information in the portfolio-level data toconstruct account-level measures of these variables. At the portfolio level, banks also report “dailyaverage managed receivables,” but not total monthly transaction volume.
A.1.1 Cost of Funds
The cost of funds is the interest rate paid by financial institutions for the funds that they deploy intheir business, and is a significant component of the cost of extending credit. The cost of funds alsovaries across banks, depending, amongst other things, on their ability to raise funds in the interbankmarket. Banks report “total interest expense accrued for the month to fund credit card receivables” inthe portfolio-level data. This allows us, for every bank and month, to calculate the cost of funds—thatis, the annualized cost of funding credit card lending. The top panel of Figure A1 shows the averagecost across banks of this cost of funds measure. The cost of funds declined markedly over our sampleperiod, with particularly steep drops in 2008, as the Fed Funds Rate declined to zero. The graphalso shows the 11th District Cost of Funds Index (COFI), a monthly weighted average of the interestrates paid on checking and savings accounts offered by financial institutions operating in the states ofArizona, California and Nevada. This index is widely seen as a measure of the refinancing costs of USfinancial institutions. Reassuringly, it moves closely with the cost-of-funds derived from the creditcard portfolio data. For every account, we calculate the cost of funding that account’s receivables bymultiplying the average daily balances with the cost of funds for the corresponding bank and month.
A.1.2 Operational Expenses
At the portfolio level, we also observe banks reporting three other components of cost. These arecollection expenses, which include the costs incurred to collect problem credit; marketing / acquisi-tion and card processing costs, which include the costs to acquire, advertise, and promote and pro-cess credit cards; and other expenses, which include servicing, cardholder billing, processing inter-change, processing payments, card issuing, authorizations, card administration and outside ser-vices/outsourcing expenses. We combine these three expense categories into the category “Oper-ational Costs.” For each month, we calculate the ratio of these operational costs to the average dailymanaged receivables. This ratio is shown in the middle panel of Figure A1. We use the smoothedversion of this series to assign a corresponding “operational cost” to every account by multiplyingthe average daily balances with the operational expense ratio for the corresponding month.
52
A.1.3 Interchange Income, Rewards and Fraud Expenses
Three other components of credit card profitability are also reported at the portfolio level: inter-change income and rewards and fraud expenses. At the account level, these measures are likely toscale with total purchase volume rather than with average daily balances. Unfortunately, we do notobserve a measure of total purchase volume at the portfolio level. While there is some heterogeneityin interchange fees, average interchange income for the issuing bank is roughly 2% of overall volume(GAO, 2009). Hence, we assess interchange income at the account level to be 2% of purchase volume.The portfolio-level data show that expenditures for rewards and fraud make up about 70% of inter-change income (see the bottom panel of Figure A1). Therefore, we assess reward and fraud expensesat the account level to be 0.7 × 2% = 1.4% of purchase volume. To validate the approach of choosinginterchange income as a constant fraction of purchase volume, we conduct the following analysis:First, we use the account-level data to calculate, for every month, the ratio of purchase volume to av-erage daily balances (see top panel of Figure A2). Next, we combine this ratio with the portfolio-leveldata to impute a total purchase volume for the entire credit card portfolio. Finally, we construct theratio of interchange income to this imputed purchase volume at the portfolio level (see bottom panelof Figure A2). The ratio is constant at 2% over the entire sample period.
A.1.4 Return on Equity
In Section 3.2 we discussed the profits realized by credit card lenders in the pre-CARD Act period,estimating that credit cards generated a net profit of 1.7% of ADB.51 This translates into a Returnon Assets of 1.1% after adjusting for taxes, where Return on Assets (ROA) = Earnings
Assets .52 This is veryhigh relative to measures of average industry profitability. The top panel of Appendix Figure A3shows total U.S. commercial banking sector ROA over the 2000 to 2013 period. Average ROA is 0.2%during the pre-CARD Act period, and 1% over the entire period. This implies an ROA for the creditcard portfolio of about five times the industry average during the pre-CARD Act period. The bottompanel of Appendix Figure A3 shows the leverage of the U.S. commercial banking sector. Given anROA of over 1% and average leverage of about 10, this suggests a return on equity (ROE) for creditcard lending of about 10%.
B Econometric Model
We estimate the parameters of the econometric model on data collapsed to groups that representthe full interaction of the categorical variables in the data. Let g denote these groups. Using this
51Our measure of net profits subtracts out financing costs and other expenses. The other adjustment one might want tomake is to include some of the purchase volume that gets repaid at the end of the period. This value would not show upin ADB, but would still be part of the bank’s assets during the month. Table 3 shows that this adjustment would not makea large quantitative difference. An upper bound on the assets we would miss is the total purchase volume divided by 2(i.e., assuming that it gets built up evenly throughout the month). Since the number presented in Table 3 is annualized,including purchase volume in the total assets would add about $75 or about 6% to total assets. This is an upper bound onthe total amount, since the fraction of purchase volume that is not repaid at the end of the month might already be includedin average daily balances.
52We use the average tax rate for U.S. commercial banks of 32% from Lee and Rose (2010).
53
subscript, we can write the difference-in-differences specification (Equation 2) as
yigt = γCg + δt + ∑t 6=May 2009
βtCg + X′gtζ + εigt, (8)
where the g subscripts on Cg and Xgt indicate these variables vary, respectively, at the group andgroup ×month level. This specification is identical to the hierarchical regression model:
yigt = λgt + νigt
λgt = γCg + δt + ∑t 6=May 2009
βtCg + X′gtζ + µgt,
where the first equation is a regression of the account-level outcomes on group ×month fixed effectsand the second equation is a difference-in-differences specification with these fixed effects as thedependent variable. The account-level error is defined as the sum of errors from the hierarchicalmodel: εigt = µgt + νigt. We can estimate the group × month fixed effects λgt by collapsing the datato the group level. Given these estimates, we can recover the coefficient of interest with a difference-in-differences regression with these groups fixed effects as the dependent variable:
λgt = γCg + δt + ∑t 6=May 2009
βtCg + X′gtζ + µgt + νgt. (9)
This regression has two errors terms: The error µgt that represents unobserved determinants of theoutcome at the group × month level and the error νgt = λgt − λgt in the prediction of the fixedeffect. We weight the group-level observations by the number of accounts in each group so that ourestimates can be interpreted at the account-level.
C Late Fees
In Section 5.1, we examined the effect of the CARD Act provisions on late fees. In August 2010, theCARD Act restricted late fees to a maximum of $25, with the exception that late fees could be $35 ifthe account holder had been late on a payment in the previous six billing cycles. Appendix FigureA4 showed a sharp decline in late fees as an annualized percentage of ADB in August 2010, and apartial reversal of this decline over the rest of the sample period.
In this section, we examine the decline and reversal in more detail. Appendix Figure A9 plots theincidence of late fees over time. Panel A shows the overall incidence of late fees for consumer andsmall business accounts, where the overall incidence is defined as the occurrence of a late fee of anypositive level. In the pre-CARD Act period, about 8% of accounts experienced a late fee each month.These values drift downward over the sample period, with similar declines for consumer and smallbusiness accounts. In particular, the plot shows no effect of the August 2010 implementation dateon the frequency of late payments. This suggests consumers did not respond by being less careful inavoiding these fees in response to a reduction in their cost, and is consistent with our other evidenceon the non-salience of fees.
54
Because the data show no decline in the quantity of late fees in August 2010, the decline in late-fee revenue detected in Section 5.1 is necessarily attributable to a change in the fee amount. Panel Bof Appendix Figure A9 examines this price effect by plotting the frequency of late fees of differentdollar amounts. The plot is constructed by binning late fees in $5 increments and plotting the percentof account holders with late fees at the $25, $35, and $40 levels, and an “other” category that combinesaccount holders with late fees of all other positive values.53 The plot provides evidence of a one-for-one substitution from $40 to $25 late fees in August 2010. The plot also shows a gradual substitutionfrom $25 to $35 late fee amounts in the months after implementation, with the frequency of $35late fees exceeding the frequency of $25 late fees by November 2010. Banks seem to have providedaccount holders with a “clean slate” in August 2010 with no late payments in their six-month look-back period. Over time, as the fraction of account holders with a late payment in the previous sixmonths rose, banks were able to increase their fees to $35 for those accounts, contributing to theobserved partial reversal of the initial overall decline.
D Fee Offset with Selection
The composition of the borrower pool may not be invariant to the prices charged, and changing theprice might attract either higher or lower marginal cost consumers.54 To allow for such adverse oradvantageous selection, we allow aggregate marginal costs c′(q) to depend on aggregate demand q.Adverse selection at the industry level is indicated by decreasing aggregate marginal costs: c′′(q) < 0;advantageous selection is indicated by increasing aggregate marginal costs: c′′(q) > 0.
When a single firm lowers its price, it attracts consumers that are new to the market and con-sumers who are already purchasing the product from competing firms. The share of consumers firm
i captures from its competitors is given by the aggregate diversion ratio: A = −∑j 6=i ∂qj/∂pi
∂qi/∂pj, the
sum consumers lost by firms j 6= i divided by the consumers gained by firm i.55
We assume that consumers acquired from competitors are not selected and have costs equal toindustry average cost: c(q)
q . Marginal costs for a single firm c′i(qi) are the weighted sum of marginalcosts for consumers that are new to the market and marginal costs for consumers that are attractedfrom other firms:
c′i(qi) = (1− A)c′(q) + Ac(q)
q. (10)
It is convenient to characterize the demand curve faced by a single firm in terms of aggregate demand
53The $25 category is defined as accounts with late fees in the $21 to $25 range, the $35 category as accounts with fees inthe $31 to $35 range, and the $40 category as accounts with fees in the $36 to $40 range.
54Similarly, changing the price might have a direct impact on costs. For example, if high prices increase debt levels andthereby increases the probability of default.
55We thank Glen Weyl for suggesting this approach to modeling selection.
55
and the aggregate diversion ratio:
1− A = 1−∑j 6=i ∂qj/∂pi
∂qi/∂pi=
∂qi/∂pi −∑j 6=i ∂qj/∂pi
∂qi/∂pi=
q′
q′i⇐⇒ q′i =
q′
1− A, (11)
where q′ is the derivative of aggregate demand with respect to the price p1 of a single firm i.The first order condition for p1 is given by
p1 + p2 − c′i(qi) = θ µ(p1 + ψp2), (12)
with the conduct parameter θ ∈ [0, 1] and markup term µ(p1 + ψp2) as previously defined. Thesecond order condition for p1 is θ µ′ + c′′ q′ < 1. We assume that at the optimal price this conditionis satisfied. For small changes in p2, we can calculate pass-through by totally differentiating the firstorder condition:
dp1
dp2+ 1− c′′i (qi) q′i
[dp1
dp2+ ψ
]= θ µ′(p1 + ψp2)
[dp1
dp2+ ψ
]. (13)
Substituting c′′i = (1− A)c′′ and q′i =q′
1−A and rearranging gives us the pass-through formula:
ω =1− ψ [ θ µ′ + c′′ q′]
1− [θ µ′ + c′′ q′], (14)
where we have suppressed the arguments of c, q, and µ.The offset ω is increasing in the term c′′ q′. With downward sloping demand q′ < 0, this means
that the offset is relatively larger when there is adverse selection (c′′ < 0) and relatively smaller whenthere is advantageous selection (c′′ > 0). The reason the offset is larger with adverse selection is thata higher p1 brings in higher marginal cost consumers, requiring a further increase in price.
Under what conditions is the offset less than full? The second order condition θ µ′ + c′′ q′ < 1restricts the numerator and denominator to be positive. For ψ ∈ (0, 1), it follows that
ω < 1 ⇐⇒ θ µ′ + c′′ q′ < 0. (15)
Under what conditions is the offset increasing in competition? Differentiating the pass-throughformula yields
Since the denominator is always positive, for ψ ∈ (0, 1) we have
56
dω
dθ< 0 ⇐⇒ µ′ < 0, (18)
where recall that increasing competition is indicated by a lower value of θ.Under what conditions is the offset increasing in salience? Differentiating the pass-through for-
mula gives us:
dω
dψ= − [θ µ′ + c′′ q′]
1− [θ µ′ + c′′ q′]. (19)
Since θ µ′ + c′′ q′ < 0 is implied by the second order condition, it follows that
dω
dψ> 0 ⇐⇒ θ µ′ + c′′ q′ < 0. (20)
E Ancillary Evidence from Pass-Through
The theoretical model allows us to establish a link between the offset of a reduction in the non-salientprice and the pass-through of an increase in marginal costs, which we can use to test the consistencyof our theoretical and empirical results.
E.1 Theoretical Prediction
Let ρ ≡ dp1dc denote the pass-through of a increase in marginal costs. Differentiating the first order
conditions with respect to c yields ρ = 11−θ µ′ . We can then write the offset as a function of the pass-
through rate:ω = ρ + ψ (1− ρ) . (21)
When p2 is non-salient (ψ = 0), the offset is equal to the pass-through rate (ω = ρ). When p2 is fullyobserved (ψ = 1), the offset is full (ω = 1). When p2 is partially salient, we can think of consumersas observing part of the reduction in the non-salient price, leading the firm to pass through some ofthe reduction like a cost shock and the other part like a reduction in a fully observable price.
This equation is useful because it places restrictions on the relationship between the offset ω,pass-through rate ρ, and salience parameter ψ. In Section E.2, we provide an ancillary test of ourestimate of ω using this relationship along with estimates of ρ and ψ from the literature. In a relatedpaper, Agarwal et al. (2014) argue ρ and ψ are “sufficient statistics” that can be used to estimatethe consumer benefits from regulating hidden fees in a wide range of settings, and illustrate theapplicability of this approach by assessing a hypothetical regulation of airline baggage fees.
E.2 Ancillary Evidence
While perhaps surprising, we do not view the limited non-response of interest charges as unlikelyor implausible. Indeed, it is fully consistent with the theoretical model and prior evidence on (i) thelimited pass-through of borrowing costs and (ii) the low salience of fees in the credit card market.
57
The relationship between the offset (ω) and pass-through (ρ) is given by ω = ρ + ψ [1− ρ]. In-tuitively, banks will pass through the decrease in fee revenue by at least as much as a marginal costshock, and by more if the change in fees is salient. Ausubel (1991) examines the time-series correla-tion between the cost of funds and interest rates in the credit card market. He finds that interest ratesare extremely sticky, with credit card issuers passing through essentially zero of the large changes inthe cost of funds over the 1980s time period. Similarly, there is significant evidence that late fees andover limit fees have only limited salience to consumers (Sunstein, 2006; Bar-Gill and Warren, 2008;Mullainathan, Barr and Shafir, 2009; Stango and Zinman, Forthcoming). If we assume, as a startingpoint, that banks pass through ρ = 0.1 of changes in the cost of funds and a salience parameter ofψ = 0.1, the model indicates that every dollar in fee reduction, credit card issuers will increase pricesby about 19 cents (ω = ρ + ψ [1− ρ] = 0.1 + 0.1[1− 0.1] = 0.19), a value that is squarely within theconfidence interval of our offset estimate.
58
Figure A1: Portfolio Data
.01
.02
.03
.04
.05
2008m1 2009m1 2010m1 2011m1 2012m1 2013m1
Cost of Funds (Portfolio) 11th District COFI Index
Cost of Funds
.02
.03
.04
.05
2008m1 2009m1 2010m1 2011m1 2012m1 2013m1Time
Operational Expenses as share of ADB Smoothed
Operational Expenses
.5.6
.7.8
.91
2008m1 2009m1 2010m1 2011m1 2012m1 2013m1
(Rewards & Fraud Expense) / Interchange Income
Note: Figure shows plots of cost components by month. The top panel shows the cost of funds, calculated as the an-nualized interest expense (“total interest expense accrued for the month to fund credit card receivables”) as a share ofaverage daily managed receivables for that month. It also shows the 11th District Cost of Funds Index (COFI). The mid-dle panel shows the share of annualized operational expenses (including marketing and acquisition, collections, servicing,cardholder billing, processing payments, and card issuing and administration) as a share of average daily managed receiv-ables. The bottom panel shows the share of rewards and fraud expenses as a ratio of the interchange income. These figuresare constructed using the monthly general purpose credit card portfolio-level data. Numbers are averages across banks.
59
Figure A2: Interchange Income
.08
.1.1
2.1
4.1
6.1
8P
urch
ase
Vol
ume
(Sha
re o
f AD
B)
2008m1 2009m1 2010m1 2011m1 2012m1
Purchase Volume as Share of ADB
.01
.015
.02
.025
.03
Inte
rcha
nge
Inco
me
(Sha
re o
f Pur
chas
e V
olum
e)
2008m1 2009m1 2010m1 2011m1 2012m1
Interchange Income as Share of Purchase Volume
Note: Figure shows ratio of purchase volume to ADB (top panel) and share of interchange income to purchase volume(bottom panel). The top panel is constructed from account-level data. The bottom panel is constructed by taking the infor-mation from the top panel to scale the portfolio-level information on ADB to get a portfolio-level of measure of purchasevolume. Total interchange income is also reported at the portfolio level.
60
Figure A3: U.S. Commercial Banking Sector - ROA and Leverage
(a) Return on Assets (ROA)
-0.20
0.00
0.20
0.40
0.60
0.80
1.00
1.20
1.40
1.60
(b) Leverage
6
7
8
9
10
11
12
13
Note: Top panel shows the average Return on Assets (ROA) in percent for all insured U.S. Commercial Banks (FRED SeriesUSROA) as reported by the Federal Financial Institutions Examination Council. The bottom panel reports the leverage(Total Assets / Total Equity) for all insured U.S. Commercial Banks (the inverse of FRED Series EQTA). The shaded bars inthe top panel and bolded line in the bottom panel depict the pre-CARD Act period covered in Table 3.
61
Figure A4: Fees: Regression Coefficients
(a) Late Fees: FICO <6600
24
68
10A
nnua
lized
Lat
e F
ees
(% o
f AD
B)
2008m1 2009m1 2010m1 2011m1 2012m1
(b) Other Fees: FICO <660
02
4A
nnua
lized
Oth
er F
ees
(% o
f AD
B)
2008m1 2009m1 2010m1 2011m1 2012m1
(c) Late Fees: FICO ≥ 660
01
23
4A
nnua
lized
Lat
e F
ees
(% o
f AD
B)
2008m1 2009m1 2010m1 2011m1 2012m1
(d) Other Fees: FICO ≥ 660
02
46
810
Ann
ualiz
ed O
ther
Fee
s (%
of A
DB
)
2008m1 2009m1 2010m1 2011m1 2012m1
Note: Figure shows the coefficients on consumer account×month interactions from difference-in-differences regres-sions (Equation 2) with late fees and other fees as an annualized percent of ADB as the dependent variable. Otherfees are the sum of all fees except over limit and late fees. Panels A and B show values for account holders with aFICO score below 660 at origination. Panels C and D show values for account holders with a FICO score of at leastthis value. In all panels, we normalize the coefficient on the month when the bill was signed to zero and reinsertthe pre-CARD Act consumer account mean for reference. We show coefficients from a baseline specification wherewe include consumer account and month fixed effects, and fully interacted fixed effects for product type, bank, andFICO score groups. The sample period is April 2008 to December 2011. Vertical lines are plotted in May 2009, Febru-ary 2010, and August 2010, the date when the bill was signed and the two key implementation dates of the CARDAct, respectively.
62
Figure A5: Fees: Permutation Tests
(a) Over Limit Fees0
510
1520
Per
cent
-4 -3 -2 -1 0 1 2Change in Over Limit Fees (% of ADB)
(b) Late Fees
05
1015
20P
erce
nt
-2 -1.5 -1 -.5 0 .5 1Change in Late Fees (% of ADB)
(c) Total Fees
05
1015
20P
erce
nt
-8 -6 -4 -2 0 2Change in Total Fees (% of ADB)
Note: Figure shows results of permutation tests where we compare our estimate of the actual CARD Act to thedistribution of placebo estimates derived from 1,000 samples where “treatment” is randomly assigned. Panel (a)examines over limit fees, and compares the actual Phase 2 estimate (solid line) to a distribution of placebo Phase 2estimates. Panels (b) and (c) examine late fees and total fees, and compare the actual Phase 3 estimates (solid lines)to distributions of placebo Phase 3 estimates. See Section 4 for additional details.
63
Figure A6: Distribution of Months-to-Payoff (T) in Pre-CARD Act Period
(a) Consumer Credit Cards
0.1
.2.3
Shar
e of
Acc
ount
-Mon
ths
0 20 40 60 80 100Months to Payoff
(b) Small Business Credit Cards
0.1
.2.3
.4.5
Shar
e of
Acc
ount
-Mon
ths
0 20 40 60 80 100Months to Payoff
Note: Figure shows histograms of months-to-payoff (T) in the year preceding the CARD Act, defined as February2009 to January 2010. Months-to-payoff (T) is the number of months it would take to pay off the cycle-ending balanceif the account holder makes constant payments and makes no new purchases, and is calculated using Equation 4.The variable T is top-coded at 99 months with T = 100 denoting account holders that make no payment. The toppanel shows the distribution for consumer credit cards; the bottom panel shows the distribution for small businesscredit cards.
64
Figure A7: Upward Repricing
02
46
810
Upwa
rd R
epric
ing
(%)
2008m1 2009m1 2010m1 2011m1 2012m1 2013m1
Note: Figure shows the share of accounts with upward repricing over time. The sample is all consumer creditaccounts that had an APR of at least 10% in the previous month. A repricing is registered when the APR changes byat least 1 percentage point relative to the previous month. The sample period is January 2008 to April 2013. Verticallines are plotted in May 2009, February 2010, and August 2010, the date when the bill was signed and the two keyimplementation dates of the CARD Act, respectively.
65
Figure A8: Interest Charges: FICO ≥ 660
(a) Means
05
1015
2025
Annu
alize
d In
tere
st C
harg
es (%
of A
DB)
2008m1 2009m1 2010m1 2011m1 2012m1
Consumer Accounts Small Business Accounts
(b) Regression Coefficients
05
1015
2025
Annu
alize
d In
tere
st C
harg
es (%
of A
DB)
2008m1 2009m1 2010m1 2011m1 2012m1
Note: Figure shows interest charges as an annualized percent of ADB for account holders with a FICO score of at least660 at origination. Panel A shows monthly averages for consumer and small business credit cards. Panel B showsthe coefficient on consumer account × month interactions from a difference-in-differences regression (Equation 2)with interest charges as an annualized percent of ADB as the dependent variable. In Panel B, we normalize thecoefficient on the month when the bill was signed to the pre-CARD Act consumer account mean for reference. Weshow coefficients from a baseline specification where we include consumer account and month fixed effects, and fullyinteracted fixed effects for FICO score group, product type, and bank. The sample period is April 2008 to December2011. Vertical lines are plotted in May 2009, February 2010, and August 2010, the date when the bill was signed andthe two key implementation dates of the CARD Act, respectively.
66
Figure A9: Late Fees
(a) Overall Incidence
05
1015
Late
Fee
s In
ciden
ce (%
)
2008m1 2009m1 2010m1 2011m1 2012m1
Consumer Accounts Small Business Accounts
(b) Consumer Accounts: Incidence by Fee Level
02
46
Late
Fee
s In
ciden
ce (%
)
2008m1 2009m1 2010m1 2011m1 2012m1
$40 $25 $35 Other
Note: Figure shows the incidence of late fees over time. Panel A shows the percent of consumer and small businessaccounts with positive late fees in each month. Panel B shows the percent of consumer accounts with late fees of $25,$35, $45, and an “other” category that combines all other positive levels. The $25 category is defined as accountswith late fees in the $21 to $25 range, the $35 category with the $31 to $35 range, and the $40 category with the $36to $40 range. The sample period is April 2008 to December 2011. Vertical lines are plotted in May 2009, February2010, and August 2010, the date when the bill was signed and the two key implementation dates of the CARD Act,respectively.
67
Table A1: Interest Charges for New and High FICO Score Accounts: Difference-in-Differences Regressions
Note: Table shows coefficients from difference-in-differences regressions that compare interest charges as an annualized percent of ADB for consumer credit cards(treatment group) and small business cards (control group) during the different phases of the CARD Act implementation. We define new accounts as accounts intheir first full month after origination. We define the Anticipation period as the months between the passage of the bill in May 2009 and the implementation ofPhase 2 in February 2010. We define Phase 2 as March 2010 to August 2010 and Phase 3 as the months after August 2010. The period prior to April 2009 is theomitted group, so the coefficients can be interpreted as the differential effect relative to pre-CARD Act period. The sample period is April 2008 to December 2011.The regressions are estimated on data aggregated to the bank × product type × FICO score × month level (N = 3, 531 in columns 1 to 4, N = 7, 154 in columns5 to 8). Standard errors clustered by bank × product type are shown in parentheses and the associated p-values are shown in brackets. There are 46 such clustersin columns 1 to 4 and 47 clusters in columns 5 to 8.