34
Regulation 13, Rule 1: Refinery Carbon Intensity Caps AGENDA: 6 Eric Stevenson, Director Meteorology, Measurement, and Rules Division Advisory Council Meeting February 6, 2017
Regulation 13, Rule 1:Refinery Carbon Intensity Caps
AGENDA: 6
Eric Stevenson, DirectorMeteorology, Measurement,
and Rules Division
Advisory Council MeetingFebruary 6, 2017
• Problem 1: Refinery Pollution has significant impact on nearby communities and on the climate.
• Problem 2: Production of California and Alaska North Slope crude oil is declining. Currently, refineries may retool to process more energy intensive crude oil such as Canadian tar sands.
Issues
2
Proposed Solution
1. Direct regulation of criteria (PM, NOX, SO2, VOC) emissions.
2. Improved measurement and reporting of refinery emissions and feedstocks.
3. Risk-based rules to reduce health risk from toxic emissions.
4. <New> Cap Refinery Carbon Intensity3
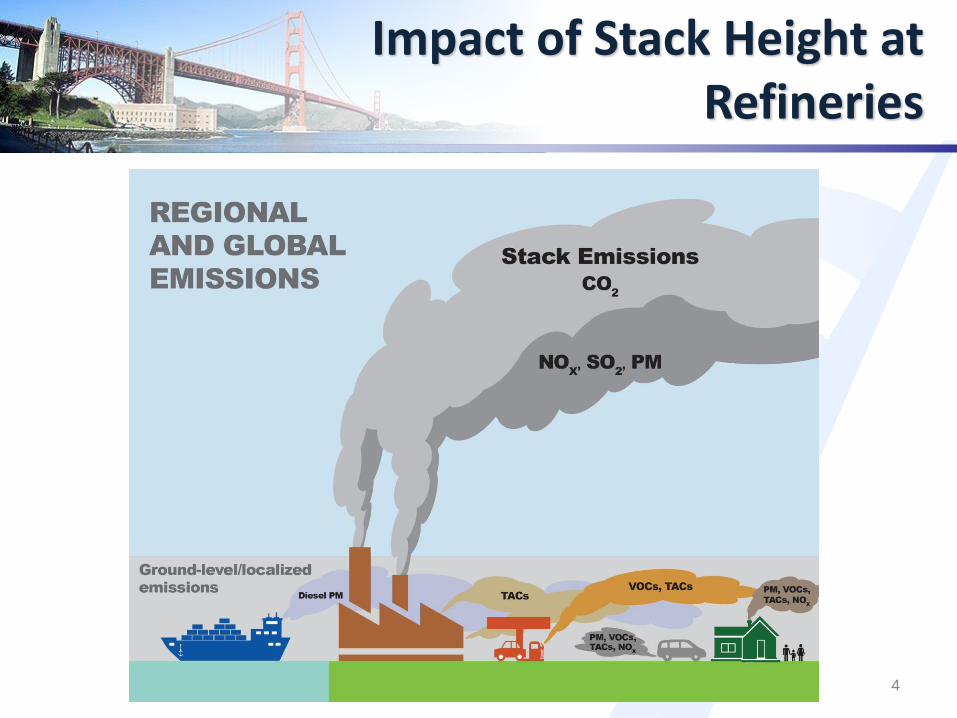
Impact of Stack Height at Refineries
4
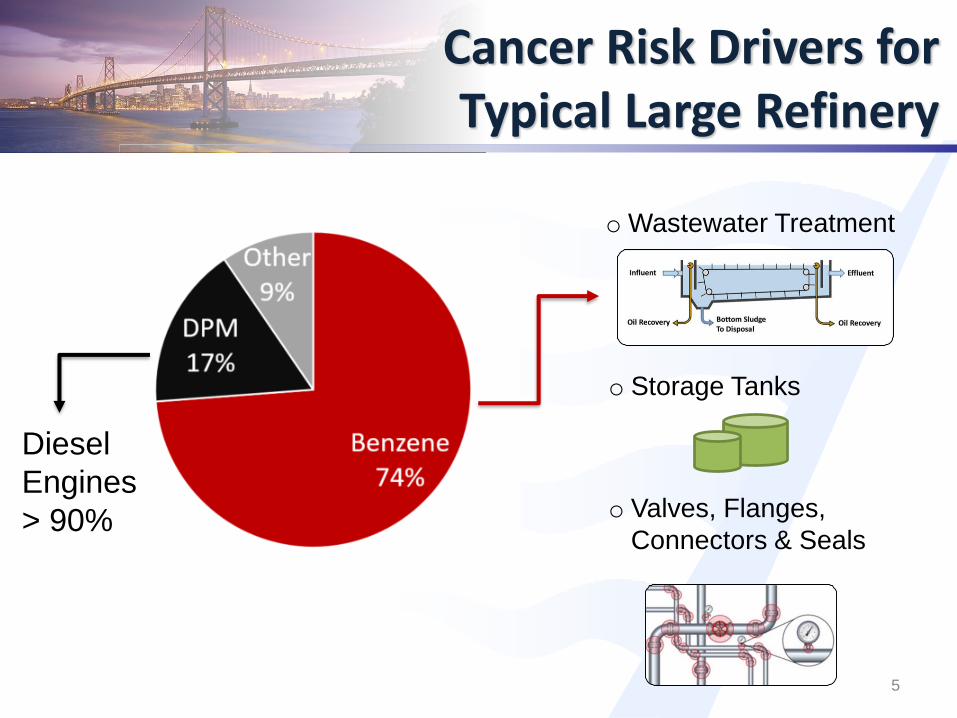
Cancer Risk Drivers for Typical Large Refinery
o Valves, Flanges,
Connectors & Seals
o Storage Tanks
o Wastewater Treatment
Diesel
Engines
> 90%
5
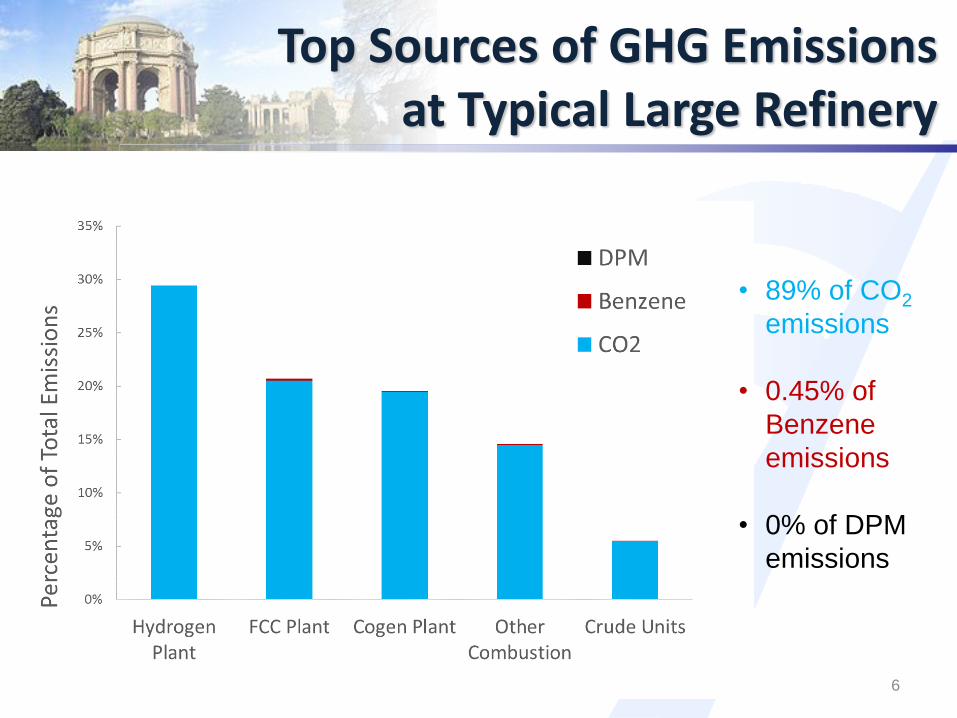
Top Sources of GHG Emissions at Typical Large Refinery
• 89% of CO2
emissions
• 0.45% of
Benzene
emissions
• 0% of DPM
emissions
6
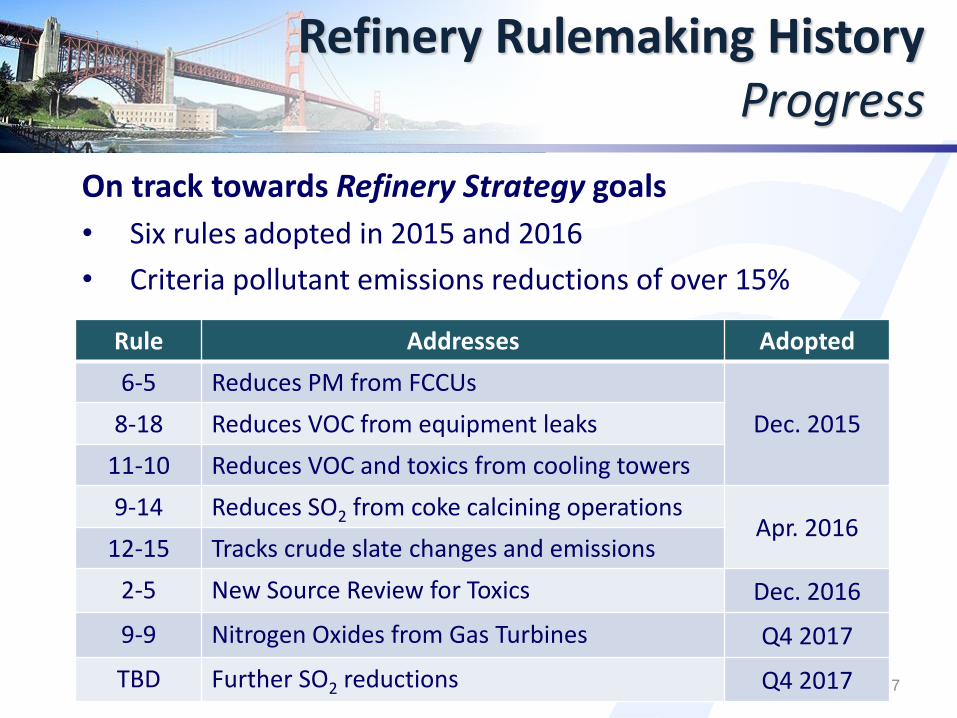
Refinery Rulemaking HistoryProgress
On track towards Refinery Strategy goals
• Six rules adopted in 2015 and 2016
• Criteria pollutant emissions reductions of over 15%
Rule Addresses Adopted
6-5 Reduces PM from FCCUs
Dec. 20158-18 Reduces VOC from equipment leaks
11-10 Reduces VOC and toxics from cooling towers
9-14 Reduces SO2 from coke calcining operationsApr. 2016
12-15 Tracks crude slate changes and emissions
2-5 New Source Review for Toxics Dec. 2016
9-9 Nitrogen Oxides from Gas Turbines Q4 2017
TBD Further SO2 reductions Q4 2017 7
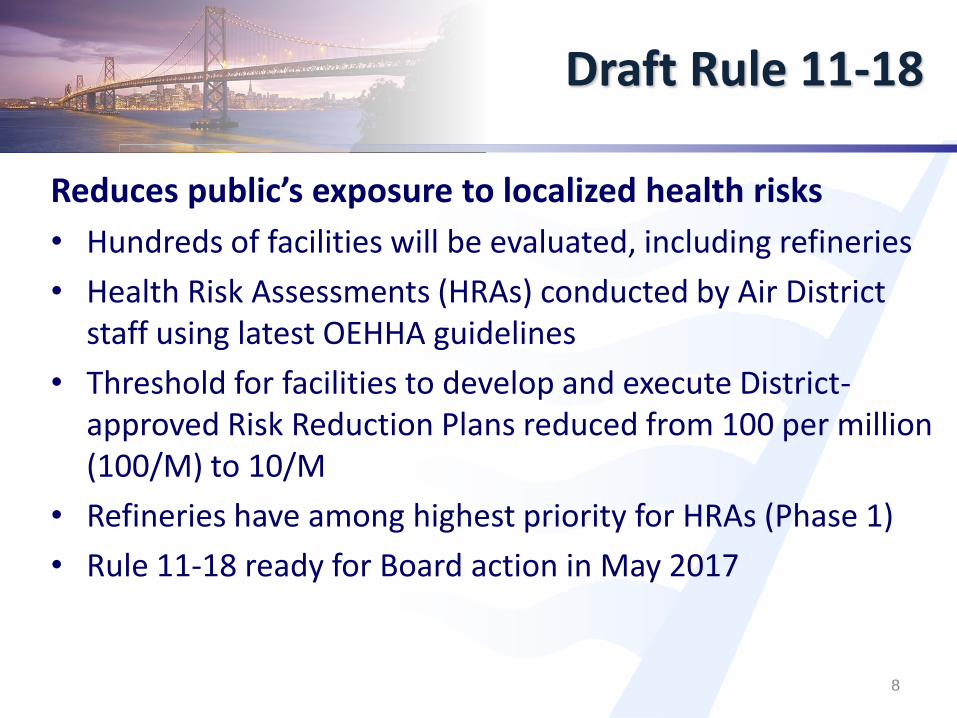
Draft Rule 11-18
Reduces public’s exposure to localized health risks
• Hundreds of facilities will be evaluated, including refineries
• Health Risk Assessments (HRAs) conducted by Air District staff using latest OEHHA guidelines
• Threshold for facilities to develop and execute District-approved Risk Reduction Plans reduced from 100 per million (100/M) to 10/M
• Refineries have among highest priority for HRAs (Phase 1)
• Rule 11-18 ready for Board action in May 2017
8
Draft Rule 13-1First Rule of Combustion Strategy
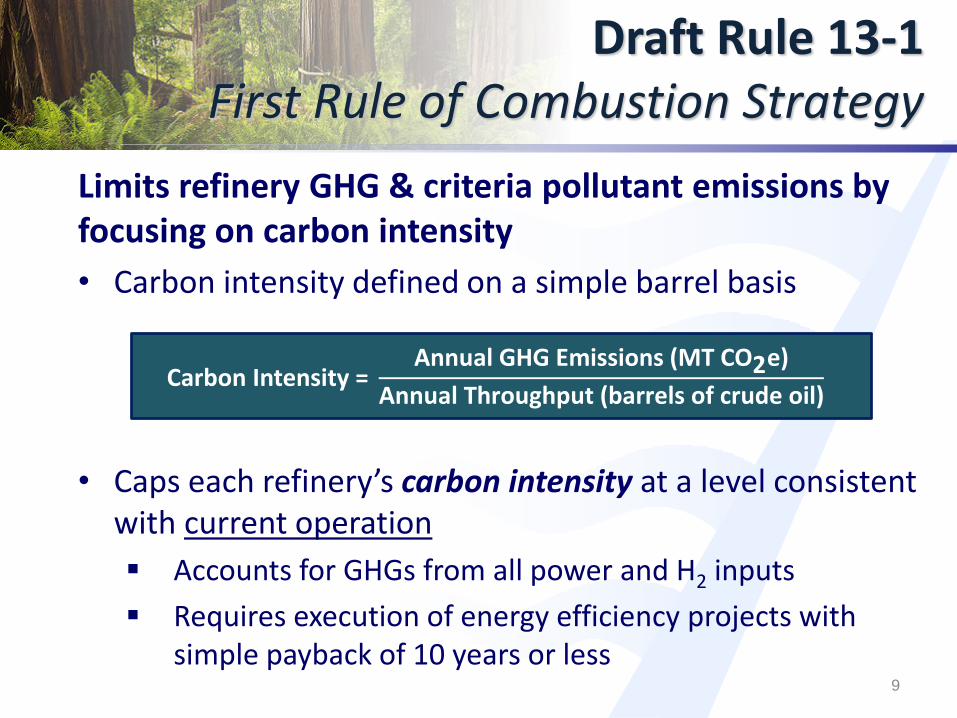
Limits refinery GHG & criteria pollutant emissions by focusing on carbon intensity
• Carbon intensity defined on a simple barrel basis
• Caps each refinery’s carbon intensity at a level consistent with current operation
Accounts for GHGs from all power and H2 inputs
Requires execution of energy efficiency projects with simple payback of 10 years or less
Carbon Intensity =Annual GHG Emissions (MT CO2e)
Annual Throughput (barrels of crude oil)
9
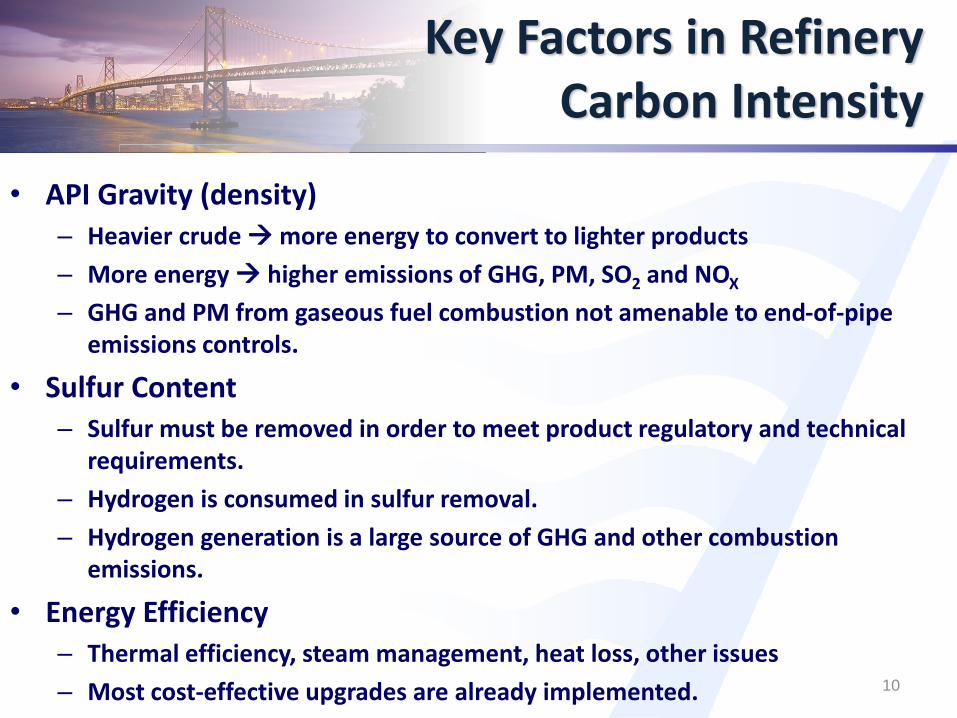
• API Gravity (density)– Heavier crude more energy to convert to lighter products
– More energy higher emissions of GHG, PM, SO2 and NOX
– GHG and PM from gaseous fuel combustion not amenable to end-of-pipe emissions controls.
• Sulfur Content– Sulfur must be removed in order to meet product regulatory and technical
requirements.
– Hydrogen is consumed in sulfur removal.
– Hydrogen generation is a large source of GHG and other combustion emissions.
• Energy Efficiency– Thermal efficiency, steam management, heat loss, other issues
– Most cost-effective upgrades are already implemented.
Key Factors in RefineryCarbon Intensity
10
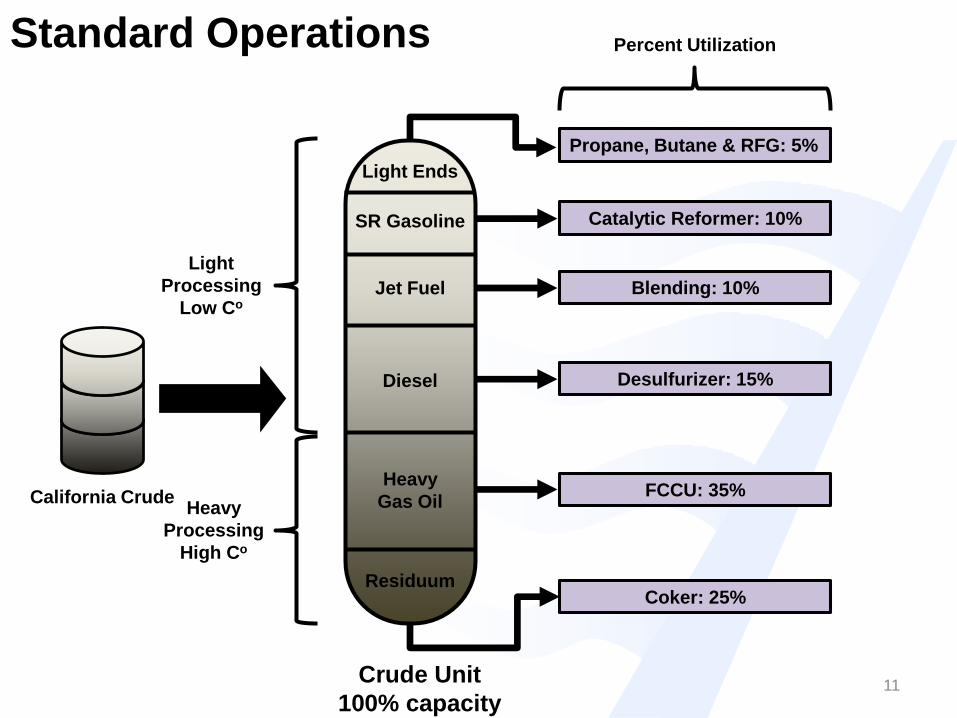
Crude Unit
100% capacity
Light Ends
Jet Fuel
SR Gasoline
Diesel
Heavy
Gas Oil
Residuum
Catalytic Reformer: 10%
Blending: 10%
Desulfurizer: 15%
Coker: 25%
FCCU: 35%
Light
Processing
Low Co
Heavy
Processing
High Co
Standard Operations
California Crude
Propane, Butane & RFG: 5%
Percent Utilization
11
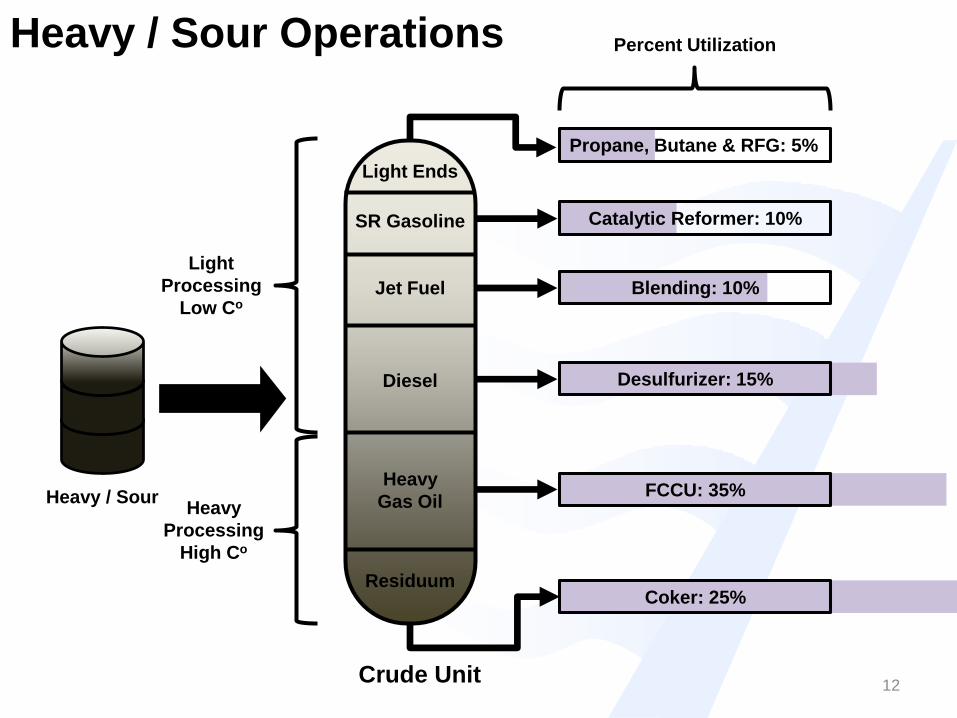
Crude Unit
Light Ends
Jet Fuel
SR Gasoline
Diesel
Heavy
Gas Oil
Residuum
Light
Processing
Low Co
Heavy
Processing
High Co
Heavy / Sour Operations
Heavy / Sour
Catalytic Reformer: 10%
Blending: 10%
Desulfurizer: 15%
Coker: 25%
FCCU: 35%
Propane, Butane & RFG: 5%
Percent Utilization
12
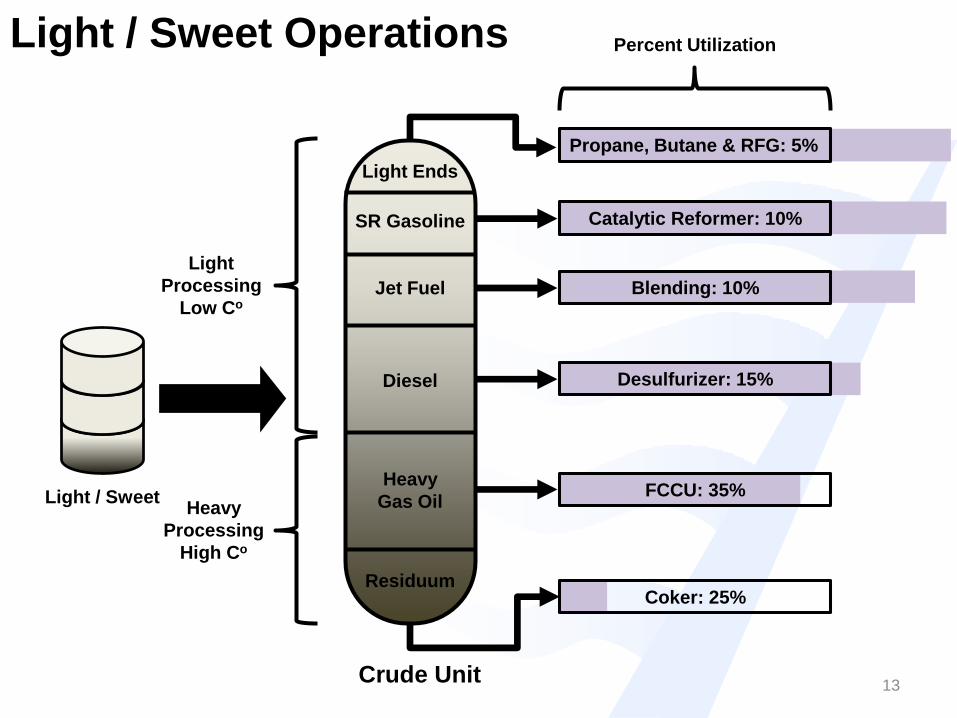
Crude Unit
Light Ends
Jet Fuel
SR Gasoline
Diesel
Heavy
Gas Oil
Residuum
Light
Processing
Low Co
Heavy
Processing
High Co
Light / Sweet Operations
Light / Sweet
Catalytic Reformer: 10%
Blending: 10%
Desulfurizer: 15%
Coker: 25%
FCCU: 35%
Propane, Butane & RFG: 5%
Percent Utilization
13
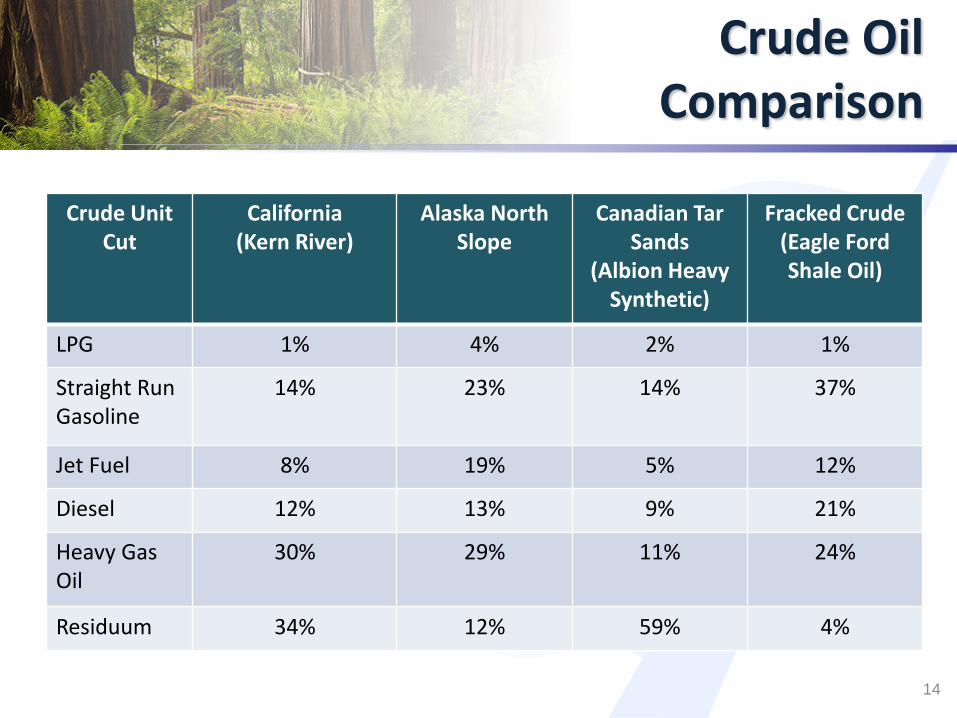
Crude OilComparison
Crude Unit Cut
California(Kern River)
Alaska North Slope
Canadian Tar Sands
(Albion Heavy Synthetic)
Fracked Crude(Eagle Ford Shale Oil)
LPG 1% 4% 2% 1%
Straight Run Gasoline
14% 23% 14% 37%
Jet Fuel 8% 19% 5% 12%
Diesel 12% 13% 9% 21%
Heavy Gas Oil
30% 29% 11% 24%
Residuum 34% 12% 59% 4%
14
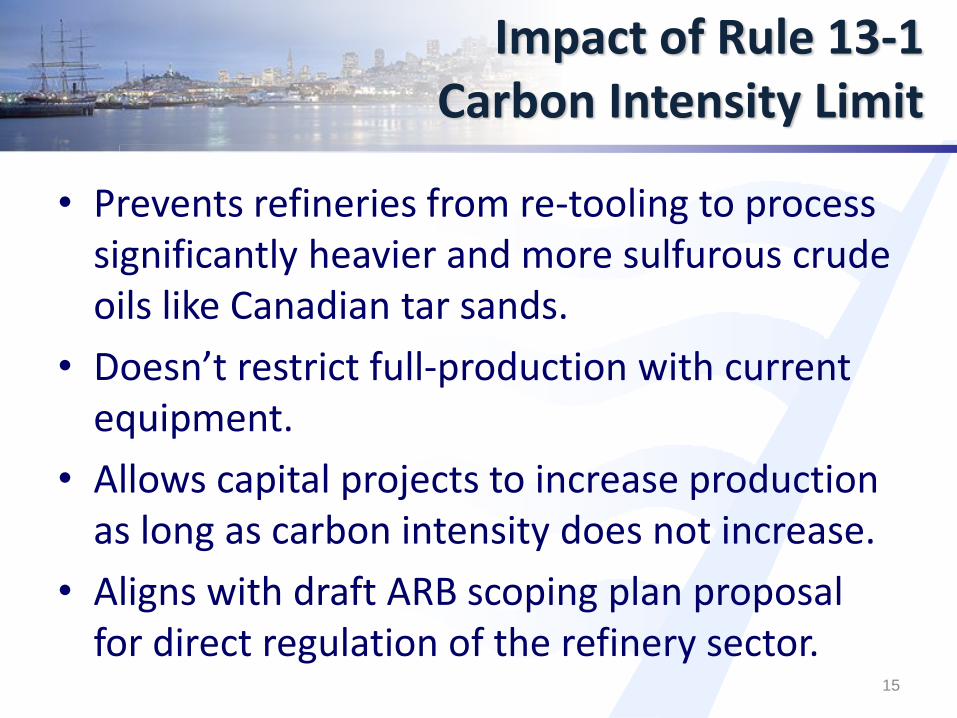
Impact of Rule 13-1Carbon Intensity Limit
15
• Prevents refineries from re-tooling to process significantly heavier and more sulfurous crude oils like Canadian tar sands.
• Doesn’t restrict full-production with current equipment.
• Allows capital projects to increase production as long as carbon intensity does not increase.
• Aligns with draft ARB scoping plan proposal for direct regulation of the refinery sector.
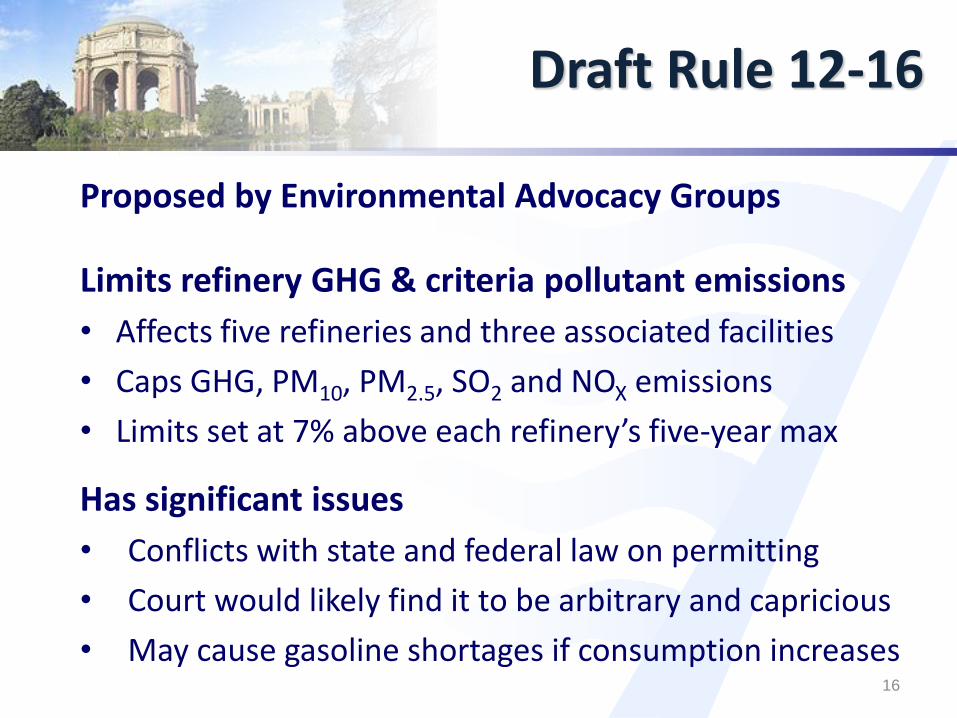
Draft Rule 12-16
Proposed by Environmental Advocacy Groups
Limits refinery GHG & criteria pollutant emissions
• Affects five refineries and three associated facilities
• Caps GHG, PM10, PM2.5, SO2 and NOX emissions
• Limits set at 7% above each refinery’s five-year max
Has significant issues
• Conflicts with state and federal law on permitting
• Court would likely find it to be arbitrary and capricious
• May cause gasoline shortages if consumption increases16
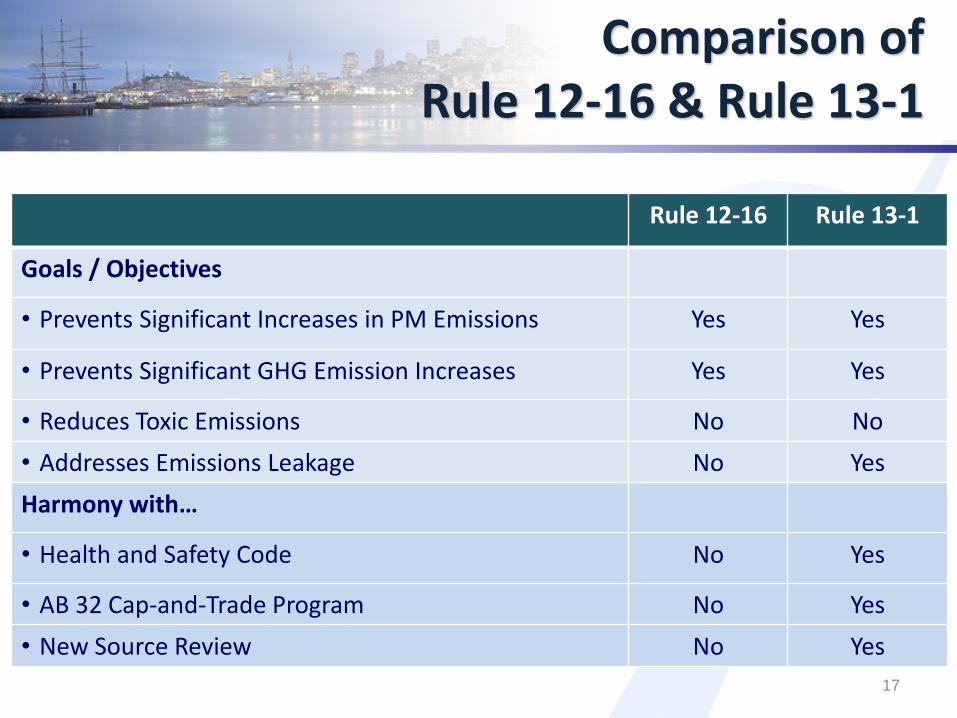
Rule 12-16 Rule 13-1
Goals / Objectives
• Prevents Significant Increases in PM Emissions Yes Yes
• Prevents Significant GHG Emission Increases Yes Yes
• Reduces Toxic Emissions No No
• Addresses Emissions Leakage No Yes
Harmony with…
• Health and Safety Code No Yes
• AB 32 Cap-and-Trade Program No Yes
• New Source Review No Yes
Comparison of Rule 12-16 & Rule 13-1
17
Summary
• Staff believes that draft Rule 13-1 meets the GHG-related goals of draft Rule 12-16, but more analysis and consultation with stakeholders is still required.
• Draft Rule 13-1 will be evaluated as an alternative to draft Rule 12-16 in the EIR for 12-16.
• Analysis of draft Rule 13-1 will not impact the schedule for the analysis of draft Rule 12-16.
18
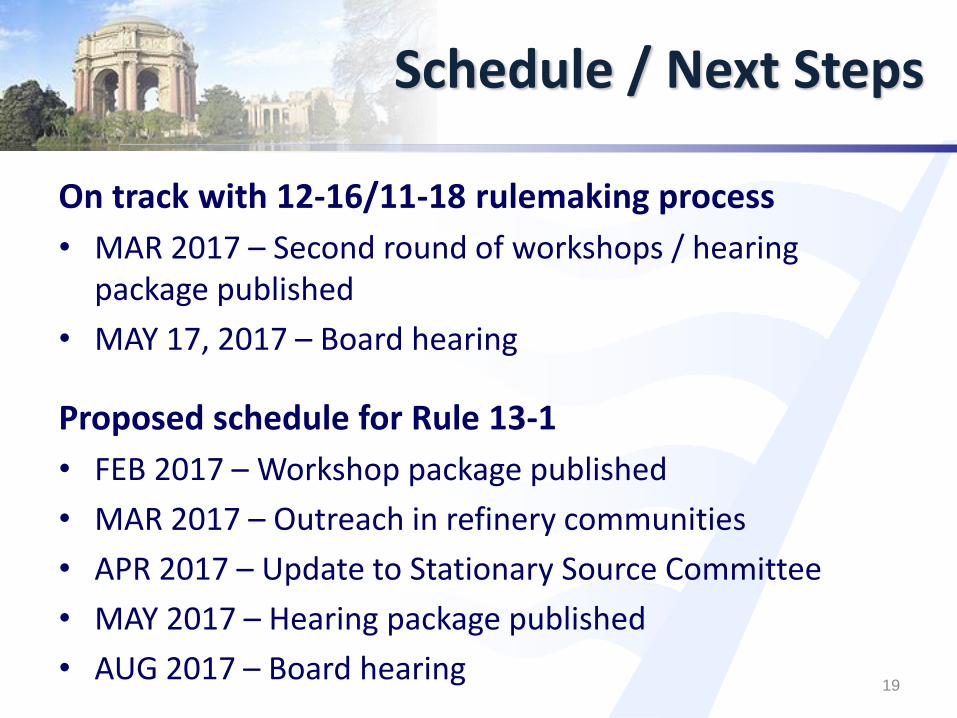
Schedule / Next Steps
On track with 12-16/11-18 rulemaking process
• MAR 2017 – Second round of workshops / hearing package published
• MAY 17, 2017 – Board hearing
Proposed schedule for Rule 13-1
• FEB 2017 – Workshop package published
• MAR 2017 – Outreach in refinery communities
• APR 2017 – Update to Stationary Source Committee
• MAY 2017 – Hearing package published
• AUG 2017 – Board hearing19
Advisory Council Meeting
Henry Hilken
Director of Planning and Climate Protection
February 6, 2017
AGENDA: 7
Advisory Council Deliberation on
the Draft Clean Air Plan/Regional
Climate Protection Strategy
Critical Challenges
2
Climate Change • The greatest common global challenge• The biggest threat to our environment, economy,
health and quality of life
Health Inequities• Equal access to healthy air is a fundamental right that
still eludes many Bay Area residents
This Plan focuses on strategies that will help us meet both of these challenges
What Is This Plan?
3
Multi-pollutant plan to update 2010 Clean Air Plan
A comprehensive strategy of 85 measures to:
• reduce ozone and PM throughout the region
• reduce toxics in impacted communities
• reduce GHGs toward long-range targets 40% below 1990 levels by 2030
80% below 1990 levels by 2050
This Plan lays out a Bold Vision for a future Bay Area with a thriving economy, truly equitable access to healthy air, and a healthy, secure environment
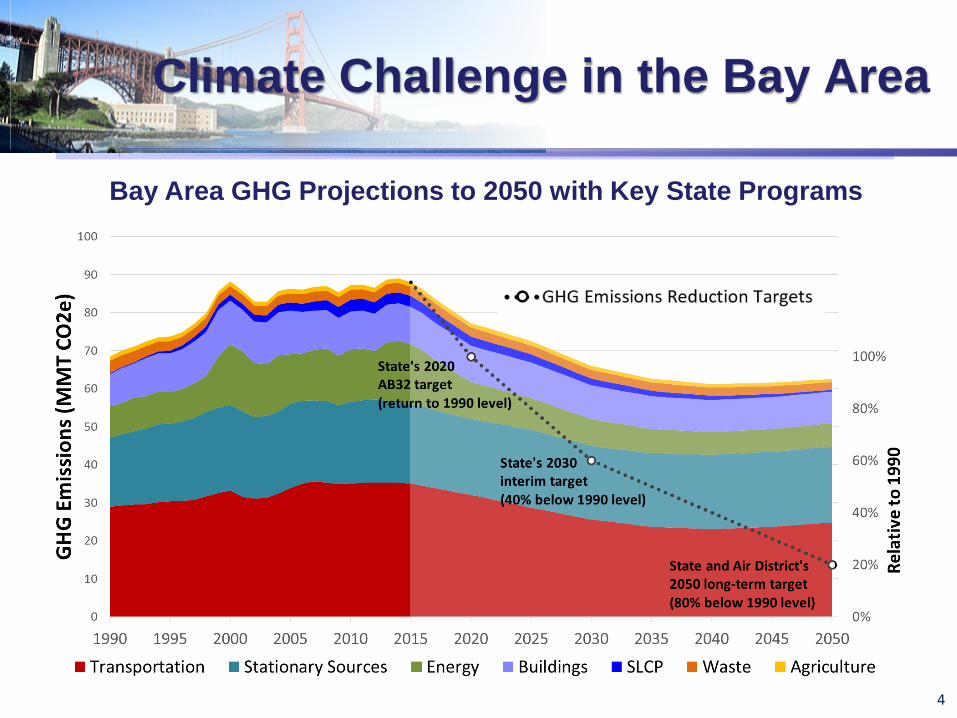
Climate Challenge in the Bay Area
4
Bay Area GHG Projections to 2050 with Key State Programs
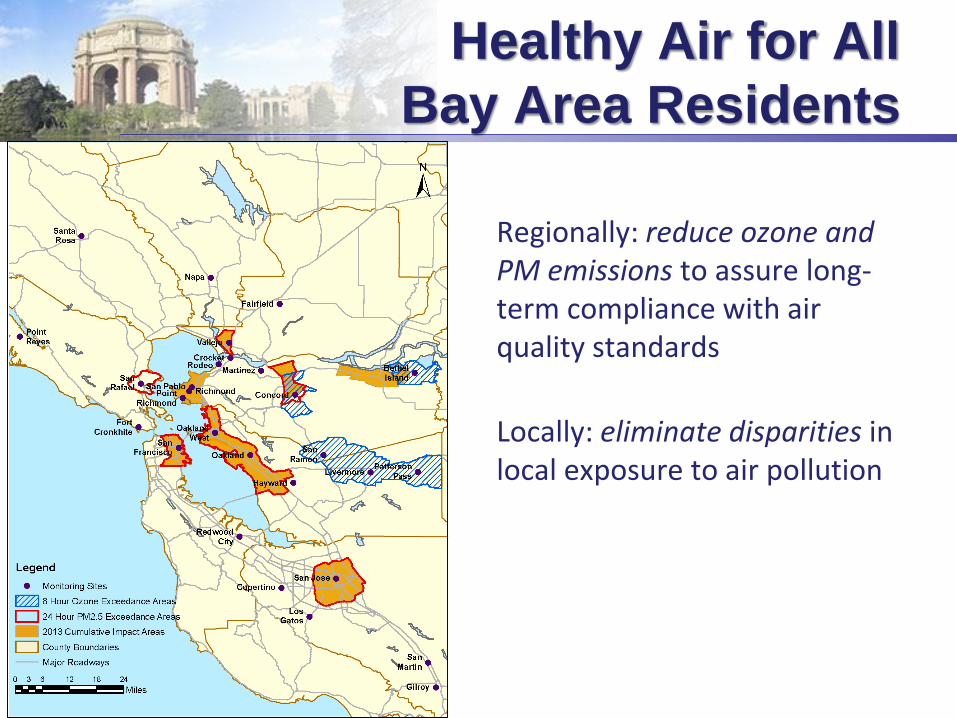
Healthy Air for All
Bay Area Residents
Regionally: reduce ozone and PM emissions to assure long-term compliance with air quality standards
Locally: eliminate disparities in local exposure to air pollution
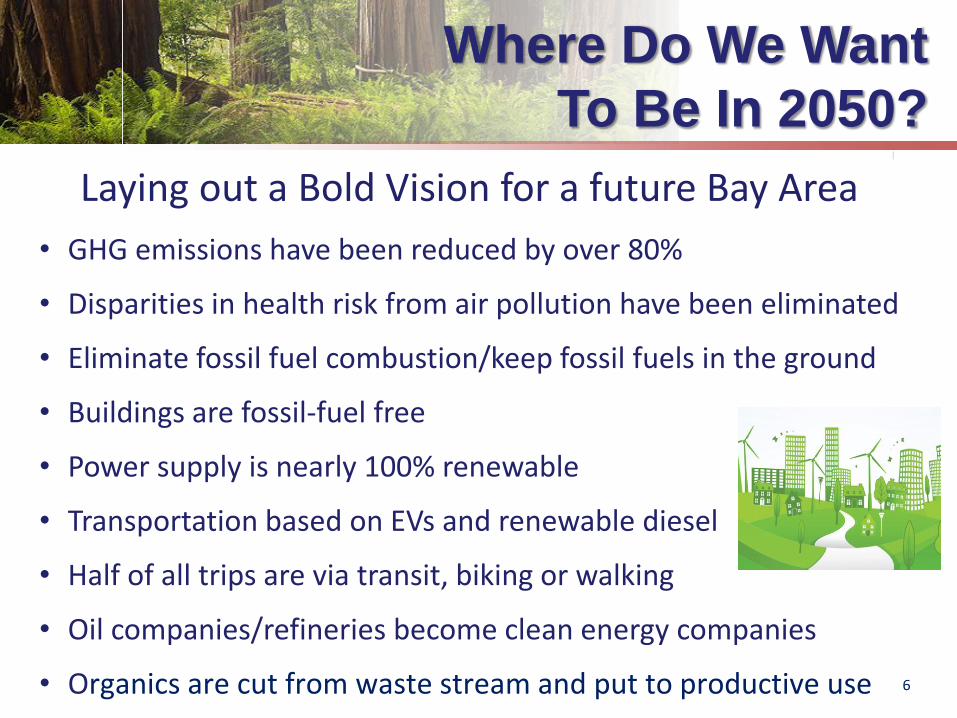
Where Do We Want
To Be In 2050?
6
• GHG emissions have been reduced by over 80%
• Disparities in health risk from air pollution have been eliminated
• Eliminate fossil fuel combustion/keep fossil fuels in the ground
• Buildings are fossil-fuel free
• Power supply is nearly 100% renewable
• Transportation based on EVs and renewable diesel
• Half of all trips are via transit, biking or walking
• Oil companies/refineries become clean energy companies
• Organics are cut from waste stream and put to productive use
Laying out a Bold Vision for a future Bay Area
How Does This Plan Get Us There?
41.3
7.4
7
Key Priorities in the Plan:
• Reduce emissions of criteria pollutants and toxic air contaminants from all sources
• Reduce emissions of “super-GHGs” such as methane
• Reduce fossil fuel combustion
• Improve efficiency/reduce demand for fossil fuels
• Decarbonize the energy system
It sets us on a path to 2050 by laying out specific actions the Air District will take over the next 3-5 years
Priority Actions
8
• Develop region-wide rule-making approach to reduce risk and emissions from many sources comprehensively
- Health risk from toxic air contaminants
- Methane and fossil fuel combustion
• Limit GHG and criteria pollutant emissions from refineries and other large stationary sources
• Provide guidance, model ordinances, best practices and other tools to local governments for low carbon buildings, waste reduction, etc.
• Work with MTC/local governments to reduce VMT
• Implement a comprehensive approach to transition energy use in buildings from natural gas to efficiency and renewable energy
• Continue to incentivize EVs & EV infrastructure
Input Into This Plan
Outreach• Convened stakeholder meetings in each county
• Met with subject matter experts
• Convened external working groups
• Convened open houses and workshops
• Posted draft control measures for public review and comment
• Incorporated Advisory Council recommendations
Research• Researched state, regional and local air quality and climate plans
• Considered Plan Bay Area land-use and transportation strategies
• Considered key State documents and programs
9
9
• Every household, business and individual has tremendous power to make a difference
• We can do this together! The Bay Area has:
- The brightest minds
- A culture of innovation
- The most committed populace
- A blueprint for the first leg of this journey
Bay Area Leadership
7.4
10
We are embarking on an unprecedented journey to lead the Bay Area to a better future
Next Steps
11
• January 11 – March 9: Public comment period on Draft Plan and Draft EIR
• January 30 – February 8: Eight Open Houses
• February – March: Revisions to Draft Plan and Draft EIR per public comments
• April 19: Board Hearing on 2017 Plan and Final EIR
Implementation on many control measures has already begun and
is moving forward concurrently with this plan adoption schedule.
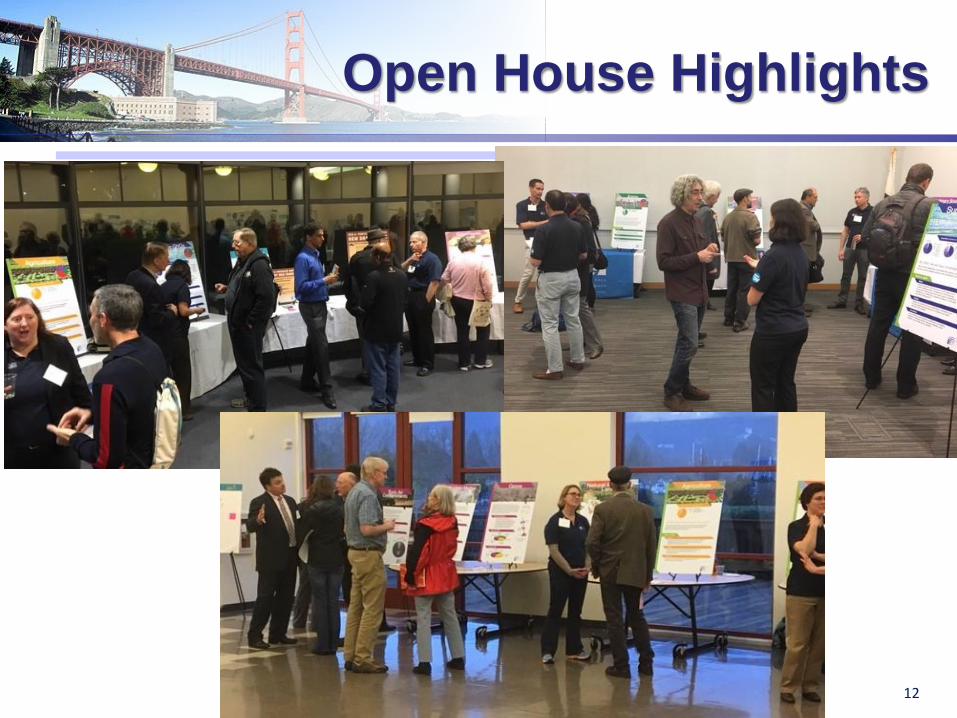
Open House Highlights
12
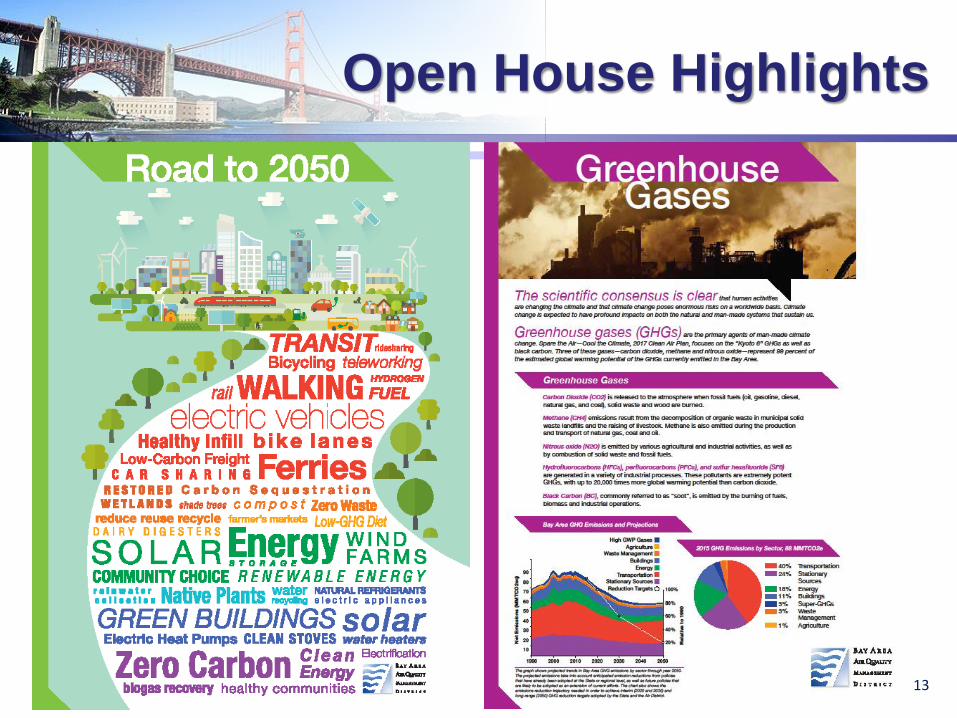
Open House Highlights
13
Open House Highlights
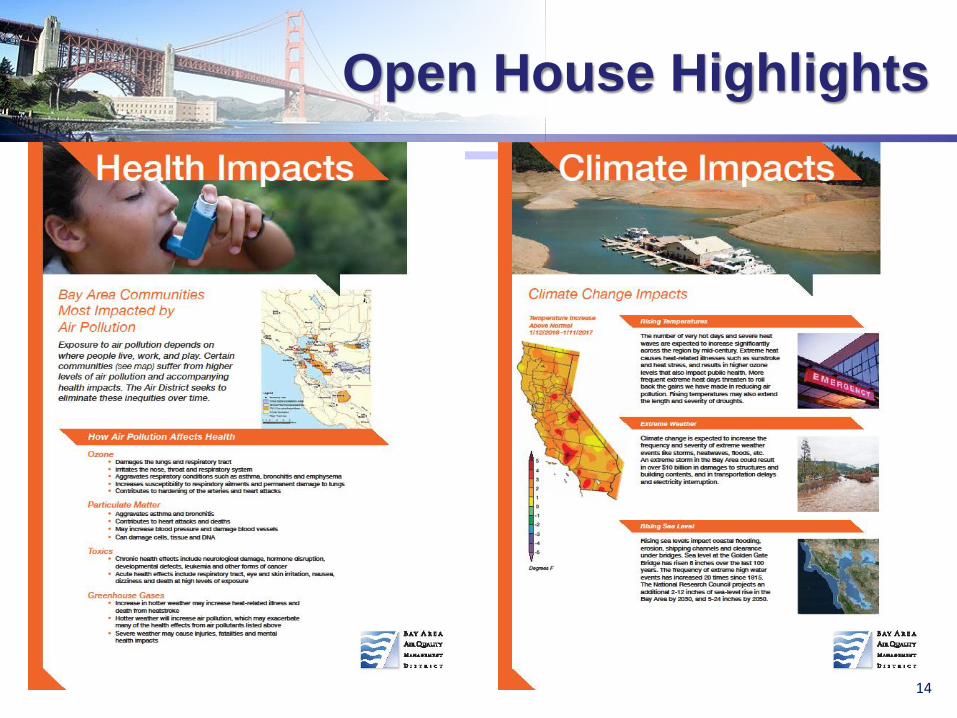
14
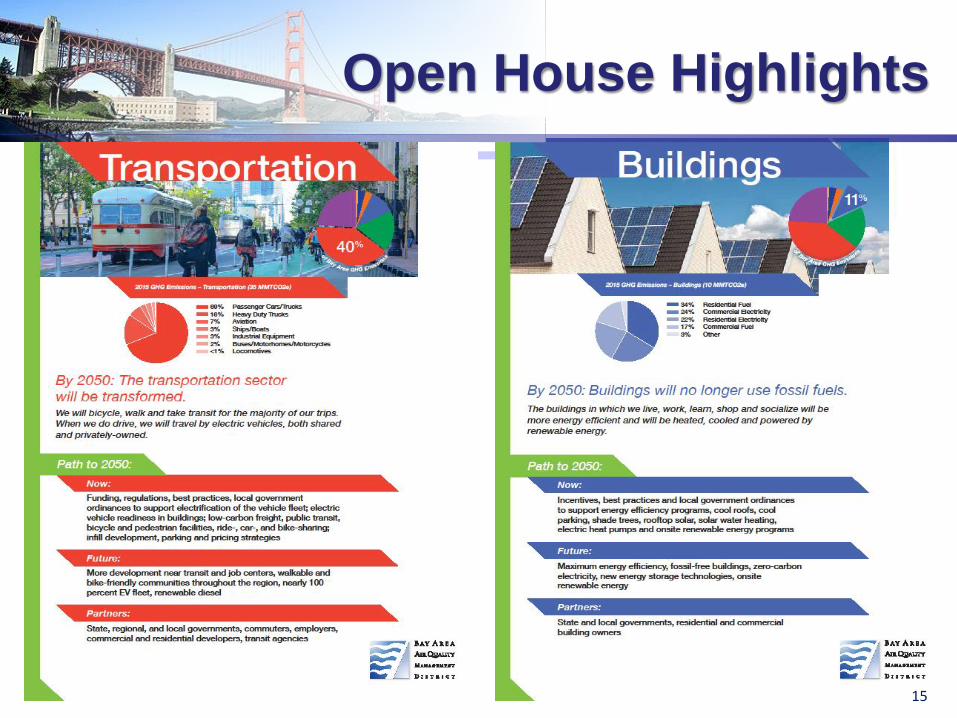
Open House Highlights
15


