An evaluation of trout stream regulations in Wisconsin streams Nancy A. Nate Fishery Analysis Center University of Wisconsin – Stevens Point Stevens Point, Wisconsin Andrew Fayram and Joanna Griffin Wisconsin Department of Natural Resources Bureau of Fisheries Management Madison, Wisconsin November 1, 2010 1
Transcript
An evaluation of trout stream regulations in Wisconsin streams
Nancy A. NateFishery Analysis Center
University of Wisconsin – Stevens PointStevens Point, Wisconsin
Andrew Fayram and Joanna GriffinWisconsin Department of Natural Resources
Bureau of Fisheries ManagementMadison, Wisconsin
November 1, 2010
1
Abstract.– Wisconsin trout stream regulation categories based on a stream classification system have been used in Wisconsin since the early 1990s, but these regulations have not been thoroughly evaluated. We used electro-fishing survey data collected from 2,879 sites on 1,102 Wisconsin trout streams during 1992–2010 to determine if brook and brown trout relative abundance of different length groups differed among streams with different harvest regulations and stream size categories (small, medium, and large). For streams of all sizes, average relative abundance of all brook trout and of brook trout of specific length groups (≥7 in, ≥8 in, ≥9 in) was consistently higher in streams with an 8-inch minimum length limit (MLL) and a 3-fish daily bag limit. In small streams, average relative abundance of brook trout was higher in streams with special regulations than in other small streams with standard regulations. In medium and large streams, relative abundance of brook trout was highest in streams with an 8-inch minimum length limit and 3-fish daily bag limit. For streams of all sizes, average relative abundance of brown trout of all size and size groups (total, ≥7 in, ≥8 in, ≥9 in) was higher in streams with special regulations overall, but when examined by stream size, relative abundance of brown trout of all size and size groups (total, ≥7 in, ≥9 in, ≥12 in) was only higher in medium-sized streams with special regulations. A smaller subset of streams with special regulations were examined in more detail to determine if differences in average relative abundance could be detected among streams with special regulation types such as catch and release, minimum or maximum length limits, and slot limits. Relative abundance of brook trout and brook trout ≥8 and 12 inches did not differ among special regulation types. Stream sites with high minimum length limits and low daily bag limits had higher relative abundance of brook trout ≥10 inches than stream sites with low minimum length limits and high daily bag limits or streams sites with slot-length limits. In contrast, relative total abundance and abundance of brown trout (total, ≥10 in ≥12 in, ≥15 in) differed among several special regulation types. Brown trout total relative abundance was higher in streams with maximum length limits than in streams with low or high minimum length limits. Streams with catch and release and slot length limits had higher densities of large brown trout (≥10 in, ≥12 in, ≥15 in) than streams with low or high minimum length limits. An additional dataset was constructed by integrating records from an older database (~1950-1992) to examine long term time trends in relative abundance of brook and brown trout. An increasing general trend in average relative abundance through time since 1950 suggests that increases in trout population relative abundance since implementation of the regulation category system in 1990 cannot be entirely attributed to the effect of regulation categories. However, in a much reduced dataset that compared the rates of trout CPE increase from 1980-1989 to 1990-2010 suggested that category 3 streams had the greatest rate of increase in total CPE for both brook trout and brown trout. There were no significant differences in the rate of increase of longer brook trout (>8 in, >12 in) or brown trout (>8 in, >12 in, >16 in, >18 in) between any of the regulation categories.
2
IntroductionTrout stream regulation categories based on a stream classification system have
been used in Wisconsin since 1990. The stream classification system was intended to increase diversity of fishing opportunities in Wisconsin trout streams by matching regulations to stream potential based on stream characteristics. This classification was intended to tailor management across a broad spatial landscape to maximize potential for each stream class to increase the size and abundance of trout for anglers interested in harvesting at least some of their catch and to provide more trophy-sized fish for anglers. Prior to 1990, angling on most streams was regulated by statewide regulations that allowed each angler to keep 10 trout over six inches in total length (TL) per day and 5 brown and rainbow trout during May (Claggett 2007). In 1986, a southern zone of counties was established with a 3 fish daily bag limit and a 9 inch minimum length limit (MLL). In 1990, regulation categories included category 1 (10 fish daily bag, no minimum length limit), category 2 (5 daily bag, 7-inch MLL), category 3 (3 fish daily bag, 9-inch minimum length limit), category 4 (3 daily bag, 8-inch MLL for brook trout and a 12-inch MLL for brown trout). Due to drought-related issues, the 1990 regulation category system was not implemented in the southwest and northeast part of the state until 1992. In 2003, regulation categories established in 1990 were simplified and adjusted: category 1 streams were merged into category 2, thereby eliminating regulation category 1, and some special regulation waters were broadened to address fish movement and law enforcement concerns. In 2010, the Wisconsin Department of Natural Resources, Bureau of Fisheries Management began the process of re-evaluating the current regulation categories, the impetus for this evaluation.
The 1990 trout stream regulation classifications were originally developed along a gradient of stream size classes (small, medium, and large) that generally indicated position in the watershed, water quality, and the amount and quality of habitat for trout (Table 1). The classification assumed that trout growth, reproductive success, and natural and fishing mortality varied along a gradient of stream size, so regulations could be tailored accordingly. For example, small streams were in headwaters with limited habitat for large fish, slow growth, poor size structure, high reproduction, low fishing pressure, and showed little effect of fishing pressure (Wisconsin Department of Natural Resources, Bureau of Fisheries Management 1988). For small streams, length limits were removed or were the least restrictive (i.e., smallest minimum length limit). In contrast, large streams were located downstream with abundant habitat for large fish, fast growth, considerable potential for producing large fish (both stocked and self-sustaining populations), and high fishing pressure with increased potential for overharvest of larger fish. Portions of large productive systems were assumed to benefit from special regulations, such as bait restrictions or catch-and-release restrictions, so could be managed for anglers seeking trophy opportunities. Regulation categories 2–3 on small and medium-sized streams were generally designed to increase trout harvest for those who wanted to retain their catch, whereas regulation categories 4–5 on medium-large sized streams were generally designed to increase catch rates and size of fish caught (Claggett 2007). Assignment of streams and stream segments to trout regulation classes by individual fishery managers was based on expertise and knowledge of specific streams in their management area using general
3
guidelines (Table 1), though guidelines such as stream size, and trout growth were not quantified. Interpretation and application of criteria likely varied among managers, and not all streams conformed perfectly to defined criteria in Table 1. Further, social and political desire for simplicity, ease of understanding, and ease of enforcement influenced regulation assignment locally and regionally (e.g., use of county-based regulations, rather than using criteria in Table 1). If trout populations respond to regulations differentially according to the criteria in Table 1, then understanding the degree of adherence to the criteria is the first step in evaluating differences in biological responses among streams with different regulations.
Angling regulations on category 5 streams were tailored to individual waters and included a variety of regulation types and combinations such as slot-length limits, gear restrictions, season restrictions, minimum and maximum length limits, and catch and release. Prior to 1990, catch-and-release regulations applied to portions of 11 streams totaling 33.5 miles of the state’s 9,560 miles of trout streams (Claggett 2007). In 1990, the number was increased to 91 streams and 280 miles (~3 % of the state total), with some adjustment of special regulations in 2003.
Analyses that seek to quantify effects of regulations are often confounded by numerous factors. Fish populations vary from natural fluctuations in environmental conditions (e.g., drought, flooding) that can affect reproduction, growth, and survival. Human actions such as land management, habitat manipulation, and stocking also affect trout populations. Natural variation in fish populations masks the ability to detect patterns caused by specific management actions. The 1990 regulation category system in Wisconsin was not established to enable evaluation of regulation categories. A lack of experimental controls prohibits comparisons of ecologically similar streams with no regulation. Further, changes in trout population characteristics during one period may indicate general improvement or decline in trout populations overall. For example, improvement in land management along stream channels and in-stream habitat improvements in recent years could cause trout abundance to increase independently from changes caused by regulation changes. Therefore, analysis of the effects of regulations should include a retrospective analysis of earlier periods across many streams. Analyses that include large numbers of streams across large spatial and temporal scales may enable detection of patterns despite changes caused by environmental variation among streams and years. For example, higher catch rates of larger trout on streams with regulation categories 4 and 5 would be expected in general across the state if these regulation categories were applied with the goal of increasing numbers of large fish. If some streams in some parts of the state were influenced by flood events in a particular year, the averages from these streams should not influence an overall pattern when average across many streams in different years. The effect of the flood on a few is essentially a random event in terms of the entire dataset. Robust patterns identified across large spatial and temporal scales in spite of random variation can facilitate management decisions about future changes in regulations.
The objectives of this evaluation were to: (1) assess the degree to which stream size or geographic region determined the assignment of regulation categories across Wisconsin (i.e., how often were the criteria in Table 1 used for assigning regulations to streams), (2) determine if mean relative abundance of brook and brown trout differed
4
among streams with different regulation categories; (3) determine if mean relative abundance of brook and brown trout differed among streams of different size with different regulation categories; (4) determine if mean relative abundance of brook and brown trout differed among streams with different special regulations; (5) determine if temporal trends in statewide annual average relative abundance of brook and brown trout were apparent prior to 1990 when regulation categories were first implemented; and 6) determine if site-specific brook and brown trout abundance differed during a predefined pre-regulation and post-regulation time period.
MethodsData
Brook and brown trout survey data were obtained from electro-fishing surveys conducted on inland trout streams in Wisconsin by the Wisconsin Department of Natural Resources (WDNR). Electro-fishing surveys associated with WDNR programs such as Baseline Monitoring and Comprehensive Surveys, and special project evaluations were included in the dataset. Data were extracted from the Wisconsin Department of Natural Resources, Fisheries Management Database (FMDB) in June 2010. In the database, a unique survey was defined as a sampling event at a single location (stream segment) on one or more days. Surveys were included in the dataset if (1) brook or brown trout were captured in the sample, (2) the “Survey Status” indicated data entry was complete and proofed, (3) the survey was conducted on a wade-able stream or non-wade-able stream, (4) the survey sampling station length was ≥20 meters, (5) the sampling distance was not missing or in error, (6) sampling gear types were backpack shocker, stream shocker, or mini-boom shocker, and (7) the survey was conducted during summer (June 15–Sept 15) 1992–2010.
If a particular sampling location (site) was sampled in more than one year, only the most recent survey was used. Sampling locations were generally not selected at random, but were distributed across the state on a variety of stream types. Multiple sampling locations on the same stream were assumed to be independent. In cases where survey effort for a single day of sampling was entered into the database in more than one piece (i.e., multiple sampling “visits” on a single sample date for any one “survey” at a particular site), sampling details were evaluated and effort was merged (e.g. distances sampled were summed) into a single row of data. In addition, if a defined “survey” in a given year included multiple sample dates, as is often the case when conducting mark-recapture surveys, the earliest sample date was included in the final dataset and any subsequent sample dates (e.g., recapture dates) were excluded. This additional screening resulted in one row of sampling effort per survey on any stream site.
Adherence to Criteria in Table 1 (Objective 1)
All sampling locations in the FMDB were geo-referenced to enable Geographical Information Systems (GIS) spatial joins of information associated with sampling location but not currently stored in the FMDB such as trout angling regulation category, trout class (I, II, III), and stream order. Stream order was used to develop three stream size classes to describe the amount of habitat volume generally available for trout, specifically for trout of a particular size, and to match stream size criteria used in
5
assigning regulations (Table 1). Stream orders explained differences in mean stream width (Nate in preparation) and were available for more streams (87%) than mean stream width measurements (54%). Stream order also indicates position in the watershed, one of the original criteria for assigning trout regulations to streams (Table 1). Stream orders 1 and 2 were classified as “small” streams, 3 and 4 as “medium” streams, and 5 and 6 as “large” streams. Stream size categories also separated different electro-fishing gear types of differing catchability, with back-pack shockers used most often on small streams, towed-barge shockers on medium-sized streams, and mini-boom shockers on large streams (Nate in preparation). Trout classes described the contribution of natural reproduction and stocking to population maintenance. Class I trout streams (~40% of trout streams) tended to be small headwater streams with naturally reproduction and slow growth. Class II trout streams (~45% of trout streams) required some stocking, and had good survival of adult fish and potential to produce large fish. Class III streams (~15% of trout streams) had marginal habitat, no natural reproduction, and no carryover of stocked fish from one year to the next.
Relative Abundance by Regulation Category and Stream Size (Objectives 2 & 3)
Relative abundance was estimated as the number of fish caught per mile of electro-fishing in streams of all sizes first, then separately for small, medium, and large streams. For each survey, total catch and numbers of fish > length groups 7, 8, and 9 for brook trout and 7, 9, and 12 for brown trout were divided by stream miles sampled (catch per effort CPE). The length groups correspond to minimum length limits used in standard regulation categories 2, 3, and 4. The geometric mean was estimated from the natural logarithm of catch per mile (+1) and then back-transformed for all data summaries. Analysis of variance (ANOVA) was used to test for differences in mean relative abundance of brook and brown trout among regulation categories. Significance of the overall test (P < 0.05) indicated that at least one regulation category differed from another, but did not indicate which regulation category or categories differed. Therefore, Tukey multiple-comparison tests were used to identify differences among specific regulation categories (Neter et al. 1996). Analyses were conducted for brook and brown trout mean relative abundance by regulation category for the entire state and then separately by stream size categories (Objective 3). Stream size category was initially included in a two-factor ANOVA (regulation category and stream size as factors explaining differences in relative abundance), but interaction terms were significant for more than half of all relative abundance by length group metrics tested. Therefore, for simplification tests were run separately for stream size category, rather than including stream size in the ANOVA. Special regulation categories (see below) were tested in a similar manner.
Special Regulations (Objective 4)
The GIS overlay identified whether a previously sampled stream segment had a special regulation (Category 5), but did not identify the special regulation in place at that location. Therefore, special regulations for stream segments were obtained by examining descriptions in the 2009–2010 Trout Regulations Guide listing all category 5 streams by county with specific regulations, matching county and stream names to the Waterbody Identification Code (WBIC), and then linking WBIC to survey information
6
created for objectives 2, 3 and 5. Because linkage of specific regulations was not based on site-specific geographic coordinates, the dataset for this objective did not include streams with different category 5 regulations on different segments (e.g., the Namekagon River). Regulations on urban waters and streams that drained into the Great Lakes were also excluded. Because the number of unique special regulations was large, general groups of regulations were created to contrast streams with: 1) catch and release (CR), 2) high minimum length limits and low daily bag limits (HmLb), 3) high minimum length limits and high daily bag limits (HmHb), 4) low minimum length limits and high daily bag limits (LmHb), 5) slot length limits (slot), and 6) maximum size limits (max). For brook trout, a high MLL was defined as ≥ 10 inches, a low MLLwas defined as ≤ 9, a high daily bag limit was defined as ≥ 3, and a low daily bag limit was defined as ≤ 2. For brown trout, a high MLL was defined as ≥ 12 inches, a low MLL was defined as ≤ 9, a high daily bag limit was defined as ≥ 3, and a low daily bag limit was defined as ≤ 2. Relative abundance was estimated as the number of fish captured per mile of electro-fishing. For each survey, total catch and numbers of fish > length groups were tabulated for brook trout 8, 10, and 12 inches and brown trout 10, 12, 15 inches. The geometric mean was estimated from the natural logarithm of catch per mile (+1) and then back-transformed for all data summaries. Analysis of variance (ANOVA) was used to test for any differences in mean relative abundance of brook and brown trout among regulation categories. Tukey multiple-comparison tests were used to identify differences among specific regulation categories.
Temporal Trends (Objectives 5 & 6)
To examine trends in trout relative abundance from different periods, additional data were extracted from an older database that included sampling records from a large part of the state, including parts of the Northern, Northeast, and South Central regions during 1950–1992. At the time of data export, sites (stream segments) in the older database records were not geo-referenced in the same way as records from the new database, and many older records did not have adequate descriptions of sampling site location. Therefore, a site-specific analysis was not possible. Stream name and unique number (WBIC) were known. If multiple sites were sampled on one stream in a given year, relative abundance for the stream was described as the average CPE among sites. Annual estimates of relative abundance for individual streams were average for each year to derive a mean annual CPE for all streams. Distance sampled was required to estimate relative abundance, but was missing for many older stream sampling records, thereby preventing their inclusion. Relative abundance estimates from the new FMDB were summarized in a similar manner. Time trends for years prior to 2002 include data from all DNR regions except the Southeast region. Yearly averages were calculated using all available data, and were further screened to include survey information from streams that were sampled in four or more decades. This methodology ensured that the same streams were generally represented through time, to remove potential bias associated with changes in site selection criteria over time (e.g., if older surveys were conducted on only the better streams and newer surveys were conducted on randomly selected streams).
To examine time trends in more detail, we identified a smaller subset of older surveys from 1980-1989 (pre) that could be matched to the specific sampling site on 11
7
brook trout and 10 brown trout streams. We considered data collected during the time period 1980-1989 to represent the pre-regulation time period and data collected from 1990-2010 to be the post-regulation time period. In the absence of reference or control streams with no regulation, we wanted to determine if increases or decreases in CPE of various length categories of trout (brook trout: total, 8+inches, and 12+inches, brown trout, total, 8+inches, 12+inches, 16+inches, and 18+inches) differed by regulation category on 18 brook trout sites and 22 brown trout sites with data from pre and post time periods.
ResultsThe dataset consisted of survey information from 2,879 sites on 1,102 streams
where brook or brown trout were present during summer 1992–2010. Brook trout were present at 2,136 sites on 898 streams and brown trout were present at 1,644 sites on 574 streams (Figure 1). Of these, both brook and brown trout were present at 901 sites on 353 streams. The criteria used to assign regulations to streams (in some cases) included information on recruitment source (stocked or natural). About 80% of brook trout streams had not been stocked, whereas only 60% of brown trout streams had not been stocked within 5 years of the survey. The amount of survey information available in the FMDB increased through time with the majority coming from the most recent decade when the FMDB was available for use starting in 2001 (Figure 2). Most sampling information was from the West Central region (40%), followed by the Northern region (27%), South Central region (18%), North East region (12%) and the South East region (3%). Assuming data in the database reflected the distribution of trout stream resources in the state, brook trout streams were most prevalent in the West Central region (43%), followed by the Northern region (34%), whereas brown trout streams were more prevalent in the West Central region (38%), followed by the South Central regions (28%).
Regulation categories were assigned for 97% of all sites (2,806 of 2,879). The most prevalent regulation categories by region were Category 2 in the Northeast and Northern regions, Category 3 in the South Central and Southeastern regions, and Category 4 in the West Central region (Table 2; Figure 3). Special regulations (Category 5) were most prevalent in the Northern region (149 sites), followed by the West Central (136 sites), South Central (117 sites), South East (22 sites) and North East (21) regions. However, within regions, the South East region had the highest percentage of category 5 regulations (22 of 90 total sites; 24%), followed by the Northern region (149 of 994 sites; 15%). Regulation category 5 included 36 unique combinations of gear restrictions, length limits, bag limits, and seasons (Table 3).
Objective 1 – Adherence to Criteria in Table 1
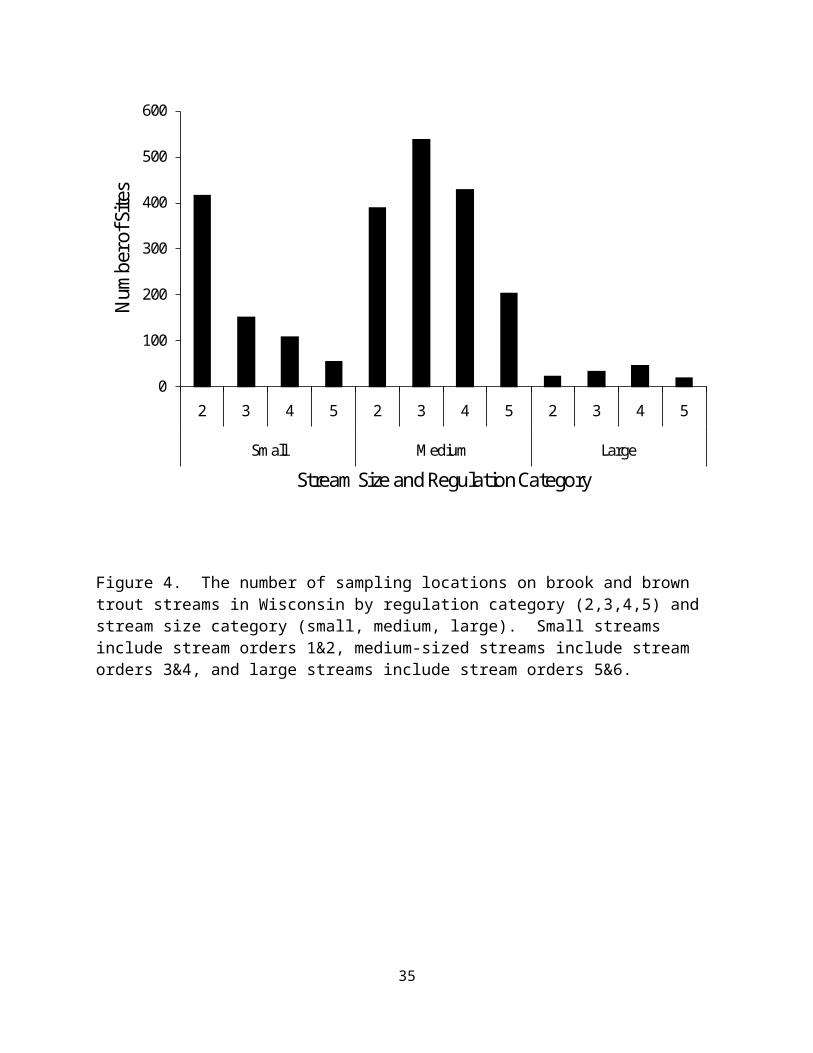
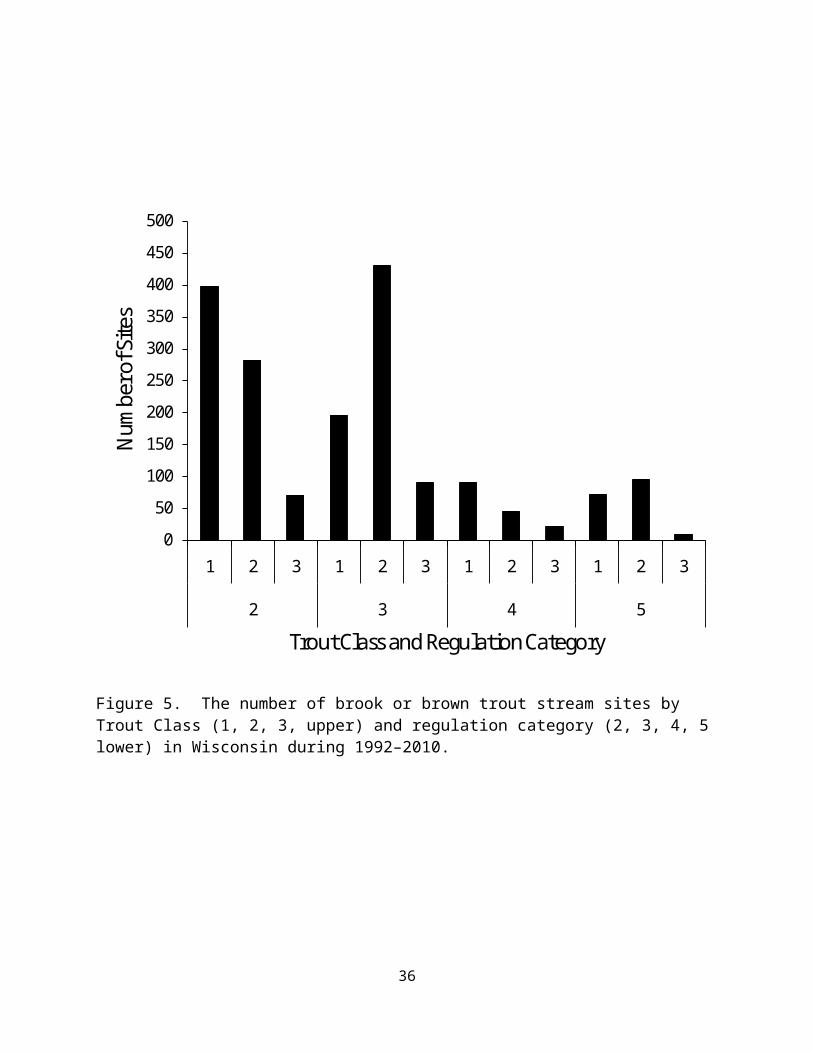
As expected, regulation categories were not assigned to streams based solely on the criteria in Table 1, which enabled comparisons of relative abundance among regulation categories within stream size classes (i.e., all regulation categories were present in all stream size classes). Small streams were more likely to have regulation category 2 (54%), medium-sized streams were more likely to have regulation category 3 (34%), and large streams were more likely to have regulation category 4 (37%; Figure 4). All regulation categories were present in all Trout Classes (Figure 5), so recruitment
8
source was not necessarily controlled for in the assignment of regulation to stream. Most regulation category 2 streams were also Trout Class 1 (53%), followed by Trout Class 2 (38%) and Trout Class 3 (9%). Special regulations (category 5) were more common in Trout Class 2 (54%) and Trout Class 1 (41%) streams than in Trout Class 3 streams (5%).
Objective 2 – Relative Abundance by Regulation Category
Mean relative abundance of brook trout of all size and size groups (≥7 in, ≥8 in, ≥9 in) was consistently higher in streams with an 8-inch MLL and 3-fish daily bag limit (Category 4) than in streams with other regulations (Table 4; Figure 6). Streams with the least restrictive regulation (Category 2) had the fewest large (≥8 and ≥9) brook trout. Relative abundance of large brook trout (≥ 7, ≥ 8, ≥ 9) did not differ among streams with the most restrictive regulations (9-inch MLL and 3 daily bag) and special regulations (Categories 3 and 5; Table 5; Figure 7).
Mean relative abundance of brown trout of all sizes (total) and size groups (≥7 in, ≥8 in, ≥9 in) was consistently higher in streams with special regulations than in streams with other regulations (Figure 7). Relative abundance of brown trout of all sizes (total CPE) did not differ among regulation categories 2, 3, and 4 (Table 5; Figure 8) and ranged 9–130 brown trout per mile (Table 4). Large brown trout (≥9 and ≥12) were least abundant in streams with the least restrictive regulation (category 2 streams). Relative abundance of large fish (≥9 and ≥12) did not differ among streams with all other regulations (categories 3, 4, and 5; Table 5) and ranged 23–34 brown trout ≥9 inches and 8–10 brown trout ≥12 inches per mile (Table 4; Figure 7).
Objective 3 – Relative Abundance by Regulation Category and Stream Size
Accounting for the effect of stream size revealed different patterns in brook trout relative abundance. Brook trout relative abundance for all sizes of trout (total) was generally highest in small streams (219 brook trout/mile), except for category 4 streams where the mean total CPE in medium-sized streams was slightly higher than the mean total CPE in small streams (277 brook trout/mile versus 251 brook trout/mile; Table 4). Total relative abundance was significantly lower in small category 3 streams than in small streams with other regulation categories (Table 6). The relative abundance of brook trout ≥7 inches in small streams did not differ significantly among streams with different regulation categories. In medium-sized streams, relative abundance of all size groups (total, ≥7, ≥8, ≥9) was significantly higher in category 4 streams than in streams with other regulations, whereas streams with regulation categories 2, 3, and 5 did not differ for any brook trout sizes (Table 7). In large streams, brook trout relative abundance was significantly higher in category 4 streams than in category 2 streams (Table 8). Category 2 streams had significantly fewer large brook trout (≥8 and ≥9) in small, medium, and large streams, whereas category 4 streams had significantly more large brook trout only in medium and large streams (Table 4). Relative abundance of brook trout ≥9 inches ranged 1–4 fish per mile in small streams, 5–12 fish per mile in medium-sized streams, and 2–9 fish per mile in large streams (Table 4). When comparing brook trout abundance in streams with the 8-inch MLL, 9-inch MLL, and special regulations, relative abundance of brook trout ≥9 inches was not higher in small,
9
medium, or large category 3 streams (9-inch MLL, 3 daily bag limit), whereas relative abundance of brook trout ≥8 inches was higher in category 4 (8-inch MLL, 3 fish daily bag limit) streams of all size.
Relative abundance of brown trout of all sizes and for brown trout ≥7 inches did not differ significantly in small streams with different regulations. Relative abundance of brown trout ≥9 inches was higher in small category 3 streams (9-inch minimum length limit, 3 daily bag), than in small category 2 streams (7-inch minimum length limit, 3 daily bag limit), and relative abundance of brown trout ≥12 inches was higher in small category 3 streams than in small streams with special regulations (Table 6). Brown trout relative abundance differed significantly among regulation categories in medium-sized streams. Medium-sized streams with special regulations had significantly higher densities of brown trout of all sizes (total, ≥7 in, ≥9 in, ≥12 in) than streams with regulation categories 2 and 4 (Table 7). Relative abundance of brown trout ≥9 inches was higher in medium-sized streams with regulation category 3 (9-inch minimum length limit, 3 daily bag) and in streams with special regulations than in streams with categories 2 and 4. Relative abundance of brown trout ≥12 inches was lower in medium-sized category 2 streams than all other streams. Relative abundance of brown trout ≥12 inches was lower in medium-sized category 4 streams (12-inch minimum length limit, 3 daily bag) than in streams with special regulations. Brown trout relative abundance in large streams was highly variable and did not differ significantly among streams with different regulation categories for fish ≥7 and ≥9 inches (Table 8). Relative abundance of brown trout of all sizes (total CPE) and of brown trout ≥12 inches was lower in large category 3 streams than in large category 4 streams (Table 8).
Objective 4 – Special Regulations
The dataset included 326 sampling sites on 146 streams with special regulations (~11% of the dataset). However, because information on specific regulations was not based on site-specific geographic coordinates, special regulations were only clearly identified for 97 sites on 40 brook trout streams and 124 sites on 48 brown trout streams (221 total sites on 88 streams or 8% of the dataset). The most common special regulation type was the high MLL and low daily bag limit that included 33 sites on 11 brook trout streams (Table 9) and 35 sites on 17 brown trout streams (Table 10). High MLL and high daily bag limits did not exist on brook trout streams and only occurred on 2 brown trout sites on the Mecan River.
Relative abundance of brook trout did not generally differ among special regulation types. Mean relative abundance for all brook trout captured (total CPE), and brook trout ≥8 and ≥12 inches did not differ significantly among special regulation types (Table 11). For brook trout ≥10 inches, stream sites with high minimum length limits and low daily bag limits (HmLb) had higher relative abundance than stream sites with low minimum length limits and high daily bag limits (LmHb) or streams sites with slot-length limits (Table 11; Figure 9). Mean relative abundance of brook trout ≥10 inches was higher in streams with high minimum length limits and a low daily bag limit (HmLb) than in streams with catch and release (CR) or maximum length limits (max), but the difference was not significant (Table 12). Relative abundance ranged 0–7 brook trout per mile (Table 11).
10
Relative abundance of all size classes of brown trout (total, ≥10, ≥12, ≥15) differed significantly among special regulation types. Streams sites with maximum length limits had higher total relative abundance than stream sites with high MLL and low daily bag limits (HmLb) or stream sites with low MLL and high daily bag limits (LmHb; (Table 11; Figure 10). Mean relative abundance of brown trout ≥10 inches was higher in streams sites with catch and release (CR), maximum length limits (max), and slot-length limits (slots) than in streams with low MLL and high daily bag limits (LmHb; Table 12). Mean relative abundance of brown trout ≥10 inches was also higher in streams with maximum length limits than in streams with high MLL and low daily bag limits (HmLb). Mean relative abundance of brown trout ≥12 inches was higher in streams sites with catch and release (CR), maximum length limits (max), and slot-length limits (slots) than in streams with low MLL and high daily bag limits (LmHb; Table 12). Mean relative abundance of brown trout ≥12 inches was also higher in streams with catch and release (CR) and maximum length limits than in streams with high MLL and low daily bag limits (HmLb). Stream sites with catch and release (CR) or slot-length limits (slot) had higher densities of brown trout ≥15 inches than stream sites with low minimum length limits and high daily bag limits (LmHb).
Objective 5 – Temporal Trends
Annual mean CPE of brook trout for all size groups (total CPE) increased during 1950–2010 (Figure 11). The decade of the 1950s had fewer streams available in the dataset with complete distance sampled, and the number of streams sampled increased through time. Brook trout average relative abundance was highly variable among years (R2 range 0.235–0.496), with peaks in 1999 for total relative abundance (868 fish/mile), abundance ≥7 inches (149 fish/mile), abundance ≥8 inches (80 fish/mile), and in 1991 abundance ≥9 inches (50 fish/mile). In general, mean annual CPE declined following peaks, and the declines were similar in magnitude to those observed in earlier time periods (e.g.1954–1964).
Brown trout exhibited a similar pattern of increasing relative abundance through time for all size classes (i.e., total, ≥7, ≥9, ≥12; Figure 12). Brown trout average relative abundance was highly variable among years (R2 range 0.458–0.613), but not as variable as brook trout. Peaks in average relative abundance occurred in 1996 for total relative abundance (973/mile), 1978 for brown trout ≥7 inches (362/mile), 1996 for brown trout ≥9 inches (181/mile), and in 1991 for brown trout ≥12 inches (37/mile). Brown trout did not exhibit the same decline in the most recent decade as brook trout.
Mean annual CPE of brook trout for all size groups in streams that had been sampled in at least four decades also increased during 1950–2010 (Figure 13). Brook trout average relative abundance was highly variable among years (R2 range 0.231–0.384), with peaks in 1997 for total relative abundance (1699/mile), 1991 for brook trout ≥7 inches (237/mile), ≥8 inches (144/mile), and ≥9 inches (96/mile). Periods following peaks exhibited a decline in most metrics, though the decline was of similar magnitude as earlier declines (e.g.1971–1988 for brook trout ≥7 inches).
Brown trout exhibited a less prominent pattern of increasing relative abundance through time in streams that had been sampled in at least four decades for some
11
metrics (e.g., ≥7 in, ≥9 in; Figure 14). Brown trout average relative abundance was highly variable among years (R2 range 0.006–0.111), but less variable than brook trout in streams sampled repeatedly over the period. Peaks in average relative abundance occurred in 1978 for total relative abundance (1812/mile), 1978 for brown trout ≥7 inches (1120/mile), 1978 for brown trout ≥9 inches (514/mile), and 2010 for brown trout ≥12 inches (88/mile). Peaks in years in all brown trout metrics in this limited set of streams appeared to be outliers. Brown trout did not exhibit a decline in total relative abundance or abundance of fish ≥12 inches.
Brook trout and brown trout total relative abundance generally increased over time on specific sampling locations in pre and post regulation time periods. Brook trout relative abundance was significantly higher in Category 3 streams than Category 2 streams, and had the greatest increase in the two time periods, but abundance in Category 3 streams was not significantly different from Category 4 or 5 streams (Table 13). Similarly Category 3 had the greatest increase in brown trout abundance, significantly higher than Category 2 and Category 5, but was not significantly higher than Category 4 (Table 13). CPEs for longer brook trout also increased over time but there was no significant effect of regulation category. Conversely, CPEs for longer brown trout generally decreased over time but there was no significant effect of regulation category.
DiscussionThe 1990 trout stream regulation classifications were originally developed along
a gradient of stream size classes (small, medium, and large) that indicated position in the watershed, water quality, and amount and quality of habitat, as well as indicators of growth potential, size structure, fishing pressure, and recruitment source (stocked or wild). Regulation categories were intended to match stream size, with category 2 prevalent on small-sized to medium-sized streams with self-sustaining populations, category 3 on medium streams with stocked populations, category 4 on large streams with stocked or wild trout, and category 5 on large streams. Streams with categories 3–5 likely experienced high fishing pressure, so the effect of regulations should be more evident in these streams. In general, small-sized streams were assigned regulation category 2 (56%), medium-sized streams were assigned regulation category 3 (34%), and large streams were assigned regulation category 4 (37%). However, all regulation categories were applied in all stream size classes, which may reflect differences in how streams size was defined or deviation in trout population characteristics from general rules described in Table 1 (e.g. county-wide regulations). Stream size categories based on stream order, while more prevalent in the dataset, may not be the best indicators of the amount of habitat space available for trout. For example, mean stream width is more likely to be an indicator of habitat space, but mean stream width measures were less prevalent in the dataset.
Regulation categories were not distributed equally across all regions. Specifically, the Southern and Southeast regions did not have category 2 streams (7-inch MLL, 5 daily bag limits). A lack of this category may indicate an absence of small streams (unlikely), a remnant from the 1986 southern zone regulation (current category 3), a decision that fishing pressure was higher in this part of the state so more restrictive
12
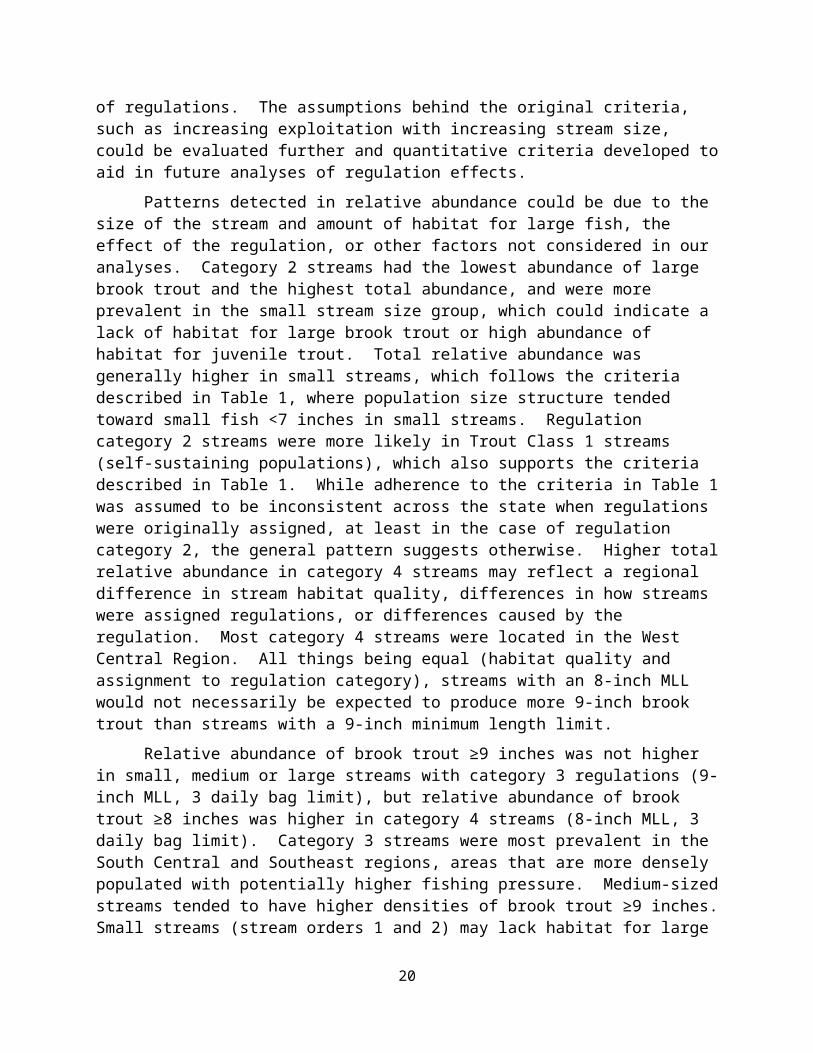
regulations were appropriate, or presence of county-wide regulations. A lack of category 2 streams in the southern part of the state hinders evaluation of regional differences for this regulation category. The overall lack of adherence to a common set of criteria for assigning regulations hinders detection of regulation effects in a post hoc analysis along a range of stream sizes. For example, if trout growth or exploitation varied along a range of stream size, then accounting for the effect of stream size (by only looking at large streams) should reveal a clearer effect of different regulations within a stream size category. The absence of common quantitative definitions for criteria used to assign regulations such as “stream size” and “trout growth” may hinder the detection of regulation effects statewide due to variation in interpretation among biologists. Streams may not conform to broadly defined criteria (Table 1), but such criteria should be applicable to most streams if they are to be used to 1) effectively to tailor regulations to produce a desired outcome, and 2) effectively form the basis for evaluation of the effects of regulations. The assumptions behind the original criteria, such as increasing exploitation with increasing stream size, could be evaluated further and quantitative criteria developed to aid in future analyses of regulation effects.
Patterns detected in relative abundance could be due to the size of the stream and amount of habitat for large fish, the effect of the regulation, or other factors not considered in our analyses. Category 2 streams had the lowest abundance of large brook trout and the highest total abundance, and were more prevalent in the small stream size group, which could indicate a lack of habitat for large brook trout or high abundance of habitat for juvenile trout. Total relative abundance was generally higher in small streams, which follows the criteria described in Table 1, where population size structure tended toward small fish <7 inches in small streams. Regulation category 2 streams were more likely in Trout Class 1 streams (self-sustaining populations), which also supports the criteria described in Table 1. While adherence to the criteria in Table 1 was assumed to be inconsistent across the state when regulations were originally assigned, at least in the case of regulation category 2, the general pattern suggests otherwise. Higher total relative abundance in category 4 streams may reflect a regional difference in stream habitat quality, differences in how streams were assigned regulations, or differences caused by the regulation. Most category 4 streams were located in the West Central Region. All things being equal (habitat quality and assignment to regulation category), streams with an 8-inch MLL would not necessarily be expected to produce more 9-inch brook trout than streams with a 9-inch minimum length limit.
Relative abundance of brook trout ≥9 inches was not higher in small, medium or large streams with category 3 regulations (9-inch MLL, 3 daily bag limit), but relative abundance of brook trout ≥8 inches was higher in category 4 streams (8-inch MLL, 3 daily bag limit). Category 3 streams were most prevalent in the South Central and Southeast regions, areas that are more densely populated with potentially higher fishing pressure. Medium-sized streams tended to have higher densities of brook trout ≥9 inches. Small streams (stream orders 1 and 2) may lack habitat for large brook trout and large streams (stream orders 5 and 6) may be less suitable for brook trout in general due to habitat (e.g., temperature, sedimentation) or fish community limitations
13
(e.g., increased competition and predation as the number of species present generally increases with stream size).
Sample sizes were low for brown trout in small and large streams and mean relative abundance was highly variable, so fewer significant differences were detected among regulation categories. Relative abundance of brown trout ≥12 inches was higher in small category 3 streams (9-inch MLL, 3 daily bag limit) than in small streams with special regulations (category 5). Relative abundance of brown trout ≥12 inches should be highest in streams with category 4 regulations (12-inch minimum length limit, 3 daily bag limit). In small streams, relative abundance of all metrics was highly variable in category 4 streams, so no significant differences were detected.
The special regulations category included a mix of regulation types, each with different intended outcomes. For example, maximum length limits may be applied in streams with high densities of small, slow-growing fish with the intent to reduce overall density and increase growth. Total density should be higher in streams with a maximum length limit, which was evident in brown trout streams but not brook trout streams in this evaluation. Minimum length limits are typically set to protect juvenile fish until maturity with the overall goal of preventing overharvest and depletion of fish stocks (Noble and Jones 1993). Minimum length limits are ineffective where harvest has little impact on total mortality, such as in inaccessible small headwater stream located away from population centers. Surprisingly, brown trout streams with maximum length limits had higher densities of large fish (≥10 and ≥12 inches) than streams with minimum length limits. Perhaps the 7 brown trout streams with maximum length limits are among the better overall streams in the state. Catch and release regulations are intended to recycle individual medium- to large-sized fish and tend to be effective in populations with good growth potential, low natural mortality, and longevity (Griffith 1993). Streams with catch and release regulations had higher densities of large brown trout than streams with low minimum length limits and high daily bag limits. The lack of significance of brook trout metrics in streams with special regulations may be reflective of the general pattern that a special regulation is primarily intended for brown trout fisheries, even though the Trout Regulations Guide may not distinguish between the two species.
Lack of statistical power may have hindered the ability to detect differences in relative abundance among all special regulation types, with too few samples per regulation type to overcome variability in fish population metrics among streams. Case studies may be more appropriate for evaluating effects of special regulations, but requires knowledge of the specific date of the special regulation implementation, which was not readily available for this evaluation. However, results of case studies of individual streams may not be applicable to other streams, thereby reducing applicability to a statewide evaluation of regulation strategies. Special regulations were only applied to 11% of all stream sites sampled for this analysis, which reflects their limited use relative to other standard regulation categories.
The general increase in mean annual relative abundance through time suggests an overall improvement that may not be completely attributed to regulation changes in the last two decades. Stream habitat projects have increased through time as a result of the trout stamp program that began in 1978, but have only been done on about 700
14
miles out of the total of 10,500 miles of trout stream statewide. Stocking of feral trout has increased in recent years and land use has improved in the south, southwest, and west central parts of Wisconsin. Recently groundwater discharges in those same areas have increased, apparently from increases in precipitation as a result of climate change, but the opposite seems to be occurring in the north.
Peaks in relative abundance in all brook trout metrics for streams with at least 4 years of sampling were higher than peaks for all streams. Streams that were sampled more frequently through time may indicate importance in terms of resource use, which would explain higher peaks in mean relative abundance, but cannot explain lower overall abundance in earlier decades. Similarly, general increase in mean annual relative abundance through time since the 1950’s suggests an overall improvement that cannot be attributed to regulation changes in the last 3 decades, so comparisons of pre-regulation and post-regulation time periods defined should be viewed within the context of the entire time series.
15
SummaryFishing regulations are used to distribute catch and harvest among anglers and
to protect fish populations from over-exploitation (Noble and Jones 1993). In an ideal world, regulations would be implemented to meet established management goals with specific measurable objectives (Noble and Jones 1993). Successful evaluation of any regulation requires an appropriate design that includes treatments (i.e. streams with regulations) and controls (i.e. streams with no regulations). The trout regulation system implemented in Wisconsin in 1990 lacked controls to enable unambiguous interpretation of regulation effects, so the apparent effects described herein are potentially confounded by uncontrolled factors. Nonetheless, all regulation categories (except for special regulations) were applied to a range of stream sizes, which enabled stream size to be accounted for when comparing regulations. In contrast, time-trend patterns suggest that trout population abundance in Wisconsin streams has increased through time since 1950, so increases in trout population density since implementation of the regulation category system in 1990 cannot be entirely attributed to the effect of regulation categories.
Brook Trout
Are brook trout ≥7 inches more abundant in streams with regulation category 2 (7 inch MLL and 5 daily bag limit) than in streams with other regulations?
All streams – No (4 higher than 2; 2 did not differ from 3 and 5) Small – No Medium – No (4 higher than 2; 2 did not differ from 3 and 5) Large – No (4 higher than 2; 2 did not differ from 3 and 5)
The minimum length limit did not correspond to higher densities of brook trout at or beyond the MLL in any stream size class. Because results did not differ among stream sizes, but stream size indicates habitat quantity, either growth or exploitation likely differed. Higher exploitation in medium and large streams would reduce density in these streams. Alternatively, growth may have been inhibited by some other factor in streams where these regulations were applied, so medium and large streams behaved more like small streams with slow growth and high density. Presence of the regulation to protect fish up to 7-inches in length did not result in more fish ≥7 inches in streams assumed to have low exploitation and slow growth (i.e., small streams) or in streams assumed to have high exploitation and fast growth (i.e., medium and large streams). Regulation category 2 streams were more common in the Northern and North East regions, and were absent in the South East and South Central regions.
Are brook trout ≥9 inches more abundant in streams with regulation category 3 (9 inch MLL, 3 daily bag limit) than in streams with other regulations?
All – Yes (3 higher than 2) and No (4 higher than 3) Small –Yes (3 higher than 2) and No (3 did not differ from 4 or 5) Medium – Yes (3 higher than 2) and No (4 higher than 3) Large – No
16
Mixed results suggest this regulation may be somewhat ineffective, though brook trout populations in this analysis were largely self-sustaining (~80%), which could affect the results (the regulation was originally intended for stocked populations in medium-sized streams). Medium-sized streams with the less restrictive 8-inch MLL had higher densities of brook trout ≥9 inches than streams with this regulation, but this pattern was not evident in small or large streams. Regulation category 3 streams were more common in the South Central, and South East regions of the state.
Are brook trout ≥8 inches more abundant in streams with regulation category 4 (8 inch MLL, 3 daily bag limit) than in streams with other regulations?
All –Yes (4 higher than 2, 3, and 5) Small –Yes (4 higher than 2) and No (4 did not differ from 3 and 5) Medium – Yes (4 higher than 2, 3, and 5) Large – Yes (4 higher than 2) and No (4 did not differ from 3 and 5)
The minimum length limit corresponded to higher numbers of brook trout in all stream sizes where this regulation was applied. In small streams, either growth or exploitation was high enough to justify the length limit, or the regulation was applied for all streams within the same county, or the regulation was applied for a reason that was independent of biological characteristics of the brook trout population. Streams with this regulation had higher densities of brook trout, so this regulation could be adopted statewide in medium and large streams, and in small streams with high exploitation and fast growth. Additional investigation of the physical, chemical, or biological characteristics of streams in this category could reveal other factors important for sustaining high densities of large fish. Regulation category 4 streams were more prevalent in the West Central Region, so regional differences in stream quality may influence results.
Do brook trout densities differ in streams with different special regulations and if so, which special regulations were associated with higher densities?
Small streams with special regulations had higher densities than the other standard regulation categories.
Streams with a high MLL and low daily bag limit had higher densities of brook trout ≥9 inches than streams with slot limits or low MLL and high daily bag limits.
Small sample size inhibited strong conclusions about differences in trout densities among streams with special regulations. Because special regulation types were intended to produce different outcomes on different time scales (e.g. maximum size limits- eventual increase in size structure versus catch and release – immediate conservation of present size structure), a lack of difference for most brook trout size classes suggests that special regulations may be ineffective for brook trout. However, streams with special regulations may have both brook and brown trout, and the special regulation may have been intended only for brown trout.
Brown Trout
Are brown trout ≥7 inches more abundant in streams with regulation category 2 (7 inch MLL and 5 daily bag limit) than in streams with other regulations?
17
All – No (5 was higher than 2) Small – No Medium – No (3 and 5 were higher than 2) Large – No
The MLL did not correspond to higher relative abundance of brown trout at or beyond the minimum length in any stream size class. Because results did not differ among stream sizes, but stream size does indicate habitat quantity, either growth or exploitation likely differed. Higher exploitation in medium and large streams would reduce density of larger fish in these streams. Alternatively, growth may be inhibited by some other factor in streams where these regulations were applied, so medium and large streams behave more like small streams with slow growth and high density. Presence of the regulation to protect fish up to 7-inches in length did not result in more fish ≥7 inches in streams assumed to have low exploitation and slow growth (i.e., small streams) or in streams assumed to have high exploitation and fast growth (i.e., medium and large streams). Regulation category 2 streams were more common in the Northern and North East regions, and were absent in the South East and South Central regions.
Are brown trout ≥9 inches more abundant in streams with regulation category 3 (9 inch MLL, 3 daily bag limit) than in streams with other regulations?
All – Yes (3 higher than 2) and No (3 did not differ from 4 or 5) Small – Yes (3 higher than 2) and No (3 did not differ from 4 or 5) Medium –Yes (3 higher than 2 and 4) and No (3 did not differ from 5) Large – No
When this regulation was applied to small streams, the densities of brown trout ≥9 inches were higher than small streams with the base regulation (2). Medium-sized streams with this regulation had higher densities of brown trout ≥9 inches than medium-sized streams with regulations 2 and 4, but densities were not different than medium-sized streams with special regulations (5). Sample sizes were relatively small and densities were highly variable for brown trout populations in large streams. Regulation category 3 streams were more common in the South Central, and South East regions of the state.
Are brown trout ≥12 inches more abundant in streams with regulation category 4 (9 inch MLL, 3 daily bag limit) than in streams with other regulations?
All – No Small – No (2 higher than 4 and 4 did not differ from 3 and 5) Medium – No (4 lower than 5 and 4 did not differ from 2 and 3) Large –Yes (4 higher than 5) and No (4 did not differ from 2 and 3)
Large streams with this regulation had higher densities than large streams with special regulations. Regulation category 4 streams were more prevalent in the West Central Region, so regional differences in stream quality may influence results.
Do brown trout densities differ in streams with different special regulations and if so, which special regulations were associated with higher densities?
18
Medium-sized streams with special regulations had higher densities than the other standard regulation categories.
For small fish, maximum length limits higher than high MLL and low daily bag limits or low MLL and high daily bag limits
For large fish, catch and release and slot limits higher than low MLL high daily bag limits or high MLL low daily bag limit
The low sample size prohibits strong conclusions about any of the special regulations.
Streams with maximum length limits had higher densities of brown trout ≥10 or ≥12 inches than other special regulations specifically designed to increase the number of large fish, which suggests that unique characteristics of the 32 sites on only 7 streams where maximum length limits were applied may have influenced the results. Streams with catch and release and slot limits had higher densities of large brown trout compared to streams with low minimum length limit, high daily bag limits.
19
AcknowledgmentsWe gratefully acknowledge all Wisconsin Department of Natural Resources
employees past and present who collected the data used in this evaluation. Matt Faust and Kyle Mosel assisted with the map. Larry Claggett, Mike Hansen, and Dan Isermann provided helpful reviews of an earlier draft.
20
References
Claggett, L. 2007. Tailoring the take to the fishery. Wisconsin Natural Resources Magazine.
Griffith, J. S. 1993. Coldwater streams. Pages 405–425 in C. C. Kohler and W. A. Hubert, editors. Inland fisheries management in North America. American Fisheries Society, Bethesda, Maryland.
Nate, N. A. in preparation. Characteristics of brook and brown trout populations in Wisconsin streams, 1992–2010. Wisconsin Department of Natural Resources Technical Report, Madison.
Noble, R. L. and T. W. Jones. 1993. Managing fisheries with regulations. Pages 383–402 in C. C. Kohler and W. A. Hubert, editors. Inland fisheries management in North America. American Fisheries Society, Bethesda, Maryland.
Wisconsin Department of Natural Resources, Bureau of Fisheries Management. 1988. New trout fishing regulations eyed for Wisconsin. Wisconsin Department of Natural Resources PUBL-FM-416.
21
Figure 1. Locations of fish sampling in the FMDB where brook trout (black triangle) or brown trout (black square) or both species (grey circle) were captured during 1992-2010.
22
0
100
200
300
400
500
600
1992 1994 1996 1998 2000 2002 2004 2006 2008 2010
Num
ber o
f Sur
veys
Year
Figure 2. The number of trout stream surveys in the FMDB by year as of June 2010.
23
0
100
200
300
400
500
600
2 3 4 5 2 3 4 5 2 3 4 5 2 3 4 5 2 3 4 5
NER NOR SCR SER WCR
Num
ber o
f Site
s
Regulation Category by Region
Brook Trout
Brown Trout
Figure 3. The number of sampling locations by regulation category, WI DNR Region, and species present for 2,806 sites on 1,102 trout streams during 1992–2010.
24
0
100
200
300
400
500
600
2 3 4 5 2 3 4 5 2 3 4 5
Small Medium Large
Num
ber o
f Site
s
Stream Size and Regulation Category
Figure 4. The number of sampling locations on brook and brown trout streams in Wisconsin by regulation category (2,3,4,5) and stream size category (small, medium, large). Small streams include stream orders 1&2, medium-sized streams include stream orders 3&4, and large streams include stream orders 5&6.
25
0
50
100
150
200
250
300
350
400
450
500
1 2 3 1 2 3 1 2 3 1 2 3
2 3 4 5
Num
ber o
f Site
s
Trout Class and Regulation Category
Figure 5. The number of brook or brown trout stream sites by Trout Class (1, 2, 3, upper) and regulation category (2, 3, 4, 5 lower) in Wisconsin during 1992–2010.
26
0
50
100
150
200
250
300
2 3 4 5
Catc
h pe
r Mile
Regulation Category
0
10
20
30
40
50
60
2 3 4 5
Catc
h ≥
7" p
er M
ileRegulation Category
0
5
10
15
20
25
30
2 3 4 5
Catc
h ≥
8" p
er M
ile
Regulation Category
0
2
4
6
8
10
12
2 3 4 5
Catc
h ≥
9" p
er M
ile
Regulation Category
27
Figure 6. Mean brook trout catch per mile (± 1 SE) by regulation category in Wisconsin streams 1992–2010.
1
10
100
1000
total >5 >7 >8 >9
Catc
h pe
r Mile
Length Group
Reg#2 7 inch
Reg#3 9 inch
Reg#4 8 inch
Reg#5 Special
1
10
100
1000
total >5 >7 >9 >12
Catc
h pe
r Mile
Length Group
Reg#2 7 inch
Reg#3 9 inch
Reg#4 12 inch
Reg#5 Special
28
Figure 7. Mean brook trout (upper panel) and brown trout (lower panel) catch per mile by regulation category in Wisconsin streams 1992–2010.
29
0
50
100
150
200
250
2 3 4 5
Catc
h pe
r Mile
Regulation Category
0
10
20
30
40
50
60
70
80
90
100
2 3 4 5
Catc
h ≥
7" p
er M
ileRegulation Category
0
5
10
15
20
25
30
35
40
45
50
2 3 4 5
Catc
h ≥
9" p
er M
ile
Regulation Category
0
2
4
6
8
10
12
14
2 3 4 5
Catc
h ≥
12"
per M
ile
Regulation Category
Figure 8. Mean brown trout catch per mile (± 1 SE) by regulation category in Wisconsin streams 1992–2010.
30
0
100
200
300
400
500
600
700
CR HmLb LmHb max slot
Cat
ch p
er M
ile
Regulation Type
0
5
10
15
20
25
30
35
40
45
CR HmLb LmHb max slot
Cat
ch p
er M
ile ≥
8"
Regulation Type
-1
1
3
5
7
9
11
13
15
CR HmLb LmHb max slot
Cat
ch p
er M
ile ≥
10"
Regulation Type
-1.0
-0.5
0.0
0.5
1.0
1.5
2.0
2.5
CR HmLb LmHb max slot
Cat
ch p
er M
ile ≥
12"
Regulation Type
Figure 9. Mean catch per mile (± 1 SE) for brook trout of all sizes, and ≥ 8, 10, and 12 inches by general special regulation type in Wisconsin streams 1992–2010. “CR” = catch and release, “HmLb” = high MLL and low daily bag limit, “LmHb” = low MLL and high daily bag limit, “max” = maximum length limits, and “slot” = slot limits. Overall ANOVA tests for total, ≥ 8, and ≥ 12 were not significant.
31
0
500
1000
1500
2000
2500
3000
CR HmHb HmLb LmHb max slot
Cat
ch p
er M
ile
Regulation Type
0
200
400
600
800
1000
1200
CR HmHb HmLb LmHb max slot
Cat
ch p
er M
ile ≥
10"
Regulation Type
0
20
40
60
80
100
120
140
160
180
200
CR HmHb HmLb LmHb max slot
Cat
ch p
er M
ile ≥
12"
Regulation Type
0
5
10
15
20
25
30
35
CR HmHb HmLb LmHb max slot
Cat
ch p
er M
ile ≥
15"
Regulation Type
Figure 10. Mean catch per mile (± 1 SE) for brown trout of all sizes, and ≥ 10, 12, and 15 inches by general special regulation type in Wisconsin streams 1992–2010. “CR” = catch and release, “HmHb” = high MLL and high daily bag limit, “HmLb” = high MLL and low daily bag limit, “LmHb” = low MLL and high daily bag limit, “max” = maximum length limits, and “slot” = slot limits.
32
y = 7.3308x - 14160R² = 0.3531
0
100
200
300
400
500
600
700
800
900
1000
1950 1960 1970 1980 1990 2000 2010
Num
ber
per M
ile
Year
y = 1.4072x - 2728.3R² = 0.48
0
20
40
60
80
100
120
140
1950 1960 1970 1980 1990 2000 2010
Num
ber ≥
7" p
er M
ile
Year
y = 0.7845x - 1523.5R² = 0.4964
0
10
20
30
40
50
60
70
80
1950 1960 1970 1980 1990 2000 2010
Num
ber ≥
8" p
er M
ile
Year
y = 0.3541x - 687.11R² = 0.4256
0
10
20
30
40
50
60
1950 1960 1970 1980 1990 2000 2010
Num
ber ≥
9" p
er M
ile
Year
Figure 11. Average brook trout catch per mile by year in Wisconsin trout streams, 1950–2010, all data included.
33
y = 8.8967x - 17373R² = 0.5757
0
100
200
300
400
500
600
700
800
900
1000
1950 1960 1970 1980 1990 2000 2010
Num
ber p
er M
ile
Year
y = 2.891x - 5626.2R² = 0.4575
0
50
100
150
200
250
300
350
400
1950 1960 1970 1980 1990 2000 2010
Num
ber ≥
7" p
er M
ile
Year
y = 1.6555x - 3224.4R² = 0.4945
0
20
40
60
80
100
120
140
160
180
200
1950 1960 1970 1980 1990 2000 2010
Num
ber ≥
9" p
er M
ile
Year
y = 0.4368x - 851.35R² = 0.6128
0
5
10
15
20
25
30
35
40
45
50
1950 1960 1970 1980 1990 2000 2010
Num
ber ≥
12 "
per M
ile
Year
Figure12. Average brown trout catch per mile by year in Wisconsin trout streams, 1950–2010, all data included.
34
y = 8.7383x - 16857R² = 0.2313
0
200
400
600
800
1000
1200
1400
1600
1800
1950 1960 1970 1980 1990 2000 2010
Num
ber
per M
ile
Year
y = 1.8198x - 3522.7R² = 0.3839
0
50
100
150
200
250
1950 1960 1970 1980 1990 2000 2010
Num
ber ≥
7" p
er M
ileYear
y = 0.9025x - 1748.6R² = 0.334
0
20
40
60
80
100
120
140
160
1950 1960 1970 1980 1990 2000 2010
Num
ber ≥
8" p
er M
ile
Year
y = 0.4329x - 839.26R² = 0.2308
0
20
40
60
80
100
120
1950 1960 1970 1980 1990 2000 2010
Num
ber ≥
9" p
er M
ile
Year
Figure 13. Average brook trout catch per mile by year in Wisconsin trout streams with surveys in at least 4 decades during 1950–2010.
35
y = 5.2982x - 10201R² = 0.0784
0
200
400
600
800
1000
1200
1400
1600
1800
2000
1950 1960 1970 1980 1990 2000 2010
Num
ber p
er M
ile
Year
y = 0.7561x - 1378.7R² = 0.0056
0
200
400
600
800
1000
1200
1950 1960 1970 1980 1990 2000 2010
Num
ber ≥
7" p
er M
ile
Year
y = 0.5536x - 1035.3R² = 0.0128
0
100
200
300
400
500
600
1950 1960 1970 1980 1990 2000 2010
Num
ber ≥
9" p
er M
ile
Year
y = 0.3327x - 643.73R² = 0.1108
0
10
20
30
40
50
60
70
80
90
100
1950 1960 1970 1980 1990 2000 2010
Num
ber ≥
12 "
per M
ile
Year
Figure 14. Average brown trout catch per mile by year in Wisconsin trout streams with surveys in at least 4 decades during 1950–2010.
36
Stream size Small Medium Medium Large LargeLocation in the watershed Headwaters Upstream Middle Downstream Downstream
HabitatLimited for fish > 7"
Limited for fish > 12"
Limited for fish > 12"
Good for all sizes
Good for all large fish
Trout growth Slow Average Average to fast Fast Fast
Trout population size structure Most < 7"
Many 7-12", Few > 12"
Potential for more > 9"
Potential for more browns > 12" and brook > 8"
Potential for more over 15" or 20 "
Wild trout (N = natural reproduction or S = stocked) High N N or S S N or S N or S
Fishing pressure Low Medium to high HighHigh throughout the season High
Current effect of fishing pressure Little Some
Overharvest of legal fish
Overharvest of medium size fish
Overharvest of large fish
Table 1. Regulation proposal criteria for assigning streams to regulation categories (Wisconsin Department of Natural Resources, Bureau of Fisheries Management 1988).
37
Region Regulation Category
Number of Sites
Percent within Region
NER 2 275 59%3 59 13%4 113 24%5 21 4%
NOR 2 661 66%3 94 9%4 90 9%5 149 15%
SCR 2 0 0%3 498 79%4 13 2%5 117 19%
SER 2 0 0%3 57 63%4 11 12%5 22 24%
WCR 2 289 19%3 385 26%4 698 46%5 136 9%
Table 2. The number of sites by WI DNR Region and regulation category for 2806 brook or brown trout streams in Wisconsin during 1992–2010.
38
Gear Restrictions Bag Limit Size Limit Season ( if different)None 1 brown trout & 3 brook trout brown trout- 18", brook trout 8"None 1 trout in total 15"None 2 trout in total 12"None 3 trout in total 9" May 2 at 5:00 a.m. to September 30None 3 trout in total 8"
None 3 trout in total all trout kept shall be between 10" and 13"None 3 trout in total None
None 3 trout over 9", only one brown trout over 15"
None 3 trout under 10", or 2 under 10" & 1 over 14"None 5 trout in total All trout kept shall be less than 9"None 5 trout in total 7 " April 25 to September 31None 5 trout in total all trout kept shall be less than 12"None 5 trout in total brown trout -12", brook trout- 8" April 25 to September 30
None 5 trout under 10", or 4 under 10" & 1 over 14"None 5 trout under 8", or 4 under 8" & 1 over 12"
None All trout caught shall be immediately released
Nonetrout over 15" and only 1 of which may be a rainbow trout 15"
Only Artificial Lures May be Used All trout caught shall be immediately released October 1 to May 2Only Artificial Lures May be Used 1 trout in total 15"Only Artificial Lures May be Used 1 trout in total brook trout- 14"
Only Artificial Lures May be Used 1 trout in totalbrown trout 18", brook and rainbow trout 12"
Only Artificial Lures May be Used2 brook trout over 12", & 1 brown trout over 18"
Only Artificial Lures May be Used 2 trout in total 12"Only Artificial Lures May be Used 2 trout in total 14"
Only Artificial Lures May be Used 2 trout in totalbrown trout 18", brook and rainbow trout 12"
Only Artificial Lures May be Used 2 trout in total, only 1 may be a brown troutbrown trout 18", brook and rainbow trout 10"
Only Artificial Lures May be Used 3 trout in total all trout kept shall be between 10" and 13"
Only Artificial Lures May be Used 3 trout in total, only 1 over 20"
3 trout may be kept between 10" and 13", or 2 trout between 10" and 13" and 1 over 20"
Only Artificial Lures May be Used 3 trout per day, only 1 brown trout over 15" all trout 12"Only Artificial Lures May be Used 3 trout, only 1 of which is over 15" all trout 12"
Only Artificial Lures May be Used 5 trout in total, only 3 may be brook trout7" brown and rainbow trout, brook trout must be between 6"-9"
Only Artificial Lures May be Used all trout caught shall be immediately released
Only Artificial Lures May be Used all trout caught shall be immediately released January 1 to September 30
Only Artificial Lures May be Used all trout caught shall be immediately released May 2 at 5:00 a.m. to November 15
Table 3. Unique gear restrictions, bag limits, size limits, and seasons for special regulation category 5.
Table 4. Least squares mean catch per mile by regulation category (2–5), stream size category (all, small, medium, and large), and fish length groups from summer electro-fishing surveys on 2372 brook trout stream locations and 1476 brown trout stream locations in Wisconsin during 1992–2010. An * indicates the ANOVA test was not significant at the 0.05 level.
Table 5. Matrix of Tukey pair-wise comparison probabilities for relative abundance metrics and regulation categories for brook and brown trout populations in Wisconsin streams during 1992–2010. Bold font indicates significant differences at the 0.05 significance level.
Table 6. Matrix of Tukey pair-wise comparison probabilities for relative abundance metrics and regulation categories for brook and brown trout populations in small (stream orders 1 & 2) Wisconsin streams during 1992–2010. Bold font indicates significant differences at the 0.05 significance level. An * indicates the ANOVA test was not significant at the 0.05 level.
Table 7. Matrix of Tukey pair-wise comparison probabilities for relative abundance metrics and regulation categories for brook and brown trout populations in medium-sized (stream orders 3 & 4) Wisconsin streams during 1992–2010. Bold font indicates significant differences at the 0.05 significance level. An * indicates the ANOVA test was not significant at the 0.05 level.
Table 8. Matrix of Tukey pair-wise comparison probabilities for relative abundance metrics and regulation categories for brook and brown trout populations in large (stream orders 5 & 6) Wisconsin streams during 1992–2010. Bold font indicates significant differences at the 0.05 significance level.
44
Regulation Type Waterbody Name WBICNumber of Sites
CR BIG RIB RIVER 1451800 2CR BIG SPRING BR 1212900 2CR BOYDTOWN CREEK 1205100 2CR BUCK CREEK 1636200 2CR CAP CREEK 2731600 1CR DELL CREEK 1295200 3CR DU CHARME CREEK 1634800 1CR GRANT RIVER 956000 1CR MILL CREEK 1215600 1CR MT VERNON CREEK 886600 3CR PICATEE CREEK 1634700 1CR SEAS BRANCH 1189800 1CR STEINER BR 904000 2CR WEST FORK KICKAPOO RIVER 1187900 1highminlowbag BUFFALO RIVER 1813900 1highminlowbag DEERSKIN RIVER 1600400 5highminlowbag EAST BRANCH EAU CLAIRE RIVER 1442200 5highminlowbag HAY RIVER 2068600 9highminlowbag HUNTING RIVER 383400 4highminlowbag LITTLE WOLF RIVER 272400 1highminlowbag MILL CREEK 52700 1highminlowbag ONION RIVER 51200 1highminlowbag POMPEY PILLAR CREEK 1237900 2highminlowbag SPRING BROOK 1440800 3highminlowbag TREMPEALEAU RIVER 1769900 1lowminhighbag BIG ELK CREEK 2121900 5lowminhighbag UNNAMED SINGLE-LINE STREAM T28N-R10W-S17 2121700 1lowminhighbag UNNAMED SINGLE-LINE STREAM T28N-R10W-S5 2122100 1lowminhighbag WHITE RIVER 2892500 1max BISHOP BR 1188500 3max ELK CREEK 2120800 7max FORDHAM CREEK 1352200 1max INDIAN CREEK 2657800 1max KINNICKINNIC RIVER 2601800 1max MANLEY CREEK 1261200 4max SOUTH FORK CLAM RIVER 2663300 3max UNNAMED SINGLE-LINE STREAM T29N-R10W-S35 2122300 3slot CROOKED CREEK 1205600 1slot MELANCTHON CREEK 1232200 8slot PLOVER RIVER 1402800 1
Brook Trout
Table 9. Brook trout streams by general special regulation type, WBIC, and the number of sites included in the special regulations test.
45
Regulation Type Waterbody Name WBICNumber of Sites
CR BIG RIB RIVER 1451800 1CR BIG SPRING BR 1212900 2CR BLACK EARTH CREEK 1248600 2CR CAP CREEK 2731600 1CR DELL CREEK 1295200 3CR DU CHARME CREEK 1634800 1CR EAST FORK RACCOON CREEK 874100 1CR GRANT RIVER 956000 1CR LITTLE GRANT RIVER 963100 2CR LOVETT CREEK 920700 1CR MILL CREEK 1215600 1CR MT VERNON CREEK 886600 7CR SEAS BRANCH 1189800 1CR STEINER BR 904000 3CR TROUT CREEK 1243100 4CR WEST FORK KICKAPOO RIVER 1187900 1highminhighbag MECAN RIVER 155000 2highminlowbag BUFFALO RIVER 1813900 1highminlowbag DEERSKIN RIVER 1600400 1highminlowbag EAST BRANCH EAU CLAIRE RIVER 1442200 1highminlowbag HAY RIVER 2068600 3highminlowbag HUNTING RIVER 383400 4highminlowbag LITTLE WILLOW CREEK 1221300 1highminlowbag LITTLE WOLF RIVER 272400 1highminlowbag MILL CREEK 52700 5highminlowbag MILLVILLE CREEK 1181600 2highminlowbag NEENAH CREEK 173800 1highminlowbag ONION RIVER 51200 5highminlowbag POMPEY PILLAR CREEK 1237900 2highminlowbag SPRING CREEK 1261900 3highminlowbag TENMILE CREEK 1382700 1highminlowbag TREMPEALEAU RIVER 1769900 1highminlowbag WHITE CREEK 1342800 1highminlowbag WHITE RIVER 148500 2lowminhighbag BIG ELK CREEK 2121900 5lowminhighbag FALL CREEK 2129900 1lowminhighbag MELANCTHON CREEK 1232200 10lowminhighbag UNNAMED SINGLE-LINE STREAM T28N-R10W-S5 2122100 1lowminhighbag WHITE RIVER 2892500 1max BISHOP BR 1188500 7max ELK CREEK 2120800 10max FORDHAM CREEK 1352200 1max KINNICKINNIC RIVER 2601800 6max SAND CREEK 2659400 2max SOUTH FORK CLAM RIVER 2663300 3max UNNAMED SINGLE-LINE STREAM T29N-R10W-S35 2122300 3slot CROOKED CREEK 1205600 4slot PLOVER RIVER 1402800 1
Brown Trout
Table 10. Brown trout streams by general special regulation type, WBIC, and the number of sites included in the special regulations test.
46
total * ≥ 8" * ≥ 10" ≥ 12" *Catch and Release 23 56 14 3 1High minimum length, high daily bag 0High minimum length, low daily bag 33 136 22 7 1Low minimum length, high daily bag 8 183 4 0 0Maximum length limits 23 154 12 3 1Slot limits 10 161 13 0 0
total ≥ 10" ≥ 12" ≥ 15"Catch and Release 32 244 47 24 4High minimum length, high daily bag 2 45 16 12 4High minimum length, low daily bag 35 131 12 6 2Low minimum length, high daily bag 18 96 5 2 0Maximum length limits 32 682 89 27 2Slot limits 5 664 157 36 10
Regulation TypeNumber of Sites
Brook Trout
Brown Trout
Table 11. Least squares mean catch per mile by general regulation type for all fish captured (total) and by length groups from summer electro-fishing surveys on 97 brook trout stream locations and 124 brown trout stream locations in Wisconsin during 1992–2010. An * indicates the ANOVA test was not significant at the 0.05 level.
47
Catch and Release
High minimum length,
high daily bag
High minimum
length, low daily bag
Low minimum length,
high daily bag
Maximum length limits Slot limits
Total * 23 Catch and Release 1.0000000 High minimum length, high daily bag
33 High minimum length, low daily bag 0.295954 1.0000008 Low minimum length, high daily bag 0.425135 0.991640 1.000000
2 High minimum length, high daily bag 0.983147 1.00000035 High minimum length, low daily bag 0.109048 0.999974 1.00000018 Low minimum length, high daily bag 0.007789 0.978919 0.726909 1.00000032 Maximum length limits 0.811348 0.874281 0.002485 0.000167 1.000000
2 High minimum length, high daily bag 0.995729 1.00000035 High minimum length, low daily bag 0.048876 0.997176 1.00000018 Low minimum length, high daily bag 0.000763 0.855872 0.466902 1.00000032 Maximum length limits 0.999911 0.991640 0.025360 0.000364 1.000000
2 High minimum length, high daily bag 1.000000 1.00000035 High minimum length, low daily bag 0.370409 0.980872 1.00000018 Low minimum length, high daily bag 0.018137 0.767019 0.566598 1.00000032 Maximum length limits 0.873122 0.998103 0.963429 0.200034 1.000000
Table 12. Matrix of Tukey pair-wise comparison probabilities for relative abundance metrics and general special regulation type for brook and brown trout populations in Wisconsin streams during 1992–2010. Bold font indicates significant differences at the 0.05 significance level.
48
Total ≥8 inches ≥12 inches ≥16 inches ≥18 inches2 11%a 771% a 90% a3 491%b 1959% a 70% a4 47% a,b 2472% a 100% a5 122% a,b 184% a 110% a
2 32% a -42% a 1% a -5% a -11% a3 523% b -307% a 237% a -32% a -43% a4 14% a,b,c -24% a -35% a -43% a -20% a5 34% a,c -42% a -5% a -15% a -76% a
Regulation Brook Trout
Brown Trout Category Total 8+inches 12+inches 16+inches 18+inches2 32%a -42%a 1%a -5%a -11%a3 523%b -307%a 237%a -32%a -43%a4 14%a,b,c -24%a -35%a -43%a -20%a5 34%a,c -2%a -5%a -15%a -76%aTable 13. Percent change in brook and brown trout mean catch per mile between pre
(1980-1989) and post (1990-2010) regulation time periods for 18 brook trout sampling sites on 11 streams and 22 brown trout sampling sites on 10 streams in Wisconsin. Different letters signify significant differences.