1 Regulatory Environment and Firms’ Performance in EU Telecommunications Services ± Daniel Montolio * , Francesc Trillas + and Elisa Trujillo-Baute * May, 2013 Abstract In this study we empirically test the effects of regulated access prices and firms’ multinational status on firms’ performance by using firm, group, and country level information for the European broadband market over the period 2002-2010. Three measures of firms’ performance are used, namely; market share, turnover and productivity. Special attention is devoted to differences in the effects on performance measures depending on firms’ position as incumbent or entrant in the markets. We find that, while access prices exert a negative effect on entrants’ market share and turnover, the effect on incumbents’ turnover and productivity is positive. With regard to firms’ multinational status, we find that multinational entrants perform better than national entrants in terms of their market share but worst in terms of their turnover and productivity. The opposite happens with the incumbent multinationals; confirming that firms’ multinational status has a significant impact on performance, and that this impact is different for incumbents and entrants. Keywords: regulation, firm performance, telecommunications, multinational firms. JEL codes: L51, L25, L96, F23. 1. Introduction As in most network industries, traditionally telecommunications services were provided by a single, state owned and vertically integrated operator. This changed in the 1980’s and 1990’s by the liberalization process and privatization of the operators. More recently, in 2002 the EU promoted the mandatory unbundling (third-party access) regulation with the aim to ensure the entrance of new agents in the sector 1 . In order to stimulate competition and to obtain its desired effects on markets and consumers, new entrants’ accessed the incumbent fixed-line infrastructure at the wholesale level, and cost-based access (wholesale) pricing regimes were adopted in most countries. The rationale behind this framework is that local loop 2 access products would allow entrants to provide services with minimum straight investment while relying on the existent network of the incumbent, but after a first stage, entrants are expected to invest in an increasing degree to develop their own infrastructure. This is called the “ladder of investment” theory (Cave and Vogelsang, 2003). Within telecommunications, one of the markets affected by these changes in the European regulatory framework is the broadband service. Broadband describes a form of Internet access with high speed. The main access technology to broadband services in Europe is the xDSL (Digital Subscriber Lines) which by July 2009 accounted for 80% of the broadband retail ± We would like to thank Joan Calzada, Mattia Nardotto, Michal Grajek and all participants at the University of Barcelona Workshop on Telecommunications Economics (2013) for helpful comments and discussion. * University of Barcelona and Barcelona Institute of Economics (IEB). + Autonomous University of Barcelona and Barcelona Institute of Economics (IEB). 1 The EU Directives that contains this new regulatory framework are 2002/19/EC to 2002/21/EC. 2 The local loop is the wire used by a telephone company to connect each consumer to the connexion point with the nearest net and from there to the rest of the word.
Transcript
1
Regulatory Environment and Firms’ Performance in EU Telecommunications Services±
Daniel Montolio*, Francesc Trillas+ and Elisa Trujillo-Baute*
May, 2013
Abstract
In this study we empirically test the effects of regulated access prices and firms’ multinational status on firms’ performance by using firm, group, and country level information for the European broadband market over the period 2002-2010. Three measures of firms’ performance are used, namely; market share, turnover and productivity. Special attention is devoted to differences in the effects on performance measures depending on firms’ position as incumbent or entrant in the markets. We find that, while access prices exert a negative effect on entrants’ market share and turnover, the effect on incumbents’ turnover and productivity is positive. With regard to firms’ multinational status, we find that multinational entrants perform better than national entrants in terms of their market share but worst in terms of their turnover and productivity. The opposite happens with the incumbent multinationals; confirming that firms’ multinational status has a significant impact on performance, and that this impact is different for incumbents and entrants. Keywords: regulation, firm performance, telecommunications, multinational firms. JEL codes: L51, L25, L96, F23.
1. Introduction As in most network industries, traditionally telecommunications services were provided by a single, state owned and vertically integrated operator. This changed in the 1980’s and 1990’s by the liberalization process and privatization of the operators. More recently, in 2002 the EU promoted the mandatory unbundling (third-party access) regulation with the aim to ensure the entrance of new agents in the sector1. In order to stimulate competition and to obtain its desired effects on markets and consumers, new entrants’ accessed the incumbent fixed-line infrastructure at the wholesale level, and cost-based access (wholesale) pricing regimes were adopted in most countries. The rationale behind this framework is that local loop2 access products would allow entrants to provide services with minimum straight investment while relying on the existent network of the incumbent, but after a first stage, entrants are expected to invest in an increasing degree to develop their own infrastructure. This is called the “ladder of investment” theory (Cave and Vogelsang, 2003). Within telecommunications, one of the markets affected by these changes in the European regulatory framework is the broadband service. Broadband describes a form of Internet access with high speed. The main access technology to broadband services in Europe is the xDSL (Digital Subscriber Lines) which by July 2009 accounted for 80% of the broadband retail
± We would like to thank Joan Calzada, Mattia Nardotto, Michal Grajek and all participants at the University of Barcelona Workshop on Telecommunications Economics (2013) for helpful comments and discussion. * University of Barcelona and Barcelona Institute of Economics (IEB). + Autonomous University of Barcelona and Barcelona Institute of Economics (IEB). 1 The EU Directives that contains this new regulatory framework are 2002/19/EC to 2002/21/EC. 2 The local loop is the wire used by a telephone company to connect each consumer to the connexion point with the nearest net and from there to the rest of the word.
2
lines3. With the mandatory unbundling regulation, the new competitors in the market can provide broadband access for customers by using the incumbent infrastructure. Prices for the usage of the telecommunications incumbent’s network are regulated4. Thus, the firms’ performance is, in part, the result of regulatory decisions. For this reason, in this study we evaluate the effect of access regulation on firms’ performance by observing the regulated prices that entrants pay for the access to the incumbents’ network to provide Internet services to subscribers. The implementation of regulated rates within the mandatory unbundled context exerts effects on firms’ performance in two directions; on the entrants’ production cost through the input prices and on incumbents’ wholesale and retail income. Therefore, to fully appreciate the wholesale access price impact on firms’ performance the approach to be followed must include both retail and wholesale firms’ performance information. From an international point of view, the overall changes in the European telecommunication sector over the past three decades have implied that in most countries access to Internet services is provided by a broad range of operators. On the one hand, there are the traditional monopolist telecom operators: the incumbents. On the other hand, there are all the new operators (alternative to the traditional monopolist telecom operators): the entrants. Within the incumbents and the entrants there are firms which hold operations in a single country as well as firms that operates in several European countries. Therefore, in a given country, broadband services can be provided at the same time by, for instance, a national entrant (with only national operations), a multinational entrant (which is entrant in several European countries), and a national or multinational incumbent. Accordingly, different performance can be expected between a national and multinational entrants (or incumbents). Consequently, it is also important to take these differences into account when analysing European telecommunication firms’ performance. In this set up, using firm, group, and country level information for the European broadband market over the period (2002-2010), we test empirically the effects of regulated access prices and firms’ multinational status on three measures of firms’ performance, namely; market share, turnover and productivity. Special attention is devoted to differences in the effects on performance measures depending on firms’ position as incumbent or entrant in the markets. We find that, while access prices exert a negative effect on entrants’ market share and turnover, the effect on incumbents’ market share, turnover and productivity is positive. With regards to firms’ multinational status, we find that multinational entrants perform better than national entrants in terms of their market share but worst in terms of their turnover and productivity. The opposite happens with the incumbent multinationals; confirming that firms’ multinational status has a significant impact on their performance, and that this impact is different for incumbents and entrants. This article is organised as follows. Section 2 summarizes the related literature and develops the empirical hypotheses about the effect of regulated access price and firms’ multinational status on firm performance. Section 3 outlines our empirical strategy and discusses data issues. Section 4 presents the estimations and results of our analysis. Section 5 discusses the results. Finally, Section 6 concludes.
3 Own estimation based on EC report (2009). 4 The usage is related to the unbundling network elements (UNEs), which represent the different types of access that the entrants have over the incumbent’s network.
3
2. Related Literature and Empirical Hypotheses Most of the recent literature on access regulation has been devoted to the analysis of its impact on firms’ investment incentives (Valletti, 2003; De Bijl and Peitz, 2005; Hori and Mizuno, 2009). The effects of third-party access in Europe have generated considerable debate. Its proponents claim that unbundling serves to encourage broadband deployment and to promote facility-based competition, while its opponents argue that it distorts entrants’ make-or-buy decisions, impedes investment incentives and, as such, has been a failure. A leading question in this debate concerns the effects of mandatory unbundling on a firm’s investment incentives5. Changing the focus of analysis, a recent article by Nardotto et al. (2012) evaluates the open access effect on broadband market performance indicators (penetration and quality) by looking at the experience in the UK. The authors find that while local loop unbundling entry has not raised total broadband penetration across different local markets, it has substantially increased the quality of the service as measured by average broadband speed. Here the focus, instead of on market performance, is placed on firms’ performance. Despite the relevance of firms’ performance for overall market dynamics, and for the provision of the service it self, this is a dimension that has attracted small attention from empirical research (see Wallsten and Hausladen, 2009; Grajek and Roller, 2012; Cambini and Rondi, 2012) when analyzing the effects of access regulation. Under the current European regulatory framework, new entrants’ access the incumbent fixed-line infrastructure at the wholesale level and compete with them in the retail market6. Since the regulated rate is the price that an entrant must pay to the incumbent for each subscriber in order to provide its service through the incumbent infrastructure, the access price is a key ingredient of the firms’ marginal cost of providing the service. Therefore, an inverse relation between access prices and entrants’ performance is expected. The expected relation between access prices and the incumbent performance is less straight-forward. When analysing firms’ activity in the context of competitive retail markets, special attention must be taken if there is an operator which participate in multiple levels of the industry. Generally speaking, a firm usually obtains greater profits in a retail market if its rivals’ cost increases because this induces rivals to raise their prices or reduce their output, both of which can increase the revenue of a retail competitor. From here one might think that, since the incumbent and the entrants compete directly for retail costumers, the incumbents will always obtain benefits from its position as input supplier with the possibility to raise the cost of its retail rivals. However, following Armstrong and Sappington (2006) and Sappington (2006), this is not always the case because although the incumbent retail income may increase as its rivals’ production costs increase, the incumbents wholesale profits can decline by more than its retail profit increases. In this context, the incumbents wholesale profits will decline if the quantity of access bought by entrants goes down proportionally by more than access prices goes up, which depends on elasticities. Therefore, the expected relation between access prices and the incumbent’s performance will depend on what effect prevails; the positive from the retail market or the possible negative from the wholesale market. 5 The literature review on broadband and investment regulation in Cambini and Jiang (2009) provides extensive coverage of this debate. 6 Entrants in the DSL market can provide broadband access for customers by four different means: Full ULL (Unbundled Local Loop), line sharing (Shared Access), bitstream access (a technological use of the incumbents assets), and pure reselling of the incumbent’s services. As for 2009, bitstream access and resale lines represent less than 10% of the total DSL retail lines (own estimation based on EC, 2009), so we discarded them from our analysis and focus on Full ULL and shared access rates.
4
The relationship between the degree of multinationality and firm performance has attracted enormous scholarly attention over the past decades. However, limited consensus has been established both theoretically and empirically. Studies on the subject have used a diversity of theoretical approaches, from the finance theory of portfolio diversification (Kim et al., 1993; Reeb et al., 1998), to resource-view (Kotabe et al., 2002), and to organizational learning theory (Ruigrok and Wagner, 2003), to predict a relationship between multinationality and performance. In spite of the large number of theoretical studies, the empirical evidence has not been robust, as the relationship between multinationality and performance has been found to be negative (Denis et al., 2002), insignificant or very weak (Tallman and Li, 1996), positive (Gomes and Ramaswamy, 1999), and concave (Ruigrok and Wagner 2003). In the telecommunications context the empirical analysis of the relationship between the degree of multinationality and firm performance is rather scarce7. The studies by Gerpott and Jakopin (2005, 2007) on mobile network operators are the exception, and none of them sheds light on the subject. Gerpott and Jakopin (2005) found no significant evidence of a positive impact of internationalization degree on mobile network operators’ financial performance, and Gerpott and Jakopin (2007) found that the internationalization movements’ announcements had insignificant effects on the value of expanding operator stock. Even though no conclusive result about the relationship between the degree of multinationality and mobile operator’s performance has been found, in the context of European broadband service there are reasons to think that the relationship may be more significant. Given that European broadband service has experienced large movements of firms within its confines and many of the firms operate simultaneously in several countries, we consider this is a relevant issue that must not be shelved when evaluating the firms’ performance. Moreover, from the limited consensus on the literature regarding the relationship between the degree of multinationality and firm performance, we find highly interesting to test whether or not this relation is relevant for the firms included in this research. Besides, unlike previous studies, special attention is devoted here to the differences between entrants and incumbent firms when analysing the effect of the degree of multinationality on firms’ performance. Regardless if the firm is incumbent or entrant, when comparing multinationals and national firms, multinationals gain knowledge as they enter into new countries (Ghoshal, 1987), develops global strategies affecting national markets not necessarily responding to conditions of that specific country, and has higher bargaining power when purchasing, for instance, equipment (Sarkar et al., 1999). But multinationals also face some costs and risks inherent to the internationalization process. The resulting balance between benefits and costs will determine the positive or negative impact of the degree of multinationality on firm’s performance. At its early times, broadband services in the EU were mainly provided by the incumbent operator of each country. With the opening of the access to the incumbents’ infrastructure, both incumbents and entrants started their expansion process at European level looking for new business opportunities. Firms’ position as incumbent or entrant plays a key role on their performance especially in a market characterised by vertical relations. Moreover, depending on whether the firm is an incumbent or entrant, its market knowledge will differ. Incumbents have
7 Jakopin (2008) presents a literature review and research agenda on internationalization in telecommunications services industry where the majority of the contributions are of a descriptive nature, and a rather limited number of papers (besides the econometric work on international telephony) has empirically tested hypotheses.
5
a better knowledge of the local market than entrants, as the former have years of experience and valuable accumulated experience of that market (customers, regulations, doing business, etc.). Hence, being the knowledge a potential gain from the internationalization process (among others), our hypothesis is that the resulting balance between the gains and losses from multinational status is different between incumbent and entrants firms. Therefore, we aim to test if the multinational status of firms has a significant impact on performance by taking into account the differences between entrants and incumbent in the market. Summarizing, while an inverse relation is expected between access prices and entrants’ performance, this relation in the case of the incumbents may depend on the combined effects at both, the retail and the wholesale level. Moreover, this study allows us to test the importance of firms’ multinational status on their performance by considering differences between incumbents and entrants. Next we present the empirical strategy and the data used to test these hypotheses. 3. Data and Empirical Strategy In this section we present the empirical strategy and the data used to test the effect of regulation and firms’ multinational status on European telecommunication firms’ performance. We first present the general approach in a single equation to explain the variables used (section 3.1). Then, once the relevance of the incumbency in the context of this study is taking into account, we present the final equation we estimate (section 3.2). 3.1. General Approach and Variables Eq. (1) represents the performance of firm i holding operations in country j at time t (Perfijt) as function of the country regulated access price (Pjt), the firm’ group multinational status (MNgt) and other firm and country level characteristics.
Perfijt = α1 Pjt + α2 MNgt + α3 Xijt + α4Zjt + α5 Fi + α6 Cj + α7Yt + εijt (1) Since we are evaluating the effect form country level (Pjt) and group level (MNgt) variables on a firm level and time variant variable (Perfijt), special attention is devoted to control for other determinants of firm performance at firm (Xijt) and country (Zjt) level. We also control for non observable time invariant firm (Fi) and country specific effects (Cj), as well as non observable country invariant time specifics effects (Yt). Therefore, our database is composed by firm, group, and country level information for the European broadband market over the period (2002-2010). We mainly rely on the names of firms offering xDSL services in different countries based on the data provided by Point Topic’s Global Broadband Statistics. As for the number of subscribers in 2009, our database accounts for 98% of the number of subscribers reported by the European Commission Communication Committee Working Document on “Broadband access in the EU: situation at July 2009”. The previously mentioned database is completed with information from the National Regulatory Agencies and firms’ Annual Reports (from Amadeus database8) to validate the entry date and the time firms had been operating in each country. Below we explain the variables used to estimate Eq. (1). 8 Bureau van Dijk, Amadeus http://www.bvdinfo.com/Products/Company-Information/International Amadeus
6
3.1.1 Firms Performance Firms’ performance (Perfijt) is approximated by three different measures. The first measure is the retail market share the firms have in each country and period (Market Share). While the regulation takes place at wholesale level, the effect on consumer welfare is observable at the retail level. Thus, approximating firms’ performance by their retail market share allows us to observe the firms activity at a level where a big part of the policy implications are evaluated. The second proxy of performance is firm operative turnover9 in each country and year (Turnover). This measure is especially important from the vertically integrated nature of incumbents which not only compete in the retail market but also provide inputs to the entrants at wholesale level. Therefore, firms’ turnover allow us to quantify the effect of regulation on firms’ performance beyond what its observable in the retail market through the market share, and evaluate the prevailing effect over the incumbents’ performance. Finally, the third proxy of performance is firm productivity (Productivity) measured as the turnover per employee (labour productivity) in each country and year. The wholesale access price represents the cost of capital inputs for entrants and the return to fixed capital for incumbents. Therefore, by approximating performance with labour productivity we can test if the cost and the return of capital have relevant effects on the efficiency in the use of labour. The expected effects of access prices on productivity are the following: (i) a negative in the case of the entrants (acts over the marginal cost) and (ii) a positive in the case of the incumbents (better remunerated assets can revert to investment in activities, such as in R&D activities and, ultimately, improve the firm productivity). Fig. 1 shows the evolution of the average firms’ performance proxies, for both, entrants and incumbents holding operations within European countries. The incumbents’ market share decreased dramatically since new competitors entered into the retail market; they have lost in average nearly 40% of the DSL costumers in nine years. The share of market held by the entrants started at a EU27 average level of 3%, increased continuously until 42% in 2008 when reached its maximum, and stabilized in the last two periods around 40% of the total number subscribers. Fig. 1 Evolution of firms’ performance: EU27 average.
9 For the purpose of this study we could uses either sales or operative turnover (their correlation is 0.999). We uses operative turnover because the number of observations for turnover is higher in our database.
7
Despite what it is observed for market share, the evolution of the incumbents’ turnover tells a slightly different story. Incumbents faced in average a backward of 25% in their turnover when new firms entered; however, right after that, their turnover stabilized reaching an average lost of only 17% with respect to their position before they faced competition. Meanwhile, as in the case when the market share is the proxy of performance, the entrants’ turnover evolution reflects an upward trend during the period covered in this study. After a tough beginning, where the entrants lost in average 40% of their turnover during the first year, they recovered to the point that, in nine periods, they have quadrupled their average turnover. The evolution of the firms’ productivity (measured as the turnover per employee) adds additional information on the European telecommunication firms’ performance. The main feature of this variable is that, unlike the two other performance measures, the incumbents productivity show in average lowers levels than the entrants, i.e. in average the entrants are more productive than the incumbents (for all periods but the first one). In the case of incumbents, in spite of the loss suffered in their turnover and market share, on average the incumbents’ productivity actually almost doubled during the period covered in this study. In the case of the entrants, the average productivity grew dramatically until 2007 when reached levels ten times higher that those at the beginning of the period. Next periods of decrease and recover left the productivity of the entrants by 2010 at an average level seven times higher than those at the beginning of the period. 3.1.2. Regulation We use two regulated price measures as proxy of regulation (Pjt) variable. Data on prices (Price) comes from European Commission “Report on the Implementation of the Telecommunications Regulatory Package” for the years 2002 to 2010. The two measures are the prices of Full ULL and Shared Access, which represents the total average cost on yearly bases including the monthly rental and the connection charges per unbundled loop. More precisely, we use the European Commission estimates of the total average cost based on the total cost for the first year of access. The evolution of these two prices is described in Fig. 2 for the average of European countries over the period covered in this study. Fig. 2 Evolution of the access prices and coefficient of variation: by country and EU27 average.
8
The difference in levels between the two prices comes from the use that each type of access makes of the incumbent infrastructure. While accessing by Full ULL allows the entrant the exclusive use of the incumbent loop and the possibility of a high level of product differentiation, under Shared Access the entrant installs its transmission equipment to the incumbent infrastructure and the loop is shared by the incumbent (who provides telephony service to the consumer) and entrant (who provides broadband services through the high frequency channels of the same line). Over time both access prices decreased (see Fig. 2). The EU27 average of the Full ULL price went from 19.73€ in 2002 to 11.33€ in 2010, and the Share Access went from 14.70€ to 4.76€ in the same period. However, when analyzing the dispersion of prices important differences arise. While both prices started with the same coefficient of variation, around 0.3 in 2002, the Full ULL price dispersion decreased to 0.2 in 2010, while the Shared Access price dispersion increased up to 0.5 by the end of the period.10 In other words, the total average cost of access to the loop by Full ULL decreased over time with a decreasing dispersion, and the total average cost of access to the loop by Shared Access also decreased over time but with an increasing dispersion between the EU27 countries. As pointed out by Grajek and Roller (2012) regulatory outcomes, such as unbundling policies and mandatory access prices, might be subject to a possible endogeneity problem. For instance, when a regulator’s objective is to promote competition to the benefit of the consumer, it might provide cheaper access to stimulate the entry of new players in the market. Hence, regulated access price might be determined by regulators in response to the performance of firms operating in the country. To avoid this possible problem of reverse causality, and given the lack of data to deal with the problem in a more conventional way,11 we opt for introducing our main explanatory variable, regulated prices, lagged by one period. This empirical strategy to partly overcome possible endogeneity problems is based in the empirical observation that, maybe due to consistency of regulatory policies, current prices are very likely to be highly correlated with past values (see Figure 2). Moreover, using the lag values of prices accomplish the exclusion restriction with respect our dependent variable given that it is reasonable to assume that current firms’ performance it is less likely to be determined by past regulatory decisions than by current regulatory decisions. 3.1.3. Multinational Status The ownership information in Amadeus Database enabled us to identify which firms belong to corporate groups providing broadband services in more than one country (multinationals) and what firms do not belong to corporate groups (providing services only in the country observed). The national or multinational dimension of firms can be incorporated into the analysis in different ways, and each of them will allow us to answer different questions about 10 We compute the coefficient of variation (standard deviation over mean) of both prices for every year in our sample. See Appendix I for prices yearly statistics including the coefficient of variation. 11 As alternative approach to deal with this possible endogenerity problem we identify that shocks in technology affecting broadband speed could be used as an instrument for access price. First, if regulated access prices are set by looking at the cost of providing the access, a shock in technology (i.g. new technology that increase the network speed) must be translated to a change in regulated prices. Second, the shock is exogenous to firms’ performance if all firms in the market provide service at the new speed at the same time, because there is no room for strategic behaviour by firms. Unfortunately, homogeneous statistics on speed from different sources (like ITU, EU, OEDC, as well as other private data provider’s sources) date only backs up to 2006. Thus, the use of this instrument, although potentially correct from a methodological perspective, would imply to neglect the first (and important) years after the access regulation policy was implemented (see Figure 2), which were characterized by mayor changes on both firms’ performance and regulated prices.
9
the effect of multinationals on firms’ performance. The simplest approach is a dummy variable indicating whether the firm is part of a group or not, taking the value 1 if the firm belongs to a multinational group and 0 otherwise. If the variable is defined in this way it is equivalent to classify firm between nationals (when the dummy equals 0) and multinationals (when the dummy equals 1), thus evaluating possible differentiated performance between nationals and multinationals firms. Given that we have firm level information on each country in which the firms operate, instead of the dichotomous variable we use a counting (discrete) variable capturing multinational status (MNgt) with the number of firms each group has. When a group has N firms (because it operates in N countries) the value of the multinational status variable for each of the group’ firms will be N. In this context, non-multinationals firms are a special case where the number of firms in the group (N) equals 1. Fig. 3 shows the evolution of the multinational status (MNgt)12 characterising European DSL providers when considering the EU27 mean values for incumbents and entrants. At the beginning of the period the service was only provided by national firms. As the time went by, the number of countries in which the telecom groups operate grew, both incumbents and entrants expand. On average the incumbents’ expansion was stronger and lasted longer than that of the entrants. While entrants stabilized in 2006-2007 with an average of 2.2 firms per group, incumbents’ expansion process continued reaching the maximum of 3.1 average firms per group in 2008, to slightly decrease during the last two period of our sample. Fig. 3 Evolution of the multinational status: EU27 average.
3.1.4. Firm Level Controls The set of time variant firm level variables (Xijt) controls for scale and scope economies, as well as technology diversification. From the traditionally monopolized infrastructure nature of telecommunications services, the scale is one of the key dimensions of firms to take under 12 The firm’s group multinational status (MNgt) variable it is equivalent to one of the most frequently used structural measures of internationalization degree, named, the number of countries in which the group operates (see Dörrenbächer, 2000 for a review on measuring internationalization). From the introduction of this variable into the analysis we can evaluate possible differentiated performance of firms depending on their groups’ international diversification degree.
10
consideration when analysing their performance. Persistent scale economies permits to relatively large providers to supply services at lower average cost per subscriber that those with relatively small size. Therefore, we should expect a positive relationship between the scale and the performance of the firm in presence of scale economies. To test this relation the firms’ scale is proxied by its number of employees (Nº Employees). If the firms’ performance is approximated by the labour productivity we control instead for the fixed assets per employee (F Assets per Emp)13. Scope economies occur when costs are reduced by the provision of two or more services jointly rather than a single one; it is more efficient to produce outputs by a single diversified firm than splitting up the production of each output. In the case of telecommunications providers, the catalogue of services that are more frequently supplied in addition to the xDSL broadband include home phone, mobile phone, and IPTV. Thus, to analysed whether the jointly provision of services has an effect on providers’ performance in the context of this study, we proxied scope economies by a dummy variable for service diversification (Diver Service) representing whether or not the firm is provider of any other of the previous mentioned telecommunication services. In addition, we also included the technology diversification as a firm level determinant of the European broadband providers’ performance. Alternative access technologies allow for some degree of product differentiation, for instance, Cable and FTTx allow higher transmission rates, which also have more symmetric download (and upload) capacities than xDSL. Therefore, since the technology diversification allows product differentiation, and this can be an advantage for the firm over its competitors, a positive relation can be expected between the firms’ theological diversification and performance. Here, the technology diversification is introduced a dummy variable (Diver Tech) taking value 1 if the firm provides broadband services through another technology besides xDSL (as Cable or FTTx) and 0 otherwise. Firm level variables are useful as controls, but their sign and significance also provides additional information on performance determinants in the broadband sector. Thus we can test whether there are scale and scope economies or not, and if the technology diversification is relevant to firms’ performance. 3.1.5. Additional Controls Country level variables (Zjt) include population density, per capita income (GDPpc), and broadband penetration. While population density (Pop Dens) account for differences on infrastructure cost of providing services, income and broadband penetration rate (BB Pen) helps to control for different market potential across countries. The information for population density and per capita income comes from Eurostat database, and data on broadband penetration rate is extracted from the International Telecommunication Union.14 Time invariant firm (Fi) and country (Cj) controls aims to capture all those effects that are specific to a firm or to a country that we cannot observe, but which might exert some influence on the firms’ performance.
13 This is for consistency with a production function approach. 14 To avoid possible problems of multicollinearity between GDPpc and BB pen, given that previous studies in the literature on economic growth report a positive relationship between these two variables, (see Koutroumpis, 2009; Czernich et al., 2011), we make use of the broadband penetration rate with one period lag.
11
3.2. Incumbency In the context of this study, one of the most important considerations about firms is their incumbency (being entrant or incumbent in the country in which operates). Differences between entrants and incumbents can be captured by performing separate estimations for these two broad types of firms. Unfortunately, from the limited number of firms operating in the market and, specifically, in the case of incumbents, if we follow this strategy when estimating the incumbents’ performance equation the number of observations become rather small (162 observations). Besides, we also introduce year, country and firm fixed effects that reduce the degrees of freedom of the performed estimations. Alternatively, we follow the approach of introducing a dummy variable (IncD) indicating whether the firm is entrant or incumbent in the market. IncDij takes the value 1 if the firm is the country incumbent and 0 otherwise. Thus, the IncDij variable controls for firm’s characteristics that are specific to all incumbents and make them different from entrants independently of the country in which their operations are hold. As previously mentioned it can be expected that there will be different effects of access prices (Pjt-1) and firms’ group multinational status (MNgt) on firms’ performance depending on their position as incumbents or entrants in the market. Therefore, we proceed in our analysis as shown in Eq. (2) with the introduction of both the interaction between the access prices and the firm status as entrant or incumbent in the country (Pjt-1*IncDij), as well as the interaction between the firms’ group multinational status and its position as entrant or incumbent in the country (MNgt*IncDij).
Additionally, for consistency and interpretation purposes of the estimated results, the multinational degree (MNgt) and the lagged access prices (Pjt-1) are also introduced into the analysis. Thus, the effect of group is captured by two variables: the multinational status (MNgt) and its interaction with the IncDij (MNgt*IncDij), and the effect of regulation is captured by two variables: the access prices (Pjt-1) and its interaction with the IncDij (Pjt-1*IncDij). It is important to highlight that during the period covered in this study two of the EU27 incumbents (in Italy and UK) were vertically separated. Since our hypotheses rely on the vertical integrated nature of the incumbent firms, observations of those incumbents were excluded from our estimations for the years after the separation. All variables (except for the dummies and ratios) are measured in logarithms, and monetary variables are expressed in thousand constants 2006 € (except for prices that are in 2006 €). Table 1 shows the summary statistics of the variables. 4. Results In order to analyse the impact of access price and multinational status on firms’ performance we use the performance equation (Eq. 2) to undertake the estimation of six models corresponding to the three performance variables and the two access prices explained above. We are particularly interested in testing whether the influence of regulated prices and
12
multinational status on firms’ performance is different between incumbents and entrants. In all estimations we use firm and country fixed effects to control for time invariant determinants at firm and country level, as well as time fixed effects to control for any EU-wide time-trend in the data. The analysis of the effects on incumbents and entrants performance from access price is undertaken by computing the price elasticity15 and from multinational status the marginal effect. Table 1 Summary Statistics Variable Obs Mean Std. Dev. Min Max
We estimate Eq. (2) by means of panel data techniques and report the within estimator results16 in Table 2. The first two columns correspond to results on the determinant of the firms’ Market Share with Full ULL and Shared prices respectively. Likewise, the two columns in the middle correspond to results on the determinant of the firms’ Turnover, and the last pair of columns refers to firms’ Productivity. Overall, results from estimations of Eq. (2) support a significant effect of access prices (lagged one period to avoid possible problem of reverse causality) on firms’ performance (see Table 2). In the case of the entrants while both prices (Full ULL and Shared Access) exert a negative and significant effect on entrants market share, only the Full ULL price is significant in the case of entrants’ turnover, and none of the prices are significant determinants of entrants’ productivity. In the case of the incumbents only the Shared Access price has a positive and significant effect on their market share, and the effect of both prices on their turnover and productivity is positive and highly significant.
15 Given the introduction of interaction terms, the price elasticity is not directly observable through the simple observation of the estimated coefficients. Following the chain rule we compute the elasticity at the mean performance (of incumbents and entrants) and at the mean price (also holding other variables at their sample means). When firms’ performance it is approximated by the market share, we first calculate the semi-elasticity to account for the semi-log nature of Eq. (2), and then we compute the percentage points resulting from the evaluation of the semi-elasticity at incumbents and entrants sample mean. 16 We address heteroskedasticity with robust standard errors. See Appendix II for homocedasticity test and additional diagnostics test results confirming stationarity of the series.
13
Table 2: The effects of regulated access price and multinational status on firms’ performance
Price t-1 -0.0877** -0.0365** -0.300* -0.0271 -0.104 0.122 (0.0342) (0.0159) (0.261) (0.149) (0.205) (0.0921) Price t-1 x IncD 0.0859* 0.0997*** 0.707** 0.356** 0.551** 0.203* (0.0450) (0.0319) (0.277) (0.145) (0.251) (0.111) GDPpc -0.0296 0.00692 0.610 0.632 1.259*** 1.214*** (0.0598) (0.0634) (0.477) (0.476) (0.446) (0.435) BB Pen t-1 -0.0632 -0.184 -0.279 -0.355 -0.916 -0.769 (0.232) (0.255) (1.175) (1.139) (1.514) (1.515) Pop Dens 0.591 0.595 1.201 0.00299 -0.353 -2.246 (0.436) (0.414) (1.697) (1.871) (1.723) (1.791) Constant -3.012 -3.512 -2.841 2.890 -6.129 4.385 (2.650) (2.603) (10.49) (10.78) (10.02) (9.910) Observations 376 375 374 373 374 373 R-squared 0.983 0.984 0.968 0.967 0.885 0.885 Note: Dependent variables are Market Share, Turnover, and Productivity. All estimations are controlled by firm, country and time fixed effects. Regulated access prices are lagged one period to avoid possible problem of reverse causality. Robust standard errors in parenthesis.
14
While wholesale prices have a significant and negative effect the entrants’ market share, only the Shared Access price has a significant and positive effect on the incumbent retail market. Table 3 reports the price elasticity of firms’ performance at the sample mean resulted from the estimated models. These results indicate that, holding other variables at their sample means, a 1% increase in the wholesale prices will translate in a loss between 2.1 (in the case of Shared Access) and 7.5 (in the case of Full ULL) market share points for the entrant and in a gain of 7.5 market share points for the incumbents (in the case of Shared Access). Table 3 Price Elasticity
Market Share Turnover Productivity Full ULL Shared Access Full ULL Shared Access Full ULL Shared Access
Elast on Entrants -0.0757** -0.0211** -0.0568* -0.0034 -0.0453 0.0358 Elast on Incumbents -0.0031 0.0749** 0.0734*** 0.0398*** 0.1923*** 0.0938*** Note: When firms’ performance it is approximated by the market share, the table shows the market share percentage points resulting from the evaluation of the semi-elasticity at incumbents and entrants sample mean. As in the main estimations, price elasticities are calculated with regulated access prices are lagged one period to avoid possible problem of reverse causality. On the one side, the turnover of entrants is statistically significant influenced by wholesale prices only in the case of Full ULL. On the other side, both prices have positive and significant effects on incumbents’ turnover. Thus, turnover price elasticity (see Table 3) indicates that while a 1% increase in the Full ULL price will translate in a 5.6% loss of entrants’ revenues and an 7.3% raise of the incumbents’ revenues, with a 1% increase in the Share Access price the entrants will loss 0.3% (although not significant) and the incumbent will gain 3.9% more revenues. Access prices exerts positive and significant effects on the incumbents productivity and non significant on that of the entrants. Thus, result on the price elasticity of productivity indicates that, holding other variables at their sample means, a 1% increase in the wholesale prices will translate in productivity enhance of incumbents providers between 9.3% (in the case of Shared Access) and 19.2% (in the case of Full ULL). Regarding the multinational status impact on firms’ performance, results shows that only when the entrant operates in three or more countries it performs significantly better in terms of its market share than a non-multinational entrant. In addition, a multinational entrant with operations in two countries performs significantly worst in terms of turnover and productivity than a non-multinational entrant. Table 4 reports the estimated marginal effects of the firms’ multinational on firms’ performance measures. These are the marginal effects when comparing the base level of non-multinational firms with multinationals firms among their different status (while holding other variables at their sample means). Thus, in the entrants case, results indicates that when the firm is a multinational with operations in three countries its market share is around 4% higher than when it is a non-multinational firm. Likewise, if the multinational holds operations in fourth to six country its market share is between 9.6% and 13% higher than when it is a non-multinational firm. Multinationals entrants with operations in two countries have both significantly lower turnover and productivity than non-multinationals; the turnover is between 1.7% lower and the productivity is 3.5% lower. Results concerning the multinational status effects on incumbent performance shows, on the one hand, that when the firm operates in three, five or six countries results are significantly worst in terms of its market share than non-multinationals (between 12% and 16%). On the other hand, result shows that if the incumbent operates in five countries its turnover is around 3% higher that if where non-multinational. In addition, when the incumbent operates in three or
15
more countries it performs statistically significant better (between 4.5% and 9.5%) in terms of its productivity than a non-multinational incumbent. Overall, these results confirm that firms’ multinational status has a significant impact on their performance, and that this impact is different for incumbents and entrants. Table 4 Multinational Effects (from the base level of one country)
Market Share Turnover Productivity Nº Countries Full ULL Shared Access Full ULL Shared Access Full ULL Shared Access Entrants 2 0.00836 0.00677 -0.0173** -0.0175** -0.0357* -0.0348*
For further analysis of the wholesale prices impact on firms’ performance, we computed the price elasticity at the mean performance of nationals and multinationals firms (both for incumbents and entrants). In general, results shows that multinational firms performance is less sensitive to changes in wholesale prices than national firms, the price elasticity of is lower (in absolute value) for multinationals than for nationals firms (see Table 5). Table 5 Price Elasticity: Differences between national and multinationals firms
Note: Significance of differences between national and multinational firms comes from Wald tests under the null hypothesis that price elasticity is equal for both. As in the main estimations, price elasticities are calculated with regulated access prices are lagged one period to avoid possible problem of reverse causality. On the additional firm level control variables results validates that the firms included in this study exhibits significant economies of scale (this result holds for the three performance variables used). Service diversification exerts a significant effect only when the firms’ performance is approximated by their market share. At last, results do not confirm the existence of significant performance enhanced effect from firms’ technological diversification, this probably responds to the fact that during the period covered in this study this type of diversification was rather low (on average 20% of the firms were diversified). Finally, results on additional country level control variables shows only significant effect from income per capita in those cases when the firms’ performance is captured by turnover and productivity, indicating that firms perform better in countries where subscribers have relatively higher acquisitive power. The absence of more significant results from country level variables is possibly consequence of the inclusion of both country and firm level fixed effects.
Market Share Turnover Productivity Full ULL Shared Access Full ULL Shared Access Full ULL Shared Access
Elast on Entrants Nationals -0.0764** -0.0219** -0.0586* -0.0036 -0.0462 0.0374
5. Discussion The results on the estimated effects presented in previous section are different depending on the various dimensions of the analysis: the performance measure (market share, turnover or productivity), the incumbency of the firm (entrant or incumbent), the wholesale access price (Full ULL or Shared Access), and the multinational status. In this section we undertake the discussion of the estimated effects that the regulated wholesale access prices and firms’ multinational status exert over firms’ performance taking into accounts all its dimensions. The negative effect that wholesale access prices exert over entrants market share indicates that, when observing directly the retail market competition dynamic, the empirical hypothesis of an inverse relation between regulated prices and entrants performance is confirmed. These results are highly consistent with the wholesale access policy developed within the European broadband context during the period covered in this study, which aimed to increase entrants’ participation at retail level and enhance retail competition by means of a cheaper access to the incumbent network. In general, the difference in the estimated effects of Full ULL and Shared Access prices is possibly explained from the use that each access type made of the incumbent infrastructure. Entrants market share are more sensitive to Full ULL because to they need to devote more resources to access to the input (the access price level is higher) and need to undertake higher investments to made use of this wholesale access product which allows a higher degree of diversification. Moreover, the significant effect on entrant turnover from Full ULL price but not significant from Shared Access price, might be driven by the price elasticity that Full ULL has over the entrants’ market share, which as pointed out above, is relatively high with respect to the one of the Shared Access. The counterpart of the declining wholesale access prices policy is the effects that these had over incumbents’ performance. Beyond the ‘desirable’ effect observed at retail level as decreasing incumbent market share (from its positive relation with Full ULL price), there are also those effects from the positive relation between the wholesale access prices and their turnover and (specially important) their productivity. From the empirical hypothesis the expected effect of a increase in wholesale access prices is that, the incumbents wholesale profits will decrease if the quantity of access bought by entrants goes down proportionally by more than access prices goes up, which depends on elasticities. Estimated wholesale price elasticity on retail entrants market share seems to confirm that this condition is meet, the change in access bought by entrants is proportionally higher than the change in wholesale price. Therefore, at wholesale level the estimated relation between the regulated price and incumbent turnover is negative. Nevertheless, the total effect on incumbent turnover comes from combination of both the retail and the wholesale effects. Consequently, estimated results of a positive and significant wholesale price elasticity of incumbent turnover seem to be indicating that the prevailing effects acting over the incumbent turnover is the retail market effect. The positive and strong estimated effect of regulated prices on incumbents’ productivity deserves special attention. For incumbents, wholesale access prices represent the remuneration of its infrastructure assets, thus, by declining these prices remuneration worsens, which may not be reversed in investments on infrastructure and other activities such as R&D activities, which ultimately could improve the firm productivity.
17
It is important to highlight that while the incumbent market share is not significantly influenced by Full ULL price, the negative relation in the case of entrants is significant (mainly) in terms of their market share. Therefore, policies oriented to promote competition in retail market can be effective by altering this price with a minimum extent of impact over the incumbent market share. Nevertheless, the incumbents’ productivity is significant and highly sensible to the wholesale access prices (particularly in the case of Full ULL access). Hence, there is a trade-off between favouring entrants in terms of market share and incumbents performance in terms of turnover and productivity. Consequently, great attention must by pay to the effect of policies in other dimensions of the firms different than those to which the policies are directed. Regarding on multinational status effects on entrants and incumbent performance, results seems to confirm the hypothesis that the resulting balance between the gains and losses from multinational status is different between incumbent and entrants firms. On the one side, for entrants the positive effect on their market share represents the possible gains from operating in more countries. However, the negative on their turnover and productivity seems to be indicating that the positive effect on the market share coming from operating in more countries are overweighed by the cost incurred when expanding their operations, resulting in a negative impact on both turnover and productivity. On the other side, multinationals incumbents performs worst than the non-multinational ones in terms of their market share in the market holding the incumbency, this is possible a consequence become active in more attractive opportunities from new markets at the expenses of a decrease in the incumbents interest on its original market. Nevertheless, superior results of incumbents’ turnover and productivity seems to be capturing all the positive effects of the international expansion through the entry into other countries. In addition, when evaluating the price elasticity at the mean performance of nationals and multinationals firms (both for incumbents and entrants), we find that multinational firms performance is less sensitive to changes in wholesale prices than national firms. These results, in line with the theoretical approach of the finance theory of portfolio, might be indicating that, through the international diversification of their operations, multinationals can cover wholesale access price risks more easily. Finally, with respect to the additional controls variables we use, economies of scale and service diversification deserve special mention. First, economies of scale exerts a positive effect on all three performance indicators we evaluated, this leaves an open room for the discussion on the preferred composition of the sector, one with few big firms or one with several small firms. Second, service diversification exerts a significant effect only when the firms’ performance is approximated by their market share. Thus, firms’ which aims to gain bigger stake of the market might achieve it by providing more than one service to its subscribers, that is, by exploiting the scope economies present in the sector. 6. Conclusions In this study we test empirically the effects of regulated access price and firms’ multinational status on firms’ performance. The analysis is performed using firm, group, and country level information for European broadband market over the period (2002-2010). Three measures of firms’ performance are used, namely; market share, turnover and productivity. Special attention is devoted to differences in the effects on performance measures depending on firms’ position as incumbent or entrant in the markets.
18
The empirical hypotheses regarding access price effects on incumbent and entrants are confirmed by the results, a negative effect on entrants’ performance and positive one on the incumbents. Our results indicate that the effect that prevails in the relation between the wholesale access prices and the incumbents' performance is positive. Even though the impact of wholesale access prices on incumbents’ performance can be negative at the wholesale level (driven by the negative wholesale price elasticity on entrants retail market share), the effect coming from the retail level is positive (on incumbent market share). Hence, the latter seems to be driven the total positive effect over the incumbent turnover and productivity. Moreover, in the period covered in this study, firms’ multinational status has a significant impact on performance, and this impact is different for incumbents and entrants. We find that, while in the case of multinationals entrants, the positive effect on the market share coming from operating in more countries are overweighed by the cost incurred when expanding their operations, resulting in a negative impact on both turnover and productivity. In the case of multinationals incumbents, the estimated positive impact of multinational degree on turnover and productivity seems to be capturing the positive effects of the international expansion through the entry into other countries although losing market share in their country of origin. Although a number of valuable conclusions can be drawn from this study, certain shortcomings should be noted. First, given data availability, retail subscriber related to each type of wholesale access is not directly observable, hence our results only takes into account differences between Full ULL and Shared access price from the wholesale market perspective. Second, detailed firm-level data on retail prices would enable us to better disentangle the wholesale and retail effects on incumbents performance. References Armstrong, Mark, and David E. M. Sappington. 2006. “Regulation, Competition and
Liberalization.” Journal of Economic Literature 44 (2): 325–366. Cambini, Carlo, and Laura Rondi. 2012. “Capital Structure and Investment in Regulated
Network Utilities: Evidence from EU Telecoms.” Industrial and Corporate Change 21 (1) (February 1): 31–71.
Cave, Martin, and Ingo Vogelsang. 2003. “How Access Pricing and Entry Interact.”
Telecommunications Policy 27 (10–11) (November): 717–727. Czernich, Nina, Oliver Falck, Tobias Kretschmer, and Ludger Woessmann. 2011. “Broadband
Infrastructure and Economic Growth*.” The Economic Journal 121 (552): 505–532. Choi I. 2001. “Unit Root Tests for Panel Data.” Journal of International Money and Finance
20 (2): 249–272. De Bijl, Paul W. J., and Martin Peitz. 2005. “Local loop unbundling in Europe: Experience,
prospects and policy challenges: Unbundling facing new challenges.” Communications & stratégies (57): 33–57.
Denis, David J., Diane K. Denis, and Keven Yost. 2002. “Global Diversification, Industrial
Diversification, and Firm Value.” The Journal of Finance 57 (5): 1951–1979. Dörrenbächer, Christoph. 2000. “Measuring Corporate Internationalisation.” Intereconomics
19
35 (3) (May 1): 119–126. EC. 2009. Broadband Access in the EU: Situation at 1 July 2009.Communications Committee.
Gerpott, Torsten J., and Nejc M. Jakopin. 2005. “The Degree of Internationalization and the
Financial Performance of European Mobile Network Operators.” Telecommunications Policy 29 (8) (September): 635–661.
Ghoshal, Sumantra. 1987. “Global Strategy: An Organizing Framework.” Strategic
Management Journal 8 (5): 425–440. Gomes, Lenn, and Kannan Ramaswamy. 1999. “An Empirical Examination of the Form of the
Relationship Between Multinationality and Performance.” Journal of International Business Studies 30 (1) (March): 173–187.
Grajek, Michał, and Lars-Hendrik Roller. 2012. “Regulation and Investment in Network
Industries: Evidence from European Telecoms.” Journal of Law and Economics 55 (1): 189 – 216.
Hori, Keiichi, and Keizo Mizuno. 2009. “Competition Schemes and Investment in Network
Infrastructure Under Uncertainty.” Journal of Regulatory Economics 35 (2) (April 1): 179–200.
Jakopin, Nejc M. 2008. “Internationalisation in the Telecommunications Services Industry:
Literature Review and Research Agenda.” Telecommunications Policy 32 (8) (September): 531–544.
Kim, W. Chan, Peter Hwang, and Willem P. Burgers. 1993. “Multinationals’ Diversification
and the Risk-return Trade-off.” Strategic Management Journal 14 (4): 275–286. Kotabe M., Srinivasan S.S., and Aulakh P.S. 2002. “Multinationality and Firm Performance:
The Moderating Role of R&D and Marketing Capabilities.” Journal of International Business Studies 33 (1): 79–97.
Koutroumpis, Pantelis. 2009. “The Economic Impact of Broadband on Growth: A
Simultaneous Approach.” Telecommunications Policy 33 (9) (October): 471–485. Levin, Andrew, Chien-Fu Lin, and Chia-Shang James Chu. 2002. “Unit Root Tests in Panel
Data: Asymptotic and Finite-sample Properties.” Journal of Econometrics 108 (1) (May): 1–24.
Nardotto, M., Valletti, T. and Verboven, F. 2012. “Unbundling the Incumbent: Evidence from
UK Broadband.” CEPR Discussion Paper No. 9194. London, Centre for Economic Policy Research. http://www.cepr.org/pubs/dps/DP9194.asp.
Reeb, David M., Chuck C. Y. Kwok, and H. Young Baek. 1998. “Systematic Risk of the
Multinational Corporation.” Journal of International Business Studies 29 (2) (June): 263–279.
20
Ruigrok, Winfried, and Hardy Wagner. 2003. Internationalization and Performance: An Organizational Learning Perspective.
Sappington, David E. M. 2006. “Regulation in Vertically-Related Industries: Myths, Facts, and
Policy.” Review of Industrial Organization 28 (1) (February 1): 3–16. Sarkar, MB, S Tamer Cavusgil, and Preet S Aulakh. 1999. “International Expansion of
Telecommunication Carriers: The Influence of Market Structure, Network Characteristics, and Entry Imperfections.” Journal of International Business Studies 30: 361–381.
Tallman, Stephen, and Jiatao Li. 1996. “Effects of International Diversity and Product
Diversity on the Performance of Multinational Firms.” Academy of Management Journal 39 (1) (February 1): 179–196.
Valletti, Tommaso M. 2003. “The Theory of Access Pricing and Its Linkage with Investment
Incentives.” Telecommunications Policy 27 (10–11) (November): 659–675. Wallsten, Scott, and Stephanie Hausladen. 2009. “Net Neutrality, Unbundling, and Their
Effects on International Investment in Next-Generation Networks.” Review of Network Economics 8 (1) (January 1).
21
Appendix I: Access Prices Yearly Statistics with Coefficients of Variation (CV) Table AI.1: Full ULL Price Summary Statistics
Appendix II: Diagnostics test results To be confident on our estimations results we perform several diagnostics test. We were particularly concern with possible heteroskedasticity as well as nonstationarity of the dependent variables and main variable of interest that are all likely to be trending variables, which can lead to a spurious regression problem. We test for heteroskedasticity with the Breusch-Pagan/Cook-Weisberg test under the null hypothesis that the error variances are all equal versus the alternative that the error variances are a multiplicative function of one or more variables. Results reported in the table below indicate that heteroskedasticity can be a problem in our estimations. Hence, to address this problem results in the main text were estimated with robust standard errors. Table AII.1: Breusch-Pagan/Cook-Weisberg Homocedasticity test
Market Share Turnover Productivity Full ULL Shared Access Full ULL Shared Access Full ULL Shared Access
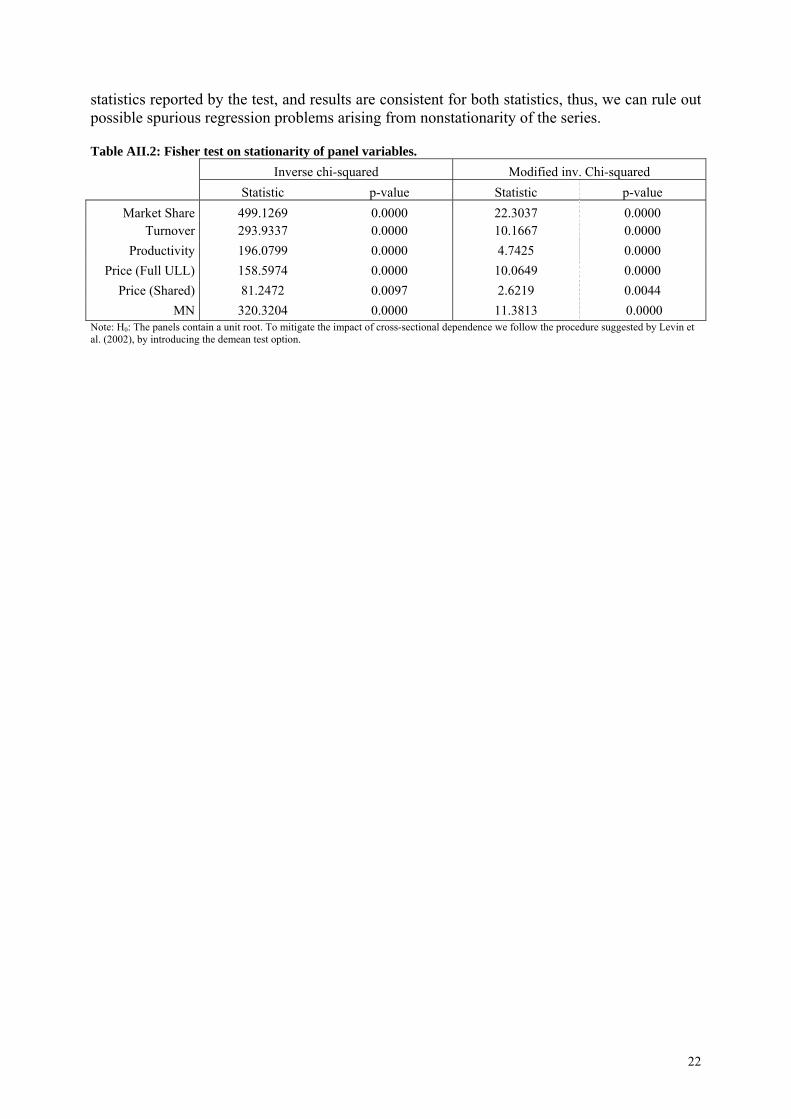
Chi2(1) 5.34 8.20 3.40 3.45 11.47 11.54 Prob > chi2 0.0208 0.0042 0.0651 0.0634 0.0007 0.0007 H0: Homocedasticity, the error variances are all equal. In addition, to rule out possible spurious regression problems arising from nonstationarity of the series we perform Fisher-type test (see Choi, 2001) on performance variables and on the main variable of interest (regulated prices and multinational status). This test is based on augmented Dickey-Fuller tests under the null hypothesis that the panel data structure of each variable contains a unit root. We can reject the null hypothesis that the variables show a unit root from results presented in the table below. Note that in the table we present two of the
22
statistics reported by the test, and results are consistent for both statistics, thus, we can rule out possible spurious regression problems arising from nonstationarity of the series. Table AII.2: Fisher test on stationarity of panel variables. Inverse chi-squared Modified inv. Chi-squared Statistic p-value Statistic p-value
Note: H0: The panels contain a unit root. To mitigate the impact of cross-sectional dependence we follow the procedure suggested by Levin et al. (2002), by introducing the demean test option.