Regulatory requirements in international fish and seafood trade Dr Lahsen Ababouch, Chief Fish Utilization and Marketing Service Department of Fisheries and Aquaculture The United Nations Food and Agriculture Organization Silver Spring, USA. May 2008
Transcript
Regulatory requirements in international fish and seafood
trade
Dr Lahsen Ababouch, ChiefFish Utilization and Marketing Service
Department of Fisheries and AquacultureThe United Nations Food and Agriculture
• GATT (1948, Article XXII:b)• Codex Alimentarius (FAO/WHO, 1962)• TBT Agreement (GATT, Tokyo Round, 1974-1979)• Code of Conduct For responsible fisheries (FAO, 1994.
Article 11)• FAO COFI and its two sub committees• SPS/TBT Agreements (WTO, 1995)• ISO 9000:2000 (QMS) and 22000:2005 (FSMS)• International Principles for Responsible Shrimp Farming,
2006• FAO Guidelines on Eco-labeling for wild capture fisheries• FAO Guidelines for Aquaculture Certification
International regulatory Framework
SPS/TBT Agreements
TBT measures can cover any subject related to industrial goods, from car safety to energy –saving devices to food packaging
SPS cover health (human, animal and plant) protection measuresThe TBT Agreement covers all technical
requirements, voluntary standards and the procedures (Conformity assessment procedures) to ensure that these are met, except when these are SPS measures as defined by the SPS Agreement
SPS SPS
vs.vs.
TBTTBT
SPS/TBT AgreementsGeneral Principles
• Sovereignty • Harmonization• Transparency• Equivalency• Scientific basis• Special and differential treatment• Technical Assistance • Consultation and dispute settlement
• Establishment, Recognition and Application of Common SPS Measures by Members
• Members shall base their measures on those developed by relevant international organizations (OIE, CAC, IPPC)
• Measures which conform to international standards are consistent with Agreement
• Members are to fully participate in the work of relevant international organizations
• WTO to monitor progress of international harmonization (SPS and TBT Committees)
Harmonization
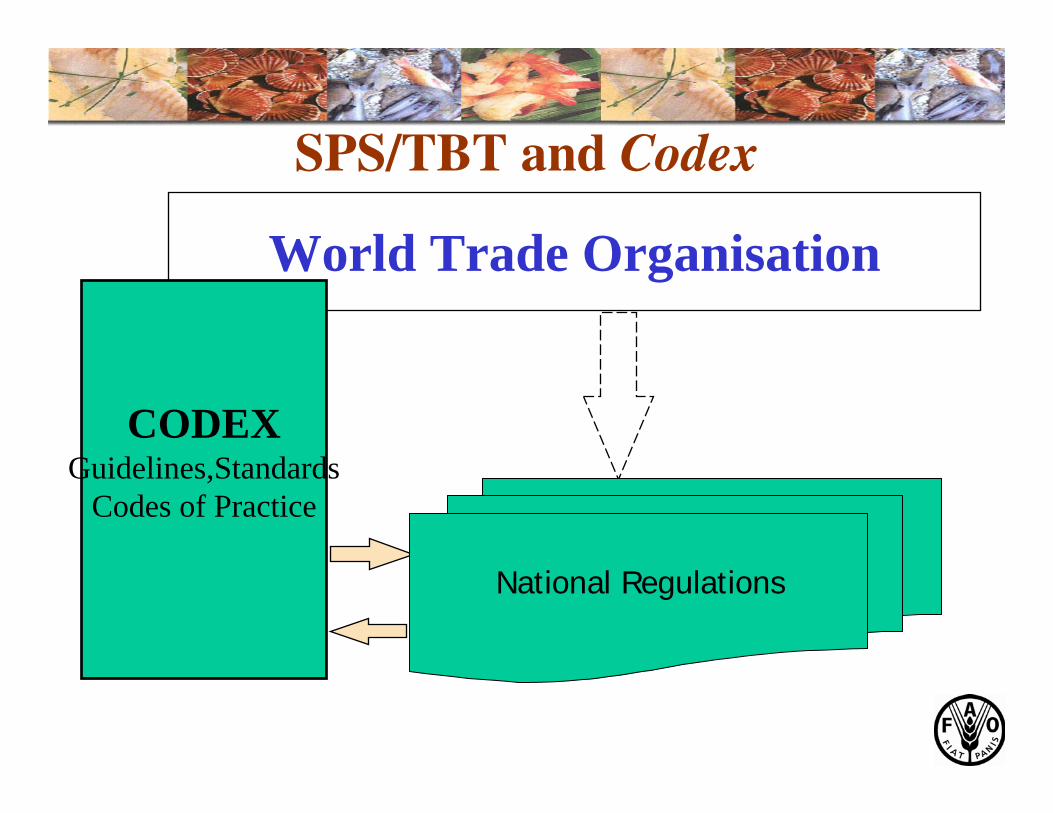
World Trade Organisation
CODEXGuidelines,Standards
Codes of Practice
SPS/TBT and Codex
National Regulations
General Subject Committees
– General Principles (France)
– Import/Export Inspection and Certification Systems (Australia)
– Food Labeling (Canada)
– Methods of Analysis & Sampling (Hungary)
– Food Hygiene (USA)
– Residues of Veterinary Drugs in Food (USA)
– Pesticide Residues (Netherlands)
– Food Additives and Contaminants (Netherlands)
– Nutrition and Foods for Special Dietary Uses (Germany)
Active Commodity Committees
– Fats and Oils (U. K.)
–– Fish and Fishery Products (Norway)Fish and Fishery Products (Norway)
– Milk and Milk Products (New Zealand)
– Fresh Fruits and Vegetables (Mexico)
– Cocoa Products & Chocolate (Switzerland)
– Natural Mineral Waters (Switzerland)
Thank you
Lahsen AbabouchChief, FIIU
Fish products and Industry DivisionDepartment of Fisheries and Aquaculture
The U.N Food and Agriculture OrganizationVia Delle Terme di Caracalla
• Code of practice for food hygiene (GHP, HACCP, Risk assessment)
• Standards for fish and fishery products (Volume 9A)
• Code of practice for intensive aquaculture (GAP, HACCP)
• Several risk assessments (Vibrios in seafood, biotoxins, antimicrobial resistance)
• Several principles and guidelines for food import and export inspection and certification
• MRL for veterinary drugs
• Members shall accept other Member measures as equivalent, if final results are the same ( achieve same ALOP)
• Members shall consult to achieve bilateral and multilateral agreements (Mutual Recognition Agreements)
Equivalence
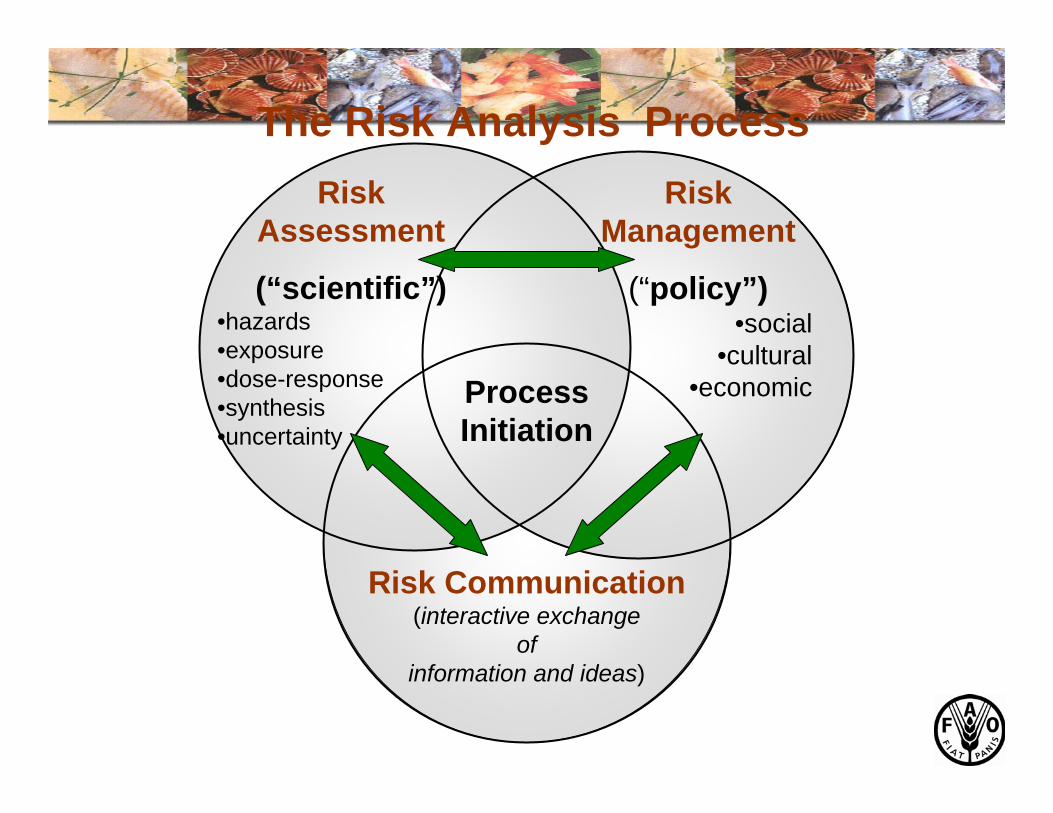
Scientifically based standards
• SPS measures are to be based on the assessment of risks to humans, animals or plants, using internationally accepted risk assessment techniques and taking into account the available scientific evidence
• SPS measures should minimize negative trade effects and arbitrary and unjustified measures should not be considered
• During the discussion of– the Code of Practice for Fish and Fishery Products and – the Proposed Draft Standard for Live and Raw Bivalve Molluscs,
The CCFFP requested scientific advice on biotoxins to be addressed through an FAO/WHO/IOC Expert Consultaion to;
– Provide Scientific Advice for the Establishment of Safe Upper Limits;
– Provide guidance on the application of different methods of analysis concerning each toxin group;
– Monitoring and management of growing areas;
– Geographic Distribution of the biotoxins
Process
• March 04: Planning Workshop in Dublin, Ireland• April 04 : Call for Experts and Data• May – Sep 04: electronic drafting group • Sep 04: Expert Consultation – Oslo, Norway• Feb 05- 27th CCFFP (Cape Town, South Africa):
– presentation of the report– Establishment of an inter-sessions working group to
examine the EC report and prepare a discussion paper for the next CCFFP session
• April 05- Updated draft scientific monographs• April 2006: Meeting of the ISWG (Ottawa, Canada)• September 2006: Presentation at the 28th Session of
CCFFP
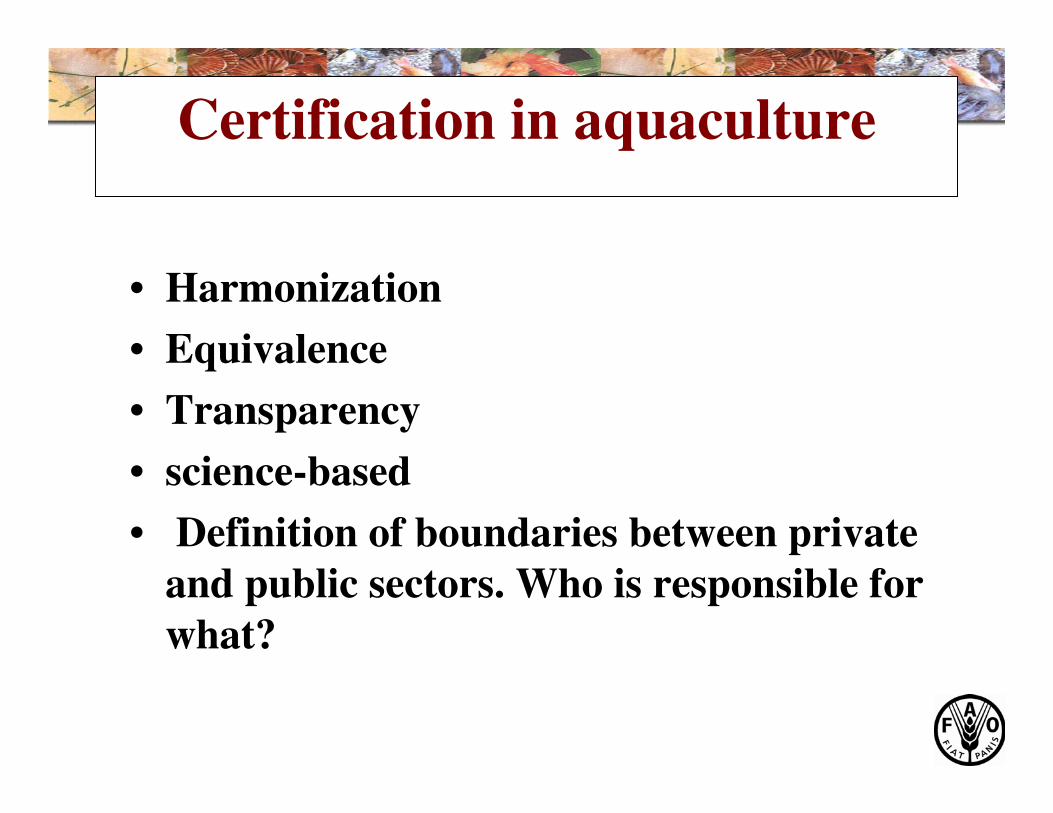
Certification in aquaculture
• Harmonization• Equivalence• Transparency• science-based• Definition of boundaries between private