52

REHAB Tech- Monash Rehabilitation Technology Research Unit assume no liability for anyclaim of adverse effects resulting from misapplication of the information presented here in.While every effort is made to ensure the accuracy of the guide no responsibility or liabilitywill be taken for any inaccuracies.
REHABTech is finance and supported by
In collaboration with
© Copyright 1998All rights reserved. No part of this publication may be reproduced or transmitted in any formor by any means, electronic or mechanical, including photocopy, recording or any informationstorage and retrieval system, without permission in writing from the publisher.Requests for permission to make copies of any part of the work should be addressed to:
REHAB Tech- Monash Rehabilitation Technology Research UnitC/- C.G.M.C.260 - 294 Kooyong RoadCAULFIELD VIC 3162AUSTRALIAEmail [email protected]

CONTENTS:
CHAPTER 1:1.1 INTRODUCTION
CHAPTER 2:2.1 AN INTRODUCTION TO GAIT ANALYSIS
CHAPTER 3:3.1 OUTLINE OF TOTAL DESIGN3.2 STRATEGIES AND IDEAS3.3 ASSESSABLE SECTIONS3.4 OTHER POSSIBILITIES
CHAPTER 4:4.1 VIDEO CAMERA SELECTION4.2 CAMERA/LENS OPERATION
CHAPTER 5:5.1 CIRCUIT DESCRIPTION5.2 VIDEO SIGNAL EXTRACTION
5.2.1 PAL VIDEO FORMAT5.3 SCANNING LIMITS AND VIDEO OUTPUT5.4 TIMING AND ANALOGUE TO DIGITAL
CONVERSION5.5 MOTOR PULSE GENERATION AND SAFETY5.6 LIMIT SAFETY FOR TROLLEY5.7 AUXILIARY CIRCUITS
5.7.1 CRYSTAL OSCILLATOR5.7.2 LED POSITION DISPLAY
CHAPTER 6:6.1 ULTRASONIC DISTANCE MEASUREMENT6.2 BASIC CONCEPT6.3 CIRCUIT DESCRIPTION
CHAPTER 7:7.1 MOTOR SELECTION AND CONTROL7.2 MOTOR SELECTION7.3 MOTOR DRIVING TECHNIQUES
CHAPTER 8:8.1 CONSTRUCTION
CHAPTER 9:9.1 CONCLUSION
CHAPTER 10:10.1 UPDATE 18.1.1996
BIBLIOGRAPHY

CHAPTER 1:1.1 INTRODUCTION
Bipedal walking, the act of human locomotion and one of the definingcharacteristics which separates us from the rest of the animal kingdom, has been asubject of study in one way or another ever since mankind first performed the actitself. The high efficiency with which humans can undertake what amounts to be anincredibly complicated mechanical function is reason enough in itself to stimulatestudy. To appreciate the complexity of the task one must only observe some of thehighly advanced, yet still unwieldy attempts that scientists and engineers have made toconstruct two legged walking machines. Still, researchers in every field find amultitude of reasons to delve deeper into the topic and add to the already enormousvolume of data held on the subject. As a few randomly selected examples;• Prosthetists and Orthotists may want to examine a patients’ gait to improve their
walking style for greater comfort and function.• A biomedical engineer may study gait so as to construct a muscle stimulator to
activate legs left motionless by spinal damage• A chiropractor may study gait to find the source of a patients back pain.• Sports analysts may study a sprinters style to find a faster and more efficient way
for the athlete to run.Gait analysis could be a much simpler science if there existed a definable ’normalgait’, but unfortunately there is no such concept. Every human on earth has a slightlydifferent way of walking. The factors which effect our walking are numerous; apersons height, weight, sex, ancestry, mood, state of health and footwear just to namea few. The lack of correlation does not, however, render all data on gait assessmentuseless even if one style cannot be labelled as ’average’. Patterns still emerge whichare common to all gait styles within subgroups, and models can be produced that fitgiven percentiles of the population. An orthotist does not fit a patient with anapparatus which will conform them to a ’normal’ style of walking, but rather to a gaitwhich is most efficient and comfortable for that individual, and which will not causefurther problems in the future. Trying to correct their gait to a theoretical ’normal’ stylecould cause greater damage.
What this project aims to produce is a tool which will enable professionals toanalyse an individuals walking style in a way not used before. The first questionwhich must be examined is How does one investigate and record someone’s gait?There have been a plethora of qualitative and quantitative inventions to do this sincethe early 1800’s. Complicated stills cameras, interrupted light techniques, insertedpins, motion film, force plates, pneumatic shoes, glass walkways andelectromyographs have all been used, and many more. This project is using a videotechnique for qualitatively recording an individuals gait during a sequence of stepcycles.
%DFNJURXQG
3UHYLRXV$FKLHYHPHQW
Figure 1.1: Example of wireframe plotting Program(Rose P216)

CHAPTER 2:2.1 AN INTRODUCTION TO GAIT ANALYSIS
One of the first (recorded) observations regarding the science of humanmovement was made by Aristotle around 350BC. He noted that “if a man were towalk...alongside a wall (with a reed dipped in ink attached to his head) the line wouldnot be straight but zigzag, because it is lower when he bends and higher when hestands upright and raises himself” [17] . He went on to describe the transfer of bodyweight from side to side during walking, and joint flexion and extension. At the timehis observations remained just that, but later work in the area tested Aristotle’stheories on the subject, and found them to be accurate.
The next notable advancement in human motion analysis occurred in the1600’s. Around the time that Galileo was formulating his laws of motion, and Newtonwas gathering inspiration for his most noted work, Principa, which described the basisof modern dynamics, Giovanni Borelli [17] was applying these concepts in amechanical framework that viewed bones as levers and muscles as forces on thoselevers. He also defined the location of the centre of gravity for humans. Moreimportantly, at this time it was now possible to test such theories experimentally.
Around two hundred years later Wilhelm and Eduard Weber [17] combinedtheir talents (which covered most of the known sciences) to produce some models ofphysiological motion that were widely acclaimed in the field. Using simple toolsavailable at the time (distance measurement instruments and a timepiece) they madeobservations such as head displacements, stride lengths, and dimensions of the limbsin differing degrees of flexion. But more importantly than these measurements werethe complex deductions they made about this data, resulting in a detailed model ofmechanical locomotion. It must be noted, however, that because the availableinstruments were limited, many of the Weber brothers theories were not based ondirect measurements and were later proved to be erroneous in some cases.
In the mid 1800’s physiologists began to construct more complicatedequipment. A major jump forward in technology took place when French physiologistEtienne Marey and student Gaston Carlet [1,5,17] developed a method of obtaining
measurements from the subjectwithout major interference fromthe scientists. They used a specialpair of shoes which had airchambers in the mid metatarsalregion, and thus changes in thepressure were able to be recordedon an instrument carried by thesubject. Later, Carlet added extraair chambers to the shoes andconfined the subject to walk in acircle by using a rotating arm
which would hold the pneumatictubes for recording, and also avail
measurements of vertical and horizontal oscillations from any point on the body.
%&
V
Figure 2.1: Carlet’s device for recording gait usingpneumatic soles and rotating arm (Gamble P205)
3QHXPDWLFVROHV
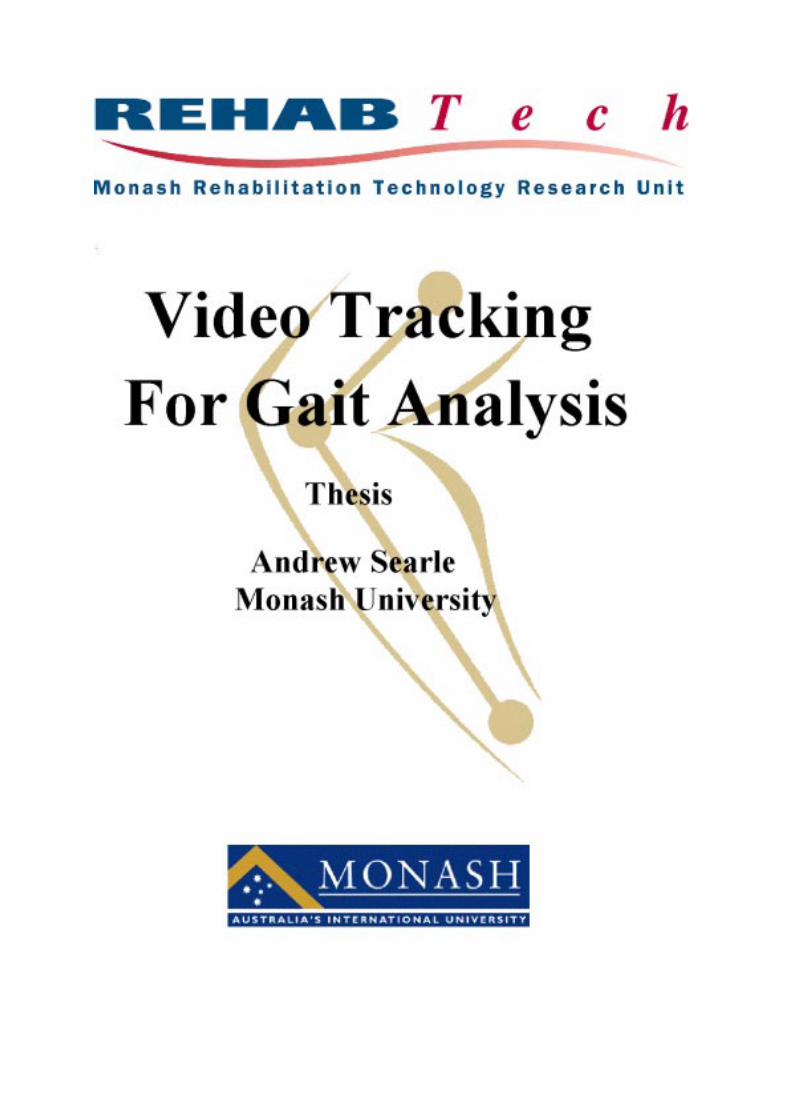
The photographic gait quantifying methods so common today had (as commonwith many scientific advancements) an unexpected origin. Late in the 1800’s the thengovernor of California had a bet with a friend that all four feet of a horse were, atsome instant, off the ground simultaneously. To prove the bet Eadweard Muybridge[1,17] was hired to gather evidence. Muybridge set up a series of electrical switcheswhich would activate sequentially the shutters in a linear array of cameras, placed atthe side of a race track. The resulting photographs won the governor the bet, andMuybridge went on to publish many studies of locomotion using his photographicmethods.
Marey seized upon this idea and constructed a camera capable of exposing thesubject on the same photographic plate many times, rather than using multiplecameras. The special camera rotated the unique cylindrical plate so that sequentialimages were exposed evenly around the outside of the plate.
Problems arose when human walking was to be investigated in detail since thefrequency of images needed caused the exposures in current methods to overlap.Marey fixed this by only photographing essential parts of the body, and dressing thesubject in dark cloth with white stripes on regions of interest. The resulting procedureprovided Marey with plates which showed the succession of white stripes but inwhich the subject was not visible. Thus a pattern of sequenced movements wasrecorded. This procedure was termed geometric chronophotography. Although thisdata was still relatively imprecise, Marey was able to use it to make a basic definitionof the relationship between walking speed and energy expenditure.
German born Wilhelm Braune and Otto Fischer [17], his student, wished toperform an analysis of human movement by modelling the body as a connection of 12linked segments. Using cadavers they found the centre of gravity of each chosen bodysegment, but to complete the study experimental data of the displacement, velocityand acceleration of each segment whilst the body was in motion was required. Thusthe pair needed a method to obtain instantaneous spatial measurements in threedimensions. Since the methods used in the past by Muybridge and Marey yielded onlytwo dimensional information, Braune and Fischer modified the geometricchronophotography method yet again, and set up a laboratory that used a newstereometric process. Their version of stereometry used four cameras, two on eachside of the subject so that each point on the body was viewable from two perspectives.Using this process each pair of two dimensional points could be transformed to onethree dimensional point, and finally the body could be tracked through threedimensional space.
This is not as simple as it sounds however; Braune and Fischer made a specialplotting table to read the points from the photographic prints and coordinates wererecorded by hand. The calculations which resulted took many months to complete.The preparation of the subject was just as important for good results. The volunteer
)LUVW3KRWRJUDSKLF0HWKRGV
Figure 2.2: An example of Marey’s chronophotographymethod (Rose P206)
0DUH\VWHFKQLTXH
6WHUHRPHWU\

was dressed in black and Geissler tubes were used for illumination points that wouldshow up easily on the plates. Geissler tubes consisted of rarefied nitrogen in a smallglass cylinder. Current passing through the gas caused it to illuminate and thus thepoints of light could be strobed electronically to obtain discrete measurements fromthe resulting prints. Black tape was used to secure these to the body, with only the
middle of the tube left uncovered, signifying theanatomical position to be tracked. This laboriouspreparation of the subject could take up to 8hours. Fortunately Braune and Fischer gainedmuch from this work. They were able tocalculate the length of each body segment, thecentre of mass of the body and velocity andacceleration of each joint. Using moments ofinertia of body parts (gained from previouscadaver studies) and calculations of inertia ofcentre of mass of those parts, forces acting on thejoints could be computed. Furthermore, the dataon these forces enabled the pair to find muscleaction present on each segment.
At the University of California [17] in 1945, the Engineering and MedicalSchool wished to undertake an accurate study on movement, focussing especially onthe rotations in the transverse plane. In order to study pelvic and lower extremityrotations pins were surgically implanted into the pelvis, femur and tibia of subjects.Using 35mm film and interrupted light techniques in conjunction with two (straingauge) force plates the team was able to do the most comprehensive study of the time,and the data accrued was invaluable as abasis for comparisons of amputee andvarious other pathological gaits.
The basic ideas that governmodern photographic techniques remainthe same as those used in Marey’s times,as do the problems that encumber theprocedures. Modern film and videomethods have the advantages of fasterframes rates and high quality recordingequipment. Thus with faster imagerates, more accurate data can be liftedfrom the media. It has been shown instudies [13,18,19] that for a study of walking, 25 samples per second is sufficient foraccurate representation, with little difference from data obtained at double this rate.However, this project endeavours to produce a visual record rather than amathematical one, and for human vision 60Hz is a much more desirable scanning rate.This is exactly what video cameras use, so this media can be utilised safely for theproject at normal scanning rates. For the recording of running motion, over 200frames/sec should be used [19], but in all cases the more frames per second the better.However it must be kept in mind that the data processing overhead also increases withframe speed. The highly respected physiologist Verne Inman [17] used over 400
%UDXQHVHDUO\VWUREHPHWKRGV
Figure 2.3: An early stroboscopic flashphotographic record.
This subject was also fitted with whitestripe down the leg for clarity.
(Ghista P140)
,QYDVLYHWHFKQLTXHV
Figure 2.4: Example of interrupted light technique.A rotating slotted disc was placed in from of thecamera and bulbs placed on parts of the lower
body (Gamble P13)

frames/sec in one early study of walking to achieve great accuracy in speed andacceleration values. Additionally, if a three dimensional study is being taken, then thesubject must be shot by at least two cameras simultaneously, although many more(four to six) are often used in practice.
More relevant to this project are the various film and video methods that havebeen used in the past, and are still used in gait laboratories today. The earliest andsimplest method (but most time consuming) was firstused in 1972 by Sutherland and Hagey [17] with16mm film at 50 frames/sec. Markers were placed onthe subject, a reference clock placed in the field ofview and a cartesian coordinate grid placed on a wallbehind the subject. The film was developed andprojected onto a special motion analyser, from whichthe markers points were recorded by hand. This
tedious recording system was soon replaced by acomputer with a crosshair cursor that was placedover the point and automatically recorded thecoordinates [9,13,17,18].
Video systems have the advantage of an image that is in electronic form, andthus is more suitable for automatic processing. Early video systems used passivemarkers (markers made from reflective material) with a light source directly behind orsurrounding the camera. Images stored on video tape allowed the operator to mark(using a computer) the points on the digitised image, and these can be stored andprocessed at will. More recent systems can extract the marking points with littlehuman intervention, such as the result shown below.
Each point is able to be labelled (L.wrist, R,ankle etc) and studied singularly,or with the other sets of points from different joints. These systems can sometimesencounter problems with some pathological gaits, where the motion of one markermay overlap another (such as the toe and ankle markers in the diagram), and thecomputer may incorrectly assign the point to the wrong joint. These systems usuallyplace stringent conditions on lighting and subject clothing. A popular method is theuse of infra red lighting and reflectors, along with the appropriate cameras speciallymanufactured to record images in the infra red frequency range. This removes theusual problem of ambient light and unwanted reflections from skin, shoes and soforth. The active marker method is also relatively popular. Active markers, most oftena group of Light Emitting Diodes (LED’s), flash one at a time in a prearranged order.Thus the computer can tell what marker is being detected by using the time frame,since only one marker will be visible at a time. Another similar method is to use
Figure 2.5: Operator using a computerto enter data points from a motion film.
(Winter P26)
6DPSOLQJUDWH
UHTXLUHPHQWV
0RGHUQHOHFWURQLFPHWKRGV
Figure 2.6: Example of Computer Gait analysis Program(Rose P215)

markers of different colours, and thus anatomical points may be distinguished thisway.
The use of markers can, however, present problems for studies which requireaccurate results. Unless the invasive technique used by California University [17] isemployed, large errors can be induced by incorrect marker placement. Externalmarkers will tend to move with the skin and underlying soft tissue[18]; this is aparticular problem when looking the knee and hip. Marker placements must bereliable if they are to be to used with repeat testing, and even more so for threedimensional work. If patients require canes, walkers, or crutches for locomotiveassistance, this can interfere with the data collection.
Any kind of encumbrance to the subject, even passive markers, can causeunease to a patient, and thus their gait pattern will not be the same as if they werewalking in their normal relaxed state [17,18]. This is even more pronounced whenactive markers, ECG devices and/or electrogoniometers (devices which measure the
relative angle of limb segments) are required to be affixed to the subject. Fortunatelythe outline for this project is not to return quantitative data, so small deviation ofmarker position is not disastrous, and encumbrance to the subject should be minimal.
3UREOHPVZLWKPDUNHUV
$FWLYH0DUNHUV
Figure 2.7 and 2.8: The diagram on the left shows amale wired for ambulatory ECG measurement, with
recording box on his waist. (Ghista P129)The right image shows a leg fitted with a typical
Electrogoniometer for the knee (Winter P15)

CHAPTER 44.1 VIDEO CAMERA SELECTION
The choice of video camera is pivotal to many other parts of the project.Besides the most important features such as size and weight, there are also optionsinvolving format, resolution, quality, compatibility and cost. The basic guidelines setbefore looking at any cameras were that the unit should satisfy these requirements:
• Small• Lightweight. These two stipulations are to enable the pulley and motor
mechanism to operate as quickly as possible. The greater the weight and size,the more powerful the motor, and the stronger the pulley mechanism will needto be.
• Able to be affixed and detached to brackets easily. To allow easy setup anddismantlement of the device.
• Colour. Simply for viewing quality.• Composite Video output. RF output would require extra demodulation
circuitry, and since composite output is often available, this added complexitymay as well be avoided.
• Low voltage supply. The camera will be several meters from a power source,and will be close to a large amount of sensitive circuitry, so mains power isbest avoided. The cables needed to supply low voltage power are also lighterand more flexible.
• Able to be fitted with a zoom lens ,or any other lens that may be required.Many cameras have fixed lenses. In the future this camera may be needed formany other projects at Rehab Tech, so this modularity will be useful.
• Zoom and Focus on the lens MUST be manual. As the camera moves, thedistance from it to the subject will change often. Many cameras haveautomatic focus, motion compensation and zoom (using distancemeasurement transducers) and these have the effect of blurring rapidmovements. This should be avoided.
The first cameras investigated were the two already owned by Rehab Tech. They wereunsuitable for the following reasons;
1. JVC GR570 This camera is relatively small and lightweight. It is termed a’handheld’ unit. Unfortunately the lens is fixed, and not capable of large zoomsor manual focussing. The zoom and focus are automatic and there is nooverride.
2. JVC GF51000H This camera had suitable zoom capabilities, and theautomatic focus can be overridden. However the unit is large and heavy, as itis mostly used for professional video results.
Next some commercial, handheld video cameras were investigated. These had somegeneral problems, mostly due to market trends in this area, which made this style ofunit inappropriate.
• Very few had external output sockets. Most had direct record to tape only.• Most had automatic zoom only. Manual zoom override was a rare option, and
alway added in excess of $600 to the price of a fully automatic unit.• Few had mounting holes.• All were expensive.
9LGHR&DPHUD
5HTXLUHPHQWV
3UREOHPVZLWK
KDQGKHOGFDPHUDV

• All models had some zoom capability, but this was always limited, and notsuitable for the project’s requirements.
Thus investigation was focussed on the so-called ’CCD’ variety of camera. CCD(Charge Coupled Device) actually refers to the sensing chip, which converts theimage into electronic signals. It is common now, however, to use the term CCDcamera when referring to small, self contained units, most commonly used in closedcircuit security situations. These cameras are, in general, small, lightweight, lowpower and low voltage, and able to take a large variety of lenses. Furthermore, for thesecurity market, a large array of lenses are available. A survey was conducted oflocally available CCD cameras, along with their defining characteristics, and these areoutlined in Table 1.The columns are labelled as:NAME: Brand name.MODEL: Local model numberCOL/BW: Is the camera colour or black and white.POWER SUPPLY: External power supply needed by the camera to operate. (NOTsupply voltage of the internal circuitry)COST incl tax: Using sales tax at 22%.COST ex tax: Cost without sales tax as of 30/7/95CCD SIZE: This is the actual surface area of the CCD sensing chip, which is locatedbehind the lens. The most common sizes are 1/2" and 1/3", where the smaller is amore recent development. 1/4" CCD chips are currently coming onto the market. TheCCD size determines the fitting of the lens; a lens for a 1/2’ camera will not fit onto a1/3" unit.LINES OF RES: Number of lines of resolution on the CCD chip. Regardless of thisresolution, the output of their camera is still the standard 625 line format used inAustralian Television. The image from the CCD ship is digitally processed by thecamera and spread over the 625 lines.VIDEO OUTPUT: Format available at the output socket. 1Vpp PAL is most commonand refers to composite output. (Although 1Vpp is always stated on specifications, theactual maximum peak to peak voltage of the signal is 2.2V) Some cameras (Such asthe PULNIX) have two formats available. SVHS is SuperVHS, and transmits colourand image intensity separately. Composite format combines the two into one signal,and is the format to be used in this project.SUPPLIER: Local supplier. This is not necessarily the only supplier of a particularcamera in the area; simply the ones that were visited.
The model decided on was the Jetcom colour camera, in the 1/2" size. This wasinfluenced by the fact that a suitable lens (to be discussed) was available through thesame supplier.
One of the initial requirements for the optical portion of the project was thatthe lens be capable of manual zoom and focus. So there remains the quantitativedecision of lens choice. And as CCD cameras and lenses are sold separately, there islittle restriction. In the market place, there are four common ranges available in zoomlenses for CCD cameras, and these are identified by their scope of focal lengths. Theyare• 8-48mm• 8.5-51mm
&&'&DPHUDVHOHFWLRQFULWHULD
/HQVUHTXLUHPHQWV

• 9-57mm• 12.5-75mmOn detailed specifications more useful data is available, the most relevant here are the• minimum object distance• angle of view (horizontal and vertical)By the design in chapter 3, the subject will be no less than 2m away. The smallestregion that will want to be focused on will be a single joint (eg; knee, ankle, hip), andthe largest is the entire lower body. In graphical form, refer to the figure below.
From the diagram,a = 0.5(vertical angle of view) assuming camera is oriented horizontally, and nottilted.h = height visible in image if object is 2m away.so
ha= 42
tan( )
If the lower body is approximated to be 1.2m in height, then the required angle is atleast
a = = °−21 2
433 31tan (
.) .
The minimum viewing angle is less vital, but if the smallest height required is set tobe 0.2m, then, from the formula above, the minimum required angle is 5.72°. Thus azoom lens is required which covers the range of 5.72°-33.3° for the vertical viewingangle. For a 1/2" camera, the 8-48mm zoom comes closest to covering this stipulationin most models. As a typical example, the eventual model chosen has a vertical angleof view range of 5.22°-33.1°, which is satisfactorily close to the theoreticalrequirement. The models with other focal length ranges may be able to fit more of thesubjects body in a wide angle, but not be able to zoom in as well, or alternatively beable to zoom in well, but have insufficient wide angle capabilities, so the 8-48mmfocal length is the best alternative. Table 4.1 also outlines a range of available lenses.The columns are labelled as:NAME: Brand name of lens.RANGE: Focal length range in millimetres. AUTO indicates automatic iris control(aperture control). MAN is manual aperture, as is required. Auto iris lenses are alsosignificantly more expensive.COST: excluding tax only, as on 30/7/95SUPPLIER: Local supplier name.
2ma h
/HQVVHOHFWLRQFULWHULD

CAMERASNAME MODEL COL/BW POWER COST COST CCD LINES VIDEO SUPPLIER
SUPPLY incl tax ex tax SIZE OUTPUTELMO COL 240V AC $900 $738 1/2" 370 COLLINS VIDEOELMO BW 240V AC $600 $492 1/2" 370 COLLINS VIDEOCOMPUTAR FC 62B BW 24V AC $488 $400 1/3" 380 1Vpp PAL MAINLINE SECURITYSAMSUNG CCS324AP COL 24V AC $915 $750 1/3" 320 1Vpp PAL MAINLINE SECURITYJETCOM COL 12V AC $915 $750 1/2" 420 MAINLINE SECURITYGOLDSTAR BW $400 $328 1/3" 400 CAMVEXJVC (CLONE) COL $560 $459 1/3" 330 CAMVEXPANASONIC WVCP412 COL 12V AC/DC $1,466 $1,202 1/3" 480 1Vpp PAL GECPANASONIC WVCP212 COL 12V AC/DC $1,069 $876 1/3" 330 1Vpp PAL GECPANASONIC WVBP104 BW 24V AC $830 $680 1/3" 380 1Vpp PAL GECPANASONIC WVBP312 BW 12V AC/DC $1,066 $874 1/3" 570 1Vpp PAL GECPULNIX TMC-63M COL 12V DC $1,878 $1,539 1/3" 450 PAL/SVHS HADLANDPULNIX TMC-6 COL 12V DC $1,854 $1,520 1/2" 450 PAL/SVHS HADLANDMINTRON OS 3511 COL 12V DC $1,011 $829 1/2" 380 1Vpp PAL PHILIPSPHILIPS COL 12V DC $1,318 $1,080 1/3" 1Vpp PAL PHILIPS
LENSESNAME RANGE COST SUPPLIERKOSMIKA 8-48mm 600 ex tax COLLINSKOWA 8.5-51 AUTO 959 ex tax PHILIPSKOWA 8.5-51 MAN 456 ex tax PHILIPSCOMPUTAR 12.5-75 559 ex tax GECPANASONIC 8.5-51 AUTO 1356 ex tax GECD6x9.5AI 9.5-57 MAN 445 ex tax HADLANDCOMPUTAR 8-48 MAN 580 ex tax MAINLINECOMSICAR 8-48 MAN 580 ex tax MAINLINE
Table 4.1:

The final choice for the camera/lens pair is:• Jetcom colour CCD camera with 1/2" lens socket. ($750)• Computar 8-48mm zoom lens ($580)• Also a 12VDC adaptor (unregulated) for supply to the camera.($20)
These were purchased from Mainline Security Products, Nepean Highway,Elsterwick.
4.2 CAMERA/LENS OPERATION
The camera and lens are shown connected in figure 4.1. A VHS video tape isshown alongside for a dimensional reference. Table 4.2 shows some more detailedspecifications.
,WHPV3XUFKDVHG
Figure 4.1: Camera and Lens connected together with VideoCassette for size reference
CAMERAModel: Jetcom Super Colour, High Sensitive CCD CameraCCD: 1/2" Inteline-Tranfer TypeLens Mount CS - MountResolution 420 linesPower Consumption: 4.5WDimensions: 51(W) x 43(H) x 128(L)Weight: 380g LENS:Model: Computar H6Z0812Focal Length: 8-48mmAngle of view; vertical 5.22 - 33.11°Angle of view; horizontal 7.44 - 43.31°Minimum object distance 1.2mDimensions Φ57 x 95mmWeight: 430gAperture F1 - F22
Table 4.2: Detailed Specifications

The side controls of the camera are shown in figure 4.2, whilst the rear connectionsare displayed in figure 4.3.
The controls mounted on the camera are set in the factory for the best performance,and thus should not need to be tampered with, but for completeness they are outlinedquickly here. On the side of the camera the shutter speed (ES), automatic gain control(AGC) and white balance (WB) are situated. The settings should be kept on:
ES=6 AGC=ON WB=1At the rear of the camera are the external connection points. Video output is a normal75Ω BNC connector, and the 12V supply is a low voltage socket. Also on the rear aresockets for external sync inputs (when more than one camera is being displayed onone monitor) and automatic iris. These last two facilities are not used in this projectand are primarily designed for use in closed circuit TV situations.
The mounting of the lens is an important operation. If the lens is screwed allthe way into the lens mount on the camera, the expected range of focal points will beunobtainable. Instead, the lens should be screwed in only far enough to allow the
Figure 4.2: Side view of camera showing (L to R) Shutter Speed, AGC andWhite Balance.
Figure 4.3: Rear of camera showing video output and DC voltage socket.
&DPHUDDQG/HQV&RQWURO

objects in the range of 1.2m - ∞ to be focussed on. This is an iterative process butdoes not take more than a few minutes. Once the lens is in the correct place, it may befixed by tightening the hex screw situated on the base of the camera housing. The lensand camera can be left permanently together since there is little reason to remove thelens from the camera when not in operation.

Film and video have certainly been used before, for decades in fact. Commonly thecamera (film or video) is static and views a length of a walkway, and records thecycles of gait as the person walks from one extreme of view to the other. Often amarker is (or many markers) placed on the body so that the points may be recorded bycomputer (automatically or by an operator), which may then produce a wireframesimulation of the locomotion, along which various statistics, as seen on the previouspage. Nowadays this is almost standard in any well equipped gait laboratory. Therehave been some apparatus which have had cameras mounted on trolleys and beenpushed by hand to follow and film a subject on the walkway, such as the examplebelow, at the University of Waterloo.
This project aims to combine these last two methods to produce a devicewhich will use a marker as a defining point to follow. That is, the device will aim tokeep the marker laterally in the middle of the video image at all times. Instead of justfollowing the person at walking pace and filming the lower body the instrumentconceptually will allow the study of a particular piece of anatomy. For example thecamera may film a close up of the knee (which therefore is where the marker would beplaced) in action, or the ankle, or a suspect prosthetic component in a fitted artificiallimb. The most important improvement that will be gained is increased resolution. Ifthe example of the kneeis continued; the knee would still be visible with a staticcamera, and with the dolly mounted version, but the camera’s frame of referencemakes close and detailed examination of the joint difficult. Ideally with this newdevice the joint in question will appear almost laterally static on the video screen,allowing professionals to observe motion in a more convenient form. The objective ofthe project is not to provide quantitative information, but rather to improve theclinicians subjective viewpoint of the patient. This qualitative information cannot bemeasured to rate its success, but feedback from professionals should give anindication of the usefulness of this equipment.
Figure 1.2: Walkway and manually operated tracking cart, carrying bothfilm and video cameras. (Winter 1982, P409)
$LPV

CHAPTER 55.1 CIRCUIT DESCRIPTION
To make the explanation of the circuit design more readable, it will bepresented in sections. The circuit diagram in each section will be shown and thenexplained, along with a description of the section’s function and relation to the systemas a whole. The context of this chapter is such that it is assumed that someone may inthe future need to make changes or additions to the system, and thus explanation ofthe circuit is in sufficient detail to enable this without the party having to refer to agreat many external texts.
5.2 VIDEO SIGNAL EXTRACTION
This section forms the front end of the system. This is where the video signalfrom the camera is fed in and the required information is stripped off. The circuitdiagram is shown in schematic #1. This section covers the the following material:• Format of video signals used• DC restoration• Buffering of video signal• Colour burst stripping• Line sync pulse extraction• Field sync pulse extraction• Intensing triggering• Contrast Triggering• Target latching First it will be useful to outline the format in which the video signals are presented.
5.2.1 PAL VIDEO FORMATThe upper waveform shown in figure 5.1 is a typical single line of picture
information from a PAL video source. (ie a camera, a VCR etc). PAL is the formatwhich is used in Australia, the UK and some parts of South East Asia to transmittelevision and video information . (Other formats are similar but contain subtledifferences) The waveform shown was taken from the output of the CCD camera.
FIGURE 5.1: Example of a single line of a PAL video signal showingLine sync pulses, colour burst and picture information.
'HVFULSWLRQRI3$/YLGHR
)RUPDW

5.4 TIMING AND DIGITAL TO ANALOGUE CONVERSION
This portion of the electronic system takes the signals created by the functionsdescribed in 5.1 and 5.2, and provides an output voltage proportional to the distanceof the marker from the left edge of the screen. An LED display is also included, whichtells the operator how many markers are currently being sensed; thus for optimaloperation only a ’1’ should be displayed. This section describes a circuit with thefollowing fucntions:• Rouge image noise rejection• Region selection• Target latching• Digital to Analogue conversion• LED display
IC10, an 74HC164 8 bit shift register, has its reset pin connected to theinverted field pulse pin (IC6, pin 4), its clock input connected to the line pulse output(IC6 pin 5) and its serial data inputs both connected to the latched target pulse (IC9pin 3). This means that at the beginning of each field all of the shift register’s outputsare reset to logic low. At the end of each picture line, the value of the latched target (0or 1) is clocked into output Q1, and all other outputs are shifted along one output. Theeight outputs are connected to the inputs of a 74HC30 8 input nand gate (IC11). Theoutput of this gate will only go low when all of the outputs from the shift register arehigh, in other words, a marker has been spotted on all of the previous 8 lines of theimage.
This is simply another precaution to exclude unwanted information from thesystem. Single white pixel’s will therefore not upset the system since the next 8 lineswill not contain a marker, and the target information will be ignored. The output of the74HC30 goes to one input of a 74HC32 OR gate (IC12). IC7:C is a NAND gatewhich conveys information from the region selection (see section 5.2) circuits. Theoutput of IC12:D will only be LOW when the current line of the image is in theselected region and the option is selected, by setting the switch to logic high. Thisinformation is placed at the other input of the OR gate IC12:A. Thus when a target hasbeen found (and is more than 8 lines in height), the current line is in the scanningregion and the region select option is switched on, the output of the OR gate will belogic high.
IC9:B is a 74HC107 JK flip flop, which is used to finally latch the targetsignal once per frame. It is reset at the start of each frame by the inverted field pulse(IC5 pin 4) and must be clocked at the exact instant that the marker is detected, notjust at the start of the relevant line. This is the reason why the output of IC12:A ORgate is combined with the inverted pulse from the target latch (IC9 pin 2), so the pulsedrops at the correct time within the line of pixel’s. Figure 5.7 shows an illustrativeexample. The camera is looking at a table tennis ball.
8QZDQWHGVLJQDO
UHMHFWLRQ
,QFRUSRUDWLQJVHOHFWHGUHJLRQV
)LQDOODWFKLQJRQWDUJHW

5.7 AUXILIARY CIRCUITS
This final part of the chapter covers all portions of the circuit not coveredelsewhere. These are the 5MHz waveform generator, and LED position display.
5.7.1 CRYSTAL OSCILLATORThis oscillator drives the 12 stage counter which provides the input to the 8 bit DAC.Thus the best level of resolution will be achieved if the 256 levels available are spreadevenly across the whole screen. If a time of 45µS is conservatively set aside for awhole line of pixel information, then the required clock rate for the counter is
f S MHzc = =145256
5 68µ .
If a higher frequency is used there is the possibility that the counter will go overbinary 256, and the DAC will give a false output. The next available alternative is touse a 5MHz rate, which is achieved using a 10MHz crystal and dividing the result.The crystal oscillator circuit is shown in figure 5.13.
The output from IC7:B is thus a 10MHz square wave. A binary counter (74HC4040)is used as a divider to reduce the frequency to 5MHz.
5.7.2 LED POSITION DISPLAY
This module allows the operator to visually determine if the system is trackingthe marker as expected. A row of LED’s visually displays the horizontal position of
the spot which the circuit is triggering on, thus theuser can determine whether the circuit is detectingthe marker, or something else in the field of view.The unit is detectable from the rest of the circuitboard so it can be removed when not needed. Thecircuit diagram is shown in figure 5.14. The moduleuses a LM3914 Dot/Bargraph driver. This IC
6HOHFWLQJVDPSOLQJUDWHIRUJUHDWHVWDFFXUDF\
Figure 5.13: Schematic diagram of 5MHz oscillator circuit.
9LVXDORXWSXWRISRVLWLRQIRUXVHUFRQWURO

CHAPTER 66.1 ULTRASONIC DISTANCE MEASUREMENT
This chapter outlines the work done on the ultrasonic distance measurementcircuits. Originally this was to be a part of the thesis assessment but as more emphasiswas placed on the video tracking portion, the time spent on this segment becamedetrimental to the more important aspects of the project, so research was stopped.However, a stage was reached such that when the rest of the project is completed at alater date, some ultrasonics can be trailed with minimal further time investment.
6.2 BASIC CONCEPT
In air, at 20°C, the speed of sound is 331.6ms-1. If a measurement of the timein taken for a sound wave to travel from a point of emission to a receiver, then thedistance between those two points can be easily calculated. This is the basis for allsonic distance measurement instruments. The speed of sound will alter will airtemperature, pressure and humidity, but the figure of 331.6ms-1 is adequate for thelevel of accuracy required here. Ultrasonic frequencies are defined as those above the
audible range for humans, about 20kHz. Most ultrasonictransducers operate at 40kHz-50kHz. Rangefinders usingthese frequencies are commonly used in robotics,industrial equipment, cameras and underwater vehicles.All devices work by sending out ultrasonic waves from atransmitter, then waiting until they are reflected off anobject and returned to a receiver (which is most commonly
in the same location as the transmitter)
Most rangefinding equipment works in the following way:• Transmitter sends a short burst of ultrasonic pulses• Digital timer starts• Receiver detects returning pulses and stops timer.• Digital count processed further or displayed in distance units.
However, the purpose of the rangefinder in this project is to drive a motor so as tokeep the inline camera a constant distance from the subject being filmed on thewalkway. The motor driving circuits (which will use a Pulse Width Modulationmethod) will need an analogue input, so converting from analogue pulses, to a digitaltimer, and then back to analogue output is quite wasteful. This is the reason that thisdesign instead uses a totally analog output method.
The new design approach is:• Transmitter sends a short burst of ultrasonic pulses• Voltage ramp starts to increase linearly.• Receiver detects returning pulses and clamps voltage ramp to ground.• Peak detector maintains highest voltage level from ramp (with slow
discharge)
Ultrasonic transducers
3ULQFLSOHVRIVRQLF
GHWHFWLRQ
8VXDOPHWKRGRORJ\
0\PHWKRG

CHAPTER 77.1 MOTOR SELECTION AND CONTROL
This chapter deals with the selection of the stepper motor and the circuits tocontrol it. A large amount of effort was put into designing a stepper motor driver fromdiscrete components, rather than simply purchasing a commercial unit. This chapteroutlines the designs that were built and tested, and why they were not chosen for thefinal design. Eventually a commercial unit was sought, and its operation is alsodescribed here.
7.2 MOTOR SELECTION
To determine the correct motor to use a calculation of the maximum expectedloads must be done. The maximum speed and acceleration can be obtained from gaitdata.
Data will be taken from the ankle, since it experiences the highest velocitiesand accelerations. From experiments carried out at Rehab Tech, the time for one stepduring a brisk walk was found to be approximately 1 sec. Using the displacementgraph in figure 8.1, the gradient at the point of maximum slope is
vcm
ms=×
= −100
1 432 32 1
sec %.
Calculations were done to check the suitability of several motors, but only thechosen model will be included here. The motor is a Size 23 Hybrid Stepper Motor,which runs on a rated voltage of 5V, with phases rated at 1A. The specified maximumstep frequency is 880 steps/sec.For a step angle of 1.8° this amounts to ω=4.4rev/sec.For a tangential velocity the effective radius of the gears will need to be
rv
m= =2
0 083πω
.
The specified torque for the motor is 500mNm, so the tangential force will be
FR
N= =τ6 01.
Since the camera and lens weigh in total 810g (round conservatively up to 1kg), thisprovides the moving camera with a maximum acceleration of 6ms-2.
Figure 7.1: Displacements of hip, knee and ankle over one step cycle [17]
5HTXLUHGVSHFLILFDWLRQVIRUPRWRU
0D[LPXPDFFHOHUDWLRQDYDLODEOH

CHAPTER 88.1 CONSTRUCTION
All of the circuits described were built onto a standard veroboard as commonlyused for prototypes. Since it is likely that some modifications will have to made inaccordance with later parts of this project, the circuit was not made into a dedicatedPCB. Room soon ran out on the first prototype board and was forced to use an IDCconnector between the two halves of the circuit. This undoubtedly has introducednoise into the circuit, which will not be present when the system is eventually put ontoone fabricated board. The LED position display, optical limit sensors, motor driverand power supply are all separate from the main boards, and connect via plugs. Figure7.1 shows the first board.
Some features are highlighted:• Power in and indicators: Socket for ±5V supply, and LED’s to indicate when
power is on.• BNC in: Composite video signal input socket.• Trigger Select: Switch to select between targeting on brightness or contrast• Trigger set: Potentiometer to adjust level of triggering• 7 Segment display: Indicates how many spots the circuit is currently detecting.
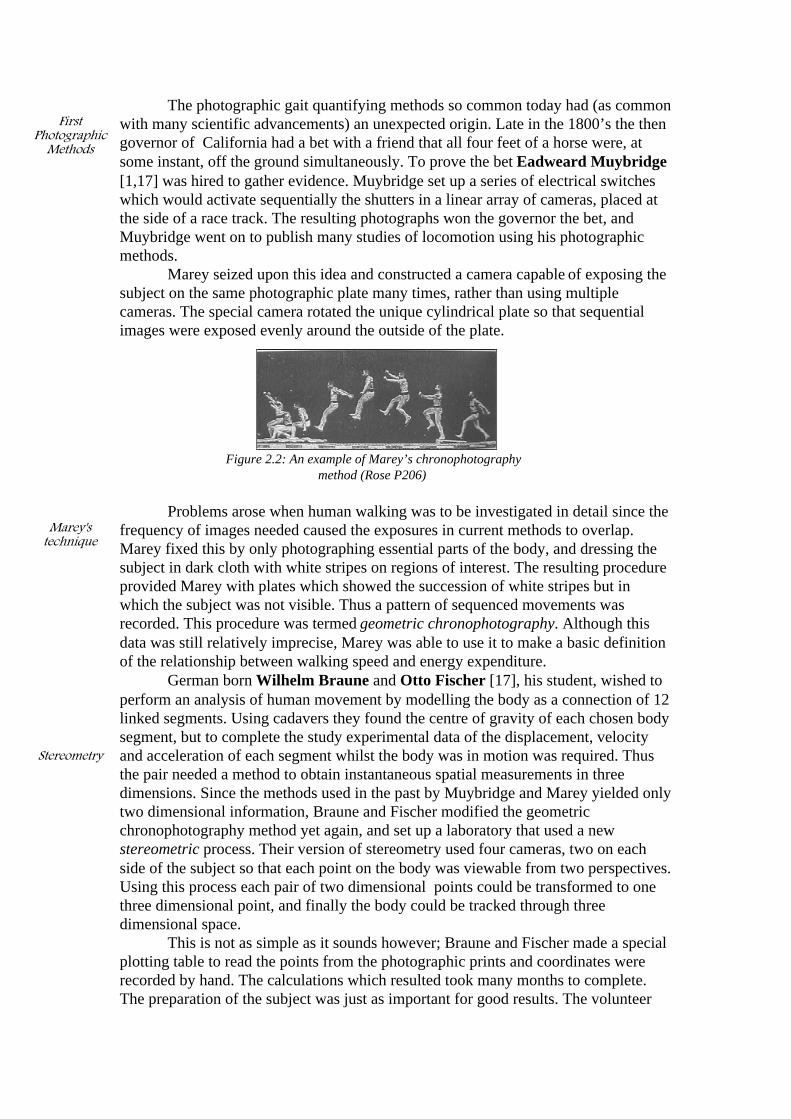
Similarly for the second board; in figure 8.2 overleaf• Pushbuttons: to select scanning region• Show targets: switch to select whether to display visual targeting information on
screen or not.• Scan select: switch to select whether to use scanning regions or leave then off.• Normal/info : display normal image or overlay scanning regions, targets etc.• To motor driver: plug which connects to motor driver board• Limit indicator: LED illuminated when optical limit sensors are triggered.• BNC out: composite video out.
Figure 8.1: First half of prototype board.

CHAPTER 9CONCLUSION
The aim of this thesis project was to construct a system which would follow amarker placed on a subject, using a video camera, specifically for the implementationin gait analysis. The system comprised of an electronic control circuit and amechanical trolley which would be driven by a stepper motor.
Unfortunately, motorised testing of the device was not able to be undertaken,due to the unavailibility of the trolley (still being constructed). If the trolley was ableto be used then examples of actual tracking of an object, would have been able to bedone, rather than simply looking at a voltage output, or the motor turning whilst itsshaft is unconnected. However, great progress was made in the electronic circuitrydesign and construction, which was the main aim for thesis assessment. A list of themajor achievements is listed below:
• Design of Ultrasonic rangefinding circuitry• Construction and testing of Ultrasonic rangefinding circuitry• Testing and evaluation of commercial Ultrasonic rangefinding module.• Design and construction of Video Signal extraction circuitry• Design and construction of signal processing and display circuitry• Survey of available video cameras.• Survey of available zoom lenses for CCD cameras.• Design and construction of Motor control circuitry• Design and construction of two stepper motor driver circuits• Testing and Evaluation of commercial stepper motor driver.• Design and Construction of 15V, 6A overload protected power supply.• Fabrication of all plugs and cables.• Design of Trolley mechanism.
The major part of the project, the design and construction of the circuits which :Accepts video input from the CCD camera
• Provides output for video display or recording• Has the user definable option of two triggering methods to track marker• Has a display showing how many markers are currently being detected.• Has a display showing the relative horizontal position of the market that the
circuit is detecting• Incorporates a method to reject any small patches of bright pixels on the image• Makes the motor run at a constant velocity when more then one marker is
found, or no markers are found• Has user input and visual feedback on screen to define regions of the image
which are to be scanned, and those that are to be ignored.• Provide visual feedback as to bright areas on image which are being triggered
on.Rejects sudden jumps in marker position
• Drives motor at correct speed and direction• Has facilities to stop trolley running off its track, yet does not deadlock the
systemAll of these features were designed by the author and work correctly.

BIBLIOGRAPHY
1. Braun, M (1992) Picturing time : the work of Etienne-Jules Marey (1830-1904).Chicago : University of Chicago Press
2. Chelihi, N and Gaydecki, A (April 1993) A low-cost video-based multiple targetdigital tracking system. Measurement Science and Technology, Vol 4, pp447-50.
3. Ciarcia, S (February 1986) Build an Audio and Video Multiplexer. Byte, Vol 11,pp85.
4. Ciarcia, S (July 1985) Living in a Sensible Environment. Byte, Vol 10, pp141-158.
5. Dagognet, F (1992) Etienne-Jules Marey : a passion for the trace, New York :Zone Books
6. Dolman, P (May 1989) Inside S-VHS. Electronics and Wireless World, Vol 95,pp466.
7. Frerking, M (1978) Crystal Oscillator Design and Temperature Compensation,Van Nostrand Reinhold Company.
8. Howard, P (February 1982) Camera Interface for a Microcomputer. Electronicsand Wireless World, pp37.
9. Keemink, G Snijders, C and Hoek van Dijke (January 1991) Upgrading ofefficiency in the tracking of body markers with video techniques. Medicaland Biological Engineering and Computing, Vol 29, pp70.
10. Kleeman, L (1995) A three dimensional localiser for autonomous robotvehicles. Robotica, Vol 13, pp87-94.
11. Lenk, J (1988) Complete Guide to VHS Camcorder Troubleshooting and Repair.New Jersey: Prentice Hall.
12. Ma, C (September 1994) Direct Adaptive Rapid Tracking of Short ComplexTrajectories. Journal of Dynamic Systems, Measurement and Control, Vol 116,pp537.
13. Milner ,M (1981) Human Locomotion: Data monitoring and processing-clinical applications. (p123-155) Biomechanics of Medical Devices. New York:Marcel Dekker Inc.
14. Newton, A and Maeder, H (Nov 1991) A TV analogue to digital conversionsystem. IEEE Transactions on Consumer Electronics, Vol 37, pp829.

15. Omran, S (June 1985) Fast camera interface. Electronics and Wireless World,Vol 91, pp17-19.
16. Perkins, G and Clayton, K (August 1992) A low cost, general purpose S-video,PAL/NTSC encoder. IEEE Transactions on Consumer Electronics, Vol 38,pp512.
17. Rose, J and Gamble, J (Ed’s) (1994) Human Walking. London: Williams andWilkins.
18. Vaughan, C and Sussman, M (1993) Human Gait: From ClinicalInterpretation to Computer Simulation. (p53-66) Current Issues inBiomechanics. Champaign: Human Kinetics Publishers.
19. Wezel ,R (1987) Video Handbook. Melbourne: Heineman ProfessionalPublications.
20. Winter, D (1982) Camera Speeds for normal and Pathological gait analysis.Medical and Biological Engineering and Computing, Vol 20, pp408.
21. Winter, D (1990) Biomechanics and Motor Control of Human Movement. NewYork: John Wiley and Sons, Inc.
22. Wobschall, D (1987) Circuit Design for Electronic Instrumentation. New York:McGraw-Hill.
23. (May 1988) Motors. Machine Design, Vol 60, pp57-97.

The only minor problem with the circuit is that of some noise in the DAC output.Over a 0-5V signal there is max 40mVpp noise, ie 0.8%. This problem is mostprobably due to the wiring on the prototype boards, and thus the accuracy of thesystem will be even higher when the circuit is placed on a PCB.
In the current state of the project, as soon at the trolley is readied, the systemwill be able to be tested, since the video, control, and motor driving portion all operateas designed. The larger design, involving the inline camera, motorised dolly andultrasonic distance measurement will be undertaken at a later date, but this area has asolid foundation due to the work already done in this report on the ultrasonicrangefinding equipment.
The final version would also be housed in a box, which would have clearlylabelled controls and displays mounted. All components of the system would pugtogether, thus providing easy storage when the system is not in use.
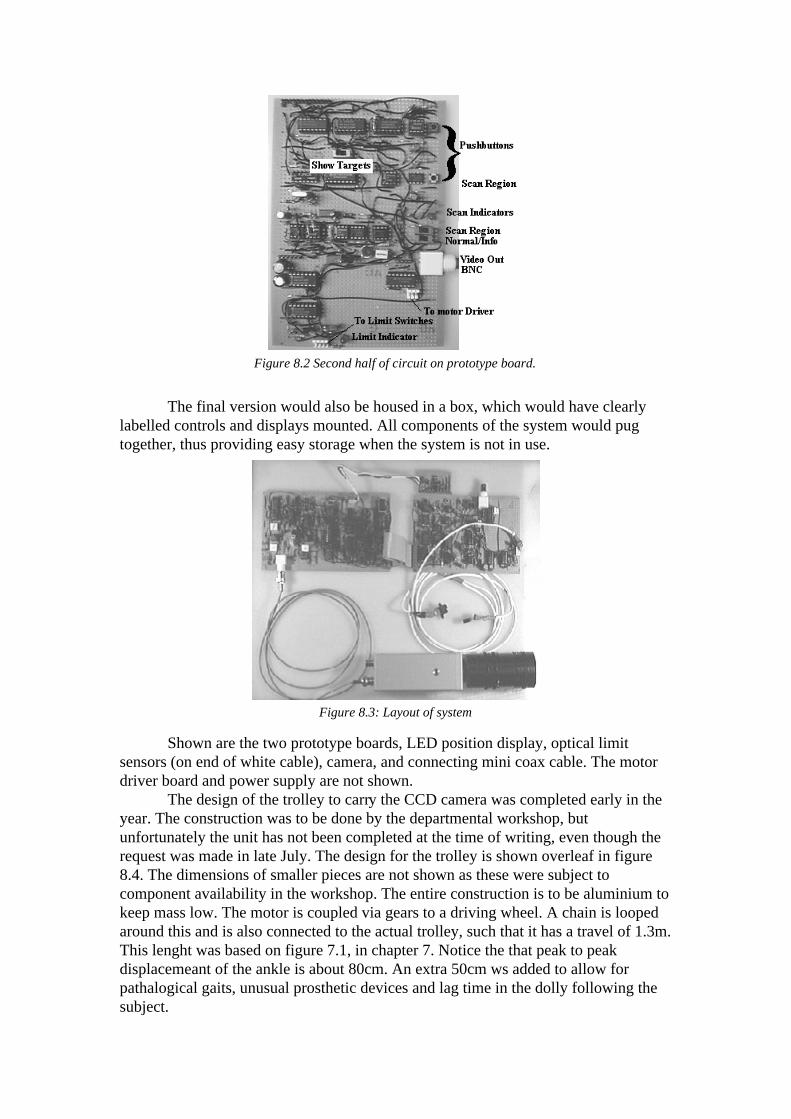
Shown are the two prototype boards, LED position display, optical limitsensors (on end of white cable), camera, and connecting mini coax cable. The motordriver board and power supply are not shown.
The design of the trolley to carry the CCD camera was completed early in theyear. The construction was to be done by the departmental workshop, butunfortunately the unit has not been completed at the time of writing, even though therequest was made in late July. The design for the trolley is shown overleaf in figure8.4. The dimensions of smaller pieces are not shown as these were subject tocomponent availability in the workshop. The entire construction is to be aluminium tokeep mass low. The motor is coupled via gears to a driving wheel. A chain is loopedaround this and is also connected to the actual trolley, such that it has a travel of 1.3m.This lenght was based on figure 7.1, in chapter 7. Notice the that peak to peakdisplacemeant of the ankle is about 80cm. An extra 50cm ws added to allow forpathalogical gaits, unusual prosthetic devices and lag time in the dolly following thesubject.
Figure 8.2 Second half of circuit on prototype board.
Figure 8.3: Layout of system

The calculation of the gear ratio is as follows:Maximum velocity required, as calculated previously, is 2ms-1, but use 3ms-1
to leave space for any power loss in the device. The maximum speed of the rotor is1000Hz at 1.8° per step. This is (1000*1.8)/360 = 5 rev/sec.In radians this is 2π*5 = 31.4 rad/sec.The maximum trolley speed is 3m/sec. The pulley is 15mm in diameter, thus therequired angular velocity isω=v/r = 3/.015 = 200 rad/s.Therefore the gears need a ratio of 200/31.4 = 6.36 to obtain the maximum speed.
Motor, gears and pulleyCamera Trolley
1530mm1300mm
The entire frame is to be made of aluminium for weight conservation. The transmission
methodwill be lightweight link chain, or plastic toothed wire, strung aroung both pulleys in a continous loop and attached at the camera
trolley. At each end there shall be an optical limit sensor (not shown) so that the device
cannot damage itself. The wheels will be nylon on bearings, and are angled such that sideways movement of the
camera trolley is eliminated.Below is an isometric diagram, showing
orientation of camera. (Lower diagram is not to scale)
Close up of Trolley, End view
100mm
150m
m
120m
m8 0
mm
Nylon wheels with bearings
base
Camera secures here
ø30mm
Figure 8.4: Design of trolley mechanism


7.3 MOTOR DRIVING CIRCUITS
As mentioned in earlier chapters, stepper motors require that their coils beexcited in a specific sequence for motion to occur. Fortunately there exists integratedcircuits that take care of most of this bother. These chips require only the direction andstep inputs, and produce logic signals for the four phase outputs. For low powermotors, the coils can be connected directly to the IC, but since each phase in the motorbeing used here can pass up to 1A, external components are required.
Circuit #1 in schematic #6 shows such a circuit. The driving chip isUCN5804B, which uses TTL level inputs. Eight MosFets are used to create fourinverting buffers, capable of switching the required voltage and current. The reversebiased diodes are to protect the mosfets against voltage spikes due to inductiveswitching. This circuit worked, but the maximum stepping rate achieved was only300Hz, less than one third of the specified maximum of 1kHz. At higher frequenciesthe voltage at the coils became chaotic and put the motor out of sequence, whenideally the waveform at the coils should be square. Part of the problem was currentdrain, so more powerful power supplies were tried . This remedy improvedperformance slightly but the maximum step frequency was still only around 400Hz.
The present mosfets (P channel IRF9520, N channel IRF510) were replacedwith new components with lower gate threshold voltages (P channel BUZ171, Nchannel BUZ71) to make sure that the mosfets were switching properly. This did littleto aid the performance. On closer examination of the gate voltages, it was apparentthat the mosfets were indeed not being driven hard enough, even with the newcomponents. Thus circuit #2 (on schematic 6) was constructed. This used a new IC,the SAA1027 which runs on higher voltage levels, but still performs the samefunctions as the UCN5804B. Thus the mosfets were driven much harder, (since theVgs is now much higher), and performance increased accordingly. The maximum ratewas now 700Hz. Continuing on this avenue of research the lower supply rails of theSAA1027 were made negative, so that the P channel mosfet was also driven harderthan before. This also improved performance, but the rotation of the shaft was notsmooth at high speeds and the available torque was quite low.
After some more experimental circuits, some deeper research into higherperformance stepper motors was done. It was found that for better performance acurrent regulated circuit was needed. That is, instead of simply switching the coils tothe 5V rails, the circuit also needs to control the current through each coil, keeping itconstant. One elementary way to perform this function was trialed, which is to usehigher voltage with a resistor to drop the voltage down to the motors specifications,but without added control circuitry this made little difference. This technique is calledthe Unipolar L/nr method, and is described further below. Fluctuation of phase currentwas the primary cause of the non-performance of the previous circuits. A consultationwith Mr Holmes of the power electronics group was made, and he stated that simplywith a lack of power background the construction of such a circuit would beimpossible. Indeed, it could nearly be a thesis project in itself. Thus attention waspromptly turned to the option of commercial motor drivers, which incorporate currentregulation, and obtained a RS Unipolar Stepper Motor Driver Board.
The board connects using a standard 32 way 41612 socket (as used withEurocards). The module uses a driving method called Unipolar L/nr drive, and is aone way to obtain some standard of current and voltage regulation. nR is the sum of
)LUVWH[SHULPHQWDO
FLUFXLW
6HFRQGH[SHULPHQWDO
FLUFXLW
3UREOHPVZLWKGHVLJQDQGVROXWLRQV

external resistance plus winding resistance (R), where n is a real number. By selectinga higher value for n (ie: larger external resistance) and using a higher DC supply tomaintain specified voltage and current on the windings, the torque and speed ratingsare improved. Coupled with other control circuitry this module provides excellentperformance with speed up to 1200Hz (over the motor specifications) and high torque.
For the motor purchased, (5V, 1A) at a supply voltage of 15V, therecommended resistor value is 10Ω, rated at 10W.
Since the control signals from the system are at TTL levels, whereas the motordriver runs at 15V, an open collector TTL Nand gate is used to interface the two. Thisis the 74HC03. The connections to the driver module are shown in schematic 7.
Also required for the driver is a 15V power supply. A suitable supply wasconstructed which is capable of up to 6A current, and is overload protected. Thecircuit for this is shown in schematic #7.
The voltage is dropped from 240VAC to 17.5VDC and smoothed, rectified. Athree terminal 15V voltage regulator is used (LM7815) to provide the required output.These regulators are rated to 1A, which is satisfactory according to the motorspecifications. However, in practical situations stepper motors can require muchhigher peak current supply, over 4A in a worst case. Such instantaneous current spikeswould cause interruptions in the supply due to the internal overload protection in theLM3815. Therefore a current boosting transistor is used to provide greater currentavailability. This is P3, a TIP2955. When current through the regulator is over 90mA,the VBE exceeds 0.6V and the transistor switches on, carrying all excess current.
Furthermore, to ensure that any accidental short circuits do not damage thesupply or motor driving circuitry, a current limiting feature has been included.Resistor R5 sensed the load current being delivered, and when the voltage drop acrossit exceeds about 0.6V P2, another TIP2955, cuts off the drive current to P3, thusinitiating the automatic cutoff in LM7815. For 0.6V to appear over R5, a current of6A must be sunk. This is enough to cover all requirements for the motor, but will notdamage the supply circuit or driver.
&RPPHUFLDOERDUG
VSHFLILFDWLRQV
Figure 7.2: View of commercial stepper motor driver board
'HVLJQRI9$
SRZHUVXSSO\

The peak of the voltage ramp will be in proportion to the time taken to send andreceive the pulses, thus if pulses are sent and received regularly the output of the peakdetector will follow proportionately the distance of the object from thetransmitter/receiver pair. The block diagram of the basic circuit is shown below infigure 6.1.
6.3 CIRCUIT DESCRIPTION
The circuit diagram for this first prototype is shown in schematic #5.The base ultrasonic frequency is produced by a crystal oscillator and a divider. Thecrystal oscillates at 5.0688MHz, using a biasing circuit similar to that described inchapter 5. A 4040 12 Stage Binary Counter is used to divide this clock input by 128(by connecting an output to Q7) which gives an output square wave frequency of39.6kHz. This is acceptable since the receiver and transmitter being used operate inthe range 40±1kHz.
The NE555 timer is configured to give an output pulse at a frequency of4.34Hz, with each pulse going logic low for 0.69mS. This pulse and the 39.6kHzfrequency are combined using a 4011 Nand gate. Thus the output of this gate is a0.69mS burst of 39.6kHz signal. This is enough time to transmit 27 pulses, which iseasily enough for the receiver trigger on. The frequency with which the pulses are sentinduces a limit on the maximum distance that the device can measure. Pulse bursts aresent at 4.34Hz, which is every 0.23sec. The maximum distance that can be covered inthis time is
d ms s m= × =−331 6 0 23 76 41. . .Since the sound must be reflected back, the actual measurable distance is 35.9m, butthis is quite ample considering the low power of the transducers restricts theirmaximum range to about 10m (5m reflected). Spare time after the reception of thepulse is advantageous since rogue reflections (off distance walls, roof etc.) in alaboratory environment can sporadically interfere with the reception of the correctpulses, so these can be dissipated in the extra time before the next pulse is transmitted.The ultrasonic transmitter is driven by a 2N222 transistor.
The signal from the ultrasonic receiver is amplified by two 741 op amps.Figure 6.2 shows various waveforms taken from the circuit. The top trace is the pulseoutput of the NE555, and the next trace is the output of the Nand gate, showing theshort burst of 39.6kHz cycles that are produced. Trace three is the beginning of theamplified receiver signal, created by the reflection off an object about 20cm away.
40khzgenerator
pulsetimer
ramp
receiver
low passfilter
voltage outputproportionalto distance
Figure 6.1: Block diagram of basic Ultrasonic rangefinding circuit
8OWUDVRQLFSXOVH
IRUPDWLRQ
7UDQVPLWWHU
5HFHLYHU

From the trace, the delay from the transmission of the pulse, to its arrival at thereceiver is 1.2mS. Thus the distance of the object from the transmitter/receiver is
d cm= × × × =−331 6 1 2 101
219 83. . . .
In the first version of the circuit a phase locked loop was used to trigger when thepulse appears at the receiver. This PLL was in the commonly used NE567 tonedecoder, which is capable of a large range of locking frequencies, and has adjustabledetection bandwidth. This component can be damaged by supply voltages over 10V,so a LM3808 was used to create a secondary supply of 8V to the PLL and the twopreceding amplifiers. The rest of the circuit runs on 12V to obtain the maximumpower output from the transmitter, which has a rating of 12V. Components C10 andP1 are used to set an internal reference frequency that the NE567 uses to compare tothe incoming signal. This internal frequency is governed by
fR Co
X X
≈ 1 1. BW
V
f CI
o X
= 1070 (% of fo)
BW is the detection bandwidth. VI is the amplitude of the input signal, 2.5V in thiscircuit. In this case fo is set to 40kHz, and the bandwidth is 9.3%. The NE567 takes 8-12 cycles to lock onto an incoming signal. The circuit performed with the tonedecoder, but the output of the circuit was spasmodic, even when the experimentalconditions were static. Unfortunately the PLL was not congenial toward the shiftingamplitude present in the receiver signal, even if the frequency was constant.Adjustments were made to the receiver amplifier but this did little to improve theperformance.
At this the necessity of the PLL in the receiver was questioned. The ultrasonicreceiving transducer only resonates in the 40±1kHz range, so the problem of audiointerference will not be a problem, and the tone decoder is not needed to trigger on theamplified pulse when another device could do the same task by triggering on thevoltage levels, and do away with the tuning circuitry need for the NE567. Thus MKIIof the circuit used a comparator to produce a suitable output for the receiver. TheLM311 (IC4) was used, and the output of this chip is shown as the bottom trace in
Figure 6.2: Traces from ultrasonic rangefinding circuit. From top: Timing pulse fromNE555, input to transmitter, received signal after amplification, and signal after
comparator.
3KDVHORFNHGORRSWULDO
,PSURYHPHQWXVLQJ
FRPSDUDWRU

figure 6.2. The results from this new design were much more encouraging, so now theanalogue timing portion of the circuit could now be developed.
For the ramp a simple RC circuit was used, with an analogue switch used todischarge the capacitor and reset the circuit. A very long time constant is used, so thatonly the first few percent of the rise time are ever used as a ramp, and this part of theexponential is linear enough to model a voltage ramp. The RC combination is madeup of R16 and C11, and using a 4016 Quad Bilateral Switch for the discharge. The4016 switch is controlled by a 4013 Quad D type flip flop. This uses the starting pulseof the NE555, and the finishing pulse of the comparator to provide a logic low at itsoutput from the time of transmission of the ultrasonic pulses to their arrival back atthe receiver. This turns the analogue switch off for this period, allowing the ramp torise (almost) linearly during this time. Figure 6.3 shows this operation.
The top trace is the pulse provided by the NE555. Channel 2 shows thereceived pulses after being amplified and passed through the comparator. (Note thatthe pulses are not clear on this channel due to aliasing in the digital oscilloscope atthis relatively low scanning rate.) The forth trace shows the output of the D flip flop,thus controlling the period of the ramp, shown on channel three. It is obvious that thelonger the delay between transmission and reception, the longer the ramp time and thehigher its peak voltage, which will increase by 0.65V/mS (adjustable by R16). Thisramp output is buffered by the voltage follower created by a 741 op amp. Finally theoutput is passed into a crude peak detector with slow discharge via pot R17. Thisproduces a sawtooth waveform, the average of which is proportional to the distance ofthe closest object from the transducers.
This final output could be passed through a low pass filter for smootherresults, but this was not done on this initial prototype. This circuit provided betterresults than the design using the PLL, since the comparator always triggered on thereturned signals. However, the range of the device was still no more than 1.0m for areliable signal output. Further research indicated that these type of transducersinherently have a high Q, and performance can vary greatly over a transmissionfrequency range of a few hundred hertz, a fact not mentioned in the specifications. Avariable frequency generator unit was used to replace the initial 39.6kHz generator, sothat performance could be tuned with frequencies around 40kHz. Aswell, new and
9ROWDJHUDPSRSHUDWLRQ
Figure 6.3: Traces from the ultrasonic Circuit. from top; start pulse from NE555, outputfrom receiving comparator, voltage ramp, output from flip flop.
2XWSXWRI8OWUDVRQLFV\VWHP

higher quality transducers were obtained. This resulted in some extra sensitivity (up to2m), but the reliability was still insufficient for the device to be incorporated into therest of the project. It is also important to note that the laboratory experiments weredone by reflecting the sonic signals off hard objects such as books and walls. Humanbeings unfortunately are not quite so substantial, especially in a clinical situationwhere subjects are more likely to be donning loose fitting attire. It was at this stagethat a decision was made to discontinue the development of this circuit in favour ofmore pressing parts of the project. However a few ideas for further development wereentertained, but time will not permit experimental validation of these concepts. Thesewere:
• Use a solid reflector (eg: stiff plastic) on the subject to aid reflections.• Separate the transmitter and receiver. The transmitter could be battery
powered and clipped onto the walking subject. At the same instant that theultrasonic pulses are transmitted, an ultraviolet signal could also betransmitted by an array of UV LED’s. The receiver would time from thereception of the UV pulse to the arrival of the ultrasonic signals. Thiswould totally omit the need for a solid reflecting surface, but the circuitryand battery power will make for a more complicated circuit.
• Try other ultrasonic transducers available.This last notion was briefly explored when, along with another student, aninvestigation of a commercial sonar ranging module was carried out. The exact nameis the Polaroid 6500 series, and the device contains the a transducer (transmitter andreceiver combined) and driving circuitry. The module runs off a 5V supply, andaccepts a driving pulse from the user, at which point it will transmit pulses, processthe returned signal, and provide a logic output high when the pulses have returnedsatisfactorily. Unfortunately the unit requires high current for the period whentransmission occurs, of over 2A. For normal power supplies this is too great a drain,and as a result the supply voltage drops instantaneously, resetting the whole circuit.
Thus the output is never triggered. Experiments were conducted with morepower supplies and smoothing capacitors on the supply rails, but the unit still failed togive correct results. Eventually an idea was trialed which was to bypass a section ofthe modules circuitry and take a signal (which pulses high when the module senses thereturn waveforms) directly from a pin on an internal IC. This worked well and is easyto implement, requiring only one external logic IC. The module (costing around $50)offers a high range (we tested to over 7 metres) and good reliability, so this is a goodpossibility for the remainder of the project to be completed at a later date.
3UREOHPVDQGVROXWLRQVIRU
EHWWHUSHUIRUPDQFH
&RPPHUFLDOXQLWWHVWLQJDQGUHVXOW

simply transforms an analogue signal into a linear display. Pot P3 is used to adjust thevoltage level which corresponds to full scale deflection.
Figure 5.14: Schematic of position indicator circuit

Note that this oscilloscope trace covers one entire field. The top trace is the outputfrom 8 input nand gate IC11, showing the set of lines for which the marker is visible.The second trace is the output from IC7:D, showing the region selected for scanningby the user. This has been purposely place so that half of the ball is in the region,whilst the other half is outside, for the purpose of illustration. Channel 3 is connectedto the output of OR gate IC12:B, displaying the combination of the latched targetpulse, but only where the object is within the selected scanning region. Finally, thebottom trace shows the latched JK flip flop, which remains latched high until thebeginning of the next field. The bottom two traces bear closer examination. Figure 5.8shows more detail of the same example.
The top trace shows normal PAL picture information. The location of the ball isquite obvious here. The second trace is the output of OR gate IC12:A; after 8 lineswith target latches have been put into the shift register, the output of the OR gatefinally goes low (if the lines are within the selected scanning region). The third trace
is from the inverted output of the OR gate IC12:B. This combines the latched targetpulses, and thus the JK flip flop latches at the instant the target (the ball) is
Figure 5.7: Trace showing (from top) pulse after shift register, scanning region,combination with latched target, and final latching for whole field.
Figure 5.8: Trace showing picture information lines, output of OR gate, combinationwith latched target and latched JK flip flop.
/DWFKLQJRQWDUJHWDW
FRUUHFWWLPH

encountered. This is vital since the output of the JK latch will be controlling the inputsto the DAC.
This latching time is so important because the noninverted output of the flipflop (pin 5) latches binary time information from a 12 stage counter. The counter usedis the 74HC4040 (IC13), and the latch is a 74HC374 octal D type flip flop (IC14).The counter is driven by a 5MHz crystal oscillator, and is reset at the beginning ofeach picture line. The first eight binary digits are fed directly to the octal latch(controlled by the JK flip flop as above), and the outputs from the latch continue to theinputs of the digital to analogue converter.
This component is the commonly used DAC0800. From above it can be seenthat binary information is latched through once in every field, when a target is found.If no target is detected the latch remains in its previous state, and thus the DAC outputremains at the same level until a target is located. The DAC0800 has dual currentoutputs, so a LM741 is used to convert this to a voltage waveform, producing the finalvoltage output at pin 6. An example of the output is shown in figure 5.9. The camerais observing the motion of a table tennis ball swinging in front of the camera over aperiod of 50 seconds. The sinusoidal motion and the exponential decay of theamplitude are quite visible. The fist few periods of motion appear to have equalamplitudes; this is because the ball swings momentarily out of the image, thus thesignal appears clipped.
As mentioned at the beginning of this section 5.3, the circuit includes a 7-segment LED display to indicate how many markers the system can detect in thecurrent image. The number found is kept in a binary counter, another 74HC4040(IC17) which is reset at the end of every field. IC18 is a 4511 BCD to 7-segmentlatch/driver. The major problem in this part of the circuit is that the latch enable (LE)on the 4511 must be driven logic low (to allow new data into the latch) then high (tolock in the data) before the counter is reset. Since all of the available sync pulsesoccur simultaneously, some new pulses had to be created. This is where the extendedfield pulse is used. This longer field pulse is logic ORed with the short field pulse toprovide a negative going pulse (used to latch the 4511) which is just after the normalfield pulse (used to reset the counter). Figure 5.10 illustrates:
'LJLWDOWRDQDORJXHFRQYHUVLRQ
Figure 5.9; Example output of DAC, showing exponential damping of a pendulum.
8VHU,QWHUIDFH

The top two traces are the inputs to the OR gate. Trace 3 is the inverted short fieldpulse, used to latch the data into the display driver. Trace 4 is the output from the ORgate, and resets the binary counter just after the latch has occurred.
5.5 MOTOR PULSE GENERATION AND SAFETY
This section of the system takes the signal from the DAC and transforms itinto outputs that the stepper motor driver can use. Stepper motors have a number ofcoils (usually four) which are each externally accessible. The internal mechanics ofthe motor are such that the phases must be excited in a certain sequence for the shaftto rotate. The advantage of these motors is that each step in the sequence rotates theshaft by a specified amount, thus they are extremely useful for precision work sincethe position of the end effector is known to some accuracy, but complicated shaftencoders and feedback loops are not required for good results. They are also popularsince their design is very compatible with digital control. The motor used in thisproject has a rotation of 1.2° per step.
All stepper motor drivers require at least two inputs to control the motor, stepand direction. Often a half/full step option is also offered, where the half stepsequence is more complicated but offers better resolution that the sequence of phaseexcitation used in the full step control. Naturally the faster the steps, the faster themotor rotates. Thus the DAC 0-5V signal output must be transformed into a directionand step output for the motor driver. The dynamic control system will initially be asimple proportional output; ie the further the marker is from the middle of the image,the faster the motor will turn in the opposite direction to correct this. This willcertainly have to be improved to a more complex control system, but without thetrolley on which to mount the and test camera on, this is a futile task. The signalconditioning is represented in the block diagram below;
Figure 5.10; From top: inverted long field pulse, short field pulse, inverted shortfield pulse, result of OR between traces 1 and 2.
6WHSSHUPRWRUV

The signal is first put through a low pass filer. This is to reduce the impact ofany instantaneous disruptions in the signal, from momentary reflections, the markerbeing obscured, and so forth. The level has filtering has been carefully selectedbecause if the -3db point is too low, the RC circuit will introduce a phase differencethat will effect the dynamic response of the whole system. An offset is then introducedto the signal. The DAC output is 0-5V, but for upcoming parts of the circuit a signal isrequired that is centred about zero volts, so the offset (which is adjustable) shifts thewaveform while degrading it by a factor of two, to prevent clipping. A comparator isthen used to extract the direction signal. The offset signal is then rectified (to obtain aspeed magnitude) and finally passed to a VCO which produces pulses with afrequency proportional the voltage magnitude. The circuit is shown in more detail inschematic #4.
The lowpass filter is made from R18 and C4. The offset and degradation areachieved simply using a LM741 (IC32). The zero volts point is now the referencepoint for the centre of the image, since the speed and direction of the motor aredetermined by the amplitude of the signal voltage with respect to this point. Thus thevariable offset is useful, for the operator can define where on the image s/he wishesthe system to centre the marker on. The rectification is slightly more complicated. Asimple diode rectifier was insufficient since the 0.6V voltage drop inherent with suchdevices will distort the waveform. Thus active rectifiers were used, made up byIC33A and B, two halves of a LF412 dual fet op amp. This signal is then amplified byIC35, another LM741.
The direction in which the motor must turn is determined by the comparatorIC34, a LM311 comparator. Simply, if the signal is negative the motor turns in onedirection (at a speed determined by the amplitude), and if it is positive it turns in theother. The comparator is fitted with a 150mV hysteresis, because when the signal isaround zero volts, any noise would cause the motor to change directioninstantaneously, interrupting the tracking. The hysteresis is induced by R13 and R14.The hysteresis is controlled by the equation
L+ and L- are the saturation voltages of the comparator (+5V and -5V in this case).Values of R13 and R14 were chosen to be 47K and 1.5K respectively to give a
LP FilterDACsignal
Reductionand Offset
ActiveRectification VCO
Comparatorwith
HysteresisDirection
Speed
Figure 5.11: Block diagram of signal conditioning circuit'$&VLJQDOPRGLILFDWLRQ
5HFWLILFDWLRQ
/3ILOWHULQJDQGRIIVHW
&RPSDUDWRUZLWK
K\VWHUHVLV
L-
L+
V t2Vt1
V LR
RT113
14
= − +
V LR
RT 213
14
= − −
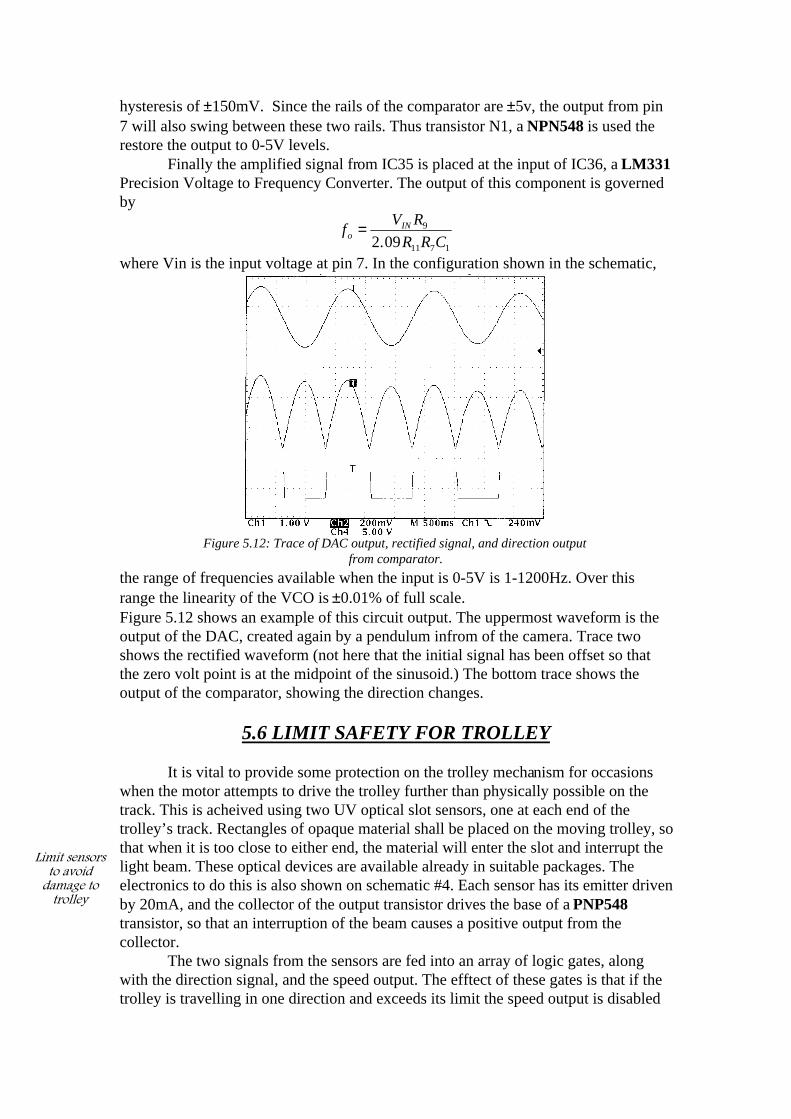
hysteresis of ±150mV. Since the rails of the comparator are ±5v, the output from pin7 will also swing between these two rails. Thus transistor N1, a NPN548 is used therestore the output to 0-5V levels.
Finally the amplified signal from IC35 is placed at the input of IC36, a LM331Precision Voltage to Frequency Converter. The output of this component is governedby
fV R
R R CoIN= 9
11 7 12 09.where Vin is the input voltage at pin 7. In the configuration shown in the schematic,
the range of frequencies available when the input is 0-5V is 1-1200Hz. Over thisrange the linearity of the VCO is ±0.01% of full scale.Figure 5.12 shows an example of this circuit output. The uppermost waveform is theoutput of the DAC, created again by a pendulum infrom of the camera. Trace twoshows the rectified waveform (not here that the initial signal has been offset so thatthe zero volt point is at the midpoint of the sinusoid.) The bottom trace shows theoutput of the comparator, showing the direction changes.
5.6 LIMIT SAFETY FOR TROLLEY
It is vital to provide some protection on the trolley mechanism for occasionswhen the motor attempts to drive the trolley further than physically possible on thetrack. This is acheived using two UV optical slot sensors, one at each end of thetrolley’s track. Rectangles of opaque material shall be placed on the moving trolley, sothat when it is too close to either end, the material will enter the slot and interrupt thelight beam. These optical devices are available already in suitable packages. Theelectronics to do this is also shown on schematic #4. Each sensor has its emitter drivenby 20mA, and the collector of the output transistor drives the base of a PNP548transistor, so that an interruption of the beam causes a positive output from thecollector.
The two signals from the sensors are fed into an array of logic gates, alongwith the direction signal, and the speed output. The efftect of these gates is that if thetrolley is travelling in one direction and exceeds its limit the speed output is disabled
Figure 5.12: Trace of DAC output, rectified signal, and direction outputfrom comparator.
/LPLWVHQVRUVWRDYRLGGDPDJHWRWUROOH\

until the direction input changes, at which time the speed output is once againenabled. Thus if the trolley travels too far along the track, it simply stops and waitsuntil the dirction signal instructs it to go in the opposite direction, instead ofsimplistically stopping and deadlocking the entire system.
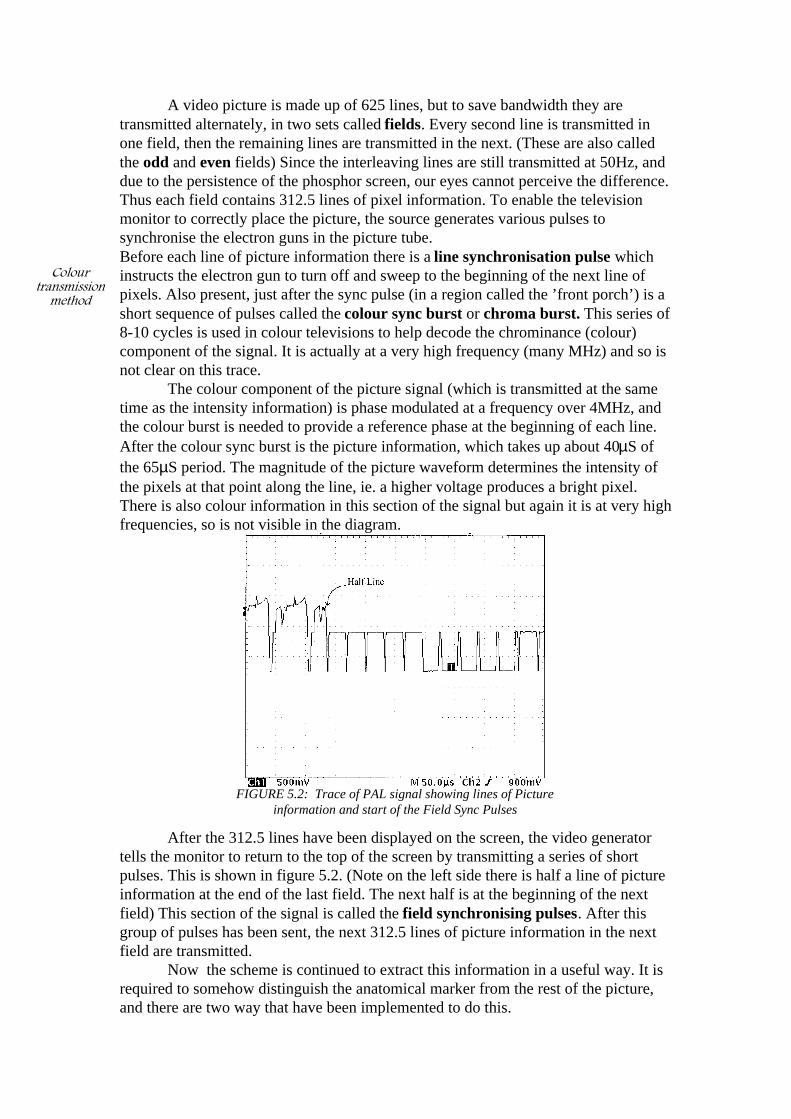
A video picture is made up of 625 lines, but to save bandwidth they aretransmitted alternately, in two sets called fields. Every second line is transmitted inone field, then the remaining lines are transmitted in the next. (These are also calledthe odd and even fields) Since the interleaving lines are still transmitted at 50Hz, anddue to the persistence of the phosphor screen, our eyes cannot perceive the difference.Thus each field contains 312.5 lines of pixel information. To enable the televisionmonitor to correctly place the picture, the source generates various pulses tosynchronise the electron guns in the picture tube.Before each line of picture information there is a line synchronisation pulse whichinstructs the electron gun to turn off and sweep to the beginning of the next line ofpixels. Also present, just after the sync pulse (in a region called the ’front porch’) is ashort sequence of pulses called the colour sync burst or chroma burst. This series of8-10 cycles is used in colour televisions to help decode the chrominance (colour)component of the signal. It is actually at a very high frequency (many MHz) and so isnot clear on this trace.
The colour component of the picture signal (which is transmitted at the sametime as the intensity information) is phase modulated at a frequency over 4MHz, andthe colour burst is needed to provide a reference phase at the beginning of each line.After the colour sync burst is the picture information, which takes up about 40µS ofthe 65µS period. The magnitude of the picture waveform determines the intensity ofthe pixels at that point along the line, ie. a higher voltage produces a bright pixel.There is also colour information in this section of the signal but again it is at very highfrequencies, so is not visible in the diagram.
After the 312.5 lines have been displayed on the screen, the video generatortells the monitor to return to the top of the screen by transmitting a series of shortpulses. This is shown in figure 5.2. (Note on the left side there is half a line of pictureinformation at the end of the last field. The next half is at the beginning of the nextfield) This section of the signal is called the field synchronising pulses. After thisgroup of pulses has been sent, the next 312.5 lines of picture information in the nextfield are transmitted.
Now the scheme is continued to extract this information in a useful way. It isrequired to somehow distinguish the anatomical marker from the rest of the picture,and there are two way that have been implemented to do this.
&RORXUWUDQVPLVVLRQ
PHWKRG
FIGURE 5.2: Trace of PAL signal showing lines of Pictureinformation and start of the Field Sync Pulses
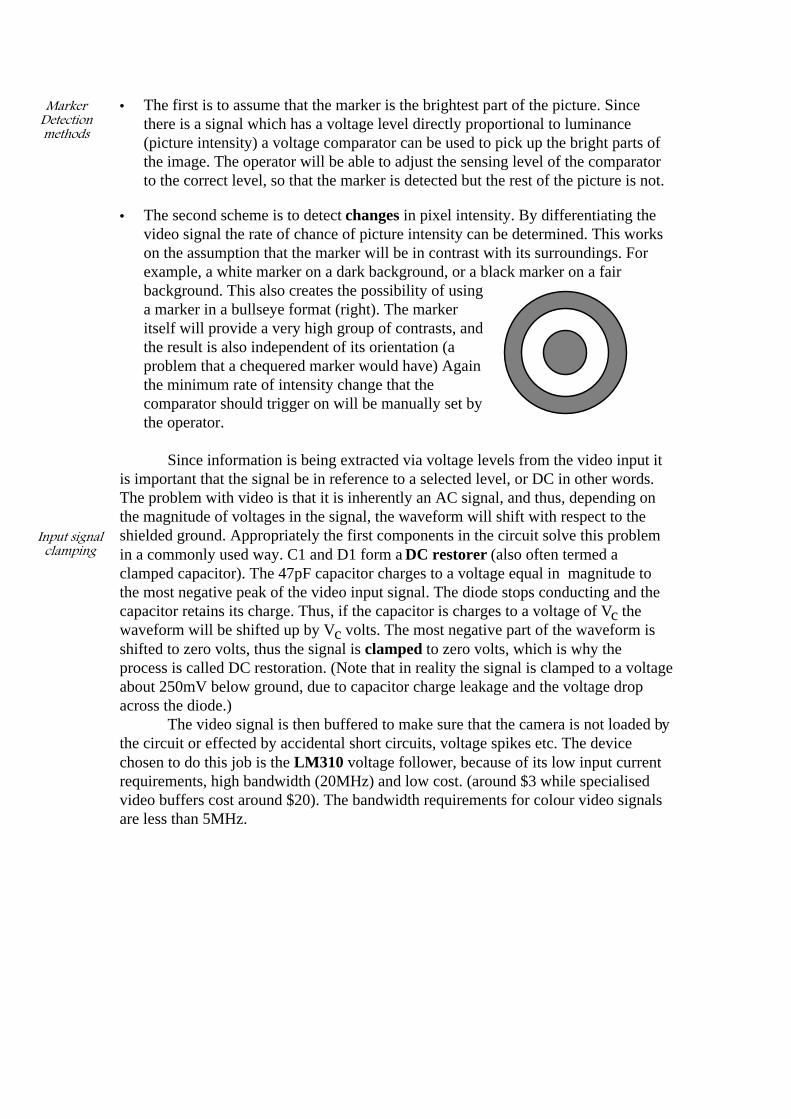
• The first is to assume that the marker is the brightest part of the picture. Sincethere is a signal which has a voltage level directly proportional to luminance(picture intensity) a voltage comparator can be used to pick up the bright parts ofthe image. The operator will be able to adjust the sensing level of the comparatorto the correct level, so that the marker is detected but the rest of the picture is not.
• The second scheme is to detect changes in pixel intensity. By differentiating thevideo signal the rate of chance of picture intensity can be determined. This workson the assumption that the marker will be in contrast with its surroundings. Forexample, a white marker on a dark background, or a black marker on a fairbackground. This also creates the possibility of usinga marker in a bullseye format (right). The markeritself will provide a very high group of contrasts, andthe result is also independent of its orientation (aproblem that a chequered marker would have) Againthe minimum rate of intensity change that thecomparator should trigger on will be manually set bythe operator.
Since information is being extracted via voltage levels from the video input itis important that the signal be in reference to a selected level, or DC in other words.The problem with video is that it is inherently an AC signal, and thus, depending onthe magnitude of voltages in the signal, the waveform will shift with respect to theshielded ground. Appropriately the first components in the circuit solve this problemin a commonly used way. C1 and D1 form a DC restorer (also often termed aclamped capacitor). The 47pF capacitor charges to a voltage equal in magnitude tothe most negative peak of the video input signal. The diode stops conducting and thecapacitor retains its charge. Thus, if the capacitor is charges to a voltage of Vc thewaveform will be shifted up by Vc volts. The most negative part of the waveform isshifted to zero volts, thus the signal is clamped to zero volts, which is why theprocess is called DC restoration. (Note that in reality the signal is clamped to a voltageabout 250mV below ground, due to capacitor charge leakage and the voltage dropacross the diode.)
The video signal is then buffered to make sure that the camera is not loaded bythe circuit or effected by accidental short circuits, voltage spikes etc. The devicechosen to do this job is the LM310 voltage follower, because of its low input currentrequirements, high bandwidth (20MHz) and low cost. (around $3 while specialisedvideo buffers cost around $20). The bandwidth requirements for colour video signalsare less than 5MHz.
0DUNHU'HWHFWLRQPHWKRGV
,QSXWVLJQDOFODPSLQJ
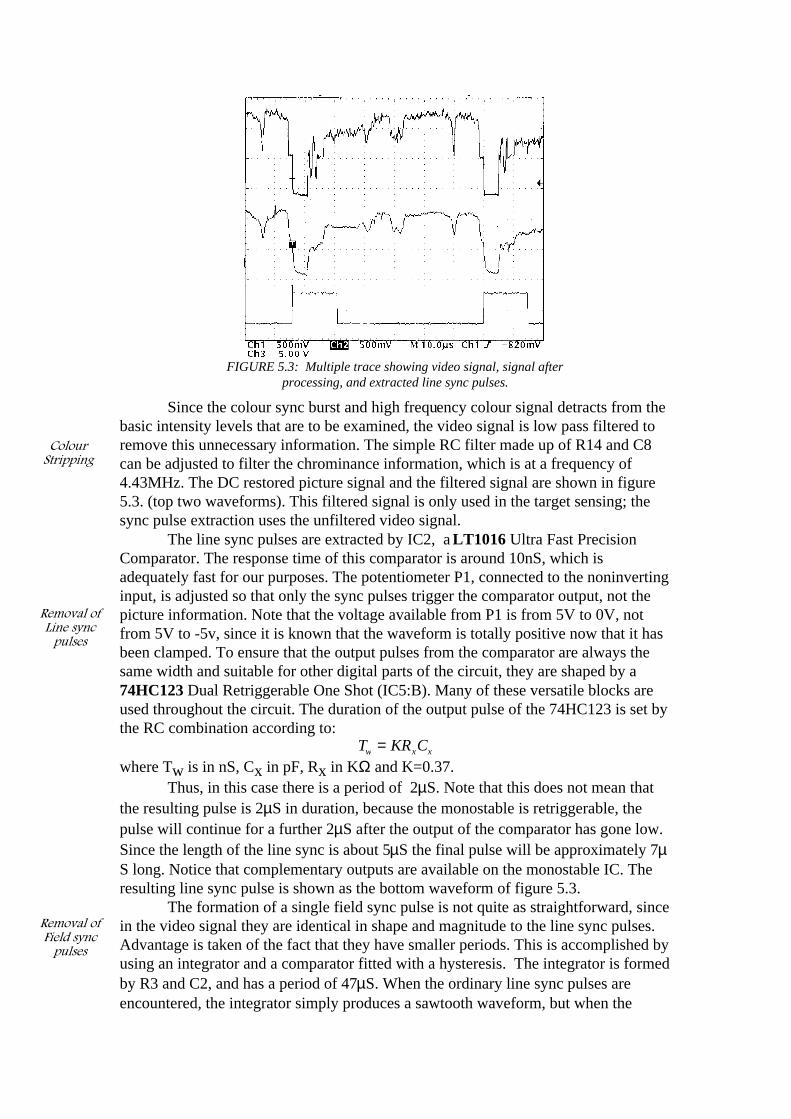
Since the colour sync burst and high frequency colour signal detracts from thebasic intensity levels that are to be examined, the video signal is low pass filtered toremove this unnecessary information. The simple RC filter made up of R14 and C8can be adjusted to filter the chrominance information, which is at a frequency of4.43MHz. The DC restored picture signal and the filtered signal are shown in figure5.3. (top two waveforms). This filtered signal is only used in the target sensing; thesync pulse extraction uses the unfiltered video signal.
The line sync pulses are extracted by IC2, a LT1016 Ultra Fast PrecisionComparator. The response time of this comparator is around 10nS, which isadequately fast for our purposes. The potentiometer P1, connected to the noninvertinginput, is adjusted so that only the sync pulses trigger the comparator output, not thepicture information. Note that the voltage available from P1 is from 5V to 0V, notfrom 5V to -5v, since it is known that the waveform is totally positive now that it hasbeen clamped. To ensure that the output pulses from the comparator are always thesame width and suitable for other digital parts of the circuit, they are shaped by a74HC123 Dual Retriggerable One Shot (IC5:B). Many of these versatile blocks areused throughout the circuit. The duration of the output pulse of the 74HC123 is set bythe RC combination according to:
T KR Cw x x=where Tw is in nS, Cx in pF, Rx in KΩ and K=0.37.
Thus, in this case there is a period of 2µS. Note that this does not mean thatthe resulting pulse is 2µS in duration, because the monostable is retriggerable, thepulse will continue for a further 2µS after the output of the comparator has gone low.Since the length of the line sync is about 5µS the final pulse will be approximately 7µS long. Notice that complementary outputs are available on the monostable IC. Theresulting line sync pulse is shown as the bottom waveform of figure 5.3.
The formation of a single field sync pulse is not quite as straightforward, sincein the video signal they are identical in shape and magnitude to the line sync pulses.Advantage is taken of the fact that they have smaller periods. This is accomplished byusing an integrator and a comparator fitted with a hysteresis. The integrator is formedby R3 and C2, and has a period of 47µS. When the ordinary line sync pulses areencountered, the integrator simply produces a sawtooth waveform, but when the
FIGURE 5.3: Multiple trace showing video signal, signal afterprocessing, and extracted line sync pulses.
&RORXU6WULSSLQJ
5HPRYDORI/LQHV\QFSXOVHV
5HPRYDORI)LHOGV\QFSXOVHV

pulses become closer together the integrator causes a culmination of voltage for ashort time. This can be seen in figure 5.4.
The pulse is sharpened and made more friendly to digital processing by IC4, asimple LM311 comparator (IC4). The hysteresis has an upper trigger point of 3V anda lower point of 2.5V. This range is slightly adjustable by use of potentiometer P3,which should be tuned so that a clean, single pulse is obtained at the output of thecomparator. This pulse is sent to a 74HC123 (IC5:A) which creates and output pulseof 30µS. Note that a similar pulse is created by another monostable (IC6:A). This hasa special purpose, which will be elaborated on later. This component shall be ignoredfor now expect to note that it produces a pulse shorter than the other.
Now attention is turned to the target sensing. As mentioned before, there aretwo schemes available to detect the presence of the marker in the image. The SPDPswitch S1 chooses between these two options. The first option (triggering onintensity) connects the filtered video signal straight to the noninverting input of IC3,another LT1016. This high speed comparator triggers when the signal amplitude risesabove that set by potentiometer P2, signifying that a bright spot has been located. P2is set by the operator to a voltage at a level that will detect the marker sufficiently, butnot low enough, so that other objects or ambient light will trigger the comparator. Theoutput of the comparator is connected to the input of another monostable (IC6:B)which produces a pulse of duration 0.8µS.The second option is the differentiated signal. IC10:A, a LM347 quad opamp isconfigured as a differentiator by the RC combination of C9 and R2. The output is
V RCdV
dtoutin= −
The following opamp (IC10:B) is used as an inverter to get the signal in the formatrequired. This resulting waveform is placed at the input of the LT1016 comparator asbefore. Figure 5.5 shows (from top to bottom) a line of picture information, thedifferentiated and inverted signal, and the resulting output from the monostable whenP2 is appropriately set.
FIGURE 5.4: Waveforms from top to bottom: Field synchronisationpulses, integrator output, resulting field sync pulse from monostable..
,QWHQVLW\VHQVLQJ
&RQWUDVWVHQVLQJ

Note that the target pulses (the output from the monostable) are many andbunched together where the comparator triggers repeatedly. This ’bouncing’ is not aproblem since the target pulse is latched by IC9:A. This latch is made from a74HC107 Dual JK Flip Flop with Clear. The latch is reset at the beginning of everyline by a line sync pulse from IC5:B, and if a target pulse is sent by the output ofmonostable IC6:B, the flip flop remains latched until the beginning of the next line ofpicture information. The output from this latch is shown on the bottom of figure 5.5.The reason for this latch will become apparent in later circuit sections. It is importantto note, however, that this latching of the target pulse means that any further targetpulses on the same line will have no effect on the latch, and thus are ignored by thecircuit. This causes the system as a whole to search for the brightest mark which is theleftmost and highest on the screen, because the circuit if alway scanning from top tobottom and left to right.
5.3 SCANNING LIMITS AND VIDEO OUTPUT
This section of circuitry contains most of the operator controls and the videooutput, which can be sent for recording or direct viewing on a monitor. The circuitdiagram is shown overleaf in schematic #2. Note that the video signals from theoutput of this circuit (or the camera alone) cannot be seen directly on a television set,because they are in a composite video format. This means that video and audiosignals are separated (so two cables are needed for image and sound, but this is notapplicable in our case since audio is not required.) and are not modulated. Becausestandard TV sets require a RF input, the video output from this circuit will need to beput through a VCR (a model able to accept composite inputs) which will convert toRF signals. Alternatively, some modern television monitors will accept compositesignals directly. It is apparent which monitors and VCRs accept composite signals bythe existence of separate video and audio input plugs at the rear.
As mentioned in chapter 3 a method is needed to select a region in which toscan for the marker, so that other bright objects in view do not effect the operation ofthe system. This piece of electronics enables the operator to select the scanningregion, choose whether to display the scanning limits on the screen (or whatever
FIGURE 5.5: From top to Bottom; Filtered PAL signal,differentiated signal, target pulses, latched target pulses.
&RPSRVLWHYLGHR
UHTXLUHPHQWV

output is used) and whether to show targeting information on the screen. (This lastoption will be explained shortly)
In point form the circuit areas covered are:• Pushbutton pulse generation• Region counting• Toggle output• Display method for monitor• Output buffer• Visual targeting information
The scanning region will be selected by two push buttons, which will changethe upper and lower limits of the region. It should be pointed out that the term’scanning region’ does not mean that outside of this region the target comparators andmonostables do not operate, it means instead that any target pulses triggered outsidethis region will be ignored (as long as this option is selected.) Each push button isconnected to a NE555 timer (IC22 and IC23), configured as astable multivibrators.When a button is pressed the corresponding timer will produce a square wave outputwith a frequency of around 7Hz. The frequency is determined by the equation (forIC22):
fR R C
=+1 44
1 2 2 1
.
( )This square wave is sent to the clock input of half of a 74HC393 Dual Binary
Counter (IC24) . IC25 is a 74HC4040 12 Stage Binary Counter . This counter has itsclock input connected to the output of the line pulse monostable, and its reset input tothe output of the field pulse monostable. Thus it keeps count of the current linenumber, and is reset to zero at the beginning of every new field. The next componentsof interest are two 74HC85 Four Bit Magnitude Comparators (IC26 and IC27). Theseaccept two four bit words and produce an output which indicates whether input word’A’ is less than, equal to, or greater than input word ’B’. Each magnitude comparatorhas its ’A’ inputs connected to one of the 74HC393 counters, and its ’B’ inputsconnected to four outputs of the 12 Bit Counter. Since the 74HC393 is only a four bitcounter, only 16 different states can be moved through before it repeats, and thus thescreen can be split into 16 sections at the most. So, although there are 312.5 lines (the4040 counter will count to 313) the circuit only needs to count from zero to 16 (orless). Thus the outputs used on the 74HC4040 are Q5-Q9. The Q5 output will dividethe output by 25=32, and 313/32 = 9.78.So now the circuit has a counter which counts from zero to nine as the pixel lines aretransmitted, and two counters that can be set at any number between zero and sixteen.Further explanation will be made easier in the form of an example, using decimalnumbers: Consider the case where counter IC24:A has been set to 2, IC24:B to 7, and IC25counts from 0 to 9 as lines are transmitted as usual.
3XVKEXWWRQRSHUDWLRQ
5HJLRQFRXQWHU

IC28:A is a J-K Flip Flop wired in a toggle configuration, so that a positive pulse setsthe output, and the next pulse resets it, and so on. Initially the line counter will bezero, and the toggle output will be low. As the counter progresses, it will reach ’2’, andsince this is also at the output of IC24:A, the comparator ’=’ output will go high. TheOR gate is IC12:D, a 74HC32. The output of this will not go high also, and cause thetoggle output to go high. The line counter will continue, and the comparator outputwill go low again, but the toggle output will remain high. Finally, when the linecounter reaches ’7’, the equality output of the lower comparator (IC27) will go high,and thus the output of the OR gate also. Since the output of the toggle is currentlyhigh, it will now go low. The line counter will continue counting until the end of theframe, where it will reset, and exactly the same will happen for the next frame. So,between the chosen numbers (2 and 7) the output of the toggle is high, and lowelsewhere. And since the two counters can be set by using the push buttons, a regionof the image is now able to be selected.
Note that neither push button is actually assigned to ’upper limit’ and ’lowerlimit’ because if, in the previous example, the IC24:A had a value of ’7’ and IC24:Bhad a value of ’2’, the outcome would be exactly the same. So effectively the regionstarts at the value of the lowest counter and finishes at the highest value. One sideeffect of this scheme occurs when both counters are of the same value. Thus the inputto the toggle is only high once per frame. Thus the output of the toggle is high for anentire frame, then low for the next, and so on. The number of regions available in theimage could be increased by simply using 8 bit counters and comparators instead ofthe 4 bit components used on this prototype board. If a PCB is produced then thechance would be conceptually easy to implement. A solution to the above side effect(when both counters are equal) is to use an XOR gate instead of an OR, thus thetoggle input will not be triggered when both equality outputs from the comparatorsfire at the same time. Again, this would be easy to implement if a PCB wasmanufactured, but is not a high priority on this prototype.
The next part of this circuit displays this region of the screen so the user cansee exactly what parts of the image are to be excluded from targeting. The output ofthe toggle is sent to one input of a 74HC00 Nand gate (IC20:A). The other input isconnected to pin 5 of IC5:B, which is the line pulse monostable.
Thus the output (pin 3) of the nand gate goes low for a brief period at the startof every picture line that is in the selected scanning region, but not for lines that areoutside this region. This output triggers a 74HC123 monostable, which has a pulselength adjustable from 0-120µS. To change the appearance of the video image, three74HC4066 Analog Switches are used (IC30:A-C). These bidirectional switches havea sufficiently low ’on’ resistance (105Ω max) and fast switching speeds (40nS max). Itis required that the inside and outside of the scanning regions be distinguishable, so it
count
2
7
0-9
A
B
A
B
=
=
toggle
output
IC24:A
IC24:B
([DPSOHRIRSHUDWLRQ
3RVVLEOHLPSURYHPHQWV
0HWKRGWRGLVSOD\RQRXWSXWPRQLWRU
was decided to make the outside of the scanning region darker than the inside, butwith the image still visible.
When inside the scanning region (the output of the toggle is high) the75HC123 monostable will produce a pulse starting from the at the beginning of everyline in that region. The length of this pulse is adjustable, and it is required to be equalin length to the whole 40µS of picture information. This positive pulse (from pin 5 ofIC29:B) will turn on analog switch IC30:B and thus connect the normal video signal(from the input video buffer) through to the output video buffer. Assume for themoment that analogue switch IC30:C is turned on. When outside the scanning region,the complimentary output on the monostable is high, and thus switch IC30:A is turnedon. The signal input to this switch is a potentiometer which provides a signalproportional to the input video signal. That is, the signal input to the switch can bevaried linearly from zero volts, to the full video signal. Remember that since thepicture information has a voltage proportional to intensity, the closer to zero volts thesignal is, the darker the image will be. However, if the signal is depleted too much bypotentiometer P1, the VCR/monitor will no longer be able to decode the image, sincethe line and field sync pulses will also be diminished.
The output of this analogue switch is again connected to the output buffer. Sonow the system creates an image with dark regions outside the scanning region, andnormal image inside. The output buffer (IC31), like the input buffer, is a LM310voltage follower, connected to a BNC female socket.
The third analog switch is used for showing targeting information on thescreen. That is, the graphically display exactly where on the video image the targetpulses are being triggered. This is very handy for the operator, since now they do notneed to guess what the system is following, they can now visually see what parts ofthe image are being triggered, and adjust the comparator levels accordingly, so that, inconjunction with the scanning region, only the required marker is triggered on. Figure5.6 ,over the page shows an example.
2XWSXWYLGHREXIIHU
9LVXDOWDUJHWLQJ
LQIRUPDWLRQ

The top image is the normal videoframe, showing a bright object,and a table tennis ball pendulum.The second image shows theoutput when the targetinginformation is overlayed. The thisis done by simply switching offthe video signal for the instantwhen the target pulse is high. Sothe input of the third analogueswitch is connected to the invertedoutput of the target pulsemonostable (IC6, pin 12), and thisputs a dark spot on the screenwhenever the monostable istriggered, and the user canvisually see where the circuit isdetecting bright spots. The next isan example of a screen with ascanning region selected, so as toexclude the upper bright object,but still allow the circuit to trackthe ball on its trajectory.
Figure 5.6 Sequence of frames showing two bright objects,target marking, and region selection


