Rei
gate
& B
anst
ead
ICEN
I PR
OJE
CTS
LI
MIT
ED
ON
BEH
ALF
OF
REI
GAT
E &
BAN
STEA
D B
C
N
OVE
MB
ER
2019
Reigate & Banstead Housing Needs Assessment
Final Report
Iceni Projects Limited on behalf of
Reigate & Banstead BC
November 2019
Iceni Projects London: Da Vinci House, 44 Saffron Hill, London, EC1N 8FH Glasgow: 177 West George Street, Glasgow, G2 2LB Manchester: 68 Quay Street, Manchester, M3 3EJ
t: 020 3640 8508 | w: iceniprojects.com | e: [email protected] linkedin: linkedin.com/company/iceni-projects | twitter: @iceniprojects
CONTENTS
1. INTRODUCTION......................................................................................................... 1
2. NATIONAL PLANNING POLICY AND GUIDANCE.................................................... 3
3. THE DEMOGRAPHIC STARTING POINT.................................................................. 4
4. DEMOGRAPHIC PROJECTIONS .............................................................................. 6
5. AFFORDABLE HOUSING........................................................................................... 9
6. THE NEED FOR DIFFERENT SIZES OF HOMES .................................................. 33
7. CONCLUSIONS ........................................................................................................ 41
APPENDICES
A1. COMPONENTS OF POPULATION CHANGES
0
1. INTRODUCTION
1.1 Reigate & Banstead Borough Council is currently in the process of preparing a series of
Supplementary Planning Documents (SPDs) including an Affordable Housing SPD. To inform the
Affordable Housing SPD, the Council has commissioned Iceni Projects (“Iceni”) and Justin Gardner
Consulting (“JGC”) to prepare a Housing Needs Assessment which considers the need for
affordable housing; including addressing the expanded definition of affordable housing in the
Framework before setting out what mix of affordable housing should be sought in new development
schemes.
1.2 The Council’s Local Plan is comprised of its Core Strategy adopted in July 2014 and reviewed in
July 2019 and the Development Management Plan (DMP) adopted in September 2019.
1.3 The Core Strategy outlines a housing requirement to deliver at least 6,900 dwellings (2012-2027)
equivalent to at least 460 dwellings per annum. Specifically, it requires the delivery of a minimum of
1,500 gross affordable homes over the plan period. Within the Core Strategy there are no policies
detailing requirements for the type, size and tenure mix of affordable housing, instead Policy CS14
requires “housing developments to contain an appropriate mix of dwelling sizes in accordance with
assessments of housing need, site size and characteristics” and Paragraph 7.5.3. advises that the
requirements will be informed by regular assessment and monitoring of the housing market through
updates to the Strategic Housing Market Assessment (SHMA) and that these updates will form
basis for guidance in supplementary planning documents.
1.4 Throughout the beginning of 2019, the Council’s officers carried out a review of the Core Strategy’s
policies in accordance with the Town and Country Planning (Local Planning) (England)
(Amendment) Regulations 2017; and found that none of the policies in the core strategy require
updating or modification at this time. This was approved by Full Council on 2nd July 2019. With
regards to the size and type of market and affordable housing the review noted that:
Policy CS14 “Housing Delivery” is flexible to respond to changing needs given that it refers
to the mix reflecting assessments of local need and does not prescribe targets for the
delivery of specific types and sizes of market and affordable housing.
Policy CS15 “Affordable Housing “is flexible to respond to changing needs given that
criterion (2) states that “the mix of tenures, including rented, and a mix of sizes and types
should reflect the current assessment of housing needs”.
Policy CS15 “Affordable Housing” remains the most appropriate and most realistically
achievable target for affordable housing given recent viability evidence and given that the
Core Strategy Inspector identified (Paragraph 67 of his report) “if, as at Reigate &
1
Banstead, total housing supply is constrained, substantial alternative funding would be
required if greater inroads into the affordable housing need were to be made; there was no
evidence of this at the examination”. The review noted that this situation remains today (i.e.
the borough still has a constrained housing target) and there has been no significant
change or uplift in the availability of funding locally to support substantial increases in
affordable housing delivery.
1.5 This assessment provides guidance on appropriate mix of dwelling types, sizes and tenures. It
reflects on the anticipated average housing delivery over the next 10 years; drawn from the
Council’s Housing Trajectory1 over the period from 2019/20 – 2028/29.
1 Available at: http://www.reigate-banstead.gov.uk/downloads/file/5750/housing_trajectory_2019
2
2. NATIONAL PLANNING POLICY AND GUIDANCE
2.1 This section sets out a brief overview of the national planning policy context.
National Planning Policy Framework (February 2019)
2.2 The latest version of the National Planning Policy Framework (“the Framework”) was published by
Government on 19th February 2019. The Framework (paragraph 7) states that the purpose of
planning is to contribute to the achievement of sustainable development. It states (paragraph 9)
that planning policies and decisions should play an active role in guiding development towards
sustainable solutions, but in doing so should take local circumstances into account, to reflect the
character, needs and opportunities of each area.
2.3 The Framework (paragraph 61) is also clear that within this context, the size, type and tenure of
housing needed for different groups in the community should be assessed and reflected in planning
policies including, but not limited to, those who require affordable housing.
2.4 The NPPF Glossary (Annex 2) provides an updated definition of affordable housing; as well as
definitions of Build to Rent development and local housing need. It now identifies affordable
housing as including affordable housing for rent, starter homes, discounted market sales and other
affordable routes to home ownership (including shared ownership, equity loans, rent to buy and
other low cost homes for sale).
3
3. THE DEMOGRAPHIC STARTING POINT
3.1 The Reigate & Banstead Local Plan: Core Strategy was adopted on 3rd July 2014. In accordance
with the Town and Country Planning (Local Planning) (England) (Amendment) Regulations 2017
which came into force in April 2018, the Council were required to complete a review of the Core
Strategy by 3rd July 2019.
3.2 In line with the statutory obligations, a thorough review of each individual policy within the Reigate
& Banstead Core Strategy was undertaken, following the legislation, the Framework and the PPG.
3.3 This review concluded that each of the policies are in broad conformity with the provisions of the
Framework and all other relevant national policies. It also identified that the latest evidence and
monitoring data demonstrates that the policies of the Core Strategy are operating effectively and
delivering positively against the requirements, objectives and indicators in the Plan. Consequently,
it concluded that none of the policies in the Core Strategy require updating or modification at this
present time. The review was approved by Full Council on 2nd July 2019.
3.4 The Core Strategy covers the period from 2012 to 2027 and outlines a housing requirement of at
least 6,900 dwellings over this plan period, equal to at least 460 homes per annum. At 1st April
2019, the Council has delivered 3,647 homes (i.e. a surplus of 427 homes); which leaves a residual
housing requirement over the period to 2027 of 3,253 homes.
3.5 The Council’s most recent Housing Trajectory (produced August 2019 with a base date of 31st
March 2018)2 projects housing land supply and delivery over the remainder of the Core Strategy
plan period to 2027. It details that based on the most recent information; the Council anticipates
delivering a total of 8,145 dwellings over the plan period. The Trajectory also details an expected
delivery of 355 dwellings beyond the plan period (2027/2/8-2029/30) from the delivery of the 3Sustainable Urban Extensions .
2 Available at: http://www.reigate-banstead.gov.uk/downloads/file/5750/housing_trajectory_2019
3 It should be noted that DMP Policy MLS1 “Managing Land Supply” states that the Sustainable Urban Extensions will only
be released for development when the Council’s Housing Monitor forecasts that the authority will not be able to demonstrate
a five year land supply over the next year and subsequent year. The Housing Trajectory paper shows that without the
Sustainable Urban Extensions, the Council can maintain a five year land supply until 2024/25. In line with DMP Policy
MLS1, the current evidence therefore suggests that the Sustainable Urban Extensions will need to be released for
development in 2023/24. Based on past delivery and delivery information provided as part of the DMP Examination it is
4
3.6 The Council’s Housing Trajectory anticipates the delivery of an average of 586 dwellings per
annum over the remainder of the plan period.
Table 3.1 Table 1 Housing Trajectory
2019/20 2020/21 2021/22 2022/23 2023/24 2024/25 2025/26 2026/27 Completions 0 0 0 0 0 0 0 0 Planning Permissions 556 819 556 397 235 70 0 0 Windfalls 75 75 75 75 75 75 75 75 Town Centre Allocations 0 0 0 20 20 45 80 15 Allocations Rest of the Urban Area 0 0 40 40 0 175 180 115
HELAA Sites 0 0 0 0 0 0 25 27 Other sites incl. 5 YLS 0 30 30 0 0 0 0 0 Sustainable Urban Extensions 0 0 0 0 0 0 285 330
Total Supply Per Annum 631 924 701 532 330 365 645 562
3.7 This assessment therefore assumes an average annual delivery of approx. 580 homes per annum
over the 10 year period from 2019 to 2029. This figure forms the demographic starting point for
this study.
anticipated that not all of the units on the Sustainable Urban Extensions will be delivered in this plan period. The Housing
Trajectory paper therefore outlines the expected delivery from the Sustainable Urban Extensions beyond the plan period.
5
4. DEMOGRAPHIC PROJECTIONS
4.1 This section sets out bespoke demographic projections which have been developed in order to
provide guidance on the appropriate mix of dwelling types, sizes and tenures of housing associated
with the average annual delivery of 580 homes per annum over the period from 2019 to 2029.
4.2 The analysis uses the 2016-based SNPP as a baseline projection, to which adjustments are made
to migration so that the change in population (and ultimately households) matches an increase of
5,800 dwellings over the 10 year period to 2029. Additionally, data about household representation
(i.e. the chances of a person of a particular age being considered as the head of household) has
been drawn from the 2014-based SNHP – this older version of official projections has been used
due to generally accepted problems with the 2016-based data in terms of building in additional
suppressed household formation. .
4.3 Within the modelling, changes to migration have been applied on a proportionate basis; the
methodology assumes that the age/sex profile of both in- and out-migrants is the same as
underpins the 2016-based SNPP with adjustments being consistently applied to both internal
(domestic) and international migration. Adjustments are made to both in and out migration (e.g. if
in-migration is increased by 1% then out-migration is reduced by 1%). The analysis also assumes a
3% vacancy allowance, which is fairly standard for assessments of this nature. To match the 580
dpa figure for the 2019-29 period, the modelling sees a very slightly lower projected level of
migration than underpins the 2016-based SNPP.
4.4 In summary, to develop a projection linked to the anticipated average delivery of 580 homes per
annum, the following key assumptions have been used:
2016-based SNPP as the base for population dynamics (including birth/death schedules
and age/sex profile of migration);
Population data for mid-2018 to provide a revised 2018 base;
Rolled forward 2018-2019 on the basis of projected population growth in the 2016-based
SNPP;
Converting population into households by using the 2014-based SNHP HRRs with a part
return to trend adjustment for the 25-34 and 35-44 age groups (LPEG adjustment) –
improvements assumed to start post-2019; and
Convert households into dwellings with a standard 3% vacancy allowance
6
4.5 The table below shows how the age structure of the population is expected to change with the
anticipated delivery of 5,800 dwellings over the 10-years to 2029.
4.6 Reigate & Banstead’s population is projected to grow by 7% over the 10-year period, which is
broadly similar to the rate of that seen in the 2016-based SNPP (and 40% lower than the 2014-
based SNPP). Population growth is projected across a range of age groups, but with the strongest
growth overall expected in those aged over 65 linked to changes in the population age structure
and improving longevity.
Table 4.1 Population Change by Five-Year Age Bands, 2019 to 2029
Age Range Population 2019 Population 2029 Change in Population
% Change from 2019
Under 5 9,448 9,399 -49 -0.5% 5-9 10,210 9,902 -307 -3.0% 10-14 9,363 10,030 667 7.1% 15-19 7,600 9,403 1,803 23.7% 20-24 6,401 6,247 -154 -2.4% 25-29 7,991 6,876 -1,115 -14.0% 30-34 9,286 8,821 -465 -5.0% 35-39 10,614 10,453 -161 -1.5% 40-44 11,015 11,231 216 2.0% 45-49 10,878 11,394 516 4.7% 50-54 10,936 11,061 125 1.1% 55-59 10,082 10,574 493 4.9% 60-64 8,024 10,060 2,036 25.4% 65-69 7,009 8,948 1,939 27.7% 70-74 7,134 7,073 -60 -0.8% 75-79 4,889 6,116 1,226 25.1% 80-84 3,767 5,790 2,023 53.7% 85+ 4,385 5,745 1,360 31.0% Total 149,032 159,125 10,092 6.8% Source: Demographic Projections
4.7 The table below shows how the profile of different types of household is projected to change. The
strongest growth is projected in couple households aged over 65. However, growth in both family
and other households is expected as well as well as households which include other adults (such
as those including adult children).
7
Table 4.2 Change in Household Types, 2019 to 2029
2019 2029 Change %
Change One-person household (aged 65 and over) 7,325 8,102 778 10.6% One-person household (aged under 65) 8,474 8,475 0 0.0% Couple (aged 65 and over) 7,721 10,179 2,457 31.8% Couple (aged under 65) 8,861 8,166 -694 -7.8% A couple and one or more other adults: No dependent children
5,212 6,061 849 16.3%
Households with one dependent child 8,193 9,169 976 11.9% Households with two dependent children 8,395 9,202 807 9.6% Households with three dependent children 2,560 2,408 -153 -6.0% Other households 3,686 4,297 611 16.6% TOTAL 60,427 66,058 5,631 9.3% Total households with dependent children 19,148 20,779 1,630 8.5% Source: Demographic projections
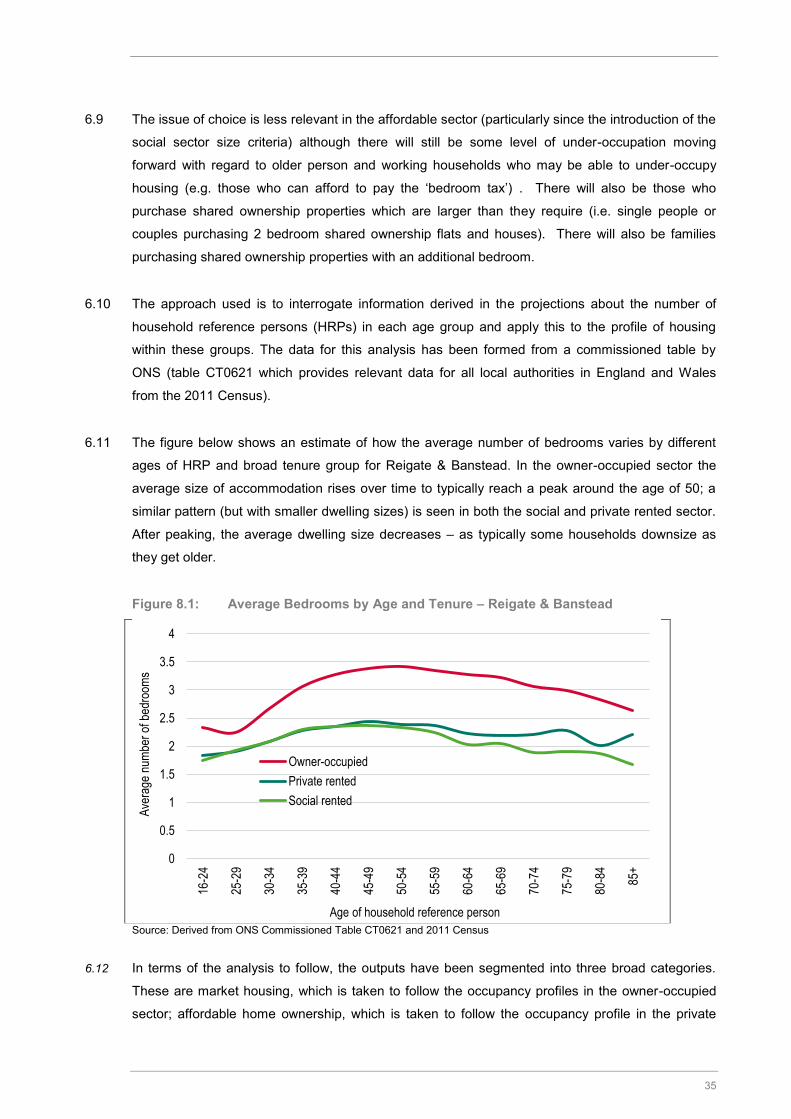
4.8 The table below shows the growth in the age profile of heads of households in each area. Again,
the strongest growth is in those aged over 65
Table 4.3 Projected Change in Households by Age of Household Reference Person, 2019 to 2029
Age Range Households 2019 Households 2029 Change in Households % Change 16-24 870 882 12 1.3% 25-29 2,700 2,281 -419 -15.5% 30-34 4,323 3,965 -358 -8.3% 35-39 5,433 5,455 22 0.4% 40-44 6,090 6,290 199 3.3% 45-49 6,219 6,431 211 3.4% 50-54 6,367 6,390 22 0.3% 55-59 6,118 6,434 315 5.2% 60-64 4,794 6,089 1,295 27.0% 65-69 4,218 5,589 1,371 32.5% 70-74 4,600 4,628 28 0.6% 75-79 3,257 4,016 759 23.3% 80-84 2,659 4,011 1,352 50.8% 85 + 2,778 3,600 822 29.6% Total 60,427 66,058 5,631 9.3% Source: Demographic projections
8
5. AFFORDABLE HOUSING
5.1 This section provides analysis of mix of affordable housing required to meet future needs in
Reigate & Banstead (and the three sub-areas within Reigate & Banstead). It takes account of the
amended definition of affordable housing in Annex 2 of the National Planning Policy Framework
(NPPF)
5.2 The revised NPPF defines affordable housing, as “housing for sale or rent, for those whose needs
are not met by the market (including housing that provides a subsidised route into home ownership
and/or is for essential local workers)” and then goes on to set out that this includes affordable
housing for rent; starter homes; discounted market sale housing; and other affordable routes into
home ownership.
5.3 In order to understand the mix of affordable housing required to meet future needs in Reigate &
Banstead, the first step is to assess the affordable housing need over the plan period. To do this,
we have used the methodology set out by Government in Planning Practice Guidance (PPG). This
is however largely the same as the method in the previous PPG and does not really address those
households who require support to become homeowners. We therefore additionally consider the
needs of households who might be able to rent without financial support but who aspire to own a
home and require support to do so.
5.4 For some of the analysis in this section it has been necessary to draw on other sources of data
(applied to local information) to make estimates of the need. The approach is consistent with the
PPG (Housing and economic needs assessment – see 2a-020 for example) and includes linking
local Census data to national changes (as evidenced in national survey such as the English
Housing Survey).
5.5 Additionally, information drawn from local surveys previously undertaken by JGC across the
country has been used to look at potential prevalence rates for some elements of need where
comprehensive local data is lacking. This includes considering what proportion of households in the
private rented sector might have a need due to potential loss of accommodation (e.g. tenancies
ending) although again such rates are applied to local information about the size of the sector. It
should be noted that this assessment is purely to understand the resulting types of affordable
housing required to meet demand over the plan period and not to revise the affordable housing
need over the plan period. The Core Strategy Review concluded that the affordable housing
requirement set out in Policy CS15 remains appropriate (see page 29 of the review).
9
Methodology
5.6 The method for studying the need for affordable housing has been enshrined in Strategic Housing
Market Assessment (SHMA) guidance for many years, with an established approach to look at the
number of households who are unable to afford market housing (to either rent or buy). The analysis
below follows the methodology and key data sources in guidance and can be summarised as
follows:
Current need (an estimate of the number of households who have a need now and based on a
range of data modelled from local information);
Projected newly forming households in need:
Based on projections developed for this project along with an affordability test to estimate
numbers unable to afford the market); and
Existing households falling into need (based on studying the types of households who have
needed to access social/affordable rented housing and based on study past lettings data)
These two bullet points added together provide an indication of the gross need (the current
need is divided by 10 in order to meet the need over the 10 year period i.e. 2019-29);
Supply of affordable housing (an estimate of the likely number of letting that will become
available from the existing social housing stock – drawing on data from CoRe4 ); and
Subtracting the supply from the gross need provides an estimate of the overall need for
affordable housing.
This is then been converted into annual flows.
Table 5.1 Summary of Analytical Stages in Assessing Affordable Housing Need
Analytical stage Description Method 1 – Current need An estimate of the
number of households who have an affordable need now
Based on the categories of need set out in 2a-020 of the PPG and based on a range of data sources. For some analysis (e.g. overcrowding) Census data is used to provide a baseline which is then updated with reference to national changes informed by the English Housing survey (EHS). An affordability test is applied based on income and housing costs data.
2 – Newly forming households
An annual estimate of the number of
The number of new households forming is based on outputs from the demographic projections, looking at
4 The continuous recording of lettings and sales in social housing in England (referred to as CoRe) is a national information source that records information on the characteristics of both private registered providers and local authority new social housing tenants and the homes they rent
10
new households forming with a need for affordable housing
younger households (aged under 45) forming for the first time. An affordability test is applied, again based on income and housing costs data. Analysis based on 2a-021 of the PPG.
3 – Existing households falling into need
An annual estimate of the number of existing households who will have a need in the future
Based on analysis of data on social housing lettings where accommodation has been provided to a household previously living in their own accommodation (whether rented or owned). No methodology for this stage is provided in the PPG and so the method used links to older SHMA guidance
4 – Supply of Annual estimate of Based on trend data for the past 3-years, the estimate affordable housing the supply of relets
from the existing stock
looks at the number of lettings before netting off the number of lettings in new homes and the number or transfers. This is to ensure that the number reflects the supply available from the existing stock. Based on 2a-022 of the PPG.
Local Prices and Rents
5.7 An important part of the affordable needs model is to establish the entry-level costs of housing to
buy and rent. The assessment compares prices and rents with the incomes of households to
establish what proportion of households can meet their needs in the market, and what proportion
require support and are thus defined as having a need for affordable housing.
5.8 For the purposes of establishing the need, the analysis focuses on overall housing costs (for all
dwelling types and sizes); establishing, in numerical terms, the overall need for affordable housing.
5.9 The analysis below considers the entry-level costs of housing to both buy and rent. The approach
has been to analyse Land Registry and Valuation Office Agency (VOA) data to establish lower 5quartile prices and rents. Using a lower quartile figure is consistent with the PPG and reflects the
entry-level point into the market.
5.10 Data from the Land Registry in the table below for the year to March 2019 (i.e. Q2-Q4 of 2018 and
Q1 of 2019) shows estimated lower quartile property prices by dwelling type. The data shows that
entry-level prices generally reduce moving from North to South (i.e. further away from London).
The overall lower quartile price of all types of housing in all areas is around £300,000.
5 Paragraph 021 Reference ID: 2a-021-20190220
11
Table 5.2 Lower Quartile Cost of Housing to Buy – Year to March 2019
North Central South Borough Flat/maisonette £240,000 £198,000 £212,000 £210,000 Terraced £356,000 £327,000 £304,000 £325,000 Semi-detached £451,000 £365,000 £345,000 £372,000 Detached £623,000 £583,000 £429,000 £536,000 All dwellings £380,000 £280,000 £275,000 £300,000 Source: Land Registry
5.11 It is arguably more useful to consider the lower quartile prices by size of accommodation (number
of bedrooms) and the table below shows an estimate of this. The information has been drawn from
internet sources (such as Rightmove) and then constrained to be consistent with the figures shown
from the Land Registry source.
Table 5.3 Lower Quartile to Buy by Size - Year to March 2019 North Central South Borough
1-bedroom £178,000 £161,000 £134,000 £152,000 2-bedrooms £279,000 £252,000 £210,000 £239,000 3-bedrooms £424,000 £383,000 £319,000 £363,000 4-bedrooms £558,000 £504,000 £419,000 £477,000 All properties £380,000 £280,000 £275,000 £300,000 Source: Land Registry and internet price search
5.12 A similar analysis has been carried out for private rents using Valuation Office Agency (VOA) data
– this again covers a 12-month period to March 2019. The analysis shows an average lower
quartile cost (across all dwelling sizes) of £875 per month. Additional analysis was carried out to
consider differences across areas, which again suggests rent gradually getting cheaper moving
from North to South in the borough.
Table 5.4 Lower Quartile Market Rents, Year to March 2019
North Central South Borough Room only - - - £430 Studio - - - £600 1-bedroom £835 £795 £735 £775 2-bedrooms £1,085 £1,025 £930 £995 3-bedrooms £1,390 £1,295 £1,150 £1,250 4-bedrooms £1,835 £1,710 £1,515 £1,650 All properties £1,060 £830 £820 £875 Source: Valuation Office Agency and Internet Rental Cost Search
Local Income Levels
5.13 Following on from the assessment of local prices and rents it is important to understand local
income levels as these (along with the price/rent data) will influence the ability of a household to
12
afford to buy or rent housing in the market without the need for some sort of subsidy. Data about
total household income has been based on ONS modelled income estimates, with additional data
from the English Housing Survey (EHS) being used to provide information about the distribution of
incomes.
5.14 We have used these data sources to construct an income distribution for the three sub-areas for
2018. The table below shows average (mean) incomes and also the median and lower quartile
estimates for each area. The analysis shows household incomes in the North of the borough,
reducing moving towards the South.
Table 5.5 Estimated Average (mean) Household Income by Local Authority and Sub-Area (mid-2018 estimate)
Mean Median Lower quartile North £64,200 £48,800 £28,200 Central £61,000 £46,400 £26,800 South £55,300 £42,100 £24,300 Borough £60,900 £46,200 £26,800 Source: Derived from EHS and ONS data
Affordability Test
5.15 The affordability of housing is influenced by housing costs and incomes, which affect households’
ability to afford different housing products. In this section we consider housing affordability, in terms
of the ability of a household to afford to buy or rent housing in the market without the need for some
sort of subsidy. The analysis also provides an indication of the potential for intermediate housing to
meet housing needs in the borough.
5.16 To identify an appropriate affordability test, we need to look at households’ ability to afford either
home ownership or private rented housing (whichever is the cheapest), without financial support.
Generally, the income required to access owner-occupied housing is higher than that required to
rent and so the analysis to follow is based solely on the ability to afford to access private rented
housing.
5.17 A household is considered able to afford market rented housing in cases where the rent payable
would constitute no more than a particular percentage of gross income. The choice of an
appropriate threshold is an important aspect of the analysis. CLG 2007 SHMA Practice Guidance
suggested that 25% of income is a reasonable start point but also noted that a different figure could
be used. Analysis of current letting practice suggests that letting agents typically work on a multiple
of 40%. Government policy (through Housing Benefit payment thresholds) would also suggest a
figure of 40%+ (depending on household characteristics).
13
5.18 The threshold of income to be spent on housing should be set by asking the question ‘what level of
income is expected to be required for a household to be able to access market housing without the
need for a subsidy (e.g. through Housing Benefit)?’ The choice of an appropriate threshold is
judgement based and we consider should be assessed having regard in particular to the cost of
housing rather than income. Income levels are only relevant in determining the number (or
proportion) of households who fail to meet the threshold. It would be feasible to find an area with
very low incomes and therefore conclude that no households can afford housing, alternatively an
area with very high incomes might show the opposite output. The key here is that local income
levels are not setting the threshold but are simply being used to assess how many can or can’t
afford market housing.
5.19 At £875 per calendar month (and up to £1,060 in the North), lower quartile rent levels in Reigate &
Banstead are relatively high in comparison to those seen nationally (a lower quartile rent of £525
per month across England). This would suggest that a proportion of income to be spent on housing
could be higher than the bottom end of the range.
5.20 Across England, the lowest lower quartile rents are around £400 per month, and if these areas are
considered to be at the bottom end of the range (i.e. 25% of income to be spent on housing) then
this would leave a residual income of £1,200 per month. With the same residual income applied to
Reigate & Banstead, the income required to afford an £875 rent would be £2,075 and so the
percentage spent on housing would be 42%.
5.21 However, it needs to be considered that the cost of living in Reigate & Banstead is likely to be
higher than in some other parts of England and so a pragmatic approach to determining a
reasonable proportion of income has been to take a midpoint between the bottom (25%) and the
equivalent residual income figure (42%). It has therefore been estimated that a threshold of around
a third would be appropriate, with further small adjustments to reflect pricing in different parts of the
borough.
5.22 On the basis of a rent of £875 per month, this would leave a residual income of around £1,750 and
a total household income of £31,500 per annum. Therefore, for the purposes of this assessment it
is estimated that any household with an income below £31,500 would not be able to afford a lower
quartile rent without some degree of subsidy – the Council’s housing strategy team has confirmed
that singles earning over £25,000 per annum and couples earning over £30,000 per annum cannot
join the register. The use of a third of income on housing is considered to be a reasonable position
to take given the range of evidence available.
14
Current Need
5.23 In line with PPG Paragraph 2a-020, the current need for affordable housing has been based on
considering the likely number of households with one or more housing problems. The table below
sets out the categories in the PPG and the sources of data being used to establish numbers.
5.24 The PPG also includes a category where households cannot afford to own a home despite it being
their aspiration. This category is considered separately later in this report (under the title of the
expanded definition of affordable housing need).
Table 5.6 Main Sources for Assessing the Current Unmet Need for Affordable Housing
Source Notes
Homeless households and those in temporary accommodation
CLG Live Table 784 Total where a duty is owed but no accommodation has been secured PLUS the total in temporary accommodation
Households in overcrowded housing
Census table LC4108EW
Analysis undertaken by tenure and updated by reference to national changes (from the English Housing Survey (EHS))
Concealed households Census table LC1110EW
Number of concealed families
Existing affordable housing tenants in need
Modelled data linking to past survey analysis
Excludes overcrowded households – tenure estimates updated by reference to the EHS
Households from other tenures in need
Modelled data linking to past survey analysis
5.26 It should be noted that there may be some overlap between categories (such as overcrowding and
concealed households, whereby the overcrowding would be remedied if the concealed household
moved). The data available does not enable analysis to be undertaken to study the impact of this
and so it is possible that the figures presented include a small element of double counting.
Additionally, some of the concealed households may be older people who have moved back in with
their families and might not be considered as in need.
5.27 The table below shows the initial estimate of the number of households within the borough with a
current need. These figures are before any ‘affordability test’ has been applied to assess the ability
of households to meet their own housing needs; and has been termed ‘the number of households
in unsuitable housing’. Overall, the analysis suggests that there are currently some 4,100
households living in unsuitable housing (or without housing).
Table 5.7 Estimated No. of Households Living in Unsuitable Housing
Category of Need Households
Homeless households 152
Households in overcrowded housing 2,046
15
Excludes overcrowded households – tenure estimates updated by reference to the EHS
Concealed households 512
Existing affordable housing tenants in need 148
Households from other tenures in need 1,225
Total 4,084 Source: CLG Live Tables, 2011 Census and Data Modelling
5.28 In taking this estimate forward, the data modelling next estimates housing unsuitability by tenure.
From the overall number in unsuitable housing, households living in affordable housing are
excluded (as these households would release a dwelling on moving and so no net need for
affordable housing will arise). The analysis also excludes 90% of owner-occupiers under the
assumption (which is supported by analysis of survey data) that the vast majority will be able to
afford housing once savings and equity are taken into account.
5.29 A final adjustment is to slightly reduce the unsuitability figures in the private rented sector to take
account of student-only households – such households could technically be overcrowded/living in
unsuitable housing but would be unlikely to be allocated affordable housing (student needs are
essentially assumed to be transient) – this only reduces the estimated need by 3 households in
total. Once these households are removed from the analysis, the remainder are taken forward for
affordability testing.
5.30 The table below shows it is estimated that there were 2,283 households living in unsuitable housing
(excluding current social tenants and the majority of owner-occupiers).
Table 5.8 Unsuitable Housing by Tenure and No. to Take Forward into Affordability Modelling
In Unsuitable Housing No. to Take Forward for Affordability Testing
Owner-occupied 1,158 116
Affordable housing 756 0
Private rented 1,506 1,503
No housing (homeless/concealed) 664 664
Total 4,084 2,283 Source: CLG Live Tables, 2011 Census and Data Modelling
5.31 Having established this figure, it needs to be considered that a number of these households might
be able to afford market housing without the need for subsidy. To consider this, the income data
has been used, with the distribution adjusted to reflect a lower average income amongst
households living in unsuitable housing – for the purposes of the modelling an income distribution
that reduces the average household income to 88% of the figure for all households has been used
to identify the proportion of households whose needs could not be met within the market (for
16
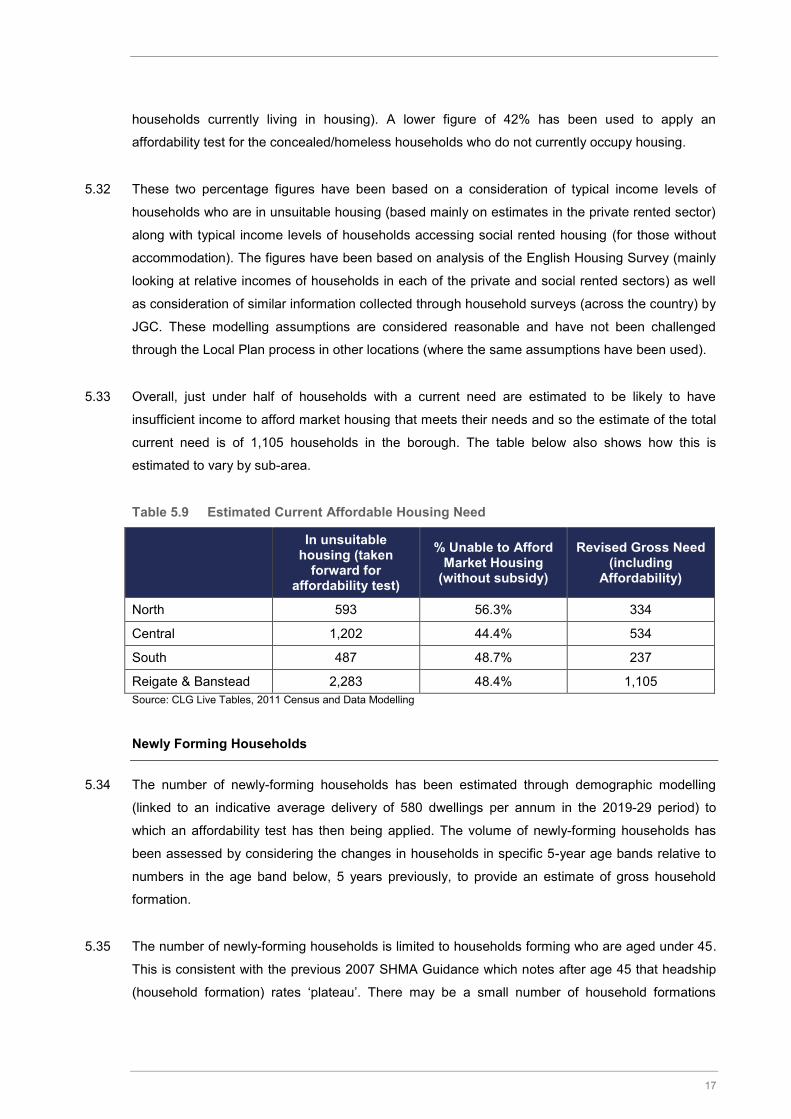
households currently living in housing). A lower figure of 42% has been used to apply an
affordability test for the concealed/homeless households who do not currently occupy housing.
5.32 These two percentage figures have been based on a consideration of typical income levels of
households who are in unsuitable housing (based mainly on estimates in the private rented sector)
along with typical income levels of households accessing social rented housing (for those without
accommodation). The figures have been based on analysis of the English Housing Survey (mainly
looking at relative incomes of households in each of the private and social rented sectors) as well
as consideration of similar information collected through household surveys (across the country) by
JGC. These modelling assumptions are considered reasonable and have not been challenged
through the Local Plan process in other locations (where the same assumptions have been used).
5.33 Overall, just under half of households with a current need are estimated to be likely to have
insufficient income to afford market housing that meets their needs and so the estimate of the total
current need is of 1,105 households in the borough. The table below also shows how this is
estimated to vary by sub-area.
Table 5.9 Estimated Current Affordable Housing Need
In unsuitable housing (taken
forward for affordability test)
% Unable to Afford Market Housing
(without subsidy)
Revised Gross Need (including
Affordability)
North 593 56.3% 334
Central 1,202 44.4% 534
South 487 48.7% 237
Reigate & Banstead 2,283 48.4% 1,105 Source: CLG Live Tables, 2011 Census and Data Modelling
Newly Forming Households
5.34 The number of newly-forming households has been estimated through demographic modelling
(linked to an indicative average delivery of 580 dwellings per annum in the 2019-29 period) to
which an affordability test has then being applied. The volume of newly-forming households has
been assessed by considering the changes in households in specific 5-year age bands relative to
numbers in the age band below, 5 years previously, to provide an estimate of gross household
formation.
5.35 The number of newly-forming households is limited to households forming who are aged under 45.
This is consistent with the previous 2007 SHMA Guidance which notes after age 45 that headship
(household formation) rates ‘plateau’. There may be a small number of household formations
17
-
beyond age 45 (e.g. due to relationship breakdown) although the number is expected to be fairly
small when compared with formation of younger households.
5.36 In assessing the ability of newly-forming households to afford market housing, data has been
drawn from previous surveys undertaken nationally by JGC. This establishes that the average
income of newly-forming households is around 84% of the figure for all households. This figure is
remarkably consistent across areas (and is also consistent with analysis of English Housing Survey
data at a national level). The analysis has therefore adjusted the overall household income data to
reflect the lower average income for newly-forming households. The adjustments have been made
by changing the distribution of income by bands such that average income level is 84% of the all
household average.
5.37 In doing this it is possible to calculate the proportion of households unable to afford market housing
without any form of subsidy (such as Local Housing Allowance or Housing Benefit). For the
purposes of the initial analysis of affordable need (i.e. the established definition) this will relate to
households unable to afford to buy OR rent in the market.
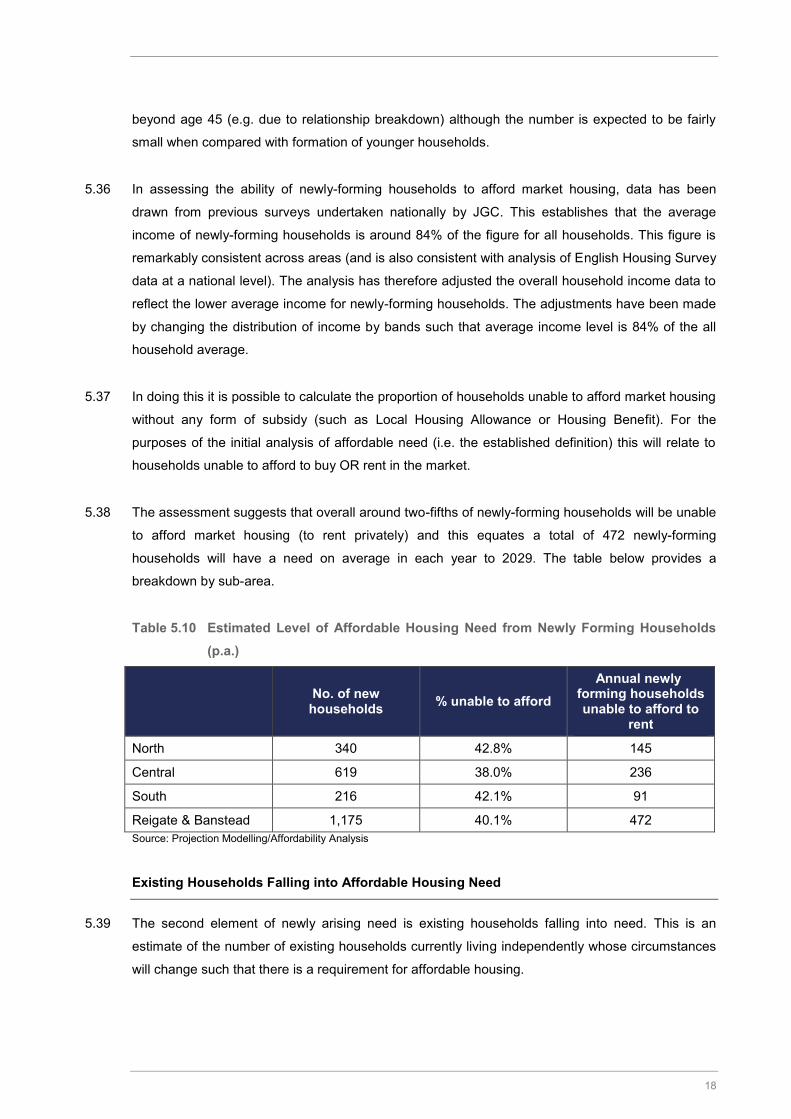
5.38 The assessment suggests that overall around two-fifths of newly-forming households will be unable
to afford market housing (to rent privately) and this equates a total of 472 newly-forming
households will have a need on average in each year to 2029. The table below provides a
breakdown by sub-area.
Table 5.10 Estimated Level of Affordable Housing Need from Newly Forming Households (p.a.)
No. of new households % unable to afford
Annual newly forming households unable to afford to
rent
North 340 42.8% 145
Central 619 38.0% 236
South 216 42.1% 91
Reigate & Banstead 1,175 40.1% 472 Source: Projection Modelling/Affordability Analysis
Existing Households Falling into Affordable Housing Need
5.39 The second element of newly arising need is existing households falling into need. This is an
estimate of the number of existing households currently living independently whose circumstances
will change such that there is a requirement for affordable housing.
18
5.40 The outputs have been based on analysis of data on social housing lettings where accommodation
has been provided to a household previously living in their own accommodation (whether rented or
owned). To assess this, information from CoRe has been used. The assessment looked at
households who have been housed over the past three years – this group will represent the flow of
households onto the Housing Register over this period. From this, newly forming households (e.g.
those currently living with family) have been discounted as well as households who have
transferred from another social/affordable rented property. An affordability test has also been
applied.
5.41 No methodology for this stage is provided in the PPG and so the method used links to older SHMA
guidance. This method for assessing existing households falling into need is consistent with the
2007 SHMA guide which says on page 46 that ‘Partnerships should estimate the number of
existing households falling into need each year by looking at recent trends. This should include
households who have entered the housing register and been housed within the year as well as
households housed outside of the register (such as priority homeless household applicants)’.
5.42 Following the analysis through suggests a need arising from 137 existing households each year.
The table below breaks this down by sub-area.
Table 5.11 Estimated Level of Affordable Housing Need from Existing Households Falling into Need (p.a.)
Total Additional Need % of Total
North 39 28.6%
Central 76 55.2%
South 22 16.2%
Reigate & Banstead 137 100.0% Source: Derived from a range of sources as described in text
Supply of Affordable Housing
5.43 The future supply of affordable housing through relets is the flow of affordable housing arising from
the existing stock that is available to meet future need. This focusses on the annual supply of
social/affordable rent relets.6
5.44 The PPG suggests that the estimate of likely future relets from the social rented stock should be
based on past trend data which can be taken as a prediction for the future. Information from the
6 Intermediate housing supply is considered against the need arising from the expanded definition of affordable housing
later in this section.
19
CoRe system has been used to establish past patterns of social housing turnover. The figures
include general needs and supported lettings but exclude lettings of new properties and also
exclude an estimate of the number of transfers from other social rented homes. These exclusions
are made to ensure that the figures presented reflect relets from the existing stock.
5.45 On the basis of past trend data is has been estimated that 281 units of social/affordable rented
housing are likely to become available each year moving forward for occupation by newly-forming
households and existing households falling into need from other tenures.
Table 5.12 Analysis of past social/affordable rented housing supply (pa 2015/16 – 2017/18)
General Needs Supported Housing
Total
Total Lettings 304 225 529
% as Non-New Build 88.7% 96.7% 92.1%
Lettings in Existing Stock 270 218 487
% Non-Transfers 42.5% 76.4% 57.7%
Lettings to New Tenants 115 166 281 Source: CoRe
5.46 The table below shows the estimated supply of affordable housing from relets in each sub-area.
The sub-area figures have been based on the size of the stock in each sub-area as of 2011
(Census data).
Table 5.13 Estimated supply of affordable housing from relets of existing stock by sub-area (p.a.)
Annual Supply % of Supply
North 77 27.5%
Central 160 56.8%
South 44 15.7%
Reigate & Banstead 281 100.0%Source: CoRe and 2011 Census
20
-
5.47 The PPG sets out that suitable surplus stock should also be considered in establishing the total
affordable housing supply. The MHCLG’s live tables provide data on dwelling stock for both private
registered providers and local authorities; as well as the number of vacant properties. Having
reviewed the latest data as at October 2018, we note that only 0.7% of all general needs stock is
currently vacant. It is therefore not incorporated into the total affordable housing supply position.
5.48 In terms of the committed supply of new net affordable homes arising from approved development
schemes as identified in the PPG; otherwise known as the ‘development pipeline’, it is anticipated
that a total of 151 affordable homes for rent will come forward at the point of this assessment. The
Table below sets out how this is broken down across each of the sub-areas.
Table 5.14 Committed Development Pipeline Supply
North Central South Borough
Committed Affordable Supply 23 33 95 151 Source: Authority Monitoring Data
Total Affordable Housing Need
5.49 The table below shows the overall calculation of affordable housing need. The analysis shows that
there is a need for 423 dwellings per annum to be provided – a total of around 4,230 over the 10-
year period (2019-29). These needs are for rented housing targeted at households who cannot
afford to buy or rent in the open market. The net need is calculated as follows:
Net Need = Current Need + Need from Newly-Forming Households + Existing Households falling into Need – Supply of Affordable Housing
Table 5.15 Estimated Need for Rented Affordable Housing
Per Annum 2019 29
Gross Current need 110 1,105
Newly forming households 472 4,718
Existing households falling into need 137 1,367
Total Gross Need 719 7,190
Re-let Supply 281 2,811 7Development Pipeline Supply 15 151
Net Need 423 4,227
7 Note that it is not assumed that the development pipeline supply will have a build out period of 10 years. The annual
figure(s) used in Table 5.15 and 5.16 are only presented as such for calculating an annual housing need figure for each
area.
21
Source: 2011 Census, CoRe, Projection Modelling and Affordability Analysis
5.50 The table below shows the annualised information for individual sub-areas. The analysis shows a
need for additional affordable housing in all parts of the Council area, with the highest figure being
seen in the Central sub-area.
Table 5.16 Estimated Need for Rented Affordable Housing (p.a.)
North Central South Borough
Current need 33 53 24 110
Newly forming households 145 236 91 472
Existing households falling into need 39 76 22 137
Total Gross Need 218 364 137 719
Re-let Supply 77 160 44 281
Development Pipeline Supply 2 3 10 15
Net Need 139 201 83 423 Source: Census (2011)/CoRe/Projection Modelling and Affordability Analysis
Sensitivity to Income Thresholds
5.51 A 33% threshold (i.e. a third of income) has been used in the main modelling although it is
worthwhile considering the implications of alternative thresholds. To understand the implications of
the income threshold, we sensitivity tested affordable housing need assuming variant levels of
income spent on housing costs. The table below summarises the findings. In particular, we can see
that with an assumption of households spending 40% of gross income on housing costs then the
need drops to 301 dwellings per annum but could be as high as 644 each year based on 25%.
5.52 This is a wide range and shows how sensitive the findings are to different assumptions. It is
however the case that whatever assumptions are used, the analysis shows a notable need for
additional affordable homes.
22
Table 5.17 Estimated Need for Rented Affordable Housing (per annum) at Variant Income Thresholds
@25% @30% @33% @35% @40%
Current need 140 122 110 106 93
Newly forming households 643 537 472 454 384
Existing households falling into need 157 146 137 133 121
Total Gross Need 940 805 719 693 597
Re-let Supply 281 281 281 281 281
Development Pipeline Supply 15 15 15 15 15
Net Need 644 509 423 397 301 Source: Census (2011)/CoRe/Projection Modelling and Affordability Analysis
How Much Should Rented Affordable Housing Cost?
5.53 The analysis above identifies the overall need for affordable housing using a well-established
model which focusses on households who cannot afford to privately rent (at a lower quartile/entry
level price). These households are therefore most likely to have a need for affordable housing.
5.54 Below is an analysis that sets out what might be an ‘affordable’ rent for different sizes of
accommodation (in different locations) based on local incomes and housing costs. The analysis
essentially considers what might be a ‘Living Rent’. The calculations are based on research by
JRF/Savills8 and use the following methodology:
Annual Survey of Hours and Earnings (ASHE) lower quartile earnings;
Adjustment for property size by recognised equivalence model;
Starting rent set at 28% of net earnings; and
Rent set at Local Housing Allowance (LHA) limits where calculations show a higher figure.
5.55 The analysis shows rents starting at about £420 for a 1-bedroom home and rising to £670 for
homes with 3-bedrooms (the Living Rent method only goes up to 3-bedrooms). It is notable that all
of the Living Rent levels shown are below the maximum level of LHA available by size of property -
see second table below.
5.56 As a general rule it is not considered sensible to be charging a rent in excess of LHA, as this would
mean many households having to top up their rent from other income sources. In setting rents, the
8 http://pdf.savills.com/documents/Living%20Rents%20Final%20Report%20June%202015%20-%20with%20links%20-
%2019%2006%202015.pdf
23
- - -
- - -
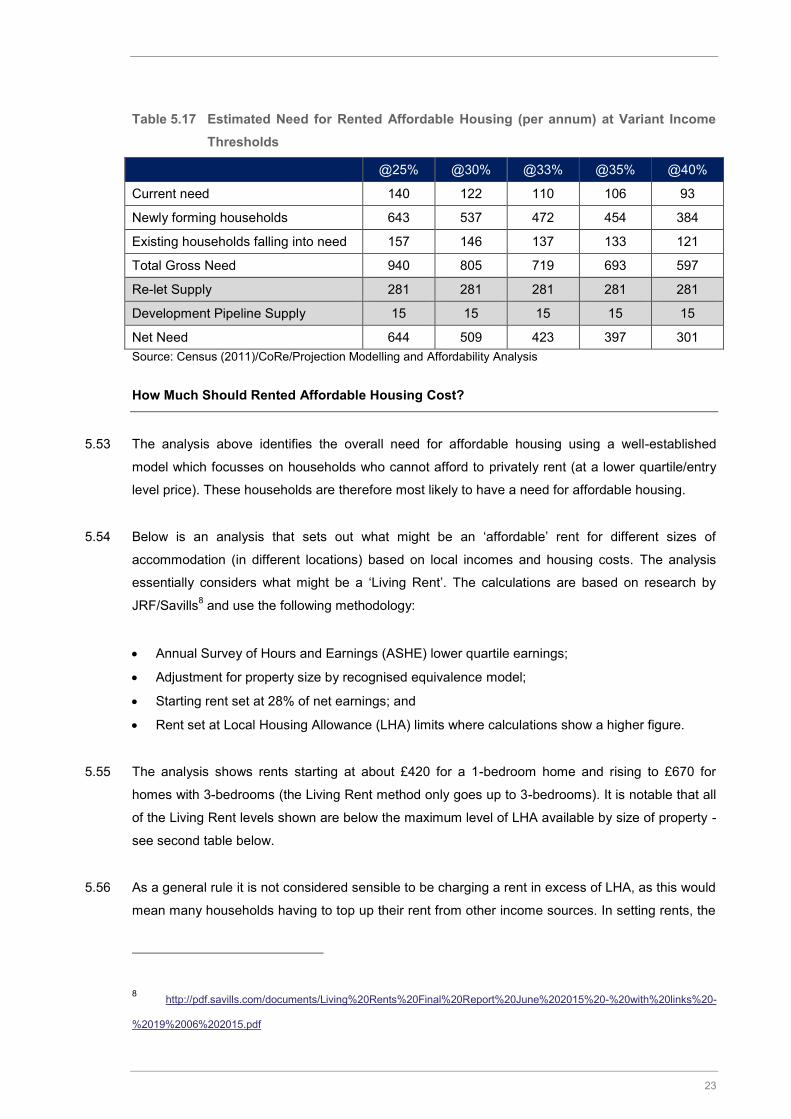
local authority could therefore consider that the affordable level is in the range from a Living Rent
up to the maximum LHA level.
Table 5.18 Living Rents (Per Month) – 2018
1 bedroom 2 bedroom 3 bedrooms
North £432 £562 £691
Central £421 £547 £674
South £402 £522 £643
Borough £421 £547 £673 Source: ASHE and Living Rents Methodology
Table 5.19 Maximum Local Housing Allowance (Housing Benefit) by Location (Broad Rental Market Area) and Property Size (July 2019)
1 bedroom 2 bedroom 3 bedrooms
Crawley & Reigate BRMA £696 £854 £993
Outer South London £792 £997 £1,210 Source: Valuation Office Agency
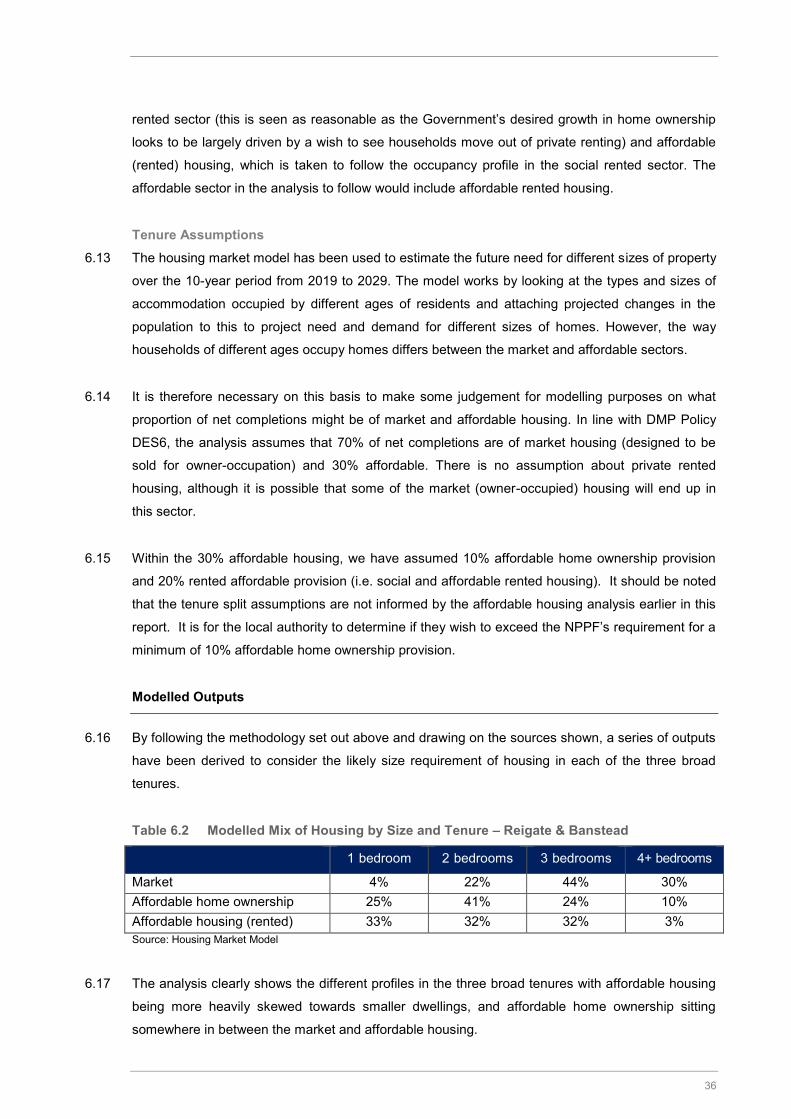
Affordable Housing – Expanded NPPF Definition
5.57 This assessment has estimated that there is a need for additional affordable housing – this is for
subsidised housing at a cost below that to access the private rented sector (i.e. for households
unable to access any form of market housing without some form of subsidy). It would be expected
that this housing would be delivered primarily as social/affordable rented housing.
5.58 The revised NPPF broadens the definition of affordable housing to include households which might
be able to rent a home in the private sector without financial support but aspire to own a home and
require support to do so. The NPPF states “Where major development involving the provision of
housing is proposed, planning policies and decisions should expect at least 10% of the homes to
be available for affordable home ownership, unless this would exceed the level of affordable
housing required in the area, or significantly prejudice the ability to meet the identified affordable
housing needs of specific groups.” (NPPF, para 64).
5.59 There are various ‘affordable home ownership’ products which are can meet the housing needs of
this group. This section considers the level of need for these types of dwellings in Reigate &
Banstead. The PPG of February 2019 confirms a widening definition of those to be considered as
in affordable need; now including ‘[households] that cannot afford their own homes, either to rent,
or to own, where that is their aspiration’. However, at the time of writing, there is no further
guidance about how the number of such households should be measured.
24
5.60 The methodology used in this report therefore draws on the more general method for assessing
affordable housing need as set out in PPG (i.e. assessing current needs and projected need
(newly forming and existing households)). The key difference is that in establishing the need for
affordable home ownership an estimate of the number of households in the ‘gap’ between buying
and renting is used (i.e. to assess the number of households who can afford to rent a home without
financial support but require support to access home ownership).
Establishing the “Rent/Buy Gap”
5.61 The first part of the analysis therefore seeks to understand what the gap between renting and
buying actually means in Reigate & Banstead – in particular establishing the typical incomes in this
bracket.
5.62 Just by looking at the relative costs of housing to buy and to rent set out above, it is clear that there
will be households in the borough who can currently rent but who may be unable to buy. In the year
to March 2019, the ‘average’ lower quartile private rent is shown by VOA to cost £875 a month,
assuming a household spends no more than a third of their income on housing, this would equate
to an income requirement of about £31,500. For the same period, Land Registry data records a
lower quartile price in the Council area of about £300,000, which (assuming a 10% deposit and 4.5
times mortgage multiple) would equate to a household income requirement of around £60,000.
5.63 Therefore, on the basis of these costings, it is reasonable to suggest that affordable home
ownership products would be pitched at households with an income between £31,500 (i.e. able to
afford to privately rent) and £60,000 (the figure above which a household might reasonably be able
to buy) – there will be small differences in these figures by sub-area.
5.64 Using the income distributions developed (as set out earlier in this section) it has been estimated
that of all households living in the private rented sector, around 30% already have sufficient income
to buy a lower quartile home, with 32% falling in the ‘rent/buy gap.’ The final 39% are estimated to
have an income below which they cannot afford to rent privately (i.e. would need to spend more
than a third of their income on housing costs).
5.65 In reality, it should be noted that many households will spend a higher proportion (than a third) of
their income on housing. These figures have been based on an assumption that incomes in the
private rented sector are around 88% of the equivalent figure for all households (a proportion
derived from the English Housing Survey) and are used as it is clear that affordable home
ownership products are likely to be targeted at households within private rented housing.
5.66 The finding that a significant proportion of households in the private rented sector (30%) are likely
to have an income that would allow them to buy a home is also noteworthy and suggests that for
many households, barriers to accessing owner-occupation are less about income/the cost of
25
housing and more about other factors (which could for example include the lack of a deposit or
difficulties obtaining a mortgage (for example due to a poor credit rating or insecure employment)).
However, some households will choose to privately rent, for example as it is a more flexible option
that may be more suitable for a particular household’s life stage (e.g. if moving locations with
employment).
Current Need 5.67 To estimate the current need for affordable home ownership products, an estimate of the number
of households living in the private rented sector (PRS) has been established. The start point is the
number of households living in private rented accommodation; as of the 2011 Census there were
some 7,659 households living in the sector. Data from the English Housing Survey (EHS) suggests
that since 2011, the number of households in the PRS has risen by about 26% - if the same
proportion is relevant to Reigate & Banstead then the number of households in the sector would
now be around 9,650.
5.68 Additional data from the EHS suggests that 60% of all PRS households expect to become an
owner at some point and of these some 25% would expect this to happen in the next 2-years. This
25% figure is taken to provide an estimate of the current number of households living in the PRS
who are seeking to become a homeowner in the short-term. The figure of around 1,450 is therefore
taken as the number of households potentially with a current need for affordable home ownership
before any affordability testing.
5.69 As noted in the section above, on the basis of income it is estimated that around 32% of the
households living in the private rented sector fall within the “rent/buy gap”. Applying this proportion
to the figure of 1,450 would suggest a current need for around 446 affordable home ownership
products (45 per annum if annualised over the next 10 years).
Newly Forming Households 5.70 In line with the methodology used to assess the number of newly forming households as part of the
total affordable housing need, the analysis considers the number of newly forming households
likely to fall into the “rent/buy gap” and also the remaining existing households who expect to
become owners further into the future (i.e. those moving beyond the initial 2-year period).
5.71 Applying the same affordability test (albeit on a very slightly different income assumption for newly
forming households) suggests an annual need from these two groups of around 503 dwellings (369
from newly forming households and 134 from existing households in the private rented sector).
26
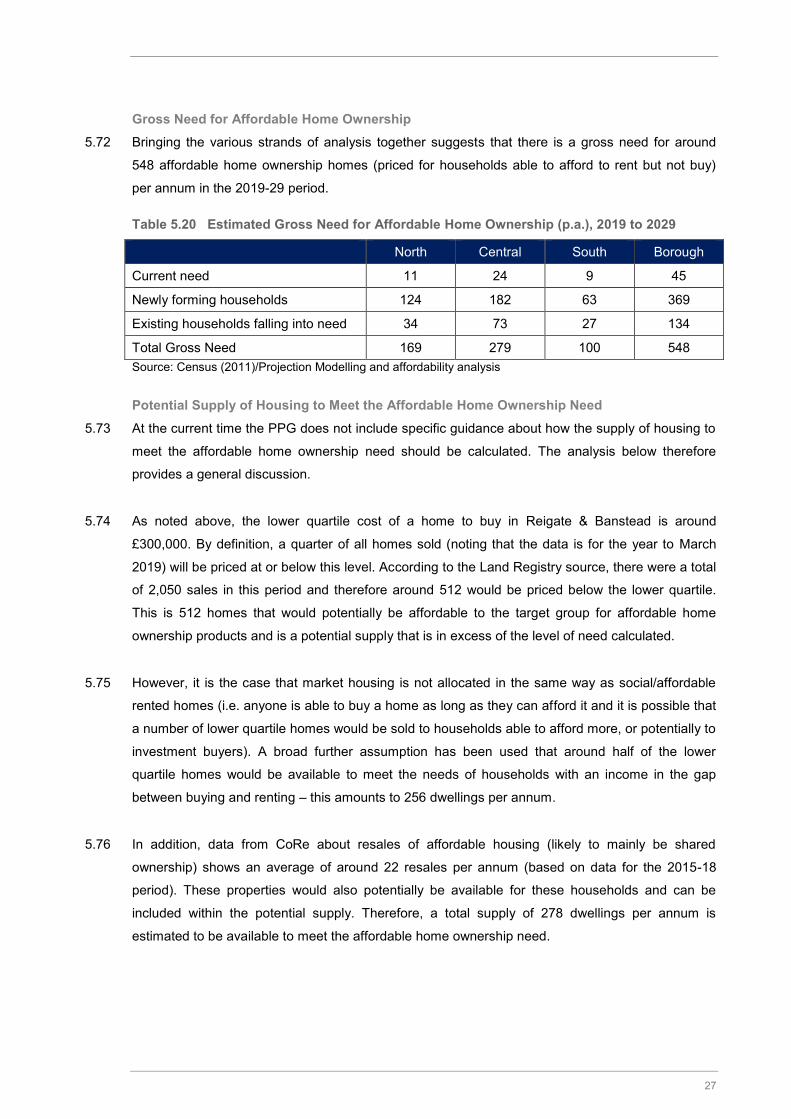
Gross Need for Affordable Home Ownership 5.72 Bringing the various strands of analysis together suggests that there is a gross need for around
548 affordable home ownership homes (priced for households able to afford to rent but not buy)
per annum in the 2019-29 period.
Table 5.20 Estimated Gross Need for Affordable Home Ownership (p.a.), 2019 to 2029
North Central South Borough
Current need 11 24 9 45
Newly forming households 124 182 63 369
Existing households falling into need 34 73 27 134
Total Gross Need 169 279 100 548 Source: Census (2011)/Projection Modelling and affordability analysis
Potential Supply of Housing to Meet the Affordable Home Ownership Need 5.73 At the current time the PPG does not include specific guidance about how the supply of housing to
meet the affordable home ownership need should be calculated. The analysis below therefore
provides a general discussion.
5.74 As noted above, the lower quartile cost of a home to buy in Reigate & Banstead is around
£300,000. By definition, a quarter of all homes sold (noting that the data is for the year to March
2019) will be priced at or below this level. According to the Land Registry source, there were a total
of 2,050 sales in this period and therefore around 512 would be priced below the lower quartile.
This is 512 homes that would potentially be affordable to the target group for affordable home
ownership products and is a potential supply that is in excess of the level of need calculated.
5.75 However, it is the case that market housing is not allocated in the same way as social/affordable
rented homes (i.e. anyone is able to buy a home as long as they can afford it and it is possible that
a number of lower quartile homes would be sold to households able to afford more, or potentially to
investment buyers). A broad further assumption has been used that around half of the lower
quartile homes would be available to meet the needs of households with an income in the gap
between buying and renting – this amounts to 256 dwellings per annum.
5.76 In addition, data from CoRe about resales of affordable housing (likely to mainly be shared
ownership) shows an average of around 22 resales per annum (based on data for the 2015-18
period). These properties would also potentially be available for these households and can be
included within the potential supply. Therefore, a total supply of 278 dwellings per annum is
estimated to be available to meet the affordable home ownership need.
27
Net Need 5.77 The table below brings together the analysis of need and supply. It shows a potential annual need
for 270 affordable home ownership homes per year, with needs being shown in all areas of the
borough.
Table 5.21 Estimated Need for Affordable Home Ownership (p.a.)
North Central South Borough Current need 11 24 9 45 Newly forming households 124 182 63 369 Existing households falling into need 34 73 27 134 Total Gross Need 169 279 100 548 Supply (50% of LQ sales) 86 120 50 256 Supply (LCHO resales) 7 11 3 22 Net need 77 147 46 270 Source: Derived from Census (2011)/Projection Modelling/Land Registry and Affordability Analysis
Implications of the Analysis 5.78 The analysis above shows a clear need from households who require support to access home
ownership (i.e. those falling within the “buy/rent gap”). The needs of these households can be met
through a variety of means, including:
The various low-cost home ownership products identified in the NPPF Glossary, including
discounted market sale and starter homes; shared ownership and shared equity housing;
Other Government initiatives which seek to broaden access to home ownership, including the
Help-to-Buy scheme in which the Government lends up to 20% of the cost of a new-build home
and purchasers only require a 5% deposit.
5.79 In bringing together evidence for Supplementary Planning Documents, the authority needs to
consider the evidence of need, the relative acuteness of the need, and issues of residential
development viability. The NPPF advises that at least 10% of all new housing on larger sites
should be for affordable home ownership unless this would exceed the level of affordable housing
required in the area, or significantly prejudice the ability to meet the identified affordable housing
needs of specific groups.
5.80 The evidence provides sufficient evidence of a need for affordable home ownership products to
justify the 10% provision recommended in the NPPF (subject clearly to further work on the level of
housing provision to be planned for). However, there is also a clear and acute need for rented
affordable housing from lower income households, and it is important that a supply of rented
affordable housing is maintained to meet the needs of this group including those to which the
authority have a statutory housing duty. Such housing is cheaper than that available in the open
28
market and can be accessed by many more households (some of whom may be supported by
benefit payments).
5.81 It should also be noted that the finding of a ‘need’ for affordable home ownership does not have
any impact on the overall need for housing.
How Much Should Affordable Home Ownership Housing Cost? 5.82 The analysis and discussion above suggest that there are a number of households likely to fall
under the new PPG definition of affordable housing need (i.e. in the gap between renting and
buying). but that the potential supply of housing to buy makes it difficult to fully quantify this need.
However, given the NPPF, it seems likely that the Council will need to seek 10% of additional
homes on larger sites as some form of home ownership.
5.83 This report recommends shared ownership as the most appropriate form of affordable home
ownership and also encourages consideration of other packages such as providing support for
deposits. This has been sense checked through consultation with the Council’s housing strategy
team and selected Registered Providers. However, it is possible that some housing would come
forward as other forms of housing such as Starter Homes or discounted market sale. If this is the
case, it will be important for the Council to ensure that such homes are sold at a price that is
genuinely affordable for the intended target group.
5.84 On this basis, it is worth discussing what sort of costs affordable home ownership properties should
be sold for. The Annex 2 (NPPF) definitions suggest that such housing should be made available at
a discount of at least 20% from Open Market Value (OMV). The problem with having a percentage
discount is that it is possible in some locations or types of property that such a discount still means
that housing is more expensive than that typically available in the open market.
5.85 Our preferred approach in this report is to set out a series of affordable purchase costs for different
sizes of accommodation. These are set out as a range with the bottom end being based on
equivalising the private rent figures into a house price so that the sale price will meet the needs of
all households in the gap between buying and renting. The upper level is set based on the
estimated lower quartile price to buy a home. Setting higher prices would mean that such housing
would not be available to households for whom the Government is seeking to provide an
‘affordable’ option.
29
- - -
Table 5.22 Affordable Home Ownership Prices (Year to March 2019)
1 bedroom 2 bedrooms 3 bedrooms 4+ bedrooms
North Lower Limit £149,000 £194,000 £248,000 £328,000 Upper Limit £178,000 £279,000 £424,000 £558,000
Central Lower Limit £142,000 £183,000 £231,000 £306,000 Upper Limit £161,000 £252,000 £383,000 £504,000
South Lower Limit £131,000 £166,000 £205,000 £271,000 Upper Limit £134,000 £210,000 £319,000 £419,000
Borough-wide Lower Limit £138,000 £178,000 £223,000 £295,000 Upper Limit £152,000 £239,000 £363,000 £477,000
Source: Derived from VOA and Land Registry Data
5.86 If the Council do seek for some additional housing to be in the affordable home ownership sector,
the Council might consider setting up a register of people interested in these products (in a similar
way to the current Housing Register). This will enable any properties to be ‘allocated’ to
households whose circumstances best meet the property on offer. Alternatively, the Council and
developers should liaise with the Help-to-Buy agent.
5.87 Another form of affordable home ownership is shared ownership. The analysis below looks at what
level of equity share might be needed to make housing affordable. The example calculation is
borough-wide and based on the following key assumptions:
OMV at LQ price plus 15% (reflecting likelihood that new build homes will have a premium attached and that they may well be priced slightly above a LQ level)
10% deposit
Rent at 2.75% pa on unsold equity
Repayment mortgage over 25-years at 4%
Service change of £100 per month for flatted development (assumed to be 1- and 2-bedroom homes) which would fall within a typical range of £50 to £150 per month according to RPs consulted in the borough
The total cost per month to be equivalent to the cost of renting in the private sector
5.88 The analysis suggests that an equity share of about 40% would potentially be affordable for a 2-
bedroom home, with slightly lower shares of around 30% for larger properties. It should be noted
that these figures are based on a specific estimate of OMV and similar calculations would need to
be carried out for any specific scheme to test affordability.
30
- - --
‘ -
-
-
- –
Table 5.23 Estimated Affordable Equity Share by Size of Dwelling
1 bedroom 2 bedrooms 3 bedrooms 4+
bedrooms OMV £174,800 £274,850 £417,450 £548,550 Share 64% 39% 29% 29% Equity bought £111,522 £107,741 £119,391 £159,628 Mortgage Needed £100,370 £96,967 £107,452 £143,665 Monthly Cost of Mortgage £530 £512 £567 £759 Retained Equity £63,278 £167,109 £298,059 £388,922 Monthly Rent on Retained Equity £145 £383 £683 £891 Service Charge £100 £100 £0 £0 Total Cost £775 £995 £1,250 £1,650
Affordable Housing: Summary and Conclusions
This section has sought to provide guidance on the appropriate tenure of affordable housing
provision required as part of new developments.
Our approach has been to consider the existing needs evidence, and to take account of the
expanded definition of affordable housing which brings in households who might be able to afford
to rent privately but aspire to own a home and require support to do so. The analysis brings
together evidence of need. But in doing so it is important to recognise that there is some overlap
between the target market’ for affordable home ownership products and support provided by Help
to Buy in helping households to access market housing.
Iceni would recommend that rental costs do not exceed Local Housing Allowance levels (which in
particular may require costs to be set below 80% market rents, particularly for larger properties);
and that they should take account of living rents, where these are lower than LHA, as set out in
tables 5.17 5.18. In respect of affordable home ownership homes, these should take account of the
price brackets shown for each sub area and the borough overall in tables 5.21 5.22 above.
31
6. THE NEED FOR DIFFERENT SIZES OF HOMES
6.1 In this section assesses the need for different sizes of market and affordable housing.
6.2 It should be noted that there are a number of different factors which influence the nature of demand
for different types, tenures and sizes of homes, for example environmental characteristics, public
transport accessibility, the existing stock of properties, family changes over time, accessibility to
employment centres etc.
6.3 In order to assess the needs for the different sizes of homes, we have developed a model which:
Starts with the current profile of housing in terms of size (bedrooms) and tenure. Within the
data, information is available about the age of households and the typical sizes of homes
they occupy
By using demographic projections, it is possible to see which age groups are expected to
change in number, and by how much. On the assumption that occupancy patterns for each
age group (within each tenure) remain the same, it is therefore possible to work out what
profile of housing is needed over the assessment period to 2029.
6.4 An important starting point is to understand the current mix of housing tenures and size in each
area. Table 8.1 below profiles the sizes of homes in different tenure groups. This shows that the
profile of housing in Reigate & Banstead looks to be fairly balanced in comparison with other areas
(i.e. there is not obvious over- or under-supply of particular sizes of homes relative to other
locations). Although, it is clear that:
The market (owner-occupied) sector in Reigate & Banstead has a higher proportion of 4+
bedroom homes and a lower proportion of 3-bedroom homes compared with the wider
comparators but in line with the County profile;
The social rented sector in Reigate & Banstead has a lower proportion of 1-bedroom homes
and higher proportion of 2-bedroom homes in comparison with the County profile but in line
with the wider comparators; and
The private rented sector in Reigate & Banstead has a higher proportion of 1- and 2-
bedroom homes and lower proportion of 4+ bedroom homes compared with other areas.
6.5 These observations about the current mix feed into conclusions about future mix later in this
section.
33
Table 6.1 Number of Bedrooms by Tenure, 2011
Reigate & Banstead
Surrey South East England
Owner-occupied
1-bedroom 5% 5% 5% 4% 2-bedrooms 21% 21% 22% 23% 3-bedrooms 41% 40% 44% 48% 4+-bedrooms 33% 35% 30% 25% TOTAL 100% 100% 100% 100%
Social rented
1-bedroom 30% 37% 32% 31% 2-bedrooms 34% 30% 33% 34% 3-bedrooms 32% 30% 31% 31% 4+-bedrooms 4% 3% 4% 4% TOTAL 100% 100% 100% 100%
Private rented
1-bedroom 26% 23% 24% 23% 2-bedrooms 43% 39% 37% 39% 3-bedrooms 22% 24% 27% 28% 4+-bedrooms 9% 14% 12% 10% TOTAL 100% 100% 100% 100%
Source: Census, 2011
Overview of the Methodology
6.6 The method to consider future housing mix looks at the ages of the Household Reference Persons
(HRP – often more normally called the head of household) and how these are projected to change
over time. The sub-sections to follow describe some of the key analysis.
Understanding How Households Occupy Homes
6.7 Whilst the demographic projections provide a good indication of how the population and household
structure will develop, it is not a simple task to convert the net increase in the number of
households into a suggested profile for additional housing to be provided. The main reason for this
is that in the market sector, households are able to buy or rent any size of property (subject to what
they can afford) and therefore knowledge of the profile of households in an area does not directly
transfer into the sizes of property to be provided.
6.8 The size of housing which households occupy relates more to their wealth and age than the
number of people they contain. For example, there is no reason why a single person cannot buy (or
choose to live in) a 4-bedroom home as long as they can afford it, and hence projecting an
increase in single person households does not automatically translate into a need for smaller units.
That said, issues of supply can also impact occupancy patterns, for example it may be that a
supply of additional smaller bungalows (say 2-bedrooms) would encourage older people to
downsize but in the absence of such accommodation these households remain living in their larger
accommodation.
34
6.9 The issue of choice is less relevant in the affordable sector (particularly since the introduction of the
social sector size criteria) although there will still be some level of under-occupation moving
forward with regard to older person and working households who may be able to under-occupy
housing (e.g. those who can afford to pay the ‘bedroom tax’) . There will also be those who
purchase shared ownership properties which are larger than they require (i.e. single people or
couples purchasing 2 bedroom shared ownership flats and houses). There will also be families
purchasing shared ownership properties with an additional bedroom.
6.10 The approach used is to interrogate information derived in the projections about the number of
household reference persons (HRPs) in each age group and apply this to the profile of housing
within these groups. The data for this analysis has been formed from a commissioned table by
ONS (table CT0621 which provides relevant data for all local authorities in England and Wales
from the 2011 Census).
6.11 The figure below shows an estimate of how the average number of bedrooms varies by different
ages of HRP and broad tenure group for Reigate & Banstead. In the owner-occupied sector the
average size of accommodation rises over time to typically reach a peak around the age of 50; a
similar pattern (but with smaller dwelling sizes) is seen in both the social and private rented sector.
After peaking, the average dwelling size decreases – as typically some households downsize as
they get older.
Figure 8.1: Average Bedrooms by Age and Tenure – Reigate & Banstead
0
0.5
1
1.5
2
2.5
3
3.5
4
16-2
4
25-2
9
30-3
4
35-3
9
40-4
4
45-4
9
50-5
4
55-5
9
60-6
4
65-6
9
70-7
4
75-7
9
80-8
4
85+
Ave
rage
num
ber
of b
edro
oms
Age of household reference person
Owner-occupied
Private rented
Social rented
Source: Derived from ONS Commissioned Table CT0621 and 2011 Census
6.12 In terms of the analysis to follow, the outputs have been segmented into three broad categories.
These are market housing, which is taken to follow the occupancy profiles in the owner-occupied
sector; affordable home ownership, which is taken to follow the occupancy profile in the private
35
- - - -
rented sector (this is seen as reasonable as the Government’s desired growth in home ownership
looks to be largely driven by a wish to see households move out of private renting) and affordable
(rented) housing, which is taken to follow the occupancy profile in the social rented sector. The
affordable sector in the analysis to follow would include affordable rented housing.
Tenure Assumptions 6.13 The housing market model has been used to estimate the future need for different sizes of property
over the 10-year period from 2019 to 2029. The model works by looking at the types and sizes of
accommodation occupied by different ages of residents and attaching projected changes in the
population to this to project need and demand for different sizes of homes. However, the way
households of different ages occupy homes differs between the market and affordable sectors.
6.14 It is therefore necessary on this basis to make some judgement for modelling purposes on what
proportion of net completions might be of market and affordable housing. In line with DMP Policy
DES6, the analysis assumes that 70% of net completions are of market housing (designed to be
sold for owner-occupation) and 30% affordable. There is no assumption about private rented
housing, although it is possible that some of the market (owner-occupied) housing will end up in
this sector.
6.15 Within the 30% affordable housing, we have assumed 10% affordable home ownership provision
and 20% rented affordable provision (i.e. social and affordable rented housing). It should be noted
that the tenure split assumptions are not informed by the affordable housing analysis earlier in this
report. It is for the local authority to determine if they wish to exceed the NPPF’s requirement for a
minimum of 10% affordable home ownership provision.
Modelled Outputs
6.16 By following the methodology set out above and drawing on the sources shown, a series of outputs
have been derived to consider the likely size requirement of housing in each of the three broad
tenures.
Table 6.2 Modelled Mix of Housing by Size and Tenure – Reigate & Banstead
1 bedroom 2 bedrooms 3 bedrooms 4+ bedrooms
Market 4% 22% 44% 30% Affordable home ownership 25% 41% 24% 10% Affordable housing (rented) 33% 32% 32% 3% Source: Housing Market Model
6.17 The analysis clearly shows the different profiles in the three broad tenures with affordable housing
being more heavily skewed towards smaller dwellings, and affordable home ownership sitting
somewhere in between the market and affordable housing.
36
6.18 For comparison, table 8.3 shows the need for different sizes of affordable rented accommodation
households shown on the Council’s Housing Register. This represents a need for affordable
(rented) housing.
Table 6.3 Profile of Affordable Rented Need by Households on Housing Register
Reigate & Banstead 1-bedroom 28% 2-bedrooms 48% 3-bedrooms 20% 4+-bedrooms 5% Total 100% Source: Local Authority Housing Statistics (2019)
Indicative Targets for Different Sizes of Properties by Tenure
Social/Affordable Rented Housing 6.19 Whilst the output of the modelling provides estimates of the proportion of homes of different sizes
that are needed, there are also qualitative factors which should be taken into account.
6.20 Considerations include the relative lack of past delivery of larger affordable homes. Larger
affordable housing units also have a relatively low turnover. As a result, whilst the number of
households coming forward for 4+-bedroom homes is typically quite small, the ability for these
needs to be met is even more limited.
6.21 The slow turnover of 4 beds is particularly apparent in Reigate & Banstead according the Council’s
housing strategy team, with families often taking these homes with children of a young age. The
Council’s housing strategy team notes that the greatest need is for 2 bedroom affordable homes –
with a waiting time of between 18 months to 2 years – however, the need is fundamentally for 2
bedroom 4 person homes and flats as these can accommodate a greater number of household
types.
6.22 The Council’s housing strategy team also note that there is a need for 3 bedroom 6 person homes
as it is difficult for families with 3 children to occupy 3 bedroom 5 person homes; and as a result;
the need is often transferred to 4 bedroom need which can be a notable jump in costs – particularly
to the north of the borough where the maximum LHA rate is higher (i.e. Outer South London area).
6.23 For these reasons, it is suggested in converting the long-term modelled outputs into a profile of
housing recommended to be provided (in the affordable sector) that the proportion of 1-bedroom
homes is slightly reduced from the local-based outputs, along with a commensurate increase in 4+-
bedroom homes and slightly higher increase in 2-bedroom homes.
37
6.24 At a borough-wide level, the analysis would recommend the following mix of affordable rented housing9 :
1-bed properties: 20% 2-bed properties: 40% 3-bed properties: 30% 4+-bed properties: 10%
6.25 These conclusions recognise the role which delivery of larger family homes can play in releasing a
supply of smaller properties for other households; together with the limited flexibility which 1-bed
properties offer to changing household circumstances which feed through into higher turnover and
management issues.
Affordable Home Ownership 6.26 In the affordable home ownership and market sectors a profile of housing that more closely
matches the outputs of the modelling is suggested. However, qualitative factors do still need to be
taken into consideration. Following discussions with the Council’s housing strategy team and
selected RPs, we have reduced the proportion of 1-bedroom homes – which can often be
challenging to sell – and increased the number of 3-bedroom homes. The housing strategy team
also noted that many couples coming out of the PRS and into affordable home ownership are
looking for a larger family home. This is reflected below.
6.27 On the basis of these factors it is considered that the provision of affordable home ownership
should be more explicitly focused on delivering smaller family housing for younger households. On
this basis the following mix of affordable home ownership is suggested:
1-bed properties: 20% 2-bed properties: 45% 3-bed properties: 25% 4+-bed properties: 10%
Market Housing 6.28 Finally, in the market sector, a balance of dwellings is suggested that takes account of both the
demand for homes and the changing demographic profile. This sees a slightly larger recommended
profile compared with other tenure groups. The following mix of market housing is suggested:
9 By affordable rented housing in this context, we mean social rented; affordable rented; and
affordable private rented homes.
38
- -
–
1-bed properties: 5% 2-bed properties: 25% 3-bed properties: 40% 4+-bed properties: 30%
The Need for Different Sizes of Homes: Summary and Conclusions
Understanding the existing housing mix in a place is important in considering what future mix of
housing is appropriate to deliver a mixed and balanced community. This is important at both a
strategic, and at a local, level.
The analysis shows a fairly balanced profile of housing in Reigate & Banstead compared with other
areas. Although the borough does have a strong representation of 4+ bedroom housing in the
owner occupier sector; with a lower proportion of 1 bedroom affordable housing.
Taking into account the current housing stock and expected demographic trends including the
expectation that some older households will downsize if the right properties are available), the
assessment points to a need for different types of homes in the market and affordable housing
sectors as set out in paragraphs 5.24, 5.27 and 5.28.
These strategic conclusions should be brought together with the other requirements in DMP Policy
DES4, in considering the appropriate mix of housing on individual development sites.
39
7. CONCLUSIONS
7.1 This section sets out the conclusions. The assessment has been based on an anticipated average
annual delivery of 580dpa in Reigate & Banstead over the 10 year period from 2019 to 2029.
Affordable Housing
7.2 The report recommends appropriate affordable housing mix responding to the widened definition of
affordable housing set out in the revised 2019 NPPF. The analysis in this report reflects the clear
and acute need identified in this study for rented affordable housing from lower income households,
which the local authority has a statutory duty to house.
7.3 The NPPF advises that at least 10% of all new housing on large sites of 10 or more homes should
be for affordable home ownership unless this would exceed the level of affordable housing required
in the area, or significantly prejudice the ability to meet the identified affordable housing needs of
specific groups. The evidence in this report points towards a scale of need for affordable home
ownership equating to more than 10% of the overall anticipated average annual delivery and
therefore provides sufficient evidence to justify the 10% provision recommended by the NPPF.
Needs for Different Sizes of Homes
7.4 Understanding the existing housing mix in the borough is important in considering what future mix
of housing is appropriate to deliver a mixed and balanced community. This is important at both a
strategic, and at a local, level.
7.5 The analysis in this report shows a fairly balanced profile of housing in Reigate & Banstead
compared with other areas. Although the borough does have a strong representation of 4+
bedroom housing in the owner-occupier sector; with a lower proportion of 1 bedroom affordable
housing.
7.6 Taking into account the current housing stock and expected demographic trends – including the
expectation that some older households will downsize if the right properties are available), this
report points towards a need for different sizes of homes in the market and affordable sectors
which are reflected in the table below.
Affordable Rented Affordable Home Ownership Market Housing
1 Bed 20% 20% 5% 2 Bedrooms 40% 45% 25% 3 Bedrooms 30% 25% 40%
41
4+ Bedrooms 10% 10% 30%
7.7 These conclusions have been supported by engagement with the Council’s housing strategy team
and selected Registered Providers in the borough.
7.8 This report does not suggest that prescriptive figures should necessarily be provided on each site
but rather that they should be used to inform the mix required as part of new developments (as
required by criterion 1(b) of DMP Policy DES4 “Housing Mix” ) and to inform the size requirements
in Affordable Housing Supplementary Planning Document.
42
A1. COMPONENTS OF POPULATION CHANGES
Table A1.1 Components of Pop. Change, Mid-2001 to Mid-2018 – Reigate & Banstead Year Natural
Change Net
Internal Migration
Net International
Migration
Other Changes
Other (Unattributable)
Total Change
2001/2 9 -93 -92 -153 -60 -389 2002/3 269 -80 272 -18 -50 393 2003/4 244 165 271 -55 -68 557 2004/5 139 60 379 4 -44 538 2005/6 246 758 434 56 -64 1,430 2006/7 530 1,210 313 63 -82 2,034 2007/8 534 898 247 19 -65 1,633 2008/9 524 1,387 212 41 -87 2,077 2009/10 579 1,158 206 -14 -122 1,807 2010/11 662 1,078 156 -73 -189 1,634 2011/12 662 702 -3 36 0 1,397 2012/13 509 592 15 40 0 1,156 2013/14 611 1,289 322 -292 0 1,930 2014/15 365 239 292 40 0 936 2015/16 441 423 410 216 0 1,490 2016/17 334 528 266 -29 0 1,099 2017/18 355 671 245 103 0 1,374 Source: ONS
43