228
Reimagining our shared future RBC client Kathy Cheng, owner of Redwood Classics Apparel Toronto, Ontario

Reimaginingour sharedfuture
RBC client Kathy Cheng, owner of Redwood Classics ApparelToronto, Ontario

Our Purpose
Helping clients thrive and communities prosperGuided by our Vision to be among the world’smost trusted and successful financial institutions,and driven by our Purpose, we aim to be:
> The undisputed financial services leader inCanada
> The preferred partner to corporate, institutionaland high-net-worth clients and their businessesin the U.S.
> A leading financial services partner valued forour expertise in select global financial centres
We are guided by our Values:
> Client First
> Collaboration
> Accountability
> Diversity & Inclusion
> Integrity
Table of Contents
2 2020 Highlights 14 Management’s Discussion and Analysis
4 CEO Letter 117 Enhanced Disclosure Task Force
7 Chair Letter Recommendations Index
Reimagining our shared future 118 Reports and Consolidated Financial Statements
8 Helping Clients Thrive 221 Ten-Year Statistical Review
9 Our Tech and Data Strategy 222 Glossary
10 Transforming the Employee Experience 225 Shareholder Information
11 Driving Diversity & Inclusion
12 Taking Action on Sustainability
13 Supporting and Inspiring Youth
Connect with us:
facebook.com/rbc www.youtube.com/user/RBC On the cover:
instagram.com/rbc linkedin.com/company/rbc RBC client Kathy Cheng on the production floor of her family-ownedbusiness, Redwood Classics Apparel, a textiles and manufacturingcompany based in Toronto, Ontario.twitter.com/@RBC rbc.com/ar2020

Who we are
Royal Bank of Canada is a global financial institution with a purpose-driven, principles-led approach to delivering leading performance.Our success comes from the 86,000+ employees who leverage theirimaginations and insights to bring our vision, values and strategy tolife so we can help our clients thrive and communities prosper. AsCanada’s biggest bank, and one of the largest in the world based onmarket capitalization, we have a diversified business model with afocus on innovation and providing exceptional experiences to our17 million clients in Canada, the U.S. and 34 other countries.
How we create value has always been as important as what weachieve. This was even more pronounced in 2020 as the impacts ofthe COVID-19 pandemic took hold and continue to reverberatearound the world. In our annual report, you’ll read about how we arenavigating these unprecedented times and leveraging our scale andfinancial strength to deliver for our clients, communities, employees,and shareholders.
Why invest?
> Diversified business modelwith scale and market-leading client franchises
> Resilient earnings with apremium ROE and dividendstability
> Robust capital and liquidityposition
> Disciplined approach to riskand expense management
> Differentiated technologyinvestments and digitalcapabilities
> Recognized leader in ESGand corporate citizenship
BY THE NUMBERS
86,000+employees
17 millionclients
36countries
All figures included in the front section of the annual report are from fiscal 2020 unless otherwise specified.
Royal Bank of Canada Annual Report 2020 1

Some 2020 highlights across our balanced scorecard
Clients
620,000+ clientshave benefitted fromRBC Client Relief programs
5 millionactive mobile users, up 12% year-over-year(1)
Celent ModelBank of the Yearaward winner, demonstratingindustry-leading practices thatdrive digital success in banking
#1 market sharein investment banking in Canada(2)
A+ scoreon RBC Global Asset Management’sresponsible investing activities, asassessed by the UN Principles forResponsible Investment(3)
$8.8 billionin financing for sustainable bondsand loans, representing 64% growthover 2019
Outstanding GlobalPrivate Bankin North America for the fifth yearin a row(4)
Customer ServiceAward Winnerand 10 out of 11 top rankings amongthe big five Canadian banks in the2020 Ipsos Financial ServiceExcellence Awards
Employees
#4 globallyin the 2020 Refinitiv Diversity &Inclusion Index, ranking over9,000 publicly-listed companies
Womenrepresented51% of new hires(5)
52% of promotions(5)(6)
46% of executives(7)
Black, Indigenous andPeople of Colour (BIPOC)represented35% of new hires(8)
40% of promotions(6)(8)
23% of new executive appointments,surpassing our goal of 20% forthe year(7)
18% young people(9)
When asked about their well-beingduring the COVID-19 pandemic(10):
91% of employees feelwell-supported by RBC
90% of employees see theirwork as meaningful
92% of employees indicatedthat they have the informationthat matters to them
Communities
$201 millionprovided through RBC Future Launch®,reaching over 2.5 million Canadianyouth through 500+ partner programssince 2017
$23.9 millionraised by employees and retirees for4,300+ charities through our annualEmployee Giving Campaign in Canada
$142 milliongiven globally through cash donationsand community investments, includingsupport to mitigate the economicimpact of the COVID-19 pandemic(11)
$10.7 millionraised to support youth and children’scharities globally through the firstvirtual versions of RBC Race for the Kidsand RBC Trade for the Kids
$3.9 billionin support of our communities asone of the largest taxpayers in Canada,and as a taxpayer in other countrieswhere we operate(12)
1st financial institutionin Canadato sign a renewable energyPower Purchase Agreement
(1) 90-day active mobile users in Canadian Banking only(2) Dealogic, YTD as at October 31, 2020(3) See RBC GAM’s Responsible Investing Transparency Report and the PRI Assessment Methodology
for more details(4) Private Banker International Global Wealth Awards 2020(5) Global; excludes summer interns, students and co-ops(6) Defined as upward change in position level or HR Class(7) Represents data for our businesses in Canada governed by the Employment Equity Act
(8) North America; excludes summer interns, students and co-ops(9) Headcount under 30 globally, excluding City National and BlueBay Asset Management employees(10) Well-being surveys conducted from April to June 2020. The average participation rate was 55%(11) Includes employee volunteer grants and gifts in kind, as well as contributions to non-profits and
non-registered charities. Figure includes sponsorships(12) Refer to page 95 for additional information
2 Royal Bank of Canada Annual Report 2020

Shareholders
$7.82 14.2% 86 averagepercentile rankingdiluted earnings per share (EPS), return on equity (ROE),
down from $8.75 in 2019 down from 16.8% in 2019 on priority ESG indices(2)
63% 12.5% $4.2 billionof profits returned to our shareholders common equity tier 1 (CET1) ratio, remainder of our profit availablethrough dividends(1) and repurchases up from 12.1% in 2019 to reinvest in future growth
$4.29dividends declared per share,increased by $0.22 since 2019
Earnings Earnings by business segment(4)
Annualized Dividend Increase of:
5%One year
8%Ten year(3)
net income (C$ billion)
2019 2020
$11.4 $12.9
Personal & Commercial BankingCapital MarketsWealth ManagementInsuranceInvestor & Treasury Services
24%
19%
5%7%
45%
Financial performance metricsMEDIUM-TERM OBJECTIVES(5) 3-YEAR(6) 5-YEAR(6)
Diluted EPS growth of 7%+ 1% 3%
ROE of 16%+ 16.2% 16.4%
Strong capital ratio (CET1)(7) 12% 11.6%
Dividend payout ratio of 40%–50% 49% 48%
Total shareholder return(8)
3-YEAR 5-YEAR
RBC 1% 9%
Global peer average (6)% 3%
(1) Includes dividends paid on both common and preferred shares. Dividends were $6.1 billion on common shares and $0.3 billion on preferred shares(2) Average percentile ranking compiled from our four top-tier ESG ratings/rankings, including Sustainalytics, MSCI ESG Rating, FTSE4Good and RobecoSAM’s Corporate Sustainability Assessment (informing the DJSI)(3) Compound Annual Growth Rate(4) Excludes Corporate Support(5) A medium-term (3-5 year) objective is considered to be achieved when the performance goal is met in either a 3- or 5-year period. These objectives assume a normal business environment and our ability to achieve them in
a period may be adversely affected by extraordinary developments such as the COVID-19 pandemic and the current low interest rate environment(6) Diluted EPS growth is calculated using a Compound Annual Growth Rate. ROE, CET1 and dividend payout ratio are calculated using an average(7) For further details on the CET1 ratio, refer to the Capital Management section(8) In fiscal 2020, Power Financial Corporation was removed from the global peer group. The 3- and 5-year annualized TSR are calculated based on our common share price appreciation as per the TSX closing market price plus
reinvested dividends for the period October 31, 2017 to October 31, 2020 and October 31, 2015 to October 31, 2020
Royal Bank of Canada Annual Report 2020 3

Message from Dave McKay
Amidst historic challenges ariseopportunities to reimagine ourshared future
2020 was one of the most difficult years that society, globaleconomies and RBC has faced in generations. Tragically, liveswere lost and the rapid spread of COVID-19 forced countries toshut down significant parts of their economies to protect theircitizens. This led to steep increases in unemployment and theworst economic downturn since the Great Depression.
The pandemic has also exposed growing foundational cracks insociety. The economic hit has disproportionately impacted peoplewho can afford it least, underscoring gaps in social infrastructureand education. These factors have contributed to mounting unrestand division and revealed ugly truths about the pervasiveness ofsystemic racism.
As with any crisis, leadership at all levels was tested andcollaboration was critical. I saw business and civic leaders workalongside all levels of government to protect the health andsafety of essential workers and citizens; support and advocatefor programs and policy to mitigate the impacts of the crisis; andimplement relief measures designed to help see us throughto recovery.
While each country’s response to these challenges differed,governments provided significant short-term support forindividuals, and to a varying degree, businesses and communities.Central banks injected significant liquidity into the globaleconomy, drawing upon learnings from the global financial crisis.
Amidst this challenging environment, RBC’s strength was nevermore evident. Guided by our Purpose to help clients thrive andcommunities prosper, the bank led with a heightened sense offocus on delivering long-term value for our employees, clients,communities, and shareholders.
In what were truly unchartered waters, RBC continued to performat a remarkably high level, particularly in the context of the earlydays of the crisis. Within weeks, we moved over 80% of ouremployees—across 36 countries—to work outside bank premises.To limit the health risks to clients and our employees and supportslowing the spread of the virus, we temporarily closed hundreds ofbranches across our network, and reduced hours of operation. Wemoved more employees into contact centre roles to handle anincreasing volume of urgent client calls. All of this was enabled bythe significant investments we had long made in ourinfrastructure. This included securing broadband capability wellbefore the pandemic started, investing in distributed call centrecapability over the past decade, and building out market leadingdigital capabilities for clients. These investments have proven tobe a differentiator.
Like most citizens, our employees were understandably anxiousabout their future, and it was critical each and every one felteconomically secure, so they could focus on the needs of ourclients. RBC was the first Canadian bank to assure no job lossesdue to the pandemic in 2020. Employees unable to work fromhome received special compensation and additional days of paidleave, and employees working remotely were reimbursed for homeoffices expenses. A series of employee well-being surveys providedvaluable insights and helped us create new programs andresources to support them—including a strong focus on mentalhealth.
Through my frequent client outreach, I heard first-hand howdevastating this past year has been for so many families,businesses and young people. The sudden loss of loved ones. Theloss of jobs and small businesses. Missing out on the valuableexperiences of a normal school year. The dreams, plans and hardwork of so many have been undermined by the global pandemic.
Throughout this time, RBC actively supported our clients. Weadvised millions of personal and commercial clients and madeavailable billions of dollars of financial relief, including deferrals, toprotect their livelihoods. We rolled out government relief programsat unprecedented speed. New and additional credit facilities werealso made available for corporate and institutional clients to helpthem manage through the volatility. The pandemic presented otherunexpected challenges. Many clients were at risk of being strandedabroad as border closures and travel bans took effect. OurInsurance business helped thousands of clients get their familieshome safely. I was proud to see our efforts stand out in a year whenit counted most. Among the big five Canadian banks, J.D. Powerranked RBC highest in retail customer satisfaction.
4 Royal Bank of Canada Annual Report 2020

In the communities where we live and work, many vulnerablecitizens were at risk and we quickly stepped in to help. RBC madesignificant donations to COVID-19 relief—committing over$11 million towards food security, mental health programs andpandemic preparedness and response. This was part of$142 million in donations and investments that RBC directedthroughout 2020 to local community organizations and causes,including our key focus areas of youth, the environment, the arts,and diversity and inclusion.
The heart and soul of our communities are the small businessesthat keep our main streets vibrant. Most were not prepared for thedisruption brought on by the pandemic, particularly the suddenshift to digital and online commerce. We witnessed an economicshift to strong global brands and technology platforms, leavingmany small business behind. So RBC stepped up, and partneredwith government, chambers of commerce, and other leadingbrands to create a national movement to support small and localbusinesses through Canada United™. The program helpedgenerate over $1 billion in purchases and raised additional fundingto help accommodate re-opening guidelines and e-commercecapabilities.
RBC entered the crisis from a position of strength and the size,scale and liquidity of our balance sheet coupled with the earningspower of our diversified business model enabled us to continuesupporting our clients, employees and communities, while alsodelivering for our shareholders. In response to the significanteconomic shocks and market volatility resulting from thepandemic, we took measures to further strengthen and protect ourbalance sheet. During 2020, we increased total provisions forpotential future credit losses by $2.5 billion, maintained a strongliquidity coverage ratio—145% at Q4, and increased the capitalbuffers by nearly $6 billion to close the year with a robust CET1ratio of 12.5%.
The sudden decline in interest rates had a material negativeimpact on our net interest income. Some of this impact was offsetby very strong growth in client volumes across most of ourbusinesses and careful management of expenses.
Notwithstanding the increase in reserves and revenue pressure,RBC generated earnings of $11.4 billion and an ROE of 14.2%. Wedelivered $6 billion in dividends to our common shareholders andoutperformed our global peer group in terms of Total ShareholderReturn over three- and five-year periods.
Looking ahead, we expect pandemic-related stresses and a lowinterest rate environment will continue to present headwinds andshape the banking landscape and outlook.
The path ahead—continuously transforming tocreate more valueThe uncertainty of the scale and duration of the pandemic is oneof the most difficult challenges ahead, straining individual,business and government financial resources. So too are themental health challenges of isolation, prolonged remote work,school closures and the pressure on working parents.
But what I know for certain is that RBC has the strength andresilience to manage a range of near-term scenarios as well asfulfill our longer-term vision to transform our bank for the future. Inmany ways, the pandemic has accelerated us toward a future wehave long anticipated and prepared for, as our clients seek outnew ways to bank and be served.
As we move forward, we will continue to leverage the size andstrength of our balance sheet to support our clients. Our ‘bionic’blend of great people and technology will remain a key successfactor, creating differentiated offerings and solutions that attractnew clients and deepen existing relationships. We will continue toprioritize a disciplined focus on expense management to remainfinancially and strategically flexible. And we will always align ouractions with our Purpose to create meaningful value for clients inthe following four ways:
• Advice and Insights—RBC will provide insights, solutions andservices that help our clients understand the world aroundthem and feel confident about the choices they make. A greatexample is MyAdvisor® — our online financial planningplatform that enables our clients to receive insights andcounsel in real time. Since launch, more than two million planshave been developed using this innovation.
• Convenience and Time—Our clients will be empowered toshape their own banking experiences. We will continue tosimplify and digitize their interactions with us—saving time,and adding convenience and meaningful value for them.Artificial Intelligence (AI)-based solutions like NOMI® deliverpersonalized services tailored to individual banking needs.NOMI Find & Save®, for instance, has helped clients save anaverage of more than $300 per month. In our growing U.S.franchises, we have seen positive uptake in our digitalofferings. This includes a 38% increase of mobile users at CityNational Bank, and a growth of over 160,000 mobile visits inU.S. Wealth Management, compared to last year.
• Giving our Clients More—For the past 20 years, we haveinvested in making RBC Rewards® the largest proprietaryrewards program in Canada, delivering nearly $1 billion invalue to our members in the last year. This broad-basedloyalty program includes points, cash-back, discounts, specialaccess, member experience through over 400 partners andbrands. We will also continue to offer clients more valuethrough new ‘beyond banking’ services, as well as rewardingthem for their relationship with us. Consider the biggestinvestment most people make: buying a home. RBC Venturesoffers solutions at every stage of their home journey—fromexploring real estate listings to moving into and maintainingtheir home.
• New Services—Leveraging data and our trusted brand, we willuse data analytics and digital platforms to understand andmeet clients’ needs, and deliver new and differentiatedsolutions. Our Capital Markets AI-based electronic tradingplatform, Aiden™, executes trades based on live market data,and dynamically adjusts to new information and learningsfrom each of its previous actions.
Reimagining our shared futureHelping to reimagine our collective future is critical for clients andcommunities to thrive and prosper. Even as the pandemiccontinues to challenge society, it has also presented us withopportunities to accelerate the pace of progress or, in some cases,adjust the course we are on. Taking these bold steps now will helpadvance our journey toward a more inclusive, digital andsustainable age.
In doing so, businesses, non-profits and all levels of governmentswill need to come together with renewed focus to not only lead usout of the recession, but create conditions to help people thriveand communities prosper in a very different world.
Royal Bank of Canada Annual Report 2020 5

For RBC, and in my role as CEO, we are leading from the front infour key areas:
Building a ‘digital first’ economy: The pandemic has accelerateddigital adoption, changing consumer behaviours and howorganizations create value. And it has become clear that helpingsmall businesses make the short- and long-term transition to moredigitally scaled operations is more important than ever before—keeping this vital sector of our economy viable and vibrant.
Advancing a ‘digital first’ economy will require a concerted effortby public and private sectors to invest in our tech sector, networksand talent. In Canada, for instance, we need to encourage moreinvestment capital from abroad, supported by incentive-based taxpolicies that take advantage of the new supply chains and servicesthat we’ll need in a more digital world.
RBC plays many roles in helping build a ‘digital first’ economy.From teaching seniors to bank online and offering solutions thatenable businesses to harness smart technology, to advocating andleading the way on the responsible and ethical use of AI. Forinstance, RBC’s Institute for Research—Borealis AI™—found amajority of businesses surveyed want to exploit powerful AIsolutions, but do not have the resources or expertise to do so in aresponsible way. That’s why Borealis AI™ introduced a new onlinehub that brings open source research code, tutorials, academicresearch and lectures to the AI community, helping to make ethicalAI available to all.
Preparing a new generation for a bolder future: The pandemichas also accelerated the move from a credentials-based economyto a skills-based one, critical to addressing current skills shortagesand building a more inclusive workforce. The workplace demandsnew and evolving skill sets. This includes the ability to operate inan increasingly hybrid—virtual/physical—world, buildingrelationships, communicating, solving problems, and developingdigital services. For RBC, we know it is vital we continue to helpyoung people prepare for the new world of work, and that’s why in2017 we committed $500 million over 10 years through RBC FutureLaunch®.
But this past year, the crisis required us to move with even greaterurgency and pivot our support for youth at a time when theyneeded it most. Participation in networking events and skillsdevelopment programs continued through newly created virtualprograms, and in some cases, reached even wider audiences livingin rural and remote areas, as well as on reserves. We also hostedour first national virtual gathering of industry experts, youngprofessionals and top athletes to share their advice with Canadianyouth. And finally, notwithstanding the challenges of thepandemic, it was important to keep our promise of meaningful,paid work experiences to more than 1,400 summer students,despite the challenges of working in a virtual environment.
Building a more inclusive and prosperous society: The pandemiccast even greater light on the inequities and systemic racism thathold so many people back from living a life that others take forgranted. We cannot create a truly prosperous future without thefull participation of all citizens. That means replacing obstacleswith opportunities, encouraging engagement, speaking up, andcreating room for people to realize their full potential.
Diversity and inclusion has been a cornerstone of RBC’s values formany years. In 2020, for the second consecutive year, RBC rankedin the top 10 globally on Refinitiv’s Top 100 Company Diversity &Inclusion. And while we have made progress against some of ourgoals, there is more to be done to accelerate change. This year, I
spent even more time listening to people inside and outside thebank, including conversations with BIPOC leaders at RBC and avirtual roundtable of Indigenous leaders that focused on setting upfuture generations for success. In these and other discussions,hard questions were asked about racism that we, as a society,could not see, or worse, chose not to see for far too long.
Today, I feel an even greater sense of urgency—andresponsibility—to harness RBC’s values and convictions to drivechange within the bank and in society more broadly. That meansbuilding on existing commitments to foster social and economicmobility, such as our long-standing efforts to support Indigenouseconomies, peoples and communities. RBC took anotherimportant step forward with the introduction of $100 million insmall business loans over five years to Black entrepreneurs and atarget to accelerate the growth of our BIPOC executiverepresentation.
Building a more sustainable world: Many people worry thepandemic may shift priorities away from tackling one of the mostpressing issues of our age—climate change. I believe the financialsystem needs to be leading efforts to support clean economicgrowth and the transition to a low-carbon economy. That includesan aspiration to help the world meet its energy needs and move toincreasingly cleaner fuel sources. RBC’s climate strategy isfocused on working with our clients and communities, using ourcapital as a force for positive change. Our $100 billion sustainablefinance commitment by 2025 is balanced with investments we aremaking in our energy and natural resource clients. This enablesthem to continue investing in innovation to reduce emissions andremain leaders on the global stage.
In 2020, RBC was the first Canadian bank to sign a long-termrenewable energy power purchase agreement. The agreement willsupport the construction of two solar farms in Alberta, which areanticipated to create 300 new jobs and inject $70 million into theprovincial economy. We also made the decision not to providedirect funding for any project or transaction that involvesexploration or development in the Arctic National Wildlife Refuge,the largest national wildlife refuge in the United States. RBC wasthe first Canadian bank to make this commitment.
In moments of need come our moments of truthThis year will be remembered through history as one filled withunimaginable obstacles. It can also be remembered for what wedid with these challenges—and what we can build in the yearsahead.
I am proud of the meaningful difference RBC made for those weserve. As we look forward, we will continue to use the power of ourPurpose and strength of our franchise to help create a shared andsustainable future. It’s a role we embrace.
Our momentum is driven by the incredible contributions of ouremployees and invaluable counsel of our Board. I want to expressmy thanks and gratitude for all they do.
Dave McKayPresident and Chief Executive Officer
6 Royal Bank of Canada Annual Report 2020

Message from Katie Taylor
The global pandemic has made perfectly clear what matters mostin life: our health, safety and financial security.
No organization understands that better than RBC. Throughout thecrisis, the bank remained ever present on the front lines, playingan essential role in the lives of those we serve. RBC responded tothe evolving needs of our employees, advised clients and madeavailable billions of dollars of financial relief, as well as anticipatedand mobilized resources to protect and promote the viability andvibrancy of local communities.
Leadership always matters. But it is during times of crisis when itbecomes the defining difference for an organization and itsstakeholders. That is why the honour bestowed upon Dave McKayby The Globe and Mail was especially meaningful in 2020. Earningthe Corporate Citizen of the Year recognition speaks to why RBCexists: to help clients thrive and communities prosper.
More than ever, robust communication between the Board andmanagement has been vital in enabling the Board to providesound oversight and pivot quickly to support management duringthe global pandemic.
The crisis highlighted the need for the Board to continue to ensurethe bank has the right strategy, risk management and talent tostay true to its Purpose and pursue its strategic objectives. It is acentral tenet to our role as stewards of the bank, exercisingindependent judgment in overseeing management andsafeguarding the interests of shareholders.
To this end, enterprise and business segment strategy arediscussed at each Board meeting and at its annual offsite session,which was held virtually in 2020. The Board challengesmanagement on how best to leverage RBC’s strong capitalposition and create value by investing in organic growth andexploring strategic acquisitions.
Promoting strong risk conduct and embedding a risk managementculture throughout RBC are key priorities. This includes carefulassessment that management’s plans appropriately balancestrategic opportunities with risk discipline to ensure long-termshareholder value. The global pandemic presented anunprecedented opportunity to test and ultimately confirm thesoundness of the bank’s operational resilience and risk processes.RBC’s ability to migrate over 80% of its employees to remote worklocations in a matter of weeks—and continue serving clients evenwith unprecedented activity levels—reinforced our confidence andshowcased the cohesion between the bank’s business continuityplans and risk management practices.
The Board was also actively engaged in surveying the bank’soperating environment and ensured its leaders were well preparedto address issues impacting the reputation of our business andability to operate. In 2020, it has been especially important toreach out and listen to our clients and be empathetic when dealingwith financial hardship.
An organization’s strategy can only achieve its desired outcomeswhen the right people are in place to lead and execute on it. TheBoard actively assesses senior management and reviewsdevelopment plans for key executives in an effort to ensure thelong-term success of the bank. The selection, appointment anddevelopment of the CEO and the Group Executive is a key focus, asis the need to ensure our executive compensation programs alignwith performance, retain top talent and motivate the bank’s seniorleaders to bring our vision, values and strategy to life. In 2020, theBoard also provided oversight of new initiatives to further enhancethe diversity of the bank’s executive team, which includes effortsto ensure that enhanced staffing targets for women and those whoidentify as Black, Indigenous or People of Colour are detailed andmeasureable to deliver desired outcomes.
Last year, the strength of RBC’s financial position and balancesheet enabled the bank to manage through significant headwindsand continue to build the bank for the future. Indeed, whencombined with the bank’s prudent risk management, diversifiedbusiness mix and proven ability to generate organic earnings, theBoard remains confident in RBC’s growth strategy.
Challenges will persist in the new year. Yet, as 2020 demonstrated,RBC has the strength to adapt and will remain focused ondelivering for clients, employees, communities, and shareholders.What’s more, we will continue to shape the future in ways thatserve the best interests of all our stakeholders. That is a definingtrait of who we are and a competitive advantage of what we do.
Your Board will continue to provide management with soundguidance and oversight and foster robust communication withmanagement. The appointments of Cynthia Devine and MaryannTurcke to the Board add to our existing strength, and provide aunique set of experiences and insights to RBC.
On behalf of the Board, I want to express my ongoing confidence inand gratitude to Dave McKay, the executive leadership team andthe entire RBC team for being present and purposeful in everythingthey do. Our clients, employees and communities are better for it.
Kathleen TaylorChair of the Board
Royal Bank of Canada Annual Report 2020 7

Reimagining our shared future
Helping clients thriveThe trust and confidence our clients place in us speak to the value we create and how we go about achievingresults. Over the past year, we reached even higher in honouring that trust by leveraging our scale, talent andinsights to support our clients and help them navigate this unprecedented time.
Stranded travellers find their wayhome with RBC’s support
Earlier this year, my wife and I took a trip to Spain. Towards theend of our holiday, we found ourselves urgently trying to getback to Canada—borders were closing, flights were cancelledand countries were going into lockdown in an effort to quell thespread of COVID-19.
It’s hard to describe the anxiety we experienced as we worriedwe would not find a way home. That’s when I decided to call RBC,knowing that my Preferred Visa card carried travel insurance.Hours after speaking with RBC Insurance representative Jing, shehad re-booked and pre-paid our tickets so that my wife and Icould return home in a couple of days. Jing and the entire TravelClaims team went above and beyond, assuring our loyalty aslifelong clients.
We are truly grateful to be home safely, and it was RBC Insurancethat got us here.
Eric and Molly Scott
Montreal, Quebec
Our Travel Advisors respondedto 288% more calls at theheight of the pandemic(1) tohelp clients like Eric and Mollyin their time of need.
Checking in to offer comfort and support
When I discovered some of my elderly clients were alone andunable to leave their homes to shop for food during thepandemic, I knew I had to help.
I picked up groceries, put together care packages, made loavesof homemade bread and dropped everything off at theirdoorsteps. That gave me a chance to chat briefly with them froma safe distance to see how they were coping.
This wasn’t just about helping clients—it was about having ahuman touch and supporting other people when they neededit most.
Even with day-to-day banking and investing becoming moredigital, I found other ways to be there for them. Face-to-facemeetings were replaced with online chats to help set up emailaccounts, transfer funds and pay bills. Our team’s clients had mycellphone number and knew they could reach me anytime theyneeded my support.
Stephanie Demestihas
RBC PH&N Investment Counsel, Private Client AssociateToronto, Ontario
15% more Wealth ManagementCanada advisors tookadvantage of Advisor’s VirtualAssistant (AVA™)—an RBC appto stay connected with theirclients online(2).
Loan relief to save a family’s house
I’m a single mom of seven kids (three with special needs) and a full-time nurse inOliver, a small town in British Columbia.
Earlier this year, I lost my job due to the pandemic. I would not have been able tofeed my kids, keep a roof over our heads or have a vehicle on the road if RBC hadnot deferred my mortgage.
Michelle LaroseOliver, British Columbia
194,000+ clientshave benefittedfrom our residentialmortgage deferralprogram.
Not only did the bank provide me with a six-month deferral, but my advisor alsofollowed up by phone to check in and see how we were doing. That personaltouch meant a lot. Now that I’m back to work, I can continue paying my billswithout having to worry about my credit.
Years ago, RBC gave me and my family a mortgage, and, with it, the opportunity toown a home. I have never defaulted or missed a payment, and I’m so appreciativeof what they’ve done to make a difficult year much easier for us.
(1) YoY comparison in the number of travel insurance calls received during March 2020 vs. March 2019(2) YoY increase from April 2019 to April 2020
8 Royal Bank of Canada Annual Report 2020

Data-driven insights
Small business clients received nearly 85,000 offers fromRBC Insight Edge™—a digital solution that provides real-timemarket insights to help clients grow their businesses.
490 million+ insightsread by clients through NOMI® Insights,helping them stay on top of their finances
1.5 million+ budgets setthrough NOMI® Budgets since launch in April 2019
$349 saved on average per monthfor our clients through NOMI Find & Save®
3.8 million+ questions answeredthrough Ask NOMI—a text– and voice-based chatbot onRBC’s banking app launched in March 2020
Creating more value through our tech and data strategyWe’ve combined our trusted brand, differentiated technology platform and ability to leverage data to unlockextraordinary insights that will help our clients bring their greatest ambitions to life.
Artificial intelligence (AI) thatdelivers tangible results
Almost all of the world’s data has been created in the last fewyears(1). This growing reservoir provides our traders with reamsof actionable insights. But only if we can separate the signal fromthe noise.
RBC’s AI-based trading platform goes further by explainingoutcomes, so we can continuously monitor and elevate our ownperformance. Aiden™ also adapts to our feedback and marketexperiences while reducing manual intervention. That deliverssavings in time and money. It also enables our trading team toincrease the value they add to the investment process for thebenefit of our clients. We use innovative platforms such as Aiden™ toaugment our trading desk, and it’s a key to helping us sustain acompetitive advantage.
That said, our relationship with RBC goes deeper than technologyplatforms. Together, we are aligned in harnessing big data and AI toevolve with an ever-changing marketplace and, in turn, we’redelivering desired results for our respective clients.
Marc WyattHead of Global Trading, T. Rowe Price
In 2020 we launched Aiden™, an AI-based electronic tradingplatform. Aiden™ tackles one of the biggest challenges in thefield of AI today—applying deep reinforcement learning in aconstantly changing environment like equities trading. Aiden™
is designed to navigate the challenges of fluid and dynamicmarket conditions in real-time, without the need forcontinuous re-coding like traditional trading algorithms.
Royal Bank of Canada Annual Report 2020 9
Value beyond banking
2 million+ clientshave personalized plans through MyAdvisor®—an online servicethat helps clients create digital, dynamic plans to reach theirfinancial goals(2).
25,000+ entrepreneurs chose Ownr™
by RBC Ventures as the digital tool to register or incorporate theirbusiness(3). And with the acquisition of Founded Technologies thisyear, Ownr™ became a leading platform for entrepreneurs to startand manage their business in Canada.
Creating an ecosystem for ethical AIBorealis AI™ developed RESPECT AI™, a new online hub that bringsopen source research code, academic research, tutorials andlectures to the AI community, enabling developers to build moretrusted services and products. The program consists of publiclyavailable scientific research and research code, as well as trainingmaterial and thought leadership to help make ethical andresponsible AI available to all.
Building a secure cloudRBC and Borealis AI™ invested in an innovative AI private cloud platform in partnership with Red Hat and NVIDIA. This new platformsignificantly accelerates our ability to develop AI models, driving efficiency and leading to faster, more innovative solutions for our clients.
(1) U.S. Chamber of Commerce Foundation(2) Number of plans activated since the launch of MyAdvisor® in 2017(3) Cumulative figure since the launch of Ownr™ in November 2017

Reimagining our shared future
Transforming the employee experienceOur success comes from the over 86,000 employees who bring our vision, values and strategy to life. We’vebuilt a highly-engaged team, and our people are empowered to learn, innovate, grow, and pivot.This was exemplified in how we mobilized to meet the needs of our clients in 2020.
Switching roles to rise to the challenge
Before the pandemic changed our lives in March, I was working inour head office in Toronto, managing distribution for our TermInvestments and Savings products. If I was to describe a typicalweek back then, I was focused on ensuring RBC clients knew aboutthe services and products we have available to assist them, andsupporting our advisors.
As the spread of COVID-19 accelerated, “typical” went outthe window. Like so many people across RBC, I looked for anopportunity to step up and help our clients and my colleagues. Inmy case, this meant moving from my head office role to one withRBC Direct Investing – our online brokerage – responding to thegrowing volume of clients looking for new accounts.
Wherever we work in the bank, we know how crucial RBC is toour clients and our communities. The global pandemic, and theextraordinary changes that came with it, meant that for the manyRBCers who changed roles to help serve the increased needs of ourclients, we had to hit the ground running. This was made possible byso many people, whether it was our colleagues who trained us orthe IT team members who helped us move seamlessly from workingat our offices to working from home. Everyone truly came togetherto support our clients and each other.
The past several months gave me the opportunity to see theimpact that my colleagues and I can have firsthand. It’s beena true testament to how focused we are on helping clients,and how we’re thinking and working differently to do just that,especially during these very challenging times.
Sara KassimDirector, Control Design & RemediationCanadian Banking Operations, Toronto, Ontario
The Technology & Operations teamresponded quickly to the new working environmentcreated by COVID-19
> Over 80% employees moved to work from remotelocations in the early stages of the COVID-19 pandemic
Strong support for our employees’ health, safety and well-being
> Continued to pay eligible employees unable to work due to COVID-19
> Up to 20 days paid leave for employees unable to work from home to manage personal needs
> Special compensation program of $50/day for eligible employees working onsite during the crisis(1)
> $400 stipend towards equipment to enhance home workspace comfort and productivity foreligible employees
> Enhanced digital capabilities and resources to support client interactions, enable virtual collaborationand employee wellness
(1) Program implemented from April to June 2020
10 Royal Bank of Canada Annual Report 2020

Driving diversity and inclusionDiversity and inclusion is more than one of our core values—it’s an engine for growth, innovation andprosperity. We know our workplaces and communities are stronger when everyone feels respected andempowered, and we’re committed to driving meaningful change.
A watershed moment can drive positive change
My mother grew up during the Civil Rights Movement in Birmingham,AL. When she was 14 years old, she marched alongside Dr. MartinLuther King to help dismantle Jim Crow laws.
As a child, my mom and I would create elaborate collages for schoolpresentations during Black History Month. She shared candid storiesfrom her childhood and introduced me to inspiring leaders—peoplewho had a sense of justice and a sense of purpose. These leaderscame from diverse backgrounds, and each person contributed indifferent ways in the fight for equality.
Childhood memories and my mom’s lessons came back to meearlier this year. Tragic examples of racism triggered feelings thatare often buried deep, and became a sobering reminder that there’sa long road ahead in the fight for equity.
What I’ve learned, is that we can harness those feelings offrustration to drive change. As co-chair of RBC’s U.S. DiversityLeadership Council, I have the pleasure of working with a diversegroup of colleagues who are passionate about speaking up forinclusion, redefining inclusive leadership and advocating formarginalized communities.
D&I/ Highlights
> Since 2015, we have increased the percentage ofwomen executives from 38% to 46%(1) and thepercentage of BIPOC executives from 16% to 21%(1)(2)
> Announced a series of actions to help tacklesystemic racism in our communities, including:
• $100-million commitment in small businessloans over five years to Black entrepreneurs
• $50-million investment over the next five yearsthrough RBC Future Launch® for skillsdevelopment and mentoring programs forBIPOC youth
> Recognized as one of Canada’s Best DiversityEmployers by Mediacorp, and named to theBloomberg Gender-Equality Index for the fourthyear in a row
(1) Represents data for our businesses in Canada governed by the Employment Equity Act(2) Based on employee self-identification
This moment in our lives is not a closed chapter in ourhistory books. We need to get comfortable with having thoseuncomfortable conversations that can help us heal and grow.When we do, we will see that our hopes, dreams and ambitionsare interwoven and we all benefit from advancing a cultureof inclusion.
Natasha HolidayManaging Director, Municipal FinanceRBC Capital Markets, U.S.
Royal Bank of Canada Annual Report 2020 11

Reimagining our shared future
Taking action on sustainabilityWe believe capital can be a force for positive change, and we are motivated by the role we play in buildinga more sustainable future. We are demonstrating this in the communities we serve by supporting cleaneconomic growth and the transition to a low-carbon economy.
Making history in renewable power purchasing
Renewable energy is now cost competitive with conventionalforms of generation. The delivered cost of energy from a solarproject is about 15% of what it was 10 years ago. It is a bankable,proven technology. But, like other renewables, solar power is stillan emerging force in the transition to a much needed low-carbonworld. Enabling this transition is about leadership—the tools are atour fingertips, but adapting to a new world means changing ourways.
That’s why BluEarth Renewables was proud to partner withRBC—an organization committed to building a more sustainablefuture—on RBC’s first long-term renewable energy PowerPurchase Agreement (PPA) and one of the largest corporatePPAs in Canadian history.
Despite COVID-19 and other market disruptions, this partnershipdemonstrates that renewable energy can be cost-competitive in anopen market, and that PPAs can facilitate green investmentin Alberta.
Together with RBC, we are on the forefront in driving thischange with the purchase of power from the 39 MW Burdett &Yellow Lake solar project in the province. These solar farms areanticipated to create over 300 new construction jobs and inject$70 million into the Alberta economy. Corporate PPAs are asignificant and important part of the growth in renewables.
Leadership in renewables is about demonstrating that a transitionto a low-carbon world is not only doable, it is cost effective. RBC’spartnership with Burdett & Yellow Lake is demonstrating to others,including those who might not have thought it possible, that thistransition is actually happening and creating value at the sametime.
Grant ArnoldPresident & CEO, BluEarth Renewables
Sustainability/ Highlights
> We set new targets to reduce greenhousegas emissions by 70% and source 100%of our electricity from renewable andnon-emitting sources by 2025
> RBC GAM released its Approach to ClimateChange, highlighting its membership in ClimateAction 100+ and its commitment to conductclimate scenario analysis on investment portfolios
> 124 organizations supported with over$9 million in funding through RBC Tech forNature—a multi-year commitment by theRBC Foundation to accelerate tech-basedsustainability solutions
Learn more aboutRBC’s Climate Blueprintavailable at rbc.com/community-social-impact/environment/index.html
12 Royal Bank of Canada Annual Report 2020

Supporting and inspiring youthCOVID-19 compounded the challenges facing young people as they prepare for a dramatically changingworkforce, but it also strengthened our resolve to help them chart their path. Through programs likeRBC Future Launch®—our 10-year, $500-million commitment to support young people—we’ve reimaginedhow we can continue providing youth with opportunities to develop skills, network, gain work experience,and access mental health services.
RBC Future Launch® Scholarship helps a new Canadian put his dreams in motion
Roger Clement came to Canada as a refugee in 2016. “The costof legal services and settlement had an enormous impact onmy plans to work and study in Canada. Now, these financialconstraints have become my core motivation to start afinancial consultancy service for new immigrants,” Clementsays. His chosen learning opportunity funded with an RBCFuture Launch® Scholarship was the Canadian SecuritiesCourse certification, which will allow him to provide personalfinancial advice to newcomers.
In his home country of Pakistan, Clement graduated with the highestCumulative Grade Point Average in his school’s business departmentwhile obtaining a Bachelor in Business Sciences, Accounting andFinance. But when arriving in Canada, he faced two years ofobstacles trying to finance his education.
When asked what kept him motivated, he says, “I was happy to bein Canada, and knew help would find me. Now I want to use myexperience to pay it forward.”
Since coming to Canada, Clement has completed his Master ofBusiness, Entrepreneurship and Technology from the University ofWaterloo, and his Master of Accounting and Finance from theUniversity of Toronto Scarborough. He is currently pursuing his CPAcertification, and will write his CFE in 2021.
In times of adversity, Clement remained resilient and says,“I want to help people who have been in situations similar to myown.” Clement’s aspirations include starting a financialconsultancy service for new immigrants, helping create moreprosperous communities.
Roger ClementToronto, Ontario
Youth/ Highlights
> Learning doesn’t stop during difficult timesRBC Future Launch® at Home moved online,helping 141,000+ youth access digitalresources and programming
> 54% of RBC Future Launch® participantsidentified as Black, Indigenous or Peopleof Colour, (BIPOC), 16% higher than theCanadian population(1)
> 522,000 individuals accessed youth mental well-being programs supported by RBC Future Launch®
(1) According to research from Forum Research commissioned by RBC
Royal Bank of Canada Annual Report 2020 13

Management’s Discussion and AnalysisManagement’s Discussion and Analysis (MD&A) is provided to enable a reader to assess our results of operations and financial condition for the fiscalyear ended October 31, 2020, compared to the preceding fiscal year. This MD&A should be read in conjunction with our 2020 Annual ConsolidatedFinancial Statements and related notes and is dated December 1, 2020. All amounts are in Canadian dollars, unless otherwise specified, and are based onfinancial statements prepared in accordance with International Financial Reporting Standards (IFRS) as issued by the International AccountingStandards Board (IASB), unless otherwise noted.
Additional information about us, including our 2020 Annual Information Form, is available free of charge on our website at rbc.com/investorrelations, onthe Canadian Securities Administrators’ website at sedar.com and on the EDGAR section of the United States (U.S.) Securities and ExchangeCommission’s (SEC) website at sec.gov.
Information contained in or otherwise accessible through the websites mentioned herein does not form part of this report. All references in this report towebsites are inactive textual references and are for your information only.
Table of contents
Caution regarding forward-lookingstatements 14
Overview and outlook 15Selected financial and other highlights 15About Royal Bank of Canada 16Vision and strategic goals 16Economic, market and regulatoryreview and outlook 16Defining and measuring successthrough total shareholder returns 17
Significant developments: COVID-19 18
Financial performance 21Overview 21Impact of foreign currency translation 22Total revenue 22Provision for credit losses 23Insurance policyholder benefits, claimsand acquisition expense 23Non-interest expense 23Income and other taxes 24Client assets 24
Business segment results 26Results by business segment 26
How we measure and report ourbusiness segments 26Key performance and non-GAAPmeasures 27Personal & Commercial Banking 28Wealth Management 33Insurance 39Investor & Treasury Services 42Capital Markets 44Corporate Support 48
Quarterly financial information 48Fourth quarter performance 48Quarterly results and trend analysis 49
Financial condition 50Condensed balance sheets 50Off-balance sheet arrangements 51
Risk management 53Top and emerging risks 53Overview 56Enterprise risk management 57
Transactional/positional risk drivers 61Credit risk 61Market risk 73Liquidity and funding risk 78
Insurance risk 89
Operational/regulatory compliancerisk drivers 89Operational risk 89Regulatory compliance risk 91
Strategic risk drivers 91Strategic risk 91Reputation risk 91Legal and regulatory environment risk 92Competitive risk 93
Macroeconomic risk drivers 93Systemic risk 93
Overview of other risks 94
Capital management 96
Accounting and control matters 105Critical accounting policies andestimates 105Controls and procedures 109
Related party transactions 109
Supplementary information 109
Enhanced Disclosure Task Forcerecommendations index 117
Caution regarding forward-looking statements
From time to time, we make written or oral forward-looking statements within the meaning of certain securities laws, including the “safe harbour” provisionsof the United States Private Securities Litigation Reform Act of 1995 and any applicable Canadian securities legislation. We may make forward-lookingstatements in this 2020 Annual Report, in other filings with Canadian regulators or the SEC, in other reports to shareholders, and in other communications.Forward-looking statements in this document include, but are not limited to, statements relating to our financial performance objectives, vision and strategicgoals, the Economic, market, and regulatory review and outlook for Canadian, U.S., European and global economies, the regulatory environment in which weoperate, the Strategic priorities and Outlook sections for each of our business segments, the risk environment including our credit risk, liquidity and fundingrisk, and the potential continued impacts of the coronavirus (COVID-19) pandemic on our business operations, financial results, condition and objectives andon the global economy and financial market conditions and includes our President and Chief Executive Officer’s statements. The forward-looking informationcontained in this document is presented for the purpose of assisting the holders of our securities and financial analysts in understanding our financialposition and results of operations as at and for the periods ended on the dates presented, as well as our financial performance objectives, vision andstrategic goals, and may not be appropriate for other purposes. Forward-looking statements are typically identified by words such as “believe”, “expect”,“foresee”, “forecast”, “anticipate”, “intend”, “estimate”, “goal”, “plan” and “project” and similar expressions of future or conditional verbs such as “will”,“may”, “should”, “could” or “would”.
By their very nature, forward-looking statements require us to make assumptions and are subject to inherent risks and uncertainties, which give rise tothe possibility that our predictions, forecasts, projections, expectations or conclusions will not prove to be accurate, that our assumptions may not becorrect and that our financial performance objectives, vision and strategic goals will not be achieved. We caution readers not to place undue reliance onthese statements as a number of risk factors could cause our actual results to differ materially from the expectations expressed in such forward-lookingstatements. These factors – many of which are beyond our control and the effects of which can be difficult to predict – include: credit, market, liquidity andfunding, insurance, operational, regulatory compliance (which could lead to us being subject to various legal and regulatory proceedings, the potentialoutcome of which could include regulatory restrictions, penalties and fines), strategic, reputation, legal and regulatory environment, competitive andsystemic risks and other risks discussed in the risk sections and Significant developments: COVID-19 section of this 2020 Annual Report including businessand economic conditions, information technology and cyber risks, Canadian housing and household indebtedness, geopolitical uncertainty, privacy, dataand third-party related risks, regulatory changes, environmental and social risk (including climate change), and digital disruption and innovation, culture andconduct, the business and economic conditions in the geographic regions in which we operate, the effects of changes in government fiscal, monetary andother policies, tax risk and transparency, environmental and social risk, and the emergence of widespread health emergencies or public health crises such aspandemics and epidemics, including the COVID-19 pandemic and its impact on the global economy and financial market conditions and our businessoperations, and financial results, condition and objectives.
We caution that the foregoing list of risk factors is not exhaustive and other factors could also adversely affect our results. When relying on ourforward-looking statements to make decisions with respect to us, investors and others should carefully consider the foregoing factors and otheruncertainties and potential events. Material economic assumptions underlying the forward-looking statements contained in this 2020 Annual Report are setout in the Economic, market and regulatory review and outlook section and for each business segment under the Strategic priorities and Outlook headings.Except as required by law, we do not undertake to update any forward-looking statement, whether written or oral, that may be made from time to time by usor on our behalf.
Additional information about these and other factors can be found in the risk sections and Significant developments: COVID-19 section of this 2020 AnnualReport.
14 Royal Bank of Canada: Annual Report 2020 Management’s Discussion and Analysis

Overview and outlook
Selected financial and other highlights Table 1
(Millions of Canadian dollars, except per share, number of and percentage amounts) (1) 2020 20192020 vs. 2019
Increase (decrease)
Total revenue $ 47,181 $ 46,002 $ 1,179 2.6%Provision for credit losses (PCL) 4,351 1,864 2,487 133.4%Insurance policyholder benefits, claims and acquisition expense (PBCAE) 3,683 4,085 (402) (9.8)%Non-interest expense 24,758 24,139 619 2.6%Income before income taxes 14,389 15,914 (1,525) (9.6)%
Net income $ 11,437 $ 12,871 $ (1,434) (11.1)%
Segments – net incomePersonal & Commercial Banking $ 5,087 $ 6,402 $ (1,315) (20.5)%Wealth Management 2,155 2,550 (395) (15.5)%Insurance 831 806 25 3.1%Investor & Treasury Services 536 475 61 12.8%Capital Markets 2,776 2,666 110 4.1%Corporate Support 52 (28) 80 n.m.
Net income $ 11,437 $ 12,871 $ (1,434) (11.1)%
Selected informationEarnings per share (EPS) – basic $ 7.84 $ 8.78 $ (0.94) (10.7)%
– diluted 7.82 8.75 (0.93) (10.6)%Return on common equity (ROE) (2), (3) 14.2% 16.8% n.m. (260) bpsAverage common equity (2) $ 78,800 $ 75,000 $ 3,800 5.1%Net interest margin (NIM) – on average earning assets, net 1.55% 1.61% n.m. (6) bpsPCL on loans as a % of average net loans and acceptances 0.63% 0.31% n.m. 32 bpsPCL on performing loans as a % of average net loans and acceptances 0.39% 0.04% n.m. 35 bpsPCL on impaired loans as a % of average net loans and acceptances 0.24% 0.27% n.m. (3) bpsGross impaired loans (GIL) as a % of loans and acceptances 0.47% 0.46% n.m. 1 bpsLiquidity coverage ratio (LCR) (4) 145% 127% n.m. 1800 bps
Capital ratios and Leverage ratioCommon Equity Tier 1 (CET1) ratio 12.5% 12.1% n.m. 40 bpsTier 1 capital ratio 13.5% 13.2% n.m. 30 bpsTotal capital ratio 15.5% 15.2% n.m. 30 bpsLeverage ratio 4.8% 4.3% n.m. 50 bps
Selected balance sheet and other information (5)Total assets $1,624,548 $ 1,428,935 $195,613 13.7%Securities, net of applicable allowance 275,814 249,004 26,810 10.8%Loans, net of allowance for loan losses 660,992 618,856 42,136 6.8%Derivative related assets 113,488 101,560 11,928 11.7%Deposits 1,011,885 886,005 125,880 14.2%Common equity 80,719 77,816 2,903 3.7%Total risk-weighted assets 546,242 512,856 33,386 6.5%Assets under management (AUM) 843,600 762,300 81,300 10.7%Assets under administration (AUA) (6) 5,891,200 5,678,000 213,200 3.8%
Common share informationShares outstanding (000s) – average basic 1,423,915 1,434,779 (10,864) (0.8)%
– average diluted 1,428,770 1,440,682 (11,912) (0.8)%– end of period 1,422,473 1,430,096 (7,623) (0.5)%
Dividends declared per common share $ 4.29 $ 4.07 $ 0.22 5.4%Dividend yield (7) 4.7% 4.1% n.m. 60 bpsDividend payout ratio 55% 46% n.m. 900 bpsCommon share price (RY on TSX) (8) $ 93.16 $ 106.24 $ (13.08) (12.3)%Market capitalization (TSX) (8) 132,518 151,933 (19,415) (12.8)%
Business information (number of)Employees (full-time equivalent) (FTE) 83,842 82,801 1,041 1.3%Bank branches 1,329 1,327 2 0.2%Automated teller machines (ATMs) 4,557 4,600 (43) (0.9)%
Period average US$ equivalent of C$1.00 (9) $ 0.744 $ 0.752 $ (0.008) (1.1)%Period-end US$ equivalent of C$1.00 $ 0.751 $ 0.759 $ (0.008) (1.1)%
(1) Effective November 1, 2019, we adopted IFRS 16 Leases (IFRS 16). Results from periods prior to November 1, 2019 are reported in accordance with IAS 17 Leases (IAS 17) inthis 2020 Annual Report. For further details on the impacts of the adoption of IFRS 16 including the description of accounting policies selected, refer to Note 2 of our 2020Annual Consolidated Financial Statements.
(2) Average amounts are calculated using methods intended to approximate the average of the daily balances for the period. This includes average common equity used inthe calculation of ROE. For further details, refer to the Key performance and non-GAAP measures section.
(3) These measures may not have a standardized meaning under generally accepted accounting principles (GAAP) and may not be comparable to similar measuresdisclosed by other financial institutions. For further details, refer to the Key performance and non-GAAP measures section.
(4) LCR is the average for the three months ended for each respective period and is calculated in accordance with the Office of the Superintendent of Financial Institutions’(OSFI) Liquidity Adequacy Requirements (LAR) guidance as updated in accordance with the regulatory guidance issued in fiscal 2020. For further details, refer to theLiquidity and funding risk section.
(5) Represents year-end spot balances.(6) AUA includes $15.6 billion and $6.7 billion (2019 – $15.5 billion and $8.1 billion) of securitized residential mortgages and credit card loans, respectively.(7) Defined as dividends per common share divided by the average of the high and low share price in the relevant period.(8) Based on TSX closing market price at period-end.(9) Average amounts are calculated using month-end spot rates for the period.n.m. not meaningful
Management’s Discussion and Analysis Royal Bank of Canada: Annual Report 2020 15

About Royal Bank of Canada
Royal Bank of Canada is a global financial institution with a purpose-driven, principles-led approach to delivering leadingperformance. Our success comes from the 86,000+ employees who leverage their imaginations and insights to bring our vision,values and strategy to life so we can help our clients thrive and communities prosper. As Canada’s biggest bank, and one of thelargest in the world based on market capitalization, we have a diversified business model with a focus on innovation andproviding exceptional experiences to our 17 million clients in Canada, the U.S. and 34 other countries. Learn more at rbc.com.
Our business segments are described below.
Personal &Commercial Banking
Provides a broad suite of financial products and services in Canada, the Caribbean and the U.S.Our commitment to building and maintaining meaningful relationships with our clients isunderscored by the breadth of our products, our depth of expertise, and the features of our digitalsolutions.
WealthManagement
Serves affluent, high net worth (HNW) and ultra-high net worth (UHNW) clients from our offices inkey financial centres mainly in Canada, the U.S., the United Kingdom (U.K.), Europe, and Asia. Weoffer a comprehensive suite of investment, trust, banking, credit and other wealth managementsolutions. We also provide asset management products to institutional and individual clientsthrough our distribution channels and third-party distributors.
InsuranceOffers a wide range of life, health, home, auto, travel, wealth, annuities, and reinsurance adviceand solutions, as well as creditor services and business insurance solutions, to individual,business and group clients.
Investor & TreasuryServices
Acts as a specialist provider of asset services, a leader in Canadian cash management andtransaction banking services, and a provider of treasury services to institutional clientsworldwide.
Capital MarketsProvides expertise in banking, finance and capital markets to corporations, institutionalinvestors, asset managers, governments and central banks around the world. We serve clientsfrom 58 offices in 14 countries across North America, the U.K. & Europe, and Australia, Asia &other regions.
Corporate SupportCorporate Support consists of Technology & Operations, which provides the technological andoperational foundation required to effectively deliver products and services to our clients,Functions, which includes our finance, human resources, risk management, internal audit andother functional groups, as well as our Corporate Treasury function.
Vision and strategic goals
Our business strategies and actions are guided by our vision, “To be among the world’s most trusted and successful financialinstitutions.” Our three strategic goals are:• In Canada, to be the undisputed leader in financial services;• In the U.S., to be the preferred partner to corporate, institutional and high net worth clients and their businesses; and• In select global financial centres, to be a leading financial services partner valued for our expertise.
For our progress in 2020 against our business strategies and strategic goals, refer to the Business segment results section.
Economic, market and regulatory review and outlook – data as at December 1, 2020
The predictions and forecasts in this section are based on information and assumptions from sources we consider reliable. If thisinformation or these assumptions are not accurate, actual economic outcomes may differ materially from the outlook presentedin this section.
Economic and market review and outlookMeasures to contain the COVID-19 pandemic have sharply curtailed economic activity in many countries, resulting inunprecedented declines in GDP and a substantial increase in unemployment starting in the spring of 2020. Significant fiscal andmonetary policy stimulus has helped to support the partial recovery to date. However, a resurgence of virus spread andassociated re-imposition of containment measures to varying degrees in some regions, along with the tapering off of certainelements of fiscal support has raised further uncertainty with regards to the timing and extent of recovery. Despite recent positivetrial results, the ongoing evolution of the development and distribution of an effective vaccine also continues to raise uncertainty.
CanadaThe Canadian economy is expected to contract by 5.6% in calendar 2020 after the COVID-19 containment measures led to anunprecedented decline in economic activity in the first half of the calendar year. An easing in containment measures allowed fora sharp, but partial, rebound in activity over the summer. However, investment in the oil and gas sector fell sharply with drillingactivity continuing to run below year-ago levels in Canada. This, along with activity in the accommodation and food servicesindustries where social distancing remains more challenging, has lagged the broader recovery. The unemployment rate rose to apeak of 13.7% in May 2020 from pre-pandemic levels of under 6% and remained elevated at 8.9% as of October 2020. With theresurgence in the spread of COVID-19 in the latter part of the calendar year, the pace of recovery has slowed and there-imposition of containment measures to varying degrees in some regions remains a significant risk to the economic outlook.Exceptional government income support has helped to offset lost wage income for households and, until reduced or terminated,will continue to do so with enhanced employment insurance payments and the new Canada Recovery Benefit program. Policyrates have fallen in calendar 2020 to low levels and we expect the Bank of Canada (BoC) will maintain the overnight rate at the
16 Royal Bank of Canada: Annual Report 2020 Management’s Discussion and Analysis

current low level for an extended period, as well as continue with the existing quantitative easing (QE) programs. Low rates,government support programs and the gradual winding down of measures to combat the spread of COVID-19 are expected toultimately result in a partial recovery in the economy in 2021.
U.S.The U.S. economy is expected to contract by 3.6% in calendar 2020. All components of aggregate demand besides governmentexpenditure slumped in the second calendar quarter of 2020 amid widespread COVID-19 pandemic containment measures. Labourmarket conditions also deteriorated rapidly during the onset of the COVID-19 pandemic, with the unemployment rate hitting apeak of 14.7% in April 2020, markedly higher than February’s pre-pandemic rate of 3.5%. The initial rebound in the economy duringthe second half of the calendar year has been rapid, but partial, with the unemployment rate still well-above pre-pandemic levelsat 6.9% in October 2020. Household spending has been supported by exceptional government income transfers and policy ratecuts. While some federal income support programs expired over the summer, the Federal Reserve (Fed) has committed tomaintaining extraordinary policy support until the economic slack is fully absorbed and the labour market has recovered. Movingforward we expect a more gradual recovery, and forecast real GDP will partially retrace the 2020 decline in calendar 2021.
EuropeEuro area GDP is expected to contract by 7.2% in calendar 2020, with divergence in country performance across the trading bloc.Similar to many other central banks, the European Central Bank (ECB) has held interest rates low and announced additionalstimulus measures to combat the impact from the COVID-19 pandemic, including expanding its QE programs. The Bank of England(BoE) also responded to the COVID-19 pandemic with lower interest rates and expanding their QE programs. GDP in the U.K. isexpected to decline by 11.5% in calendar 2020. A resurgence in the spread of COVID-19 in the fourth calendar quarter 2020, alongsidethe re-imposition of containment measures to varying degrees in some regions, is expected to limit the pace of recovery both in theU.K. and the Euro area after unprecedented declines over the first half of 2020. Uncertainty about Brexit will further weigh on growthin the U.K. In calendar 2021, GDP growth for both the Euro area and the U.K. is expected to rebound at a relatively modest pace.
Financial marketsGovernment bond yields remain at historically low levels due to subdued inflation and expectations that monetary policy willremain accommodative for an extended period. Monetary policy stimulus and massive government income support have beensupporting equity markets broadly throughout the COVID-19 pandemic, with major indexes posting a full rebound topre-pandemic levels in August 2020. Recent announcements of positive vaccine trial results have further boosted marketsentiment. Oil prices have rebounded somewhat after falling sharply in the spring alongside a price war between Russia andSaudi Arabia and virus containment measures that weighed heavily on demand. We continue to look for a gradual recovery in oilprices in 2021, as demand continues to bounce back.
Regulatory environmentWe continue to monitor and prepare for regulatory developments and changes in a manner that seeks to ensure compliance withnew requirements, while mitigating adverse business or financial impacts. Such impacts could result from new or amended lawsor regulations and the expectations of those who enforce them. A high level summary of the key regulatory changes that have thepotential to increase or decrease our costs and the complexity of our operations is included in the Legal and regulatoryenvironment risk section of this 2020 Annual Report. A summary of the additional regulatory changes instituted by governmentsglobally and by OSFI during calendar 2020 in response to the COVID-19 pandemic are included in the Significant developments:COVID-19, Liquidity and funding risk and Capital management sections of this 2020 Annual Report.
For a discussion on risk factors resulting from these and other developments which may affect our business and financialresults, refer to the risk sections of this 2020 Annual Report. For further details on our framework and activities to manage risks,refer to the Significant developments: COVID-19, risk and Capital management sections of this 2020 Annual Report.
Defining and measuring success through total shareholder returns
Our focus is to maximize total shareholder returns (TSR) through the achievement of top half performance compared to ourglobal peer group over the medium-term (3-5 years), which we believe reflects a longer-term view of strong and consistentfinancial performance.
Maximizing TSR is aligned with our three strategic goals discussed earlier and we believe represents the most appropriatemeasure of shareholder value creation. TSR is a concept used to compare the performance of our common shares over a periodof time, reflecting share price appreciation and dividends paid to common shareholders. The absolute size of TSR will varydepending on market conditions, and the bank’s position reflects the market’s perception over a period of time of our overallperformance relative to our peers.
Financial performance objectives are used to measure our performance against our medium-term TSR objectives and areused as goals as we execute against our strategic priorities. We review and revise these financial performance objectives aseconomic, market and regulatory environments change.
The following table provides a summary of our 3-year and 5-year performance against our medium-term financialperformance objectives:
Financial performance compared to our medium-term objectives Table 2
Medium-term objectives (1) 3-year (2) 5-year (2)
Diluted EPS growth of 7% + 1% 3%ROE of 16% + 16.2% 16.4%Strong capital ratio (CET1) (3) 12.0% 11.6%Dividend payout ratio 40% – 50% 49% 48%
(1) A medium-term (3-5 year) objective is considered to be achieved when the performance goal is met in either a 3- or 5-year period. These objectives assume a normalbusiness environment and our ability to achieve them in a period may be adversely affected by extraordinary developments such as the COVID-19 pandemic and thecurrent low interest rate environment.
(2) Diluted EPS growth is calculated using a Compound Annual Growth Rate (CAGR). ROE, CET1 and dividend payout ratio are calculated using an average.(3) For further details on the CET1 ratio, refer to the Capital Management section.
Management’s Discussion and Analysis Royal Bank of Canada: Annual Report 2020 17

Our 3-year and 5-year medium-term financial performance objectives will remain unchanged in fiscal 2021.
We compare our TSR to that of a global peer group approved by our Board of Directors (the Board). The global peer groupconsists of the following 9 financial institutions:• Canadian financial institutions: Bank of Montreal, Canadian Imperial Bank of Commerce, Manulife Financial Corporation,
National Bank of Canada, The Bank of Nova Scotia, and Toronto-Dominion Bank.• U.S. banks: JPMorgan Chase & Co. and Wells Fargo & Company.• International banks: Westpac Banking Corporation.
Medium-term objectives – 3- and 5-year TSR vs. peer group average (1) Table 3
3-year TSR (2) 5-year TSR (2)
Royal Bank of Canada 1% 9%Top half Top half
Peer group average (excluding RBC) (6)% 3%
(1) In fiscal 2020, Power Financial Corporation was removed from the global peer group.(2) The 3- and 5-year annualized TSR are calculated based on our common share price appreciation as per the TSX closing market price plus reinvested dividends for the
period October 31, 2017 to October 31, 2020 and October 31, 2015 to October 31, 2020.
Common share and dividend information Table 4
For the year ended October 31 2020 2019 2018 2017 2016
Common share price (RY on TSX) – close, end of period $ 93.16 $ 106.24 $ 95.92 $ 100.87 $ 83.80Dividends paid per share 4.26 4.00 3.70 3.40 3.20Increase (decrease) in share price (12.3)% 10.8% (4.9)% 20.4% 12.1%Total shareholder return (8.4)% 15.2% (1.0)% 25.0% 16.8%
Significant developments: COVID-19
On March 11, 2020, the World Health Organization declared the outbreak of a strain of novel coronavirus disease, COVID-19, aglobal pandemic. The breadth and depth of the impact of the COVID-19 pandemic on the global economy and financial marketshas continued to evolve with disruptive effects in countries in which we operate and beyond, while also contributing to increasedmarket volatility and changes to the macroeconomic environment. In addition, the COVID-19 pandemic has continued to affectour employees, some of our clients and communities, with resultant impacts on our operations, financial results and present andfuture risks to our business. For further details on these risks, refer to the Impact of pandemic risk factor and risk sections of this2020 Annual Report.
Measures to contain the spread of COVID-19, including business closures, social distancing protocols, travel restrictions,school closures, quarantines, and restrictions on gatherings and events, have been and continue to be widespread. Althoughstaged and full reopening plans vary and are fluid across some regions, these measures are continuing to have extensiveimplications for the global economy, including the pace and magnitude of recovery, as well as on related market functions,unemployment rates, and fiscal and monetary policies. The easing of containment measures and reopening plans have beenaccompanied by a resurgence in the spread of COVID-19 in some regions, resulting in the re-imposition of restrictions in somecases. All of these factors are contributing to the uncertainty about the timing of a full recovery. Despite recent positive trialresults, the ongoing evolution of the development and distribution of an effective vaccine also continues to raise uncertainty. TheCOVID-19 pandemic, the containment measures and the phased reopening approach taken in several regions could have longer-term effects on economic and commercial activity and consumer behaviour after the COVID-19 pandemic recedes andcontainment measures are fully lifted. In conjunction with the COVID-19 pandemic containment measures, governments,regulatory bodies, central banks and private organizations around the globe have continued to provide unprecedented reliefprograms and temporary measures to facilitate the continued operation of the global economy and financial system, all of whichare intended to provide support to individuals and businesses. Commencing in the second quarter of 2020, regulatory guidancefrom the Government of Canada and OSFI were implemented to facilitate the continued strength of the Canadian financialsystems, including the expansion of existing facilities, the introduction of new funding programs and capital modifications tosupport the programs implemented in response to the COVID-19 pandemic. In addition, the BoC, the Fed and other central bankstook further steps to stimulate the economy through reductions in benchmark interest rates. Some of these programs remain inplace or have continued to be developed in an effort to support the overall economy. Governments and federal agencies haveassessed and will continue to assess the need for these programs. Despite these measures and programs, the extent andduration of the impact of COVID-19 continues to be uncertain.
For further details on these measures and their impact on us, refer to Impact of pandemic risk factor and Relief programsections outlined below as well as the risk and Capital management sections of this 2020 Annual Report.
In addition to the broad impacts of the COVID-19 pandemic on our employees, clients, communities and operations, the COVID-19pandemic has continued to impact financial results across all of our business segments to varying degrees. The impact on ourconsolidated results has been primarily reflected in higher PCL and changes due to the impact of market volatility, includingmovements in Other comprehensive income. Results across all of our business segments have also been and continue to beimpacted by downstream implications from the changes in the macroeconomic environment, including lower interest rates,modest consumer spending relative to pre-pandemic levels, fluctuations in credit spreads, as well as other impacts includingincreased client-driven volumes and changes in operating costs. Notwithstanding these challenges, our financial results andcondition amid these challenges demonstrate the resilience of our capital and liquidity positions, which have been bolstered byour position of strength at the time of entering this crisis and throughout the year.
18 Royal Bank of Canada: Annual Report 2020 Management’s Discussion and Analysis

Given the uncertainty of the extent and duration of the COVID-19 pandemic and its impacts on the economy and society as awhole, as well as the timeline of the transition to a fully reopened economy, the future impact on our businesses and ourfinancial results and condition remains uncertain. Despite recent positive trial results, the ongoing evolution of the developmentand distribution of an effective vaccine also continues to raise uncertainty.
Commencing in the second quarter of 2020, in response to the COVID-19 pandemic, we instituted various measures and programsto protect and support our employees, clients and communities, while also striving to ensure continued customer service to ourclients. We have and will continue to review the effectiveness of these measures and programs and adapt them accordingly.
Impact of pandemic risk factorPandemics, epidemics or outbreaks of an infectious disease in Canada or worldwide could have an adverse impact on ourbusiness, including changes to the way we operate, and on our financial results and condition. The spread of the COVID-19pandemic, given its severity and scale, continues to adversely affect our business to varying degrees, some of our clients andalso continues to pose risks to the global economy. At the onset of the COVID-19 pandemic, governments and regulatory bodies inaffected areas imposed a number of measures designed to contain the COVID-19 pandemic, including widespread businessclosures, social distancing protocols, travel restrictions, school closures, quarantines, and restrictions on gatherings and events.While a number of containment measures have been and continue to be gradually eased or lifted across some regions, additionalsafety precautions and operating protocols aimed at containing the spread of COVID-19 have been and continue to be instituted.In addition, the emergence of a second wave of the COVID-19 pandemic has led to the the re-imposition of containment measuresto varying degrees in some regions. As a result, containment measures continue to impact global economic activity, including thepace and magnitude of recovery as well as contributing to increased market volatility and changes to the macroeconomicenvironment. As the impacts of the COVID-19 pandemic continue to materialize, the prolonged effects of the disruption have hadand continue to have adverse impacts on our business strategies and initiatives, resulting in ongoing effects to our financialresults, including the realization of credit, market or operational risk losses.
Governments, monetary authorities, regulators and financial institutions, including us, have taken and continue to takeactions in support of the economy and financial system. These actions include fiscal, monetary and other financial measures toincrease liquidity, and provide financial aid to individual, small business, commercial and corporate clients. Additionally,regulatory relief measures in support of financial institutions have also been provided. For more information on these programs,refer to the Relief programs, Liquidity and funding risk and Capital management sections.
We are closely monitoring the potential continued effects and impacts of the COVID-19 pandemic, which continues to be arapidly evolving situation. Uncertainty remains as to the full impacts of the COVID-19 pandemic on the global economy, financialmarkets, and us, including on our financial results, regulatory capital and liquidity ratios and ability to meet regulatory and otherrequirements. The ultimate impacts will depend on future developments that are highly uncertain and cannot be predicted,including the scope, severity, duration and additional subsequent waves of the COVID-19 pandemic, as well as the effectivenessof actions and measures taken by government, monetary and regulatory authorities and other third parties. Despite recentpositive trial results, the ongoing evolution of the development and distribution of an effective vaccine also continues to raiseuncertainty. With respect to client relief programs, we may face challenges, including increased risk of client disputes, litigation,government and regulatory scrutiny as a result of the effects of the COVID-19 pandemic on market and economic conditions andactions government authorities take in response to those conditions. We may also face increased operational and reputationalrisk and financial losses, including higher credit losses amongst other things, depending on the effectiveness of these client reliefprograms for our individual, small business, commercial and corporate clients. The effectiveness of these programs will dependon the duration and scale of the COVID-19 pandemic and will differ by region and industry, with varying degrees of benefit to ourclients.
The COVID-19 pandemic has and may continue to result in disruptions to some of our clients and the way in which we conduct ourbusiness, including the closure of certain branches, prolonged duration of staff working from home, and changes to ouroperations due to higher volumes of client requests, as well as disruptions to key suppliers of our goods and services. Thesefactors have adversely impacted, and may continue to adversely impact, our business operations and the quality and continuityof service to clients. To date, we have taken proactive measures through our business continuity plans to adapt to the ongoingwork from home arrangements, carefully planning the return to premise for some of our employees, and our crisis managementteams have increased their efforts to preserve the well-being of our employees and our ability to serve clients. Additionally,various temporary relief programs beyond the available government programs were launched to further support our clients infinancial need. For more information on our relief programs, refer to the Relief programs section below.
In addition to the impact that the COVID-19 pandemic has had and continues to have on our business, it may also continue toincrease financial stress on some of our clients. This, in conjunction with operational constraints due to the impacts of socialdistancing, including but not limited to full closures or reduced operating hours, lost sales opportunities and/or increasedoperating costs, could lead to increased pressure on some of our individual clients as well as on the financial performance onsome of our small business, commercial and corporate clients, which could result in higher than expected credit losses for us.
If the COVID-19 pandemic is prolonged, including the possibility of additional subsequent waves, or further diseases emergethat give rise to similar effects, the adverse impact on the economy could deepen and result in further volatility and declines infinancial markets. Moreover, it remains uncertain how the macroeconomic environment, and societal and business norms will beimpacted following this COVID-19 pandemic. Unexpected developments in financial markets, regulatory environments, orconsumer behaviour and confidence may also have adverse impacts on our financial results and condition, business operationsand reputation, for a substantial period of time.
In virtually all aspects of our operations, our view of risks is not static as our business activities expose us to a wide variety ofrisks. Consistent with our Enterprise Risk Management Framework (ERMF), we actively manage our risks to help protect andenable our businesses. Additionally, we continue to evaluate the impacts that the COVID-19 pandemic has had and continues tohave on our business, including the impact on our top and emerging risks, operational and reputational risks as well as credit,market and liquidity and funding risks. For further details on our Top and emerging and Operational risks, refer to the risksections in this 2020 Annual Report.
Management’s Discussion and Analysis Royal Bank of Canada: Annual Report 2020 19

Relief programsIn response to the COVID-19 pandemic, several government programs have been and continue to be developed to providefinancial aid to individuals and businesses, which include wage replacement for individuals, wage subsidies and rent relief forbusinesses, and lending programs for businesses, which we are administering for our clients. To further support our clients infinancial need, various temporary relief programs were launched beyond the available government programs.
RBC relief programsDuring the second quarter of 2020, we announced the RBC Client Relief program which aimed to provide immediate and long-term relief for clients impacted by the COVID-19 pandemic. Through this program, we helped our clients by implementing variousrelief measures, including payment deferrals, reduced credit card charges and refinancing or credit restructuring, fee waiversand temporary limit increases across various retail, small business and commercial products. The RBC Client Relief program forthe majority of our commercial and small business clients closed on June 30, 2020 and loan deferrals within the program closedfor retail clients on September 30, 2020; clients who were already participating in this program may have payment deferrals orother relief that extends past these dates. As the RBC Client Relief programs gradually come to an end, we have assessed and willcontinue to assess the needs of each individual client and continue to provide support to clients on a case by case basis.
As at October 31, 2020, more than 51,500 clients (July 31, 2020 – 278,400 clients) globally are benefitting from our payment deferralprogram, including clients that have continued to make payments, and the following table summarizes the number of loans andtheir associated gross carrying amounts outstanding.
Table 5
As at
October 31
2020July 31
2020
(Millions of Canadian dollars, except number of loan amounts) Number of loans
Gross carryingamount of
loans outstanding Number of loans
Gross carryingamount of
loans outstanding
Residential mortgages 22,300 $ 6,829 138,827 $ 41,270Personal 16,291 712 74,115 2,592Credit cards 14,864 172 96,542 1,012Small business 984 138 8,465 1,134Wholesale 4,682 2,618 26,592 16,810
Total 59,121 $ 10,469 344,541 $ 62,818
For further details, refer to Notes 2 and 5 of our 2020 Annual Consolidated Financial Statements.
Government programs in response to the COVID-19 pandemic
Government of CanadaCommencing in the second quarter of 2020, the Department of Finance Canada announced new programs and revisions toexisting programs to help support the functioning of markets and finance businesses while ensuring the financial sector remainssound, well-capitalized and resilient, in light of the impact of the COVID-19 pandemic. To support businesses experiencing cashflow challenges during this unprecedented time, the Canadian Federal government established the following significantprograms in which Canadian financial institutions are assisting with financial relief:• The Canada Emergency Business Account (CEBA) – Under this program, Canadian banks are able to facilitate interest-free
loans of up to $60,000 to existing eligible small business clients as a source of liquidity for immediate operating costs. Theloans are funded by the Government of Canada, with the Canadian banks retaining no credit risk. The application deadlinefor the CEBA program has been extended to December 31, 2020.
• The Business Credit Availability Program (BCAP) – This program is comprised of the Export Development Canada (EDC) BCAPGuarantee and the Business Development Bank of Canada (BDC) Co-Lending Program.• EDC BCAP Guarantee – Under this program, Canadian banks are able to provide existing eligible mid-sized and large
business clients, focused on both export oriented and domestic sales-based businesses, with loans of up to $6.25 millionto support short-term liquidity needs. These loans must be used for certain operating costs and are 80% guaranteed bythe EDC. The application deadline for the EDC BCAP Guarantee program has been extended to June 30, 2021.
• BDC Co-Lending Program – Under this program, the BDC and Canadian banks jointly provide loans, which are fundedbased on an 80%/20% split, respectively, to eligible business clients of up to $6.25 million to meet their operational andliquidity needs. The maximum loan varies by the size of the business and may be structured with an interest-onlypayment obligation for the first year. The application deadline for the BDC Co-Lending program has been extended toJune 30, 2021.
• BDC Mid-Market Financing Program – Under this program, the BDC and Canadian banks provide loans, which are fundedbased on a 90%/10% split, respectively, to eligible mid-sized business clients ranging between $12.5 million and$60 million to meet their operational and liquidity needs. The application deadline for the BDC Mid-Market Financingprogram is June 30, 2021.
• EDC Mid-Market Guarantee and Financing Program – Under this program, Canadian banks are able to provide existingeligible mid-sized and large business clients, focused on both export oriented and domestic sales-based businesses,with loans ranging from $12.5 million to a maximum of $80 million for terms up to 5 years, to support their liquidityneeds. These loans must be used for certain operating costs and are 75% guaranteed by the EDC. The applicationdeadline for the EDC Mid-Market Guarantee and Financing Program is June 30, 2021.
As at October 31, 2020, we have facilitated the administration of relief to more than 174,200 clients (July 31, 2020 – 158,100) whohave enrolled in these programs, with a corresponding total of $7.1 billion (July 31, 2020 – $6.4 billion), of which $5.7 billion (July 31,2020 – $4.2 billion) was funded. For further details, refer to Note 6 of our 2020 Annual Consolidated Financial Statements.
20 Royal Bank of Canada: Annual Report 2020 Management’s Discussion and Analysis

In addition to these significant programs, the Government of Canada and other governing bodies have provided guidance inother areas including but not limited to the extension of regulatory and tax filings, none of which are considered material for us.
U.S. GovernmentOn March 27, 2020, the Coronavirus Aid, Relief and Economic Security (CARES) Act was signed into law, which is in addition toother programs that were enacted by the U.S. Federal Government. As part of the CARES Act, the Paycheck Protection Program(PPP) offers small businesses with loans, guaranteed by the U.S. Federal Government, to support the payment of payroll costs,interest on mortgages, rent, and utilities. Through this program, we have provided loans directly to our clients based on theirassessment of certain eligibility requirements and failure to meet these requirements will result in recourse actions for theborrower. In some cases, the U.S. Small Business Administration may forgive all or a portion of the loan. On June 5, 2020, thePaycheck Protection Program Flexibility Act of 2020 (Flexibility Act) was signed into law, which amends the CARES Act and isintended to provide additional relief from the original terms of the PPP, including but not limited to, the extension of the periodavailable for support payments from 8 to 24 weeks after PPP loan origination, the extension of the maturity of PPP loans grantedfrom two to five years and the modification of eligibility requirements. Applications for the PPP closed on August 8, 2020. As atOctober 31, 2020, we have provided $5,776 million (US$4,336 million) of funding to 15,888 clients through these programs. As atJuly 31, 2020, we provided $5,804 million (US$4,334 million) of funding to 15,533 clients through these programs.
Separately, the U.S. Department of the Treasury provided guidance deferring due dates for various tax returns, other tax filingsand tax payments, none of which are considered material for us.
Programs in support of liquidity and fundingCommencing in the second quarter of 2020, governments and federal agencies expanded the eligibility criteria to their existingfunding programs and announced new programs to provide further liquidity to banks as well as providing additional sources toaccess funding with which we can support our clients during this time of uncertainty, including:• Existing funding programs – The BoC increased funding available and broadened eligibility requirements for existing term
repo facilities and the revised insured mortgage purchase programs through the Canada Mortgage and Housing Corporation(CMHC). These programs also include central banks’ programs in other jurisdictions, such as the BoE’s U.S. dollar swapfacility.
• New funding programs – The BoC added the Banker’s Acceptance Purchase Facility and the Standing Term Liquidity Facility.Additionally, the Fed introduced the Primary Dealer Credit Facility.
Governments and federal agencies have assessed and will continue to assess the need for these programs. Effective October 21,2020, certain programs, such as the Bankers’ Acceptance Purchase Facility and the revised insured mortgage purchase programthrough the CMHC were discontinued and the existing term repo facilities will be reduced to pre-pandemic levels over time.
For further details on how we are managing our liquidity and funding profile, refer to the Liquidity and funding risk section ofthis 2020 Annual Report.
In order to support all of the aforementioned programs, central banks and domestic and global regulators have providedguidance on regulatory capital, liquidity and reporting requirements. For a discussion on these initiatives, refer to the Liquidityand funding risk and Capital management sections of this 2020 Annual Report. We will continue to monitor announcements by us,governments and federal agencies, as applicable.
Financial performance
Overview
2020 vs. 2019Net income of $11,437 million decreased $1,434 million or 11% from a year ago. Diluted EPS of $7.82 was down $0.93 or 11% and ROEof 14.2% was down 260 bps. Our Common Equity Tier 1 (CET1) ratio was 12.5%, up 40 bps from a year ago.
Our results reflected lower earnings in Personal & Commercial Banking and Wealth Management, partially offset by strongearnings in Capital Markets as well as higher results in Corporate Support, Investor & Treasury Services, and Insurance.
Personal & Commercial Banking earnings decreased mainly due to higher PCL, primarily attributable to the impact of theCOVID-19 pandemic on performing loans and lower spreads. The net increase in costs associated with the COVID-19 pandemic,including additional staff-related costs also contributed to the decrease. These factors were partially offset by average volumegrowth of 10% in Canadian Banking.
Wealth Management results decreased primarily due to a gain in the prior year on the sale of the private debt business ofBlueBay, a decline in net interest income and higher staff-related costs. Lower income from sweep deposits also contributed tothe decrease. These factors were partially offset by an increase in earnings from higher average fee-based client assets, net ofthe associated variable compensation.
Capital Markets results were up driven by higher revenue in Global Markets and Corporate and Investment Banking. Thesefactors were partially offset by higher PCL, higher taxes due to an increase in the proportion of earnings from higher tax ratejurisdictions, lower Other revenue mainly reflecting higher residual funding costs, as well as higher compensation on improvedresults.
Corporate Support net income was $52 million, largely due to asset/liability management activities, partially offset by netunfavourable tax adjustments and residual unallocated costs. Net loss in the prior year was $28 million, largely due to the impactof an unfavourable accounting adjustment, residual unallocated costs and unfavourable tax impacts, partially offset by asset/liability management activities.
Investor & Treasury Services results increased as the prior year included severance and related costs associated with therepositioning of the business. The repositioning of the business combined with the impact of ongoing efficiency initiatives alsoresulted in lower staff-related costs in the current year. These factors were partially offset by lower client deposit revenue.
Insurance earnings were up, largely due to higher favourable investment-related experience, partially offset by unfavourableannual actuarial assumption updates.
For further details on our business segment results and CET1 ratio, refer to the Business segment results and Capitalmanagement sections, respectively.
Management’s Discussion and Analysis Royal Bank of Canada: Annual Report 2020 21
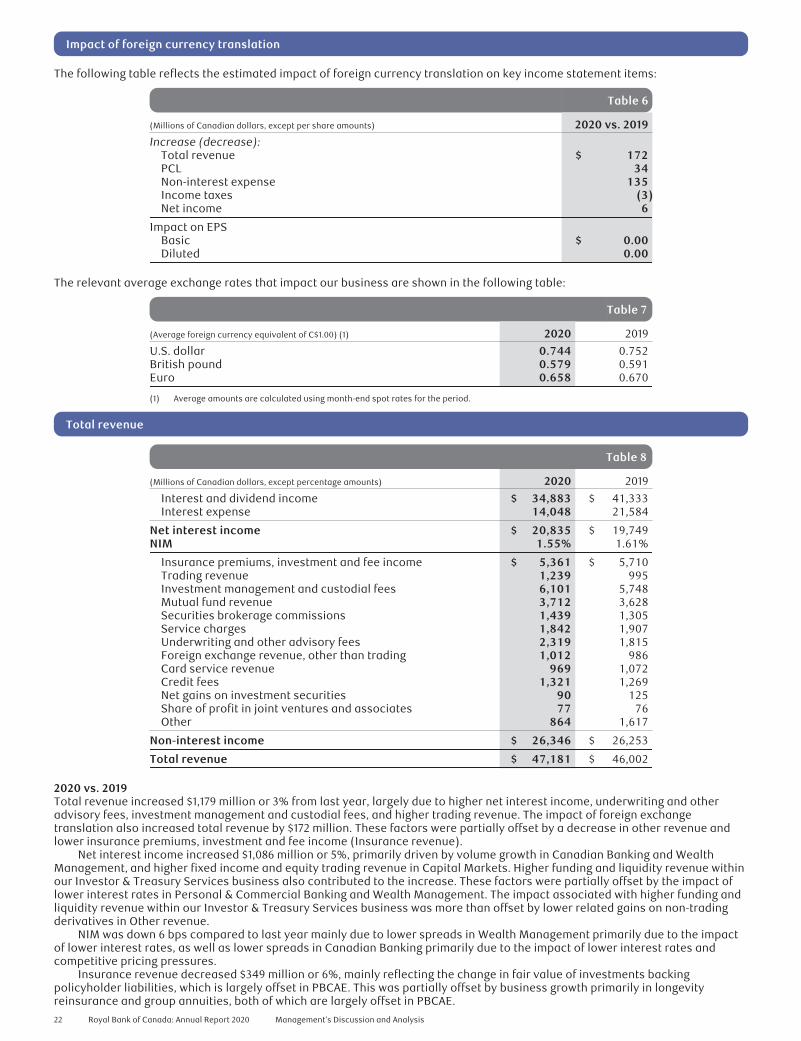
Impact of foreign currency translation
The following table reflects the estimated impact of foreign currency translation on key income statement items:
Table 6
(Millions of Canadian dollars, except per share amounts) 2020 vs. 2019Increase (decrease):
Total revenue $ 172PCL 34Non-interest expense 135Income taxes (3)Net income 6
Impact on EPSBasic $ 0.00Diluted 0.00
The relevant average exchange rates that impact our business are shown in the following table:
Table 7
(Average foreign currency equivalent of C$1.00) (1) 2020 2019
U.S. dollar 0.744 0.752British pound 0.579 0.591Euro 0.658 0.670
(1) Average amounts are calculated using month-end spot rates for the period.
Total revenue
Table 8
(Millions of Canadian dollars, except percentage amounts) 2020 2019
Interest and dividend income $ 34,883 $ 41,333Interest expense 14,048 21,584
Net interest income $ 20,835 $ 19,749NIM 1.55% 1.61%
Insurance premiums, investment and fee income $ 5,361 $ 5,710Trading revenue 1,239 995Investment management and custodial fees 6,101 5,748Mutual fund revenue 3,712 3,628Securities brokerage commissions 1,439 1,305Service charges 1,842 1,907Underwriting and other advisory fees 2,319 1,815Foreign exchange revenue, other than trading 1,012 986Card service revenue 969 1,072Credit fees 1,321 1,269Net gains on investment securities 90 125Share of profit in joint ventures and associates 77 76Other 864 1,617
Non-interest income $ 26,346 $ 26,253
Total revenue $ 47,181 $ 46,002
2020 vs. 2019Total revenue increased $1,179 million or 3% from last year, largely due to higher net interest income, underwriting and otheradvisory fees, investment management and custodial fees, and higher trading revenue. The impact of foreign exchangetranslation also increased total revenue by $172 million. These factors were partially offset by a decrease in other revenue andlower insurance premiums, investment and fee income (Insurance revenue).
Net interest income increased $1,086 million or 5%, primarily driven by volume growth in Canadian Banking and WealthManagement, and higher fixed income and equity trading revenue in Capital Markets. Higher funding and liquidity revenue withinour Investor & Treasury Services business also contributed to the increase. These factors were partially offset by the impact oflower interest rates in Personal & Commercial Banking and Wealth Management. The impact associated with higher funding andliquidity revenue within our Investor & Treasury Services business was more than offset by lower related gains on non-tradingderivatives in Other revenue.
NIM was down 6 bps compared to last year mainly due to lower spreads in Wealth Management primarily due to the impactof lower interest rates, as well as lower spreads in Canadian Banking primarily due to the impact of lower interest rates andcompetitive pricing pressures.
Insurance revenue decreased $349 million or 6%, mainly reflecting the change in fair value of investments backingpolicyholder liabilities, which is largely offset in PBCAE. This was partially offset by business growth primarily in longevityreinsurance and group annuities, both of which are largely offset in PBCAE.
22 Royal Bank of Canada: Annual Report 2020 Management’s Discussion and Analysis

Trading revenue increased $244 million or 25%, mainly due to higher fixed income trading in Europe, higher commoditiestrading in Canada, and higher equity trading in the U.S. and Europe. These factors were partially offset by lower equity trading inCanada and lower fixed income trading in the U.S.
Investment management and custodial fees increased $353 million or 6%, largely driven by higher average fee-based clientassets reflecting net sales and market appreciation, partially offset by the impact of a favourable accounting adjustment inCanadian Wealth Management in the prior year.
Underwriting and other advisory fees increased $504 million or 28%, mainly due to higher debt and equity origination acrossmost regions.
Other revenue decreased $753 million or 47%, primarily reflecting lower gains on non-trading derivatives in our Investor &Treasury Services business, which were largely offset in Net interest income. A gain on the sale of the private debt business ofBlueBay of $151 million in the prior year and lower income from cash sweep deposits, also contributed to the decrease. Thesefactors were partially offset by the favourable impact of economic hedges.
Additional trading Information
Table 9
(Millions of Canadian dollars) 2020 2019
Net interest income $ 3,459 $ 2,266Non-interest income 1,239 995
Total trading revenue $ 4,698 $ 3,261
Total trading revenue by productInterest rate and credit $ 2,838 $ 1,664Equities 1,234 1,037Foreign exchange and commodities 626 560
Total trading revenue $ 4,698 $ 3,261
2020 vs. 2019Total trading revenue of $4,698 million, which is comprised of trading-related revenue recorded in Net interest income andNon-interest income, increased $1,437 million or 44% from last year, mainly due to higher fixed income trading across all regionsand higher equity trading mainly in the U.S.
Provision for credit losses
2020 vs. 2019Total PCL increased $2,487 million from the prior year.
PCL on loans increased $2,340 million or 124% from the prior year, reflecting higher provisions primarily in Personal &Commercial Banking, Capital Markets and Wealth Management due to the impact of the COVID-19 pandemic. The PCL on loansratio increased 32 bps.
For further details on PCL, refer to Credit quality performance in the Credit risk section.
Insurance policyholder benefits, claims and acquisition expense (PBCAE)
2020 vs. 2019PBCAE of $3,683 million decreased $402 million or 10% from the prior year, mainly reflecting the change in fair value ofinvestments backing policyholder liabilities, which was largely offset in revenue, and higher favourable investment-relatedexperience. These factors were partially offset by business growth, which was largely offset in revenue, and unfavourable annualactuarial assumption updates in the current year, largely related to mortality experience.
Non-interest expense
Table 10
(Millions of Canadian dollars, except percentage amounts) 2020 2019
Salaries $ 6,758 $ 6,600Variable compensation 6,040 5,706Benefits and retention compensation 1,994 1,876Share-based compensation 460 418
Human resources $ 15,252 $ 14,600Equipment 1,907 1,777Occupancy 1,660 1,635Communications 989 1,090Professional fees 1,330 1,305Amortization of other intangibles 1,273 1,197Other 2,347 2,535
Non-interest expense $ 24,758 $ 24,139Efficiency ratio (1) 52.5% 52.5%Efficiency ratio adjusted (2) 52.8% 53.6%
(1) Efficiency ratio is calculated as Non-interest expense divided by Total revenue.(2) Measures have been adjusted by excluding the change in fair value of investments backing policyholder liabilities. These
are non-GAAP measures. For further details, refer to the Key performance and non-GAAP measures section.
Management’s Discussion and Analysis Royal Bank of Canada: Annual Report 2020 23
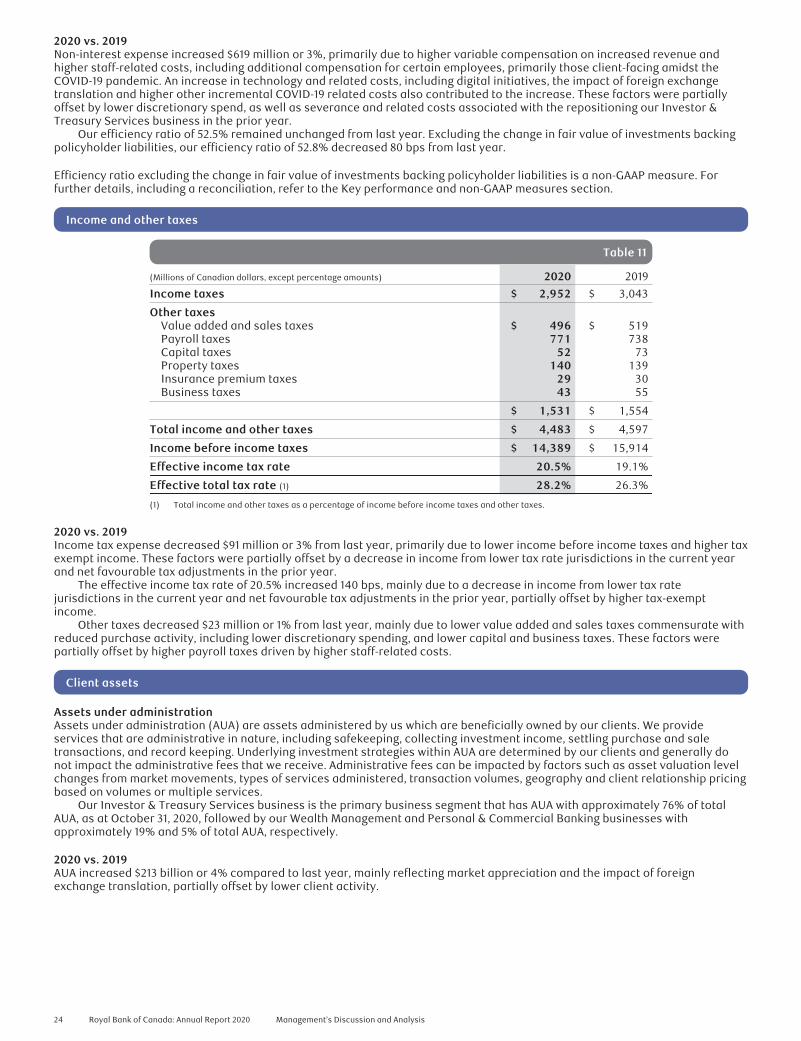
2020 vs. 2019Non-interest expense increased $619 million or 3%, primarily due to higher variable compensation on increased revenue andhigher staff-related costs, including additional compensation for certain employees, primarily those client-facing amidst theCOVID-19 pandemic. An increase in technology and related costs, including digital initiatives, the impact of foreign exchangetranslation and higher other incremental COVID-19 related costs also contributed to the increase. These factors were partiallyoffset by lower discretionary spend, as well as severance and related costs associated with the repositioning our Investor &Treasury Services business in the prior year.
Our efficiency ratio of 52.5% remained unchanged from last year. Excluding the change in fair value of investments backingpolicyholder liabilities, our efficiency ratio of 52.8% decreased 80 bps from last year.
Efficiency ratio excluding the change in fair value of investments backing policyholder liabilities is a non-GAAP measure. Forfurther details, including a reconciliation, refer to the Key performance and non-GAAP measures section.
Income and other taxes
Table 11
(Millions of Canadian dollars, except percentage amounts) 2020 2019
Income taxes $ 2,952 $ 3,043
Other taxesValue added and sales taxes $ 496 $ 519Payroll taxes 771 738Capital taxes 52 73Property taxes 140 139Insurance premium taxes 29 30Business taxes 43 55
$ 1,531 $ 1,554
Total income and other taxes $ 4,483 $ 4,597
Income before income taxes $ 14,389 $ 15,914
Effective income tax rate 20.5% 19.1%
Effective total tax rate (1) 28.2% 26.3%
(1) Total income and other taxes as a percentage of income before income taxes and other taxes.
2020 vs. 2019Income tax expense decreased $91 million or 3% from last year, primarily due to lower income before income taxes and higher taxexempt income. These factors were partially offset by a decrease in income from lower tax rate jurisdictions in the current yearand net favourable tax adjustments in the prior year.
The effective income tax rate of 20.5% increased 140 bps, mainly due to a decrease in income from lower tax ratejurisdictions in the current year and net favourable tax adjustments in the prior year, partially offset by higher tax-exemptincome.
Other taxes decreased $23 million or 1% from last year, mainly due to lower value added and sales taxes commensurate withreduced purchase activity, including lower discretionary spending, and lower capital and business taxes. These factors werepartially offset by higher payroll taxes driven by higher staff-related costs.
Client assets
Assets under administrationAssets under administration (AUA) are assets administered by us which are beneficially owned by our clients. We provideservices that are administrative in nature, including safekeeping, collecting investment income, settling purchase and saletransactions, and record keeping. Underlying investment strategies within AUA are determined by our clients and generally donot impact the administrative fees that we receive. Administrative fees can be impacted by factors such as asset valuation levelchanges from market movements, types of services administered, transaction volumes, geography and client relationship pricingbased on volumes or multiple services.
Our Investor & Treasury Services business is the primary business segment that has AUA with approximately 76% of totalAUA, as at October 31, 2020, followed by our Wealth Management and Personal & Commercial Banking businesses withapproximately 19% and 5% of total AUA, respectively.
2020 vs. 2019AUA increased $213 billion or 4% compared to last year, mainly reflecting market appreciation and the impact of foreignexchange translation, partially offset by lower client activity.
24 Royal Bank of Canada: Annual Report 2020 Management’s Discussion and Analysis

The following table summarizes AUA by geography and asset class:
AUA by geographic mix and asset class Table 12
(Millions of Canadian dollars) 2020 2019
Canada (1)
Money market $ 42,800 $ 35,300Fixed income 763,500 752,000Equity 591,200 652,000Multi-asset and other 954,800 902,100
Total Canada $ 2,352,300 $ 2,341,400
U.S. (1)
Money market $ 40,100 $ 26,500Fixed income 107,300 114,500Equity 195,400 189,600Multi-asset and other 256,000 226,700
Total U.S. $ 598,800 $ 557,300
Other International (1)
Money market $ 40,700 $ 44,100Fixed income 375,400 358,200Equity 837,200 787,900Multi-asset and other 1,686,800 1,589,100
Total International $ 2,940,100 $ 2,779,300
Total AUA $ 5,891,200 $ 5,678,000
(1) Geographic information is based on the location from where our clients are serviced.
Assets under managementAssets under management (AUM) are assets managed by us which are beneficially owned by our clients. Management fees arepaid by the investment funds and other clients for the investment capabilities of an investment manager and can also coveradministrative services. Management fees may be calculated daily, monthly or quarterly as a percentage of the AUM, dependingon the distribution channel, product and investment strategies. In general, equity strategies carry a higher fee rate than fixedincome or money market strategies. Fees are also impacted by asset mix and relationship pricing for clients using multipleservices. Higher risk assets generally produce higher fees, while clients using multiple services can take advantage of synergieswhich reduce the fees they are charged. Certain funds may have performance fee arrangements where fees are recorded whencertain benchmarks or performance targets are achieved. These factors could lead to differences in fees earned by product andtherefore net return by asset class may vary despite similar average AUM. Our Wealth Management segment is the primarybusiness segment that has AUM with approximately 99% of total AUM as at October 31, 2020.
2020 vs. 2019AUM increased $81 billion or 11% compared to last year, mainly reflecting net sales and market appreciation.
The following table presents the change in AUM for the year ended October 31, 2020:
Client assets – AUM Table 13
2020 2019
(Millions of Canadian dollars) Money market Fixed income EquityMulti-asset
and other Total Total
AUM, beginning balance $ 29,900 $ 206,900 $ 90,000 $ 435,500 $ 762,300 $ 671,000Institutional inflows 38,600 49,400 9,900 8,800 106,700 111,000Institutional outflows (21,000) (46,900) (3,300) (9,100) (80,300) (105,100)Personal flows, net 1,700 5,300 (700) 25,300 31,600 31,200
Total net flows $ 19,300 $ 7,800 $ 5,900 $ 25,000 $ 58,000 $ 37,100Market impact 200 10,400 – 7,300 17,900 60,000Acquisition/dispositions – – – 700 700 (5,500)Foreign exchange (500) 2,500 100 2,600 4,700 (300)
Total market, acquisition/dispositions andforeign exchange impact $ (300) $ 12,900 $ 100 $ 10,600 $ 23,300 $ 54,200
AUM, balance at end of year $ 48,900 $ 227,600 $ 96,000 $ 471,100 $ 843,600 $ 762,300
Management’s Discussion and Analysis Royal Bank of Canada: Annual Report 2020 25

Business segment results
Results by business segments
Table 14
2020 2019
(Millions of Canadian dollars,except percentage amounts)
Personal &Commercial
BankingWealth
Management Insurance
Investor &TreasuryServices
CapitalMarkets (1)
CorporateSupport (1) Total Total
Net interest income $ 12,568 $ 2,860 $ – $ 329 $ 5,135 $ (57) $ 20,835 $ 19,749Non-interest income 5,163 9,360 5,361 1,982 4,749 (269) 26,346 26,253
Total revenue $ 17,731 $ 12,220 $ 5,361 $ 2,311 $ 9,884 $ (326) $ 47,181 $ 46,002PCL 2,891 214 – 6 1,239 1 4,351 1,864PBCAE – – 3,683 – – – 3,683 4,085Non-interest expense 7,946 9,212 592 1,589 5,362 57 24,758 24,139
Income before income taxes $ 6,894 $ 2,794 $ 1,086 $ 716 $ 3,283 $ (384) $ 14,389 $ 15,914Income taxes 1,807 639 255 180 507 (436) 2,952 3,043
Net income $ 5,087 $ 2,155 $ 831 $ 536 $ 2,776 $ 52 $ 11,437 $ 12,871
ROE (2) 21.7% 13.1% 36.1% 15.9% 11.7% n.m. 14.2% 16.8%
Average assets $ 494,600 $ 119,500 $ 20,300 $204,300 $755,400 $ 42,600 $1,636,700 $ 1,436,200
(1) Net interest income, Non-interest income, Total revenue, Income before income taxes, and Income taxes are presented in Capital Markets on a taxable equivalent basis(teb). The teb adjustment is eliminated in the Corporate Support segment. For a further discussion, refer to the How we measure and report our business segmentssection.
(2) This measure may not have a standardized meaning under GAAP and may not be comparable to similar measures disclosed by other financial institutions. For furtherdetails, refer to the Key performance and non-GAAP measures section.
n.m. not meaningful
How we measure and report our business segments
Our management reporting framework is intended to measure the performance of each business segment as if it were a stand-alone business and reflects the way that the business segment is managed. This approach is intended to ensure that ourbusiness segments’ results include all applicable revenue and expenses associated with the conduct of their business anddepicts how management views those results.
Key methodologiesThe following outlines the key methodologies and assumptions used in our management reporting framework. These areperiodically reviewed by management to ensure they remain valid.
Expense and tax allocationTo ensure that our business segments’ results include expenses associated with the conduct of their business, we allocate costsincurred or services provided by Technology & Operations and Functions, which are directly undertaken or provided on thebusiness segments’ behalf. For other costs not directly attributable to our business segments, including overhead costs andother indirect expenses, we use our management reporting framework for allocating these costs to each business segment in amanner that is intended to reflect the underlying benefits.
Capital attributionOur management reporting framework also determines the attribution of capital to our business segments in a manner that isintended to consistently measure and align economic costs with the underlying benefits and risks associated with the activitiesof each business segment. The amount of capital assigned to each business segment is referred to as attributed capital.Unattributed capital and associated net charges are reported in Corporate Support. For further information, refer to the Capitalmanagement section.
Funds transfer pricingFunds transfer pricing refers to the pricing of intra-company borrowing or lending for management reporting purposes. Weemploy a funds transfer pricing process to enable risk-adjusted management reporting of segment results. This processdetermines the costs and revenue for intra-company borrowing and lending of funds after taking into consideration our interestrate risk and liquidity risk management objectives, as well as applicable regulatory requirements.
Provisions for credit lossesPCL is recorded to recognize estimated credit losses on all financial assets, except for financial assets classified or designated asfair value through profit or loss (FVTPL) and equity securities designated as fair value through other comprehensive income(FVOCI), which are not subject to impairment assessment. For details on our accounting policy on Allowance for credit losses(ACL), refer to Note 2 of our 2020 Annual Consolidated Financial Statements.
PCL is included in the results of each business segment to fully reflect the appropriate expenses related to the conduct ofeach business segment.
26 Royal Bank of Canada: Annual Report 2020 Management’s Discussion and Analysis

In addition to the key methodologies described above, the following components of our management reporting framework alsoimpact how our business segments are managed and reported:• Wealth Management results include disclosure in U.S. dollars, primarily for U.S. Wealth Management (including City
National) as we review and manage the results of this business largely in this currency.• Capital Markets results are reported on a teb basis, which grosses up total revenue from certain tax-advantaged sources
(Canadian taxable corporate dividends and the U.S. tax credit investment business) to their effective taxable equivalentvalue with a corresponding offset recorded in the provision for income taxes. We record the elimination of the tebadjustments in Corporate Support. We believe these adjustments are useful and reflect how Capital Markets manages itsbusiness, since it enhances the comparability of revenue and related ratios across taxable revenue and our principaltax-advantaged sources of revenue. The use of teb adjustments and measures may not be comparable to similar GAAPmeasures or similarly adjusted amounts disclosed by other financial institutions.
• Corporate Support results include all enterprise level activities that are undertaken for the benefit of the organization thatare not allocated to our five business segments, such as enterprise funding, securitizations, net charges associated withunattributed capital, and consolidation adjustments, including the elimination of the teb gross-up amounts.
Key performance and non-GAAP measures
Performance measuresReturn on common equityWe measure and evaluate the performance of our consolidated operations and each business segment using a number offinancial metrics, such as net income and ROE. We use ROE, at both the consolidated and business segment levels, as a measureof return on total capital invested in our business. Management views the business segment ROE measure as a useful measurefor supporting investment and resource allocation decisions because it adjusts for certain items that may affect comparabilitybetween business segments and certain competitors.
Our consolidated ROE calculation is based on net income available to common shareholders divided by total averagecommon equity for the period. Business segment ROE calculations are based on net income available to common shareholdersdivided by average attributed capital for the period. For each segment, average attributed capital includes the capital required tounderpin various risks as described in the Capital management section and amounts invested in goodwill and intangibles.
The attribution of capital involves the use of assumptions, judgments and methodologies that are regularly reviewed andrevised by management as deemed necessary. Changes to such assumptions, judgments and methodologies can have a materialeffect on the business segment ROE information that we report. Other companies that disclose information on similarattributions and related return measures may use different assumptions, judgments and methodologies.
Calculation of ROE Table 15
2020 2019
(Millions of Canadian dollars,except percentage amounts)
Personal &Commercial
BankingWealth
Management Insurance
Investor &TreasuryServices
CapitalMarkets
CorporateSupport Total Total
Net income available tocommon shareholders $ 5,006 $ 2,101 $ 823 $ 523 $ 2,698 $ 13 $ 11,164 $ 12,591
Total average commonequity (1), (2) 23,100 16,050 2,300 3,300 23,150 10,900 78,800 75,000
ROE (3) 21.7% 13.1% 36.1% 15.9% 11.7% n.m. 14.2% 16.8%
(1) Total average common equity represents rounded figures.(2) The amounts for the segments are referred to as attributed capital.(3) ROE is based on actual balances of average common equity before rounding.n.m. not meaningful
Non-GAAP measuresWe believe that certain non-GAAP measures described below are more reflective of our ongoing operating results and providereaders with a better understanding of management’s perspective on our performance. These measures enhance thecomparability of our financial performance for the year ended October 31, 2020 with the results from last year. Non-GAAPmeasures do not have a standardized meaning under GAAP and may not be comparable to similar measures disclosed by otherfinancial institutions.
The following discussion describes the non-GAAP measures we use in evaluating our operating results.
Efficiency ratio excluding the change in fair value of investments in InsuranceOur efficiency ratio is impacted by the change in fair value of investments backing policyholder liabilities, which is reported inrevenue and largely offset in PBCAE.
Consolidated non-GAAP efficiency ratio Table 16
2020 2019
Item excluded Item excluded
(Millions of Canadian dollars,except percentage amounts) As reported
Change in fair valueof investments backingpolicyholder liabilities Adjusted As reported
Change in fair valueof investments backingpolicyholder liabilities Adjusted
Total revenue $ 47,181 $ (277) $ 46,904 $ 46,002 $ (987) $ 45,015Non-interest expense 24,758 – 24,758 24,139 – 24,139
Efficiency ratio 52.5% 52.8% 52.5% 53.6%
Management’s Discussion and Analysis Royal Bank of Canada: Annual Report 2020 27

Personal & Commercial Banking
Personal & Commercial Banking provides a broad suite of financial products and services to individuals and businesses for theirday-to-day banking, investing and financing needs. We are focused on building meaningful relationships with our clients,underscored by our exceptional client experience, the breadth of our products, our depth of expertise, and the features of ourdigital solutions.
> 14 million > 7 million 35,964Number of clients Active digital users in Canada1 Employees
Revenue by business lines We operate through two businesses – Canadian Banking and Caribbean & U.S.Banking. Canadian Banking serves our home market in Canada, where wemaintain top (#1 or #2) rankings in market share for all key retail and businessproducts. We have the largest branch network, the most ATMs and one of thelargest mobile sales forces across Canada. In Caribbean & U.S. Banking, weoffer a broad range of financial products and services in targeted markets.
In Canada, we compete with other Schedule 1 banks, independent trustcompanies, foreign banks, credit unions, caisses populaires, and auto financingcompanies.
In the Caribbean, our competition includes banks, trust companies andinvestment management companies serving retail and corporate clients, as wellas public institutions. In the U.S., we compete primarily with other Canadianbanking institutions that have U.S. operations.
Total revenue$17.7 billion
72% Personal Banking
23% Business Banking
5% Caribbean and U.S. Banking
2020 Operating environment› Earnings in early fiscal 2020 were supported by a favourable operating environment characterized by low unemployment and
modest GDP growth, resulting in solid revenue growth and stable credit losses. However, the remainder of the fiscal year sawchallenging market conditions stemming from the widespread impact of the COVID-19 pandemic.
› To support our clients in financial need as a result of the impact of the COVID-19 pandemic, we launched various temporaryrelief programs for individuals and businesses, including payment deferrals, refinancing and limit increases. We also focusedon the safety and well-being of our employees by retrofitting branches with recommended safety measures, as well asproviding additional compensation for certain employees.
› In response to the COVID-19 pandemic, the BoC reduced the benchmark interest rate by 150 basis points. As a result of the lowrate environment in 2020, we experienced a significant decline in NIM this fiscal year.
› Measures to contain the spread of COVID-19 weighed on consumer spending with modest improvement observed across mostof our businesses as reopening began and containment measures were eased. Containment measures also severely limitedtravel activity resulting in a decline in card purchase volumes and foreign exchange revenues.
› Personal and business deposits saw significant growth through fiscal 2020, from a combination of lower spending and clientspreference for the safety of higher cash balances.
› While housing activity declined amidst the onset of the COVID-19 pandemic and implementation of associated containmentmeasures, it quickly rebounded as these conditions eased, largely reflecting the impact of pent-up demand and the low rateenvironment. This contributed to strong growth in residential mortgages this fiscal year.
› In the second fiscal quarter, we saw significant market volatility which weighed on our investment product balances,particularly mutual fund balances. By the third fiscal quarter, mutual fund balances recovered to pre-pandemic levels;however, we continue to observe higher than normal levels of volatility.
› The credit environment was impacted by the COVID-19 pandemic which led to heightened uncertainty and sustained volatilityin the current year, resulting in elevated provisions on performing loans.
› Client preferences for digital offerings increased due to the impacts of the COVID-19 pandemic. As a result, we continued toprioritize our investment in digital solutions to improve the client experience and deliver personalized advice.
› The Caribbean experienced challenges in various regions given the evolving impact of the COVID-19 pandemic on the tourismand oil & gas industries.
› In the U.S., earnings were unfavourably impacted by U.S. Fed rate cuts and severe limitations on cross-border travel, as a resultof the COVID-19 pandemic.
1 Represents 90-day active clients
28 Royal Bank of Canada: Annual Report 2020 Management’s Discussion and Analysis

Strategic priorities
OUR STRATEGY PROGRESS IN 2020 PRIORITIES IN 2021
Transform how we serve our clients Enhanced access to products and services for clientsby introducing Remote Account Open, a fully digitizedaccount opening experience for personal andbusiness clients, and by enabling expedited digitalprocessing of funding to over 170,000 smallbusinesses under CEBA
Provide flexibility by continuing to deliver anytime,anywhere solutions to our clients across all channels,seamlessly integrating mobile and digital servicesinto our clients’ lives
Continue to reimagine our branch network to meetthe evolving needs of our clients
Accelerate our growth Continued to provide personalized advice and valuedbanking solutions to our clients
Maintained our focus on key high-growth and high-value segments such as retirees, youth, newcomers,business owners, high net worth clients, andhealthcare professionals
Continued to further our partnerships, includinghelping our clients realize over $60 million in fuelsavings with Petro Canada, a Suncor business
Introduced Points for Canada, a campaign tostimulate the Canadian economy by encouragingclients to support Canadian brands and to buy local
Launched Canada United, a national movement tosupport local businesses in our communities and theCanada United Small Business Relief Fund to providesmall business grants to cover specific expenses
Remained focused on optimizing the end-to-endapproach to mortgages, driving market leadingacquisition and retention
Continued to gain commercial market share throughindustry-specific credit strategies
Developed a partnership with Wello, enablingbusinesses to offer virtual healthcare support toemployees
Focus on engaging key high-growth client segmentsand enabling our advisors to build new and deeperrelationships and achieve industry-leading volumegrowth
Establish key partnerships to continue to add valuefor our clients
Rapidly deliver digital solutions to ourclients
Continued to deliver leading digital capabilities andfunctionalities through our award-winning mobile app
First Canadian bank to introduce digital governmentidentity verification solutions using artificialintelligence (AI) technology, providing clients withmore secure identity verification, stronger fraudprotection and a faster account opening experience
Delivered a re-imagined Direct Investing experiencethat allows free, real-time streaming quotes andenables clients to trade from our RBC® Mobile app
First to market with the launch of Bulk RequestMoney, a subscription service to enable businessesto send multiple payment requests at once
Launched Ask NOMITM functionality, a text and voice-based chat bot, which uses AI to answer questions,helps clients navigate the app and simplifiesday-to-day financial tasks such as cancelinge-transfers, reviewing payment details andunderstanding spending patterns
Continued to roll out MyAdvisor®, an online adviceplatform that digitally connects our clients to anadvisor, resulting in over 2 million clients activatingtheir personalized investment plans since its launchin 2017
Deliver more personalized insights to improve theclient experience while continuing to simplify anddigitize everyday banking
Enhance the digital experience for our small businessand commercial clients and make it easier for themto transact with us
Innovate to become a more agile andefficient bank
Accelerated investments in programs that simplify,digitize and automate experiences for clients andemployees, and enable employees to deliver relevantand expert advice
Continued to invest in the digital enablement of ouremployees to better serve our clients, in addition tofurther enhance agile and change capabilities
Invest in new tools and capabilities and proactivelyseek ways to simplify and streamline internalprocesses and the client experience
In the Caribbean Continued transforming the client experience whiledriving profitability, simplifying operations, andstrategically navigating the COVID-19 pandemic andits impact on our clients and employees
Continued to focus on key high-growth segments,including high net worth households as well ascommercial and corporate clients
Remain focused on becoming the premier digitally-enabled relationship bank by accelerating revenuegrowth, transforming the client experience,simplifying our operations, and enabling ouremployees for success
In the U.S. Continued strong client growth at the start of theyear, with focus on client support and engagement inlight of border closures and travel restrictionsassociated with COVID-19 containment measures
Successfully implemented an enhanced real estatelending platform to improve productivity and offer amore digitally-enabled client experience
Further enhance the U.S. real estate ownershipexperience for Canadians by expanding advisoryservices and partnerships
Enhancing small business services to supportCanadian businesses needing U.S. payment andcollection services
Further digitization of operational processes toimprove efficiency, scalability and quality assurance
Developing a modern, digital banking platform toimprove client experience and expand depositgathering capabilities in the U.S.
Management’s Discussion and Analysis Royal Bank of Canada: Annual Report 2020 29

Outlook
The extent and duration of the impacts of the COVID-19 pandemic on the global economy remains uncertain, including theseverity of the ongoing second wave and associated re-imposition of containment measures to varying degrees in some regions.In addition, central banks have signaled the expected continuation of a low interest rate environment for the foreseeable future.This, along with the pressures on consumer spending, GDP and unemployment rates are expected to continue to impact ouroperating results in fiscal 2021. We will continue to pursue industry-leading volume growth, operational efficiency efforts andchannel transformation to achieve our vision of being a digitally-enabled relationship bank.
In the Caribbean, we expect challenging conditions to persist, including the likelihood of reduced travel and tourism as theimpact of the COVID-19 pandemic continues to evolve, as well as the impact of a low interest rate environment. We will continueto focus on growth strategies in target markets, improving operational efficiency and adding value for our clients.
For further details on our general economic review and outlook, refer to the Economic, market and regulatory review and outlooksection.
Personal & Commercial Banking Table 17
(Millions of Canadian dollars, except percentage amounts and as otherwise noted) 2020 2019Net interest income $ 12,568 $ 12,653Non-interest income 5,163 5,212
Total revenue 17,731 17,865PCL on performing assets 1,818 109PCL on impaired assets 1,073 1,339
PCL 2,891 1,448Non-interest expense 7,946 7,768
Income before income taxes 6,894 8,649Net income $ 5,087 $ 6,402
Revenue by businessCanadian Banking $ 16,838 $ 16,894
Personal Banking 12,703 12,843Business Banking 4,135 4,051
Caribbean & U.S. Banking 893 971
Key ratiosROE 21.7% 27.2%NIM 2.67% 2.84%Efficiency ratio 44.8% 43.5%Operating leverage (3.1)% 2.4%
Selected balance sheet informationAverage total assets $ 494,600 $ 466,200Average total earning assets, net 470,200 445,200Average loans and acceptances, net 473,400 447,100Average deposits 447,300 393,200
Other informationAUA (1), (2) $ 292,800 $ 283,800Average AUA 287,600 276,100AUM (2) 5,300 5,000Number of employees (FTE) 35,964 35,467
Credit informationPCL on impaired loans as a % of average net loans and acceptances 0.23% 0.30%
Other selected information – Canadian BankingNet income $ 5,077 $ 6,168NIM 2.64% 2.79%Efficiency ratio 43.2% 41.8%Operating leverage (3.3)% 2.0%
(1) AUA includes securitized residential mortgages and credit card loans as at October 31, 2020 of $15.6 billion and $6.7 billion, respectively (October 31, 2019 – $15.5 billionand $8.1 billion).
(2) Represents year-end spot balances.
Financial performance2020 vs. 2019Net income decreased $1,315 million or 21% from last year, mainly due to higher PCL, primarily attributable to the impact of theCOVID-19 pandemic on performing loans and lower spreads. The net increase in costs associated with the COVID-19 pandemic,including additional staff-related costs also contributed to the decrease. These factors were partially offset by average volumegrowth of 10% in Canadian Banking.
Total revenue decreased $134 million or 1% from last year, mainly due to lower spreads, largely reflecting the impact of lowerinterest rates and competitive pricing pressures. Lower card service revenue, mainly driven by a decrease in purchase volumes,also contributed to the decrease. These factors were partially offset by average volume growth in Canadian Banking of 6% inloans and 14% in deposits, and higher securities brokerage commissions.
NIM decreased 17 bps, mainly due to lower interest rates and the impact of competitive pricing pressures.PCL increased $1,443 million, reflecting higher provisions on performing loans in our Canadian Banking and Caribbean
Banking portfolios due to the impact of the COVID-19 pandemic, partially offset by lower provisions on impaired loans in ourCanadian Banking portfolios. For further details, refer to Credit quality performance in the Credit risk section.
30 Royal Bank of Canada: Annual Report 2020 Management’s Discussion and Analysis

Non-interest expense increased $178 million or 2%, primarily attributable to higher staff-related costs, including additionalcompensation for certain employees, primarily those client-facing amidst the COVID-19 pandemic, as well as an increase intechnology and related costs, including digital initiatives. Other incremental COVID-19 related costs also contributed to theincrease. These factors were partially offset by lower discretionary spend.
Average loans and acceptances increased $26 billion or 6%, driven by growth in mortgages and business loans.Average deposits increased $54 billion or 14%, reflecting growth in business and personal deposits.
Business line review
In Canada, we operate through two business lines: Personal Banking and Business Banking.
Personal Banking
Personal Banking offers a full range of products focused on meeting the needs of our individual Canadian clients at every stageof their lives through a wide range of financing and investment products and services. This includes home equity financing,personal lending, chequing and savings accounts, private banking, indirect lending (including auto financing), mutual funds andself-directed brokerage accounts, Guaranteed Investment Certificates (GICs), credit cards, and payment products and solutions.
We rank #1 or #2 in market share for all key Personal Banking products in Canada and our retail banking network is the largest inCanada with 1,201 branches and 4,182 ATMs.
Financial performanceTotal revenue decreased $140 million or 1% compared to last year, largely reflecting lower spreads driven by the impact of lowerinterest rates and competitive pricing pressures, as well as lower card service revenue, mainly driven by a decrease in purchasevolumes. Lower service charges and a decline in foreign exchange revenue also contributed to the decrease. These factors werepartially offset by average volume growth in residential mortgages and deposits, an increase in securities brokeragecommissions, and higher average balances driving higher mutual fund distribution fees.
Average residential mortgages increased 9% compared to last year, largely driven by solid housing activity resulting instrong mortgage originations.
Average deposits increased 12% from last year, largely driven by a combination of lower consumer spending and clients’preference for the safety of higher cash balances associated with the impacts of the COVID-19 pandemic.
Selected highlights Table 18
(Millions of Canadian dollars, except number of) 2020 2019Total revenue $ 12,703 $ 12,843Other information
Average residential mortgages $ 273,200 $ 249,600Average other loans and acceptances, net 77,800 79,800Average deposits 248,100 221,400Average credit card balances 18,100 19,100Credit card purchase volumes 118,100 125,800Branch mutual fund balances (1) 166,000 162,000Average branch mutual fund balances 163,600 155,300AUA – Self-directed brokerage (1) 96,400 89,500
Number as at October 31:Branches 1,201 1,201ATMs 4,182 4,240
(1) Represents year-end spot balances.
0
40,000
80,000
120,000
280,000
200,000
240,000
160,000
2020
Other loans andacceptances, net
Residential mortgages Deposits
Average residential mortgages, loans and deposits (Millions of Canadian dollars)
2019
Business Banking
Business Banking offers a wide range of lending, leasing, deposit, investment, foreign exchange, cash management, auto dealerfinancing, trade products, and services to small and medium-sized commercial businesses across Canada. With one of thelargest teams of relationship managers and specialists in the industry, our commitment to client experience and trusted advicehas earned us leading market share in business lending and deposits.
Financial performanceTotal revenue increased $84 million or 2% compared to last year, largely reflecting average volume growth and higher credit fees.These factors were partially offset by lower spreads, primarily driven by the impact of lower interest rates, lower service chargesand a decrease in foreign exchange revenue.
Management’s Discussion and Analysis Royal Bank of Canada: Annual Report 2020 31

Average loans and acceptances increased 6%, due to the deepening of our existing client relationships. Average depositswere up 18%, mainly due to our clients maintaining higher cash balances amidst the COVID-19 pandemic.
Selected highlights Table 19
(Millions of Canadian dollars) 2020 2019Total revenue $ 4,135 $ 4,051Other information (average)
Loans and acceptances, net $ 94,600 $ 89,400Deposits 180,800 153,400
0
50,00075,000
25,000
100,000125,000150,000175,000
200,000
2020 2019
Loans and acceptances, net Deposits
Average loans and acceptances and deposits(Millions of Canadian dollars)
Caribbean & U.S. Banking
Our Caribbean Banking business offers a comprehensive suite of banking products and services, as well as internationalfinancing and trade promotion services through extensive branch, ATM, online, and mobile banking networks.
Our U.S. Banking business serves the banking needs of our Canadian retail and small business clients in the U.S. across all50 states.
Financial performanceTotal revenue was down $78 million or 8% from last year, primarily due to lower spreads driven by the impact of lower interestrates, partially offset by average volume growth of 1%.
Average loans and acceptances increased 4% due to mortgage growth in U.S. Banking and average deposits decreased 1%.
Selected highlights Table 20
(Millions of Canadian dollars,except number of and percentage amounts) 2020 2019Total revenue $ 893 $ 971Other information
NIM 3.46% 4.13%Average loans and acceptances, net $ 9,700 $ 9,300Average deposits 18,400 18,500AUA (1) 5,900 6,700Average AUA 6,400 7,100AUM (1) 5,200 4,900
Number as at October 31:Branches 51 52ATMs 298 287
(1) Represents year-end spot balances.
2020 2019
Loans and acceptances, net Deposits
Average loans and deposits (Millions of Canadian dollars)
0
10,000
15,000
5,000
20,000
32 Royal Bank of Canada: Annual Report 2020 Management’s Discussion and Analysis

Wealth Management
Wealth Management is a global business serving clients in key financial centres. We serve HNW and UHNW individual andinstitutional clients with a comprehensive suite of advice-based solutions and strategies to help them achieve their financial goals.
$12.2 billion > 5,400 > $11 billionTotal revenue Client-facing advisors AUA net flows
Assets under Administration(AUA)
Total AUA$1,100 billion
7% Institutional
92% Personal
1% Mutual Funds
Assets under Management(AUM)
Total AUM$836 billion
38% Personal
33% Institutional
29% Mutual Funds
Our lines of businesses include Canadian WealthManagement, U.S. Wealth Management (includingCity National), Global Asset Management (GAM),and International Wealth Management.
• Canadian Wealth Management is the largestfull-service wealth advisory business inCanada, as measured by AUA, serving HNW andUHNW clients
• U.S. Wealth Management (including CityNational) also encompasses our private clientgroup (PCG) and clearing and custody (C&C)businesses. PCG is the 7th largest full-servicewealth advisory firm in the U.S., as measured bynumber of advisors, and City National is apremier U.S. private and commercial bankserving HNW, UHNW and commercial clients
• GAM is the largest retail fund company inCanada as measured by AUM1, as well as aleading institutional asset manager
• International Wealth Management serves HNWand UHNW clients, primarily through keyfinancial centres in the U.K., Channel Islandsand Asia
2020 Operating environment› Earnings in the current fiscal year were unfavourably impacted by U.S. Fed rate cuts in the latter part of calendar 2019, as well
as market volatility and further U.S. Fed and other central bank rate cuts in early calendar 2020 associated with the globalimpacts of the COVID-19 pandemic.
› To support our clients in financial need as a result of the impacts of the COVID-19 pandemic, we launched temporary reliefprograms for businesses, including payment deferrals.
› Despite challenging market conditions, our core businesses remained strong with double digit volume growth in City National,strong sales in GAM, as well as net positive flows of fee-generating client assets in our brokerage businesses. These resultsreflect the resilience of our business driven by the quality of our advice, the breadth of our solutions and clients’ trust in ourbrand.
› Margin compression, continued expansion of digital and data capabilities, increasing regulatory scrutiny, shiftingdemographics, and heightened competition continued to be structural trends challenging the wealth management industry.
› Continued investments in our people and technology enabled us to manage through the market volatility and economic uncertaintywhile also providing uninterrupted services to our clients throughout the COVID-19 pandemic. Leveraging our investment intechnology also supported the safety and well-being of our employees by enabling them to work effectively in a virtual setting.
› The credit environment was impacted by the COVID-19 pandemic which led to heightened uncertainty and sustained volatilityin the current fiscal year, resulting in elevated provisions on performing loans.
1 Source: Investment Funds Institute of Canada, September 30, 2020, reported on a quarterly basis.
Management’s Discussion and Analysis Royal Bank of Canada: Annual Report 2020 33

Strategic priorities
OUR STRATEGY PROGRESS IN 2020 PRIORITIES IN 2021
In Canada, be the premier service providerfor HNW and UHNW clients
Extended our position as industry leader in ourfull-service private wealth business
Maintained our focus on holistic wealth planning,including advisor training on intergenerationaland business wealth transfer
Continued to focus on offering RBC® PremierBanking to deepen banking relationships withWealth Management clients
Enhanced our digital and data capabilities todrive increased client satisfaction and advisorproductivity, including the launch of eSignfunctionality for new or existing accounts
Continue to retain and attract top-performing andnew advisors to strengthen our talent advantage
Deliver a differentiated client experience throughenriched advisor-client interactions andcompelling digital experiences
Broaden and deepen client relationships byleveraging combined strengths across our otherbusiness segments
Continue to invest in digitized solutions tostreamline and simplify the business, improvingefficiency and advisor productivity
In the U.S., become the leading private andcommercial bank and wealth manager inour key markets
Invested in key areas needed to grow ourU.S. Wealth Management business, includingsubstantial talent recruitment and solid executionon our technology transformation
City National continued to focus on our core high-growth banking businesses, opened newlocations in priority markets including the NewYork and D.C. areas, further extended within theentertainment ecosystem, expanded our digitalcapabilities, and invested in productivity andefficiency programs
Continue to deliver an exceptional clientexperience for targeted HNW, UHNW, middlemarket, and business banking segments
Leverage the combined strengths within U.S.Wealth Management (including City National) andCapital Markets with a view to further accelerategrowth in the U.S.
Emphasize growth in our affluent and HNWbanking solutions
Further build out digital capabilities to improveclient experience and drive operationalefficiencies
In select global financial centres, becomethe most trusted regional private bank
Enhanced our distribution capabilities byleveraging our global strengths, while deliveringan exceptional client experience
Focused on delivering a differentiated clientexperience by leveraging our global capabilities
Focus on growing market share in target markets
Continue to leverage our global strengths tobetter serve clients
Continue to deliver an exceptional clientexperience
Continue to increase business effectiveness andtalent capabilities
In asset management, be a leading,diversified asset manager focused onglobal institutional and North Americanretail clients
Maintained #1 market share in Canadian mutualfund AUM
RBC® iShares strategic alliance maintained #1market share in Canadian ETFs and continued toaccelerate sales growth
Published our GAM-wide Approach to ClimateChange, which included implementing climatescenario analysis across our portfolios andjoining the Climate Action 100+ initiative
Continue to expand our investment capabilities tomeet evolving client needs in our targetdistribution regions
Shift to a more unified asset managementoperating model to take better advantage ofenterprise and GAM global scale, resources andinfrastructure
Outlook
The extent and duration of the impact of the COVID-19 pandemic on the global economy remains uncertain, including the severityof the ongoing second wave and associated re-imposition of containment measures to varying degrees in some regions. Centralbanks have also signaled the expected continuation of a low interest rate environment.
We believe our diversified businesses are well-positioned to endure through the period of recovery from the impacts of theCOVID-19 pandemic. Our strategy remains unchanged as we continue to focus on delivering an unmatched client experiencethrough holistic goals-based advice, attracting and retaining top-performing advisors, and collaborating across the enterprise tobring our full breadth of capabilities to our clients. We will continue to leverage our brand, reputation and solid financial positionto grow our leading position in Canada and increase our market share of the HNW and UHNW client segments globally. Inaddition, the rapid shift to work from home arrangements due to the COVID-19 pandemic has reinforced the importance ofdigitization, requiring a continued investment in digital capabilities to improve client and advisor experiences and driveoperational efficiencies.
For further details on our general economic review and outlook, refer to the Economic, market and regulatory review and outlooksection.
34 Royal Bank of Canada: Annual Report 2020 Management’s Discussion and Analysis

Wealth Management Table 21
(Millions of Canadian dollars, except number of, percentage amounts and as otherwise noted) 2020 2019Net interest income $ 2,860 $ 2,993Non-interest income 9,360 9,150
Total revenue 12,220 12,143PCL on performing assets 157 37PCL on impaired assets 57 80
PCL 214 117Non-interest expense 9,212 8,813
Income before income taxes 2,794 3,213Net income $ 2,155 $ 2,550
Revenue by businessCanadian Wealth Management $ 3,319 $ 3,294U.S. Wealth Management (including City National) 6,206 6,112
U.S. Wealth Management (including City National) (US$ millions) 4,624 4,601Global Asset Management 2,308 2,361International Wealth Management 387 376
Key ratiosROE 13.1% 17.4%NIM 2.79% 3.55%Pre-tax margin (1) 22.9% 26.5%
Selected balance sheet informationAverage total assets $ 119,500 $ 98,500Average total earning assets, net 102,600 84,400Average loans and acceptances, net 76,700 63,600Average deposits 122,000 95,800
Other informationAUA (2), (3) $ 1,100,000 $ 1,062,200AUM (2) 836,400 755,700Average AUA 1,082,000 1,027,400Average AUM 801,500 717,500PCL on impaired loans as a % of average net loans and acceptances 0.07% 0.13%Number of employees (FTE) 18,978 18,613Number of advisors (4) 5,428 5,296
Estimated impact of U.S. dollar, British pound and Euro translation on key income statement items
(Millions of Canadian dollars, except percentage amounts) 2020 vs. 2019Increase (decrease):
Total revenue $ 73PCL 5Non-interest expense 62Net income 6
Percentage change in average U.S. dollar equivalent of C$1.00 (1)%Percentage change in average British pound equivalent of C$1.00 (2)%Percentage change in average Euro equivalent of C$1.00 (2)%
(1) Pre-tax margin is defined as Income before income taxes divided by Total revenue.(2) Represents year-end spot balances.(3) In addition to Canadian Wealth Management, U.S. Wealth Management (including City National), and International Wealth Management, AUA includes $6,100 million
(2019: $6,000 million) related to GAM.(4) Represents client-facing advisors across all our wealth management businesses.
Client assets – AUA Table 22
(Millions of Canadian dollars) 2020 2019AUA, beginning balance $ 1,062,200 $ 970,500
Asset inflows 356,800 315,500Asset outflows (345,400) (293,400)
Total net flows $ 11,400 $ 22,100Market impact 17,500 72,100Acquisitions/dispositions – (2,200)Foreign exchange 8,900 (300)
Total market, acquisition/dispositions and foreign exchange impact $ 26,400 $ 69,600
AUA, balance at end of year $ 1,100,000 $ 1,062,200
Management’s Discussion and Analysis Royal Bank of Canada: Annual Report 2020 35

Client assets – AUM Table 23
2020 2019
(Millions of Canadian dollars)
Moneymarket
Fixedincome Equity
Multi-assetand other Total Total
AUM, beginning balance $ 29,900 $204,800 $ 89,900 $ 431,100 $ 755,700 $ 664,900Institutional inflows 38,600 49,400 9,900 8,800 106,700 111,000Institutional outflows (21,000) (46,900) (3,300) (9,100) (80,300) (105,100)Personal flows, net 1,600 5,300 (800) 25,200 31,300 31,000
Total net flows $ 19,200 $ 7,800 $ 5,800 $ 24,900 $ 57,700 $ 36,900Market impact 200 10,300 – 7,200 17,700 59,700Acquisition/dispositions – – – 700 700 (5,500)Foreign exchange (500) 2,500 100 2,500 4,600 (300)
Total market, acquisition/dispositions andforeign exchange impact $ (300) $ 12,800 $ 100 $ 10,400 $ 23,000 $ 53,900
AUM, balance at end of year $ 48,800 $225,400 $ 95,800 $ 466,400 $ 836,400 $ 755,700
AUA by geographic mix and asset class Table 24
(Millions of Canadian dollars) 2020 2019Canada (1)
Money market $ 25,900 $ 23,200Fixed income 32,000 36,300Equity 68,800 90,500Multi-asset and other 288,800 255,800
Total Canada $ 415,500 $ 405,800
U.S. (1)Money market $ 39,700 $ 26,100Fixed income 107,300 114,500Equity 195,400 189,600Multi-asset and other 241,400 213,100
Total U.S. $ 583,800 $ 543,300
Other International (1)Money market $ 17,400 $ 17,700Fixed income 10,100 13,500Equity 38,800 39,500Multi-asset and other 34,400 42,400
Total International $ 100,700 $ 113,100Total AUA $ 1,100,000 $ 1,062,200(1) Geographic information is based on the location from where our clients are served.
Financial performance2020 vs. 2019Net income decreased $395 million or 15% from a year ago, primarily due to a gain in the prior year on the sale of the private debtbusiness of BlueBay, a decline in net interest income and higher staff-related costs. Lower income from sweep deposits alsocontributed to the decrease. These factors were partially offset by an increase in earnings from higher average fee-based clientassets, net of the associated variable compensation.
Total revenue increased $77 million or 1%, largely due to average loan growth of 21% and higher average fee-based client assets,primarily reflecting net sales and market appreciation. Higher transactional revenue driven by client activity and the impact of foreignexchange translation also contributed to the increase. These factors were partially offset by the impact of lower interest rates on netinterest income and income from sweep deposits. The prior year also included a gain on the sale of the private debt business ofBlueBay of $151 million and the impact of a favourable accounting adjustment in Canadian Wealth Management.
PCL increased $97 million, or 83%, primarily in U.S. Wealth Management (including City National), largely reflecting higherprovisions on performing loans due to the impact of the COVID-19 pandemic. For further details, refer to Credit qualityperformance in the Credit risk section.
Non-interest expense increased $399 million or 5%, primarily due to higher variable compensation commensurate withincreased commissionable revenue and higher staff-related costs in support of business growth. Higher technology and relatedcosts, as well as the impact of foreign exchange translation also contributed to the increase.
AUA increased $38 billion or 4%, primarily due to market appreciation and net sales. The impact of foreign currencytranslation also contributed to the increase.
AUM increased $81 billion or 11%, primarily due to net sales and market appreciation.
36 Royal Bank of Canada: Annual Report 2020 Management’s Discussion and Analysis

Business line review
Canadian Wealth Management
Canadian Wealth Management includes our full-service Canadian wealth advisory business, which is the largest in Canada asmeasured by AUA, with over 1,850 investment advisors providing comprehensive financial solutions with a focus on HNW andUHNW clients. Additionally, we provide discretionary investment management and estate and trust services to our clientsthrough over 100 investment counsellors and over 100 trust professionals across Canada.
We compete with domestic banks and trust companies, investment counselling firms, bank-owned full-service brokeragesand boutique brokerages, mutual fund companies, and global private banks. In Canada, bank-owned wealth managers continueto be the major players.
Financial performanceRevenue increased $25 million or 1% from a year ago, mainly due to higher average fee-based client assets, primarily reflectingnet sales and market appreciation. This was partially offset by lower interest rates resulting in a decline in net interest income,and the impact in the prior year of a favourable accounting adjustment.
Selected highlights Table 25
(Millions of Canadian dollars) 2020 2019Total revenue $ 3,319 $ 3,294Other information
Average loans and acceptances, net $ 3,900 $ 3,700Average deposits 21,900 17,100AUA (1) 416,700 407,000AUM (1) 125,700 116,700Average AUA 410,300 391,100Average AUM 121,600 109,400
(1) Represents year-end spot balances.0
200,000250,000
100,000150,000
50,000
300,000350,000400,000450,000
2020 2019
AUA AUM
Average AUA and AUM (Millions of Canadian dollars)
U.S. Wealth Management (including City National)
U.S. Wealth Management (including City National) also encompasses PCG and our C&C businesses. PCG is the 7th largest full-service wealth advisory firm in the U.S., as measured by number of advisors, with over 2,000 financial advisors. Our C&C businessdelivers clearing and execution services for small to mid-sized independent broker-dealers and registered investment advisorfirms. City National provides comprehensive financial solutions to affluent individuals, entrepreneurs, professionals, theirbusinesses, and their families, and provides a premier banking and financial experience through a high-touch service model,proactive advice and financial solutions. City National offers a broad range of lending, deposit, cash management, equipmentfinancing, wealth management, and other products and services. In the U.S., we operate in a fragmented and highly competitiveindustry. Our competitors include other broker-dealers, commercial banks and other financial institutions that service HNW andUHNW individuals, entrepreneurs and their businesses.
Financial performanceRevenue increased $94 million or 2% from a year ago. In U.S. dollars, revenue increased $23 million, largely due to average loangrowth of 22% and higher average fee-based client assets, mainly reflecting net sales and market appreciation. Highertransactional revenue driven by client activity also contributed to the increase. These factors were partially offset by the impactof lower interest rates on net interest income and income from sweep deposits.
Lower spreads, primarily driven by the impact of lower interest rates, resulted in NIM compression of 72 bps compared to theprior year.
Selected highlights Table 26
(Millions of Canadian dollars,except as otherwise noted) 2020 2019Total revenue $ 6,206 $ 6,112Other information
(Millions of U.S. dollars)Total revenue $ 4,624 $ 4,601NIM 2.65% 3.37%Average earning assets, net $ 68,900 $ 56,100Average loans, guarantees and
letters of credit, net 51,600 42,400Average deposits 64,700 50,200AUA (1) 438,200 412,600AUM (1) 137,300 123,700Average AUA 424,600 393,900Average AUM 130,200 112,800
(1) Represents year-end spot balances.
0
200,000250,000
100,000150,000
50,000
300,000350,000400,000450,000
2020 2019
AUA AUM
Average AUA and AUM (Millions of U.S. dollars)
Management’s Discussion and Analysis Royal Bank of Canada: Annual Report 2020 37
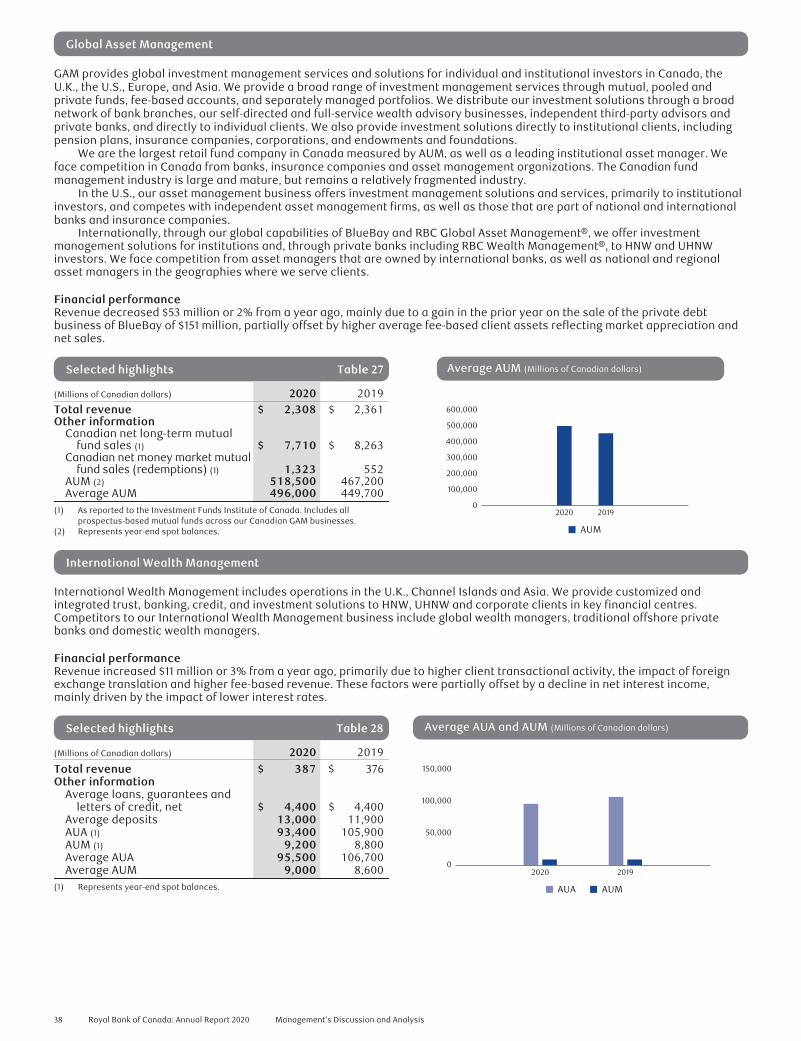
Global Asset Management
GAM provides global investment management services and solutions for individual and institutional investors in Canada, theU.K., the U.S., Europe, and Asia. We provide a broad range of investment management services through mutual, pooled andprivate funds, fee-based accounts, and separately managed portfolios. We distribute our investment solutions through a broadnetwork of bank branches, our self-directed and full-service wealth advisory businesses, independent third-party advisors andprivate banks, and directly to individual clients. We also provide investment solutions directly to institutional clients, includingpension plans, insurance companies, corporations, and endowments and foundations.
We are the largest retail fund company in Canada measured by AUM, as well as a leading institutional asset manager. Weface competition in Canada from banks, insurance companies and asset management organizations. The Canadian fundmanagement industry is large and mature, but remains a relatively fragmented industry.
In the U.S., our asset management business offers investment management solutions and services, primarily to institutionalinvestors, and competes with independent asset management firms, as well as those that are part of national and internationalbanks and insurance companies.
Internationally, through our global capabilities of BlueBay and RBC Global Asset Management®, we offer investmentmanagement solutions for institutions and, through private banks including RBC Wealth Management®, to HNW and UHNWinvestors. We face competition from asset managers that are owned by international banks, as well as national and regionalasset managers in the geographies where we serve clients.
Financial performanceRevenue decreased $53 million or 2% from a year ago, mainly due to a gain in the prior year on the sale of the private debtbusiness of BlueBay of $151 million, partially offset by higher average fee-based client assets reflecting market appreciation andnet sales.
Selected highlights Table 27
(Millions of Canadian dollars) 2020 2019Total revenue $ 2,308 $ 2,361Other information
Canadian net long-term mutualfund sales (1) $ 7,710 $ 8,263
Canadian net money market mutualfund sales (redemptions) (1) 1,323 552
AUM (2) 518,500 467,200Average AUM 496,000 449,700
(1) As reported to the Investment Funds Institute of Canada. Includes allprospectus-based mutual funds across our Canadian GAM businesses.
(2) Represents year-end spot balances.
0
100,000
200,000
300,000
600,000
500,000
400,000
AUM
2020 2019
Average AUM (Millions of Canadian dollars)
International Wealth Management
International Wealth Management includes operations in the U.K., Channel Islands and Asia. We provide customized andintegrated trust, banking, credit, and investment solutions to HNW, UHNW and corporate clients in key financial centres.Competitors to our International Wealth Management business include global wealth managers, traditional offshore privatebanks and domestic wealth managers.
Financial performanceRevenue increased $11 million or 3% from a year ago, primarily due to higher client transactional activity, the impact of foreignexchange translation and higher fee-based revenue. These factors were partially offset by a decline in net interest income,mainly driven by the impact of lower interest rates.
Selected highlights Table 28
(Millions of Canadian dollars) 2020 2019Total revenue $ 387 $ 376Other information
Average loans, guarantees andletters of credit, net $ 4,400 $ 4,400
Average deposits 13,000 11,900AUA (1) 93,400 105,900AUM (1) 9,200 8,800Average AUA 95,500 106,700Average AUM 9,000 8,600
(1) Represents year-end spot balances.
0
50,000
100,000
150,000
2020 2019
AUA AUM
Average AUA and AUM (Millions of Canadian dollars)
38 Royal Bank of Canada: Annual Report 2020 Management’s Discussion and Analysis
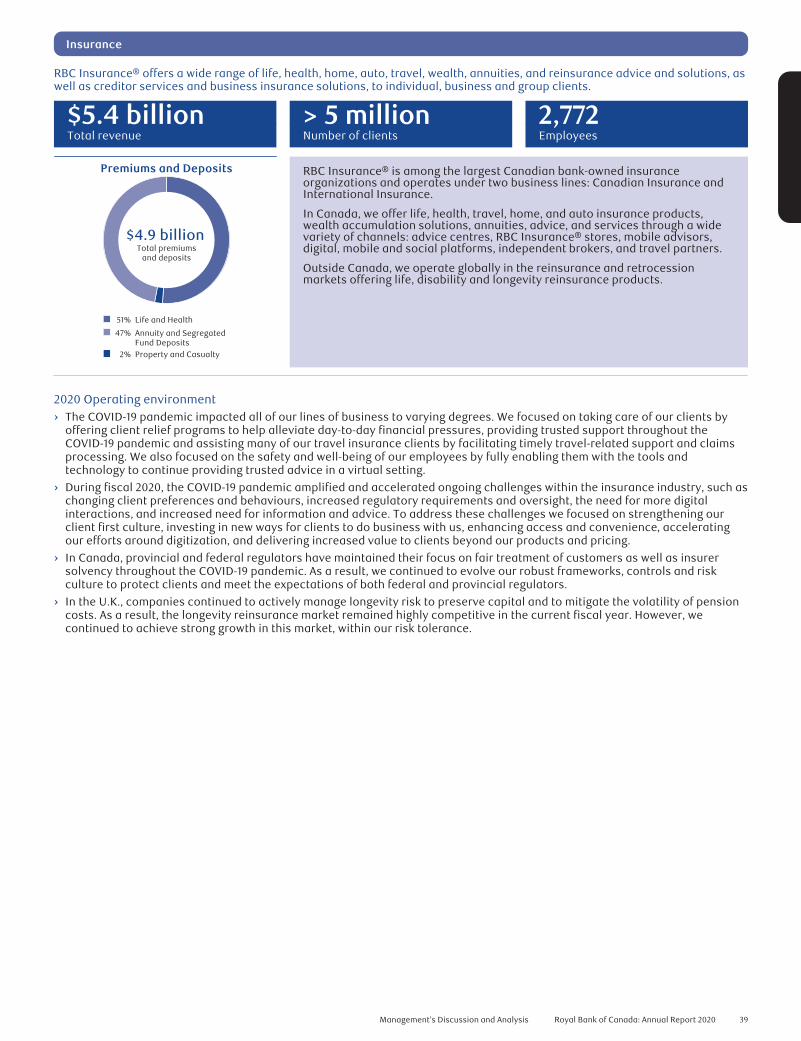
Insurance
RBC Insurance® offers a wide range of life, health, home, auto, travel, wealth, annuities, and reinsurance advice and solutions, aswell as creditor services and business insurance solutions, to individual, business and group clients.
$5.4 billion > 5 million 2,772Total revenue Number of clients Employees
Premiums and Deposits
Total premiumsand deposits
$4.9 billion
51% Life and Health
47% Annuity and Segregated Fund Deposits 2% Property and Casualty
RBC Insurance® is among the largest Canadian bank-owned insuranceorganizations and operates under two business lines: Canadian Insurance andInternational Insurance.
In Canada, we offer life, health, travel, home, and auto insurance products,wealth accumulation solutions, annuities, advice, and services through a widevariety of channels: advice centres, RBC Insurance® stores, mobile advisors,digital, mobile and social platforms, independent brokers, and travel partners.
Outside Canada, we operate globally in the reinsurance and retrocessionmarkets offering life, disability and longevity reinsurance products.
2020 Operating environment› The COVID-19 pandemic impacted all of our lines of business to varying degrees. We focused on taking care of our clients by
offering client relief programs to help alleviate day-to-day financial pressures, providing trusted support throughout theCOVID-19 pandemic and assisting many of our travel insurance clients by facilitating timely travel-related support and claimsprocessing. We also focused on the safety and well-being of our employees by fully enabling them with the tools andtechnology to continue providing trusted advice in a virtual setting.
› During fiscal 2020, the COVID-19 pandemic amplified and accelerated ongoing challenges within the insurance industry, such aschanging client preferences and behaviours, increased regulatory requirements and oversight, the need for more digitalinteractions, and increased need for information and advice. To address these challenges we focused on strengthening ourclient first culture, investing in new ways for clients to do business with us, enhancing access and convenience, acceleratingour efforts around digitization, and delivering increased value to clients beyond our products and pricing.
› In Canada, provincial and federal regulators have maintained their focus on fair treatment of customers as well as insurersolvency throughout the COVID-19 pandemic. As a result, we continued to evolve our robust frameworks, controls and riskculture to protect clients and meet the expectations of both federal and provincial regulators.
› In the U.K., companies continued to actively manage longevity risk to preserve capital and to mitigate the volatility of pensioncosts. As a result, the longevity reinsurance market remained highly competitive in the current fiscal year. However, wecontinued to achieve strong growth in this market, within our risk tolerance.
Management’s Discussion and Analysis Royal Bank of Canada: Annual Report 2020 39

Strategic priorities
OUR STRATEGY PROGRESS IN 2020 PRIORITIES IN 2021
Deepen client relationships Launched our Thank-you to Essential Workerscampaign across Canada, offering premiumsavings on select individual disability policies fora limited time
Enhanced the suite of mental health solutions forour group clients, including therapist assistedonline cognitive behavioural therapy and mentalhealth training webinars, which supported ourclients and plan members with challenges theymay be facing as a result of the COVID-19pandemic
Introduced new products to the RBC® GuaranteedInvestment Funds portfolio, providing greaterchoice for our clients
Enhanced Group Health & Dental benefits forcertain group clients to include a Modular Flexoption that offers choice to plan members basedon personal circumstances and needs
Continue to be an innovative, client-focusedprovider of a full suite of insurance solutions formass underserved, mass affluent and high networth clients
Simplify.Agile.Innovate Launched our online Insurance platform,delivering our clients self-serve capabilities for allof their insurance needs in one central andsecure location
Continued to innovate by investing in researchand development to understand and meetchanging needs and expectations of underinsuredCanadians
Simplify and innovate by accelerating ourinvestments in digital initiatives, improvingquality and cost effectiveness
Improve distribution effectiveness andefficiency
Enhanced electronic applications that simplifiedoverall user-experience, and reduced time topurchase, making it easier to do business with us
Continued to improve automated underwritingprocesses for Life insurance to reduce wait timesfor clients and simplify the application process
Introduced new digital tools which enable clientsto receive enhanced advice as well as simplify thepurchase and management of their creditorinsurance
Continue to improve our distributioneffectiveness and efficiency by enhancing bothour proprietary and third-party channels, andfocusing on the delivery of technology andoperational solutions
Pursue select international opportunitiesto grow our reinsurance business
Achieved very strong growth in our longevityreinsurance business, largely due to ourrelationships within the U.K. insurance andreinsurance market, as well as our longevityoperations and underwriting expertise
Pursue niche opportunities in mortality andlongevity markets to grow our reinsurancebusiness within our risk tolerance
Outlook
The insurance industry is expected to continue experiencing change in the coming fiscal year driven by the ongoing impacts ofthe COVID-19 pandemic, including changing client expectations, accelerated digital disruption and distribution innovation.Government and regulatory pressures are also expected to continue into fiscal 2021. As consumers focus more attention onoverall health and well-being, we will continue to deliver services and create industry partnerships to assist our clients. In thisrapidly evolving industry and economic environment, we will seek to maintain our strength through investments in technology,product and service innovation, efficient distribution channels, and a strong risk culture. We will also continue to re-define howwe advise our clients and seek to provide them peace of mind. We believe that delivering on our business strategy will allow us tocontinue to thrive in this changing environment.
For further details on our general economic review and outlook, refer to the Economic, market and regulatory review and outlooksection.
40 Royal Bank of Canada: Annual Report 2020 Management’s Discussion and Analysis

Insurance Table 29
(Millions of Canadian dollars, except percentage amounts and as otherwise noted) 2020 2019Non-interest income
Net earned premiums $ 4,267 $ 3,984Investment Income, gains/(losses) on assets supporting insurance policyholder liabilities (1) 938 1,569Fee income 156 157
Total revenue 5,361 5,710Insurance policyholder benefits and claims (1) 3,384 3,749Insurance policyholder acquisition expense 299 336Non-interest expense 592 606
Income before income taxes 1,086 1,019Net income $ 831 $ 806
Revenue by businessCanadian Insurance $ 2,974 $ 3,643International Insurance 2,387 2,067
Key ratiosROE 36.1% 39.6%
Selected balance sheet informationAverage total assets $ 20,300 $ 17,600
Other informationPremiums and deposits (2) $ 4,950 $ 4,604
Canadian Insurance 2,493 2,415International Insurance 2,457 2,189
Insurance claims and policy benefit liabilities 12,215 11,401Fair value changes on investments backing policyholder liabilities (1) 277 987Number of employees (FTE) 2,772 2,927
(1) Includes unrealized gains and losses on investments backing policyholder liabilities attributable to fluctuation of assets designated as FVTPL. The investments whichsupport actuarial liabilities are predominantly fixed income assets designated as FVTPL. Consequently, changes in the fair values of these assets are recorded inInsurance premiums, investment and fee income in the Consolidated Statements of Income and are largely offset by changes in the fair value of the actuarial liabilities,the impact of which is reflected in PBCAE.
(2) Premiums and deposits include premiums on risk-based insurance and annuity products, and individual and group segregated fund deposits, consistent with insuranceindustry practices.
Financial performance2020 vs. 2019Net income increased $25 million or 3%, largely due to higher favourable investment-related experience, partially offset byunfavourable annual actuarial assumption updates.
Total revenue decreased $349 million or 6%, mainly reflecting the change in fair value of investments backing policyholderliabilities, which is largely offset in PBCAE as indicated below. This was partially offset by business growth primarily in longevityreinsurance and group annuities, both of which are largely offset in PBCAE as indicated below.
PBCAE decreased $402 million or 10%, mainly reflecting the change in fair value of investments backing policyholderliabilities, and higher favourable investment-related experience. These factors were partially offset by business growth, andunfavourable annual actuarial assumption updates in the current year, largely related to mortality experience.
Non-interest expense decreased $14 million or 2%, largely reflecting reduced costs associated with efficiencies driven bytechnology investments, partially offset by increased costs in support of business growth.
Business line review
Canadian Insurance
We offer life, health, travel, home, and auto insurance products (in partnership agreement with Aviva Canada), wealthaccumulation solutions, and payout annuities to individual, group, HNW, and business clients across Canada. Our life and healthportfolio includes universal life, term life, critical illness, disability, and group benefits such as long term disability, and healthand dental. Our travel products include out-of-province/country medical coverage, and trip cancellation and interruptioninsurance.
Our group annuities business helps defined benefit pension plan sponsors better manage and control risk. RBC Insurancehas a set of strategies and initiatives with a goal to build our momentum and position us for growth in a product line wherecompanies are increasingly looking to transfer the risks associated with their pension obligations to insurance companies –either through group annuity contract or longevity swap products.
In Canada, the majority of our competitors specialize in life and health or property and casualty products. As a multi-linecarrier, we hold a leading market position in disability insurance products and growing presence in wealth solutions.
Financial performanceTotal revenue decreased $669 million or 18% from last year, mainly due to the change in fair value of investments backingpolicyholder liabilities, partially offset by higher group annuity sales, both of which are which are largely offset in PBCAE.
Premiums and deposits increased $78 million or 3%, mainly due individual life product and group annuity sales, partiallyoffset by a reduction in travel products.
Management’s Discussion and Analysis Royal Bank of Canada: Annual Report 2020 41

Selected highlights Table 30
(Millions of Canadian dollars) 2020 2019
Total revenue $ 2,974 $ 3,643Other information
Premiums and depositsLife and health $ 1,397 $ 1,328Property and casualty 98 131Annuity and segregated fund
deposits 998 956Fair value changes on investments
backing policyholder liabilities 351 1,099
0
500
1,000
3,000
2,000
1,500
2,500
Annuity and segregatedfund
Property andcasualty
Life and health
2020 2019
Premiums and deposits (Millions of Canadian dollars)
International Insurance
International Insurance is primarily comprised of our reinsurance businesses which insure risks of other insurance andreinsurance companies. We offer life, disability and longevity reinsurance products.
The global reinsurance market is competitive and reflects significant market share in the U.S., U.K, and Europe being held bya small number of reinsurers.
Financial performanceTotal revenue increased $320 million or 15% from last year, mainly due to business growth, primarily in longevity reinsurance.
Premiums and deposits increased $268 million or 12%, reflecting growth in longevity reinsurance.
Selected highlights Table 31
(Millions of Canadian dollars) 2020 2019
Total revenue $ 2,387 $ 2,067Other information
Premiums and depositsLife and health $ 1,144 $ 1,254Property and casualty – (1)Annuity 1,313 936
Fair value changes on investmentsbacking policyholder liabilities (74) (112)
0
500
1,000
3,000
2,000
1,500
2,500
Life and health
2020 2019
Premiums and deposits (Millions of Canadian dollars)
Annuity
Investor & Treasury Services
Investor & Treasury Services is a specialist provider of asset services, a leader in Canadian cash management and transactionbanking services, and a provider of treasury services to institutional clients worldwide.
$4.5 trillion 15.9% $63 billionAssets under administration Return on equity Average client deposits
Revenue by Geography
Total revenue$2.3 billion
38% North America
33% Europe (Ex. U.K.)
16% U.K.
13% Asia-Pacific
We deliver asset, transaction banking, treasury, and other services to safeguardclient assets, maximize liquidity, and manage risk across multiple jurisdictions. Weremain focused on providing best-in-class asset services to sophisticatedinvestors. We compete against the world’s largest global custodians in selectedcountries in North America, Europe, the U.K., and Asia-Pacific.
We deliver digitally-enabled products and services which continue to be enhancedand evolved in line with our clients’ changing needs. We have top-rated globalcustody, transfer agency, fund accounting and administration services. We are aleading provider of Canadian dollar cash management, correspondent bankingand trade finance for financial institutions globally, and we provide short-termfunding and liquidity management for the bank.
42 Royal Bank of Canada: Annual Report 2020 Management’s Discussion and Analysis
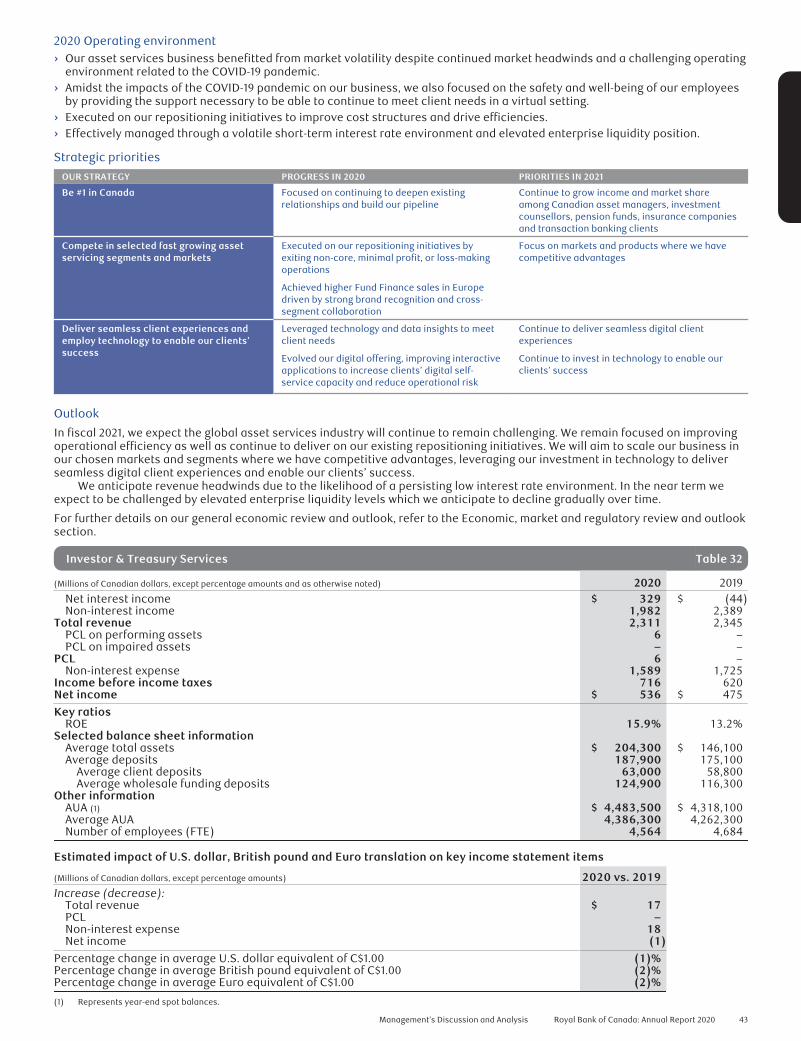
2020 Operating environment› Our asset services business benefitted from market volatility despite continued market headwinds and a challenging operating
environment related to the COVID-19 pandemic.› Amidst the impacts of the COVID-19 pandemic on our business, we also focused on the safety and well-being of our employees
by providing the support necessary to be able to continue to meet client needs in a virtual setting.› Executed on our repositioning initiatives to improve cost structures and drive efficiencies.› Effectively managed through a volatile short-term interest rate environment and elevated enterprise liquidity position.
Strategic priorities
OUR STRATEGY PROGRESS IN 2020 PRIORITIES IN 2021
Be #1 in Canada Focused on continuing to deepen existingrelationships and build our pipeline
Continue to grow income and market shareamong Canadian asset managers, investmentcounsellors, pension funds, insurance companiesand transaction banking clients
Compete in selected fast growing assetservicing segments and markets
Executed on our repositioning initiatives byexiting non-core, minimal profit, or loss-makingoperations
Achieved higher Fund Finance sales in Europedriven by strong brand recognition and cross-segment collaboration
Focus on markets and products where we havecompetitive advantages
Deliver seamless client experiences andemploy technology to enable our clients’success
Leveraged technology and data insights to meetclient needs
Evolved our digital offering, improving interactiveapplications to increase clients’ digital self-service capacity and reduce operational risk
Continue to deliver seamless digital clientexperiences
Continue to invest in technology to enable ourclients’ success
Outlook
In fiscal 2021, we expect the global asset services industry will continue to remain challenging. We remain focused on improvingoperational efficiency as well as continue to deliver on our existing repositioning initiatives. We will aim to scale our business inour chosen markets and segments where we have competitive advantages, leveraging our investment in technology to deliverseamless digital client experiences and enable our clients’ success.
We anticipate revenue headwinds due to the likelihood of a persisting low interest rate environment. In the near term weexpect to be challenged by elevated enterprise liquidity levels which we anticipate to decline gradually over time.
For further details on our general economic review and outlook, refer to the Economic, market and regulatory review and outlooksection.
Investor & Treasury Services Table 32
(Millions of Canadian dollars, except percentage amounts and as otherwise noted) 2020 2019Net interest income $ 329 $ (44)Non-interest income 1,982 2,389
Total revenue 2,311 2,345PCL on performing assets 6 –PCL on impaired assets – –
PCL 6 –Non-interest expense 1,589 1,725
Income before income taxes 716 620Net income $ 536 $ 475
Key ratiosROE 15.9% 13.2%
Selected balance sheet informationAverage total assets $ 204,300 $ 146,100Average deposits 187,900 175,100
Average client deposits 63,000 58,800Average wholesale funding deposits 124,900 116,300
Other informationAUA (1) $ 4,483,500 $ 4,318,100Average AUA 4,386,300 4,262,300Number of employees (FTE) 4,564 4,684
Estimated impact of U.S. dollar, British pound and Euro translation on key income statement items
(Millions of Canadian dollars, except percentage amounts) 2020 vs. 2019Increase (decrease):
Total revenue $ 17PCL –Non-interest expense 18Net income (1)
Percentage change in average U.S. dollar equivalent of C$1.00 (1)%Percentage change in average British pound equivalent of C$1.00 (2)%Percentage change in average Euro equivalent of C$1.00 (2)%
(1) Represents year-end spot balances.
Management’s Discussion and Analysis Royal Bank of Canada: Annual Report 2020 43

Financial performance2020 vs. 2019Net income increased $61 million or 13% from a year ago, as the prior year included severance and related costs associated withthe repositioning of the business. The repositioning of the business combined with the impact of ongoing efficiency initiativesalso resulted in lower staff-related costs in the current year. These factors were partially offset by lower client deposit revenue.
Total revenue decreased $34 million or 1%, mainly due to lower client deposit revenue as the growth in client depositvolumes was more than offset by margin compression. Lower funding and liquidity revenue also contributed to the decrease,largely driven by elevated enterprise liquidity, partially offset by higher gains from the disposition of securities and thefavourable impact of market volatility and interest rate movements. These factors were partially offset by the impact of foreignexchange translation.
Non-interest expense decreased $136 million or 8% as the prior year included severance and related costs associated withthe repositioning of the business. Lower staff-related costs including the benefit from ongoing efficiency initiatives alsocontributed to the decrease. These factors were partially offset by the impact of foreign exchange translation.
Capital Markets
RBC Capital Markets® is a premier global investment bank providing expertise in banking, finance and capital markets tocorporations, institutional investors, asset managers, governments and central banks around the world. Our professionalsensure that clients receive the advice, products, and services their businesses need from 58 offices in 14 countries. Our presenceextends across North America, the U.K. & Europe, and Australia, Asia & other regions.
> 15,500 #12 4,027Number of clients Global league table rankings1 Employees
Revenue by Geography
Total revenue$9.9 billion
53% U.S.
26% Canada
15% U.K. & Europe
6% Australia, Asia & other regions
We operate two main business lines, Corporate and Investment Banking andGlobal Markets.
In North America, we offer a full suite of products and services which includecorporate and investment banking, equity and debt origination and distribution,as well as sales and trading. In Canada, we are a market leader with a strategicpresence in all lines of capital markets businesses. In the U.S., we have a fullindustry sector coverage and investment banking product range and competewith large U.S. and global investment banks as well as smaller regional firms. Wehave leading capabilities in credit, secured lending, municipal finance, fixedincome, currencies & commodities, equities and advisory.
Outside North America, we have a select presence in the U.K. & Europe,Australia, Asia & other markets. In the U.K. & Europe, we offer a diversified set ofcapabilities in key sectors of expertise such as energy, mining, infrastructure,industrial, consumer, healthcare, technology and financial services. In Australiaand Asia, we compete with global and regional investment banks in targetedareas aligned to our global expertise, including fixed income distribution andcurrencies trading, secured finance and corporate and investment banking.
2020 Operating environment› The fiscal 2020 operating environment was characterized by unprecedented levels of market volatility and heightened
uncertainty as a result of the COVID-19 pandemic. In the first half of the fiscal year, our repo and interest rate tradingbusinesses capitalized on volatility as a result of the declining rate environment; however, this was partially offset by negativemark-to-market from widening credit spreads and significant market dislocation experienced in equity markets. As marketconditions began to improve in the latter half of the fiscal year, we benefitted from narrowing credit spreads and normalizationof equity markets in addition to strong client activity. Notwithstanding this, trading volumes remained higher throughout thefiscal year amidst elevated volatility.
› Global investment banking fee pools were up 14%1 as debt issuance activity reached record highs during the fiscal yearbenefitting from various government, regulatory and financial institution stimulus programs, reductions in benchmark interestrates and an increased demand for liquidity. Meanwhile, M&A and loan syndication activity was softer as a number oftransactions were put on hold amidst market uncertainty.
› In addition to supporting our clients during the evolution of the COVID-19 pandemic, we also focused on the safety and well-being of our employees by fully enabling them with the tools and technology to work effectively in a virtual setting while alsocarefully managing our return-to-premises approach.
› The credit environment was impacted by the COVID-19 pandemic which led to heightened uncertainty and sustained volatilityin the current year, resulting in elevated provisions on performing loans.
1 Source: Dealogic, based on global investment bank fees, Fiscal 2020
44 Royal Bank of Canada: Annual Report 2020 Management’s Discussion and Analysis

Strategic priorities
OUR STRATEGY PROGRESS IN 2020 PRIORITIES IN 2021
Deepen client relationships as an innovative,trusted partner
Continued to deepen long-term relationships withclients by providing value-added insights alignedwith our global capabilities:
• Acted as joint bookrunner in AT&T’s issuanceof $12.5 billion multi-tranche seniorunsecured notes. The transaction marks adeepening relationship with a strong focusclient
• Acted as bookrunner and joint lead arrangeron $23 billion of financing to back T-Mobile’sacquisition of Sprint
Be recognized by our clients as an innovative,trusted partner with best in class capabilities andexpertise
In our Investment Banking business, gain marketshare across all products by focusing on our topcorporate clients and largest private capital firmswhile continuing to deepen relationships and leadwith differentiated content
Lead with ideas, advice, and innovation Launched Aiden®, an AI-based electronic tradingplatform as part of our technology innovationinitiatives including data strategy,electronification, and AI
Acted as financial advisor to Cenovus Energy onits Strategic Combination with Husky Energy,valuing the combined business at ~$24 billion
Acted as exclusive financial advisor to Kraft Heinzon its agreement to sell its natural cheesebusiness to Groupe Lactalis for $3.2 billion
Provide clients with strategic Advisory &Origination and Client Trading products andservices while supporting them using the strengthof our lending capabilities
Deliver innovative trading solutions by investingin technology, machine learning and AI
Drive cross platform collaboration andconvergence
Continued to focus on deepening clientrelationships by driving cross-businesscollaboration across the enterprise
Acted as financial advisor to K+S on the sale of itsAmericas salt business to Stone CanyonIndustries, a transaction value of $3.2 billiondemonstrating collaborative effort across ourU.S. and European teams
Continue to encourage cross-platform and cross-geography collaboration and convergence acrossbusinesses and asset-classes
Continue to strengthen our senior coverageteams
Simplify our business and optimize ourfinancial resources
Provided capital to support our clients throughthe COVID-19 pandemic while maintaining adisciplined approach to managing costs and risk
Through our diversified business model, wereable to generate strong results in challengingmarket conditions
Focus on reviewing our cost base and fundingstrategy to drive efficiencies
Optimizing balance sheet and reallocatingresources to businesses that will support higherreturns on capital
Invest in talent, culture, and brand Successfully maintained #1 market share positionin Canada1 and ranked Best Investment Bank inCanada for the 13th year in a row2
Ranked as #1 Canadian Investment Bank in theU.S., with 2.3% market share1
In U.K. / Europe we were lead on a number ofinnovative and precedent setting mandates,benefitting from recent investments in this region,such as:
• Acted as the lead bank on an $8 billionsterling bond issue for the U.K. Government’sDebt Management Office, the largestgovernment mandate in history
Helped our clients achieve their sustainabilitygoals using the power of insights and ideas todeliver innovative advice and solutions
• Acted as exclusive financial advisor toGeneral Motors on a unique Electric VehicleFast Charging Partnership with EVgo,creating the largest fast charging networkacross the U.S.
Maintain our leadership position in Canada andour position as the Canadian leader in the U.S.,our largest market with the best opportunity forgrowth
Continue to be a leader in targeted areas in theU.K., Europe and Australia, Asia & other regionsaligned with our global expertise
Focus on strengthening our Global Diversity andInclusion Strategy
Continue to provide Environmental, Social andGovernance (ESG)-related and sustainabilityadvice to clients, including our commitment toachieve $100 billion in sustainable financing by2025
Outlook
In fiscal 2020, we were able to capitalize on market opportunities as our trading businesses benefitted from elevated levels ofvolatility and also saw strong debt issuance activity. In fiscal 2021, while we may see these conditions normalize, our focusremains on delivering robust results across our Global Markets franchise through continued resource optimization, accelerationof cross-selling activities, and building on our strong risk management practices. In our Investment Bank, we seek to grow ourmarket share with a continued focus on targeted sectors. As well, normalization of market conditions could result in tailwinds inM&A and loan syndication activity. We saw growth in our Corporate Banking business this fiscal year as we supported clientsthrough the COVID-19 pandemic. Most of these loan draws have been repaid throughout the latter part of the fiscal year. Goingforward we expect to see modest growth in this business with a continued focus on managing credit risk, risk-weighted assets(RWA) optimization, and the execution of client plans.
1 Source: Dealogic, based on global investment bank fees, Fiscal 20202 Source: Euromoney, 2020 Awards for Excellence
Management’s Discussion and Analysis Royal Bank of Canada: Annual Report 2020 45

For further details on our general economic review and outlook, refer to the Economic, market and regulatory review and outlooksection.
Capital Markets Table 33
(Millions of Canadian dollars, except percentage amounts and as otherwise noted) 2020 2019
Net interest income (1) $ 5,135 $ 4,043Non-interest income (1) 4,749 4,245
Total revenue (1) 9,884 8,288PCL on performing assets 750 36PCL on impaired assets 489 263
PCL 1,239 299Non-interest expense 5,362 5,096
Income before income taxes 3,283 2,893Net income $ 2,776 $ 2,666
Revenue by businessCorporate and Investment Banking $ 4,031 $ 3,792Global Markets 6,251 4,663Other (398) (167)
Key ratiosROE 11.7% 11.4%
Selected balance sheet informationAverage total assets $ 755,400 $ 666,500Average trading securities 108,300 102,100Average loans and acceptances, net 108,700 99,800Average deposits 76,800 77,300
Other informationNumber of employees (FTE) 4,027 4,269
Credit informationPCL on impaired loans as a % of average net loans and acceptances 0.44% 0.26%
Estimated impact of U.S. dollar, British pound and Euro translation on key income statement items
(Millions of Canadian dollars, except percentage amounts) 2020 vs. 2019Increase (decrease):
Total revenue $ 70PCL 27Non-interest expense 46Net income 1
Percentage change in average U.S. dollar equivalent of C$1.00 (1)%Percentage change in average British pound equivalent of C$1.00 (2)%Percentage change in average Euro equivalent of C$1.00 (2)%
(1) The teb adjustment for 2020 was $513 million (2019 – $450 million). For further discussion, refer to the How we measure and report our business segments section.
10,500
7,500
9,000
4,500
6,000
3,000
1,500
02020 2019
Revenue by region (Millions of Canadian dollars)
Australia, Asia & other regions U.K. & Europe U.S. Canada
Financial performance2020 vs. 2019Net income increased $110 million or 4% from a year ago, primarily driven by higher revenue in Global Markets and Corporate andInvestment Banking. These factors were partially offset by higher PCL, higher taxes due to an increase in the proportion of earningsfrom higher tax rate jurisdictions, lower Other revenue mainly reflecting higher residual funding costs, as well as higher compensationon improved results.
Total revenue increased $1,596 million or 19%, largely due to higher fixed income trading revenue across all regions driven byincreased client activity, and higher debt origination across most regions.
PCL increased $940 million, largely reflecting higher provisions on performing loans due to the impact of the COVID-19pandemic. Higher provisions on impaired loans also contributed to the increase, resulting in an increase of 18 bps in the impairedloans ratio, largely due to provisions taken in the oil & gas sector. For further details, refer to Credit quality performance in theCredit risk section.
Non-interest expense increased $266 million or 5%, largely due to higher compensation on improved results.
46 Royal Bank of Canada: Annual Report 2020 Management’s Discussion and Analysis

Business line review
Corporate and Investment Banking
Corporate and Investment Banking comprises our corporate lending, loan syndication, debt and equity origination, M&A advisoryservices, client securitization and the global credit businesses. For debt and equity origination, revenue is allocated betweenCorporate and Investment Banking and Global Markets based on the contribution of each group in accordance with anestablished agreement.
Financial performanceCorporate and Investment Banking revenue of $4,031 million increased $239 million or 6% as compared to last year.
Investment Banking revenue increased $85 million or 5%, primarily due to higher debt origination mainly in the U.S. andhigher equity origination across most regions. These factors were partially offset by lower fixed income trading revenue primarilyfrom loan underwriting markdowns in the U.S. and Europe.
Lending and other revenue increased $154 million or 7%, reflecting average volume growth mainly in Europe and the U.S.
Selected highlights Table 34
(Millions of Canadian dollars) 2020 2019
Total revenue (1) $ 4,031 $ 3,792Breakdown of revenue (1)
Investment banking $ 1,757 $ 1,672Lending and other (2) 2,274 2,120
Other informationAverage assets $ 92,600 $ 86,400Average loans and acceptances, net 83,000 76,700
(1) The teb adjustment for the year ended October 31, 2020 was $56 million(October 31, 2019 – $80 million). For further discussion, refer to the How wemeasure and report our business segments section.
(2) Comprises our corporate lending, client securitization, and global creditbusinesses.
0500
1,000
4,500
1,5002,0002,5003,0003,5004,000
2020 2019
Investment banking Lending and other
Breakdown of total revenue (Millions of Canadian dollars)
Global Markets
Global Markets comprises our fixed income, foreign exchange, equity sales and trading, repo and secured financing andcommodities businesses.
Financial performanceTotal revenue of $6,251 million increased $1,588 million or 34% as compared to last year.
Revenue in our Fixed income, currencies and commodities business increased $1,093 million or 51%, largely driven by higherfixed income trading revenue across all regions and higher debt origination across most regions.
Revenue in our Equities business increased $237 million or 20%, primarily due to higher equity trading revenue mainly in theU.S. and higher equity origination across all regions.
Revenue in our Repo and secured financing business increased $258 million or 19%, mainly due to increased client activity.
Selected highlights Table 35
(Millions of Canadian dollars) 2020 2019
Total revenue (1) $ 6,251 $ 4,663Breakdown of revenue (1)
Fixed income, currenciesand commodities $ 3,243 $ 2,150
Equities 1,403 1,166Repo and secured financing (2) 1,605 1,347
Other informationAverage assets $667,900 $583,700
(1) The teb adjustment for the year ended October 31, 2020 was $457 million(October 31, 2019 – $370 million). For further discussion, refer to the How wemeasure and report our business segments section.
(2) Comprises our secured funding businesses for internal businesses andexternal clients.
0
1,000
2,000
7,000
3,000
4,000
5,000
6,000
2020 2019
Repo and securedfinancing
Global equities Fixed income, currenciesand commodities
Breakdown of total revenue (Millions of Canadian dollars)
Other
Other includes our legacy portfolio, which mainly consists of our U.S. commercial mortgage-backed securities (MBS), bank-owned life insurance (BOLI) derivative contracts and structured rates in Asia.
Financial performanceRevenue decreased $231 million as compared to last year, largely due to higher residual funding costs and losses in our legacyU.S. portfolios.
Management’s Discussion and Analysis Royal Bank of Canada: Annual Report 2020 47

Corporate Support
Corporate Support consists of Technology & Operations, which provides the technological and operational foundation requiredto effectively deliver products and services to our clients, Functions, which includes our finance, human resources, riskmanagement, internal audit and other functional groups, as well as our Corporate Treasury function. Reported results forCorporate Support mainly reflect certain activities related to monitoring and oversight of enterprise activities which are notallocated to business segments. For further details, refer to the How we measure and report our business segments section.
Corporate Support Table 36
(Millions of Canadian dollars) 2020 2019Net interest income (loss) (1) $ (57) $ 104Non-interest income (loss) (1) (269) (453)
Total revenue (1) (326) (349)PCL 1 –Non-interest expense 57 131
Income (loss) before income taxes (1) (384) (480)Income taxes (recoveries) (1) (436) (452)
Net income (loss) $ 52 $ (28)(1) Teb adjusted.
Due to the nature of activities and consolidation adjustments reported in this segment, we believe that a comparative periodanalysis is not relevant. The following identifies material items affecting the reported results in each year.
Total revenue and income taxes (recoveries) in each period in Corporate Support include the deduction of the teb adjustmentsrelated to the gross-up of income from Canadian taxable corporate dividends and the U.S. tax credit investment business recordedin Capital Markets. The amount deducted from revenue was offset by an equivalent increase in income taxes (recoveries).
The teb amount for the year ended October 31, 2020 was $513 million and was $450 million last year.
The following identifies the material items, other than the teb impacts noted previously, affecting the reported results in each year.
2020Net income was $52 million, largely due to asset/liability management activities, partially offset by net unfavourable taxadjustments and residual unallocated costs.
2019Net loss in the prior year was $28 million, largely due to the impact of an unfavourable accounting adjustment, residualunallocated costs and unfavourable tax impacts, partially offset by asset/liability management activities.
Quarterly financial information
Fourth quarter performance
Q4 2020 vs. Q4 2019Fourth quarter net income of $3,246 million was up $40 million or 1% from last year. Diluted EPS of $2.23 was up $0.05 and ROE of16.0% was down 20 bps. Higher results in Capital Markets, Corporate Support and Investor & Treasury Services were largelyoffset by lower earnings in Wealth Management, Personal & Commercial Banking, and Insurance.
Total revenue decreased $278 million or 2%, largely due to the impact of lower interest rates in Personal & CommercialBanking and Wealth Management, the change in fair value of investments backing policyholder liabilities, which is largely offsetin PBCAE as indicated below, and a gain in the prior year on the sale of the private debt business of BlueBay of $151 million. Thesefactors were partially offset by volume growth in Canadian Banking and Wealth Management and higher equity trading revenueprimarily in the U.S. reflecting favourable market conditions and increased client activity.
Total PCL decreased $72 million or 14% and PCL on loans ratio of 23 bps decreased 9 bps from last year, primarily due to lowerprovisions in Personal & Commercial Banking and Capital Markets, partially offset by higher provisions in Wealth Management.
PBCAE decreased $193 million or 30%, mainly reflecting the change in fair value of investments backing policyholderliabilities, higher favourable investment-related experience and lower claims costs. These factors were partially offset byunfavourable annual actuarial assumption updates in the current year largely related to mortality experience, lower favourablelongevity reinsurance contracts, business growth, and the lower impact from reinsurance contract renegotiations.
Non-interest expense decreased $261 million or 4%, as the prior year included severance and related costs associated withthe repositioning of our Investor & Treasury Services business. Lower discretionary spend, lower variable compensation and theimpact of an unfavourable accounting adjustment in the prior year in Corporate Support also contributed to the decrease. Thesefactors were partially offset by an increase in technology and related costs, including digital initiatives, and incrementalCOVID-19 related operating costs.
Income tax expense increased $208 million or 30% and the effective income tax rate of 21.7% increased 390 bps from lastyear, mainly due to a decrease in income from lower tax rate jurisdictions in the current quarter and the impact of favourable taxadjustments in the same quarter last year.
Q4 2020 vs. Q3 2020Net income of $3,246 million was up $45 million or 1% compared to the prior quarter, primarily due to lower PCL and lowervariable compensation on decreased revenue. Higher average fee-based client assets, largely driven by market appreciation andnet sales, also contributed to the increase. These factors were partially offset by lower fixed income trading revenue in CapitalMarkets and higher technology and related costs, including digital initiatives.
48 Royal Bank of Canada: Annual Report 2020 Management’s Discussion and Analysis

Quarterly results and trend analysis
Our quarterly results are impacted by a number of trends and recurring factors, which include seasonality of certain businesses,general economic and market conditions, and fluctuations in the Canadian dollar relative to other currencies. The following tablesummarizes our results for the last eight quarters (the period):
Quarterly results (1) Table 37
2020 2019
(Millions of Canadian dollars, except pershare and percentage amounts) Q4 Q3 Q2 Q1 Q4 Q3 Q2 Q1
Personal & Commercial Banking $ 4,373 $ 4,348 $ 4,400 $ 4,610 $ 4,568 $ 4,546 $ 4,333 $ 4,418Wealth Management 3,068 3,164 2,822 3,166 3,187 3,029 2,979 2,948Insurance 958 2,212 197 1,994 1,153 1,463 1,515 1,579Investor & Treasury Services 521 484 709 597 566 561 587 631Capital Markets (2) 2,275 2,748 2,313 2,548 1,987 2,034 2,169 2,098Corporate Support (2) (103) (36) (108) (79) (91) (89) (84) (85)
Total revenue $ 11,092 $ 12,920 $ 10,333 $ 12,836 $ 11,370 $ 11,544 $ 11,499 $ 11,589PCL 427 675 2,830 419 499 425 426 514PBCAE 461 1,785 (177) 1,614 654 1,046 1,160 1,225Non-interest expense 6,058 6,380 5,942 6,378 6,319 5,992 5,916 5,912
Income before income taxes $ 4,146 $ 4,080 $ 1,738 $ 4,425 $ 3,898 $ 4,081 $ 3,997 $ 3,938Income taxes 900 879 257 916 692 818 767 766
Net income $ 3,246 $ 3,201 $ 1,481 $ 3,509 $ 3,206 $ 3,263 $ 3,230 $ 3,172
EPS – basic $ 2.23 $ 2.20 $ 1.00 $ 2.41 $ 2.19 $ 2.23 $ 2.20 $ 2.15– diluted 2.23 2.20 1.00 2.40 2.18 2.22 2.20 2.15
Effective income tax rate 21.7% 21.5% 14.8% 20.7% 17.8% 20.0% 19.2% 19.5%Period average US$ equivalent
of C$1.00 $ 0.756 $ 0.737 $ 0.725 $ 0.760 $ 0.755 $ 0.754 $ 0.751 $ 0.749(1) Fluctuations in the Canadian dollar relative to other foreign currencies have affected our consolidated results over the period.(2) Teb adjusted. For further discussion, refer to the How we measure and report our business segments section.
SeasonalitySeasonal factors may impact our results in certain quarters. The first quarter has historically been stronger for our CapitalMarkets businesses. The second quarter has fewer days than the other quarters, which generally results in a decrease in netinterest income and certain expense items. The third and fourth quarters include the summer months which generally results inlower client activity and may negatively impact the results of our Capital Markets brokerage business.
Trend analysisEarnings have generally trended upward over the period. However, earnings in the second quarter of 2020 reflected the impact ofthe onset of the COVID-19 pandemic across all of our business segments which resulted in a significant increase in PCL andfluctuations in revenue from the impact of market volatility, including interest rates and credit spreads, as well as client activity.While market conditions improved in the latter part of 2020, our earnings continued to be impacted by the COVID-19 pandemicand its associated downstream implications. Quarterly earnings are also affected by the impact of foreign exchange translation.
Personal & Commercial Banking revenue has benefitted from solid volume growth over the period. Spreads in the early partof the period reflected higher interest rates, whereas the latter part of the period primarily reflected spread compression in alower interest rate environment. The ongoing impact of competitive pricing pressures has negatively impacted spreadsthroughout the majority of the period. NIM in Canadian Banking has generally declined over the latter part of the period, largelyreflecting the impact of lower interest rates, including cumulative BoC rate cuts of 150 bps in the second quarter of 2020. Inaddition, the latter part of the period saw lower card service revenue mainly driven by a decrease in purchase volumes.
Wealth Management revenue has generally trended upwards reflecting growth in average fee-based client assets primarilydriven by net sales and market appreciation. Net interest income benefitted from volume growth and the impact of higherinterest rates in the early part of the period and declined in the latter part of the period as continued volume growth was morethan offset by lower spreads, mainly reflecting the impact of the U.S. Fed rate cuts. A gain on the sale of the private debt businessof BlueBay contributed to the increase in revenue in the fourth quarter of 2019. Changes in the fair value of hedges related to ourU.S. share-based compensation plans, which are largely offset in Non-interest expense, have contributed to fluctuations inrevenue over the period. The market volatility in the second quarter of 2020 and subsequent improvement in market conditions inthe third quarter of 2020 resulted in heightened fluctuations in these hedges, as well as in average fee-based client assets andthe fair value of interest rate derivatives and seed capital investments.
Insurance revenue has fluctuated over the period, primarily due to the impact of changes in the fair value of investmentsbacking policyholder liabilities which is largely offset in PBCAE. Revenue has benefitted from business growth in Canadian andInternational Insurance over the majority of the period. The first quarter of 2019 and 2020 also reflect higher group annuity sales.
Investor & Treasury Services revenue has been impacted by fluctuations in market conditions and client activity across theperiod. Revenue from our funding and liquidity business has fluctuated over the period, with the latter part of the period impacted byelevated enterprise liquidity. During the first half of 2019 our asset services business was impacted by challenging market conditions,whereas the latter half of the period was generally impacted by lower client activity and lower client deposit margins. The fluctuationin the second and third quarter of 2020 reflects the impact of interest rate movements and market volatility in the second quarter of2020, with the second quarter benefitting from declining interest rates and market volatility, including gains on the disposition ofsecurities. Revenue in the third quarter of 2020 experienced a partial offset of the impact of short-term interest rate movements in thesecond quarter of 2020.
Management’s Discussion and Analysis Royal Bank of Canada: Annual Report 2020 49

Capital Markets revenue is influenced, to a large extent, by market conditions that impact client activity in our Corporate andInvestment Banking and Global Markets businesses, with first quarter results generally stronger than those in the remainingquarters. Client activity in 2019 was impacted by challenging market conditions resulting in lower investment banking feerevenues experienced across the industry. The impact of challenging market conditions also resulted in lower equity tradingrevenue across much of the latter part of 2019. The first quarter of 2020 saw more favourable market conditions and increasedclient activity resulting in higher fixed income trading revenue and M&A activity. Elevated market volatility in the second quarterof 2020 resulted in increased client activity being more than offset by lower fixed income trading revenue, which included theimpact of loan underwriting markdowns. The third quarter of 2020 saw higher fixed income trading revenue primarily driven byreversals of loan underwriting markdowns and higher equity trading revenue, reflecting an improvement in market conditions aswell as increased client activity. The fourth quarter of 2020 also benefitted from favourable market conditions and increasedclient activity relative to 2019 levels.
PCL on performing assets has fluctuated over the period as it is impacted by macroeconomic conditions, changes inportfolio balances and credit quality, and model changes. The impact of the COVID-19 pandemic also resulted in a significantincrease in provisions in 2020, largely in the second quarter. PCL on impaired assets reflected normalized levels of credit lossestowards the end of 2019, though the first quarter of 2020 saw lower provisions on impaired loans in Personal & CommercialBanking and Wealth Management. The remainder of the year saw higher provisions on impaired loans in Capital Markets largelyin the oil & gas sector. The impact of government support and payment deferral programs contributed to lower provisions onimpaired loans in our Canadian Banking retail portfolios in the second half of 2020.
PBCAE has fluctuated quarterly as it includes the impact of changes in the fair value of investments backing policyholderliabilities and business growth, including the impact of group annuity sales, both of which are largely offset in Revenue. PBCAEhas also fluctuated due to investment-related experience and claims costs over the period, and reflects higher travel claimscosts in the second and third quarters of 2020 associated with the COVID-19 pandemic. PBCAE has been positively impacted byfavourable reinsurance contract renegotiations over the period. Actuarial adjustments, which generally occur in the fourthquarter of each year, also impact PBCAE.
While we continue to focus on efficiency management activities, Non-interest expense trended upwards over majority of theperiod. Growth mainly reflects higher costs in support of business growth and our ongoing investments in technology and relatedcosts, including digital initiatives, and higher staff-related costs, including variable compensation. The increase in the fourth quarterof 2019 reflected severance and related costs associated with the repositioning of our Investor & Treasury Services business. Thesecond quarter of 2020 reflected lower variable compensation on decreased results and the impact of elevated market volatilitywhich resulted in unfavourable changes in the fair value of our U.S. share-based compensation plans that subsequently reversed inthe third quarter of 2020 as market conditions improved. The change in the fair value of our U.S. share-based compensation plans islargely offset in revenue. Beginning in the second quarter of 2020, Non-interest expense was also impacted by additionalcompensation for certain employees, primarily those client-facing amidst the COVID-19 pandemic, as well as other incrementalCOVID-19 related costs, which were more than offset by lower discretionary spend over that period.
Our effective income tax rate has fluctuated over the period, mostly due to varying levels of tax adjustments and changes inearnings mix. The first quarter of 2019 included a write-down of deferred tax assets resulting from a change in the corporate taxrate in Barbados. The second quarter of 2020 saw a decrease mainly due to a higher proportion of tax exempt income and incomefrom lower tax rate jurisdictions relative to lower earnings in that quarter.
Financial condition
Condensed balance sheets
Table 38
As at October 31 (Millions of Canadian dollars) 2020 2019AssetsCash and due from banks $ 118,888 $ 26,310Interest-bearing deposits with banks 39,013 38,345Securities, net of applicable allowance (1) 275,814 249,004Assets purchased under reverse repurchase agreements and securities borrowed 313,015 306,961Loans
Retail 457,976 426,086Wholesale 208,655 195,870
Allowance for loan losses (5,639) (3,100)Other – Derivatives 113,488 101,560
– Other (2) 103,338 87,899
Total assets $ 1,624,548 $ 1,428,935
LiabilitiesDeposits $ 1,011,885 $ 886,005Other – Derivatives 109,927 98,543
– Other (2) 406,102 350,947Subordinated debentures 9,867 9,815
Total liabilities 1,537,781 1,345,310
Equity attributable to shareholders 86,664 83,523Non-controlling interests 103 102
Total equity 86,767 83,625
Total liabilities and equity $ 1,624,548 $ 1,428,935(1) Securities are comprised of trading and investment securities.(2) Other – Other assets and liabilities include Segregated fund net assets and liabilities, respectively.
50 Royal Bank of Canada: Annual Report 2020 Management’s Discussion and Analysis

2020 vs. 2019Total assets increased $196 billion or 14% from last year. Foreign exchange translation increased total assets by $15 billion.
Cash and due from banks was up $93 billion, mainly due to higher deposits with central banks, reflecting our short term cashand liquidity management activities.
Securities, net of applicable allowance, were up $27 billion or 11%, primarily due to higher government debt securities largelydriven by our liquidity management activities.
Assets purchased under reverse repurchase agreements (reverse repos) and securities borrowed increased $6 billion or 2%,driven by client activity and lower financial netting, partially offset by lower liquidity management activities.
Loans (net of Allowance for loan losses) were up $42 billion or 7%, largely due to volume growth in residential mortgages.Higher wholesale loans, in part to support our clients during this unprecedented time, also contributed to the increase.
Derivative assets were up $12 billion or 12%, mainly attributable to higher fair values on interest rate contracts and equitycontracts. The impact of foreign exchange translation also contributed to the increase. These factors were partially offset bylower fair values on foreign exchange contracts.
Other assets were up $15 billion or 18%, largely reflecting an increase in premises and equipment as a result of adopting IFRS16. Higher margin requirements and an increase in both cash collateral and our precious metals inventory also contributed to theincrease.
Total liabilities increased $192 billion or 14% from last year. Foreign exchange translation increased total liabilities by$15 billion.
Deposits increased $126 billion or 14%, mainly as a result of higher business and retail deposits driven by both lower clientspending and our clients’ preference for the safety of higher cash balances amidst the COVID-19 pandemic. Higher bank depositsand the impact of foreign exchange translation also contributed to the increase.
Derivative liabilities were up $11 billion or 12%, mainly attributable to higher fair values on interest rate contracts and equitycontracts, partially offset by lower fair values on foreign exchange contracts.
Other liabilities increased $55 billion or 16%, mainly attributable to higher obligations related to repurchase agreementsreflecting increased funding activities and lower financial netting.
Total equity increased $3 billion or 4% reflecting earnings, net of dividends and share repurchases, and the issuance oflimited recourse capital notes partially offset by both redemptions of preferred shares and the impact of lower interest rates oncash flow hedges.
Off-balance sheet arrangements
In the normal course of business, we engage in a variety of financial transactions that, for accounting purposes, are not recordedon our Consolidated Balance Sheets. Off-balance sheet transactions are generally undertaken for risk, capital and fundingmanagement purposes which benefit us and our clients. These include transactions with structured entities and may also includethe issuance of guarantees. These transactions give rise to, among other risks, varying degrees of market, credit, liquidity andfunding risk, which are discussed in the Risk management section.
We use structured entities to securitize our financial assets as well as assist our clients in securitizing their financial assets.These entities are not operating entities, typically have no employees, and may or may not be recorded on our ConsolidatedBalance Sheets.
In the normal course of business, we engage in a variety of financial transactions that may qualify for derecognition. Weapply the derecognition rules to determine whether we have transferred substantially all the risks and rewards or controlassociated with the financial assets to a third party. If the transaction meets specific criteria, it may qualify for full or partialderecognition from our Consolidated Balance Sheets.
Securitizations of our financial assetsWe periodically securitize our credit card receivables and residential and commercial mortgage loans primarily to diversify ourfunding sources, enhance our liquidity position and for capital purposes. We also securitize residential and commercialmortgage loans as part of our sales and trading activities.
We securitize our credit card receivables, on a revolving basis, through a consolidated structured entity. We securitize singleand multiple-family residential mortgages through the National Housing Act Mortgage-Backed Securities (NHA MBS) program.The majority of our securitization activities are recorded on our Consolidated Balance Sheets as we do not meet thederecognition criteria. During 2020 and 2019, we did not derecognize any mortgages securitized through the NHA MBS program.For further details, refer to Note 6 and Note 7 of our 2020 Annual Consolidated Financial Statements.
We also periodically securitize commercial mortgage loans by selling them in collateral pools, which meet certaindiversification, leverage and debt coverage criteria, to structured entities, one of which is sponsored by us. Securitizedcommercial mortgage loans are derecognized from our Consolidated Balance Sheets as we have transferred substantially all ofthe risks and rewards of ownership of the securitized assets. During the year ended October 31, 2020, we securitized $469 millionof commercial mortgages (October 31, 2019 – $696 million). Our continuing involvement with the transferred assets is limited toservicing certain of the underlying commercial mortgages sold. As at October 31, 2020, there was $2.0 billion of commercialmortgages outstanding that we continue to service related to these securitization activities (October 31, 2019 – $1.9 billion).
Involvement with unconsolidated structured entitiesIn the normal course of business, we engage in a variety of financial transactions with structured entities to support ourcustomers’ financing and investing needs, including securitization of our clients’ financial assets, creation of investmentproducts, and other types of structured financing.
We have the ability to use credit mitigation tools such as third-party guarantees, credit default swaps, and collateral tomitigate risks assumed through securitization and re-securitization exposures. The process in place to monitor the credit qualityof our securitization and re-securitization exposures involves, among other things, reviewing the performance data of theunderlying assets. We affirm our ratings each quarter and formally confirm or assign a new rating at least annually. For furtherdetails on our activities to manage risks, refer to the Risk management section.
Management’s Discussion and Analysis Royal Bank of Canada: Annual Report 2020 51

Below is a description of our activities with respect to certain significant unconsolidated structured entities. For a completediscussion of our interests in consolidated and unconsolidated structured entities, refer to Note 7 of our 2020 AnnualConsolidated Financial Statements.
RBC-administered multi-seller conduitsWe administer multi-seller conduits which are used primarily for the securitization of our clients’ financial assets. Our clientsprimarily use our multi-seller conduits to diversify their financing sources and to reduce funding costs by leveraging the value ofhigh-quality collateral. The conduits offer us a favourable revenue stream and risk-adjusted return.
We provide services such as transaction structuring, administration, backstop liquidity facilities and partial creditenhancements to the multi-seller conduits. Revenue for all such services amounted to $277 million during the year (October 31,2019 – $254 million).
Our total commitment to the conduits in the form of backstop liquidity and credit enhancement facilities is shown below. Thetotal committed amount of these facilities exceeds the total amount of the maximum assets that may have to be purchased bythe conduits under the purchase agreements. As a result, the maximum exposure to loss attributable to our backstop liquidityand credit enhancement facilities is less than the total committed amounts of these facilities.
Liquidity and credit enhancement facilities Table 39
2020 2019
As at October 31 (Millions of Canadian dollars)
Notional ofcommitted
amounts (1)
Allocablenotionalamounts
Maximumexposure
to loss (2)
Notional ofcommitted
amounts (1)
Allocablenotionalamounts
Maximumexposure
to loss (2)
Backstop liquidity facilities $ 42,803 $ 40,137 $ 40,137 $ 37,935 $ 36,229 $ 36,229Credit enhancement facilities (3) 2,666 2,666 2,666 1,706 1,706 1,706
Total $ 45,469 $ 42,803 $ 42,803 $ 39,641 $ 37,935 $ 37,935
(1) Based on total committed financing limit.(2) Not presented in the table above are derivative assets with a fair value of $60 million (October 31, 2019 – $97 million) which are a component of our total maximum
exposure to loss from our interests in the multi-seller conduits. Refer to Note 7 of our 2020 Annual Consolidated Financial Statements for more details.(3) Includes $2 million (October 31, 2019 - $14 million) of Financial standby letters of credit.
As at October 31, 2020, the notional amount of backstop liquidity facilities we provide increased by $4.9 billion or 13% from lastyear. The increase as compared to last year was primarily due to an increase in outstanding securitized assets in the multi-sellerconduits. The notional amount of partial credit enhancement facilities we provide increased by $960 million from last year. Theincrease as compared to last year was primarily due to a change in the methodology used to size the available amount under thecredit enhancement facility.
Maximum exposure to loss by client type Table 40
2020 2019As at October 31 (Millions of dollars) US$ C$ Total C$ US$ C$ Total C$
Outstanding securitized assetsAuto and truck loans and leases $ 10,163 $ 3,738 $ 17,277 $ 9,003 $ 2,882 $ 14,738Consumer loans 2,869 – 3,823 2,150 – 2,831Credit cards 4,070 510 5,932 4,258 510 6,117Dealer floor plan receivables 889 858 2,042 910 878 2,077Equipment receivables 2,349 – 3,129 1,479 – 1,948Fleet finance receivables 715 245 1,197 602 306 1,099Insurance premiums 216 428 716 213 286 566Residential mortgages – 864 864 – 1,014 1,014Student loans 1,956 – 2,606 1,777 – 2,340Trade receivables 2,445 – 3,258 2,338 – 3,079Transportation finance 1,394 102 1,959 1,498 153 2,126
Total $ 27,066 $ 6,745 $ 42,803 $ 24,228 $ 6,029 $ 37,935
Canadian equivalent $ 36,058 $ 6,745 $ 42,803 $ 31,906 $ 6,029 $ 37,935
Our overall exposure increased by 13% compared to last year, reflecting an increase in the outstanding securitized assets of themulti-seller conduits. Correspondingly, total assets of the multi-seller conduits increased by $4.8 billion or 13% from last year,primarily due to increases in the Auto and truck loans and leases, Equipment receivables and Consumer loans asset classes. Themajority of the multi-seller conduits assets were internally rated A or above, consistent with the prior year. All transactionsfunded by the unconsolidated multi-seller conduits are internally rated using a rating system as outlined in the internal ratingsmap in the credit risk section.
Multiple independent debt rating agencies review all of the transactions in the multi-seller conduits. Transactions financedin the U.S. multi-seller conduits are reviewed by Moody’s Investors Service (Moody’s), Standard & Poor’s (S&P) and Fitch Ratings(Fitch). Transactions in the Canadian multi-seller conduits are reviewed by Dominion Bond Rating Service (DBRS) and Moody’s.Each applicable rating agency also reviews ongoing transaction performance on a monthly basis and may publish reportsdetailing portfolio and program information related to the conduits.
As at October 31, 2020, the total asset-backed commercial paper (ABCP) issued by the conduits amounted to $23.4 billion, adecrease of $346 million or 1% from last year. The decrease in the amount of ABCP issued by the multi-seller conduits comparedto last year is primarily due to lower client usage. The rating agencies that rate the ABCP rated 100% (October 31, 2019 – 100%) ofthe total amount issued within the top ratings category.
52 Royal Bank of Canada: Annual Report 2020 Management’s Discussion and Analysis

Structured financeWe invest in auction rate securities (ARS) of certain trusts which fund their long-term investments in student loans by issuingshort-term senior and subordinated notes. Our maximum exposure to loss in these ARS trusts as at October 31, 2020 was$46 million (October 31, 2019 – $60 million). The decrease in our maximum exposure to loss was primarily related to sales to thirdparties and redemptions.
We also provide liquidity facilities to certain municipal bond Tender Option Bond (TOB) trusts in which we have an interestbut do not consolidate because the residual certificates issued by the TOB trusts are held by third parties. As at October 31, 2020,our maximum exposure to loss from these unconsolidated municipal bond TOB trusts was $2.9 billion (October 31, 2019 –$3.1 billion). The decrease in our maximum exposure to loss relative to last year was primarily due to third-party trust unwindsthroughout the year.
We provide senior warehouse financing to discrete unaffiliated structured entities that are established by third parties toacquire loans and issue term collateralized loan obligations (CLO). A portion of the proceeds from the sale of the term CLO isused to fully repay the senior warehouse financing that we provide. As at October 31, 2020, our maximum exposure to lossassociated with the outstanding senior warehouse financing facilities was $88 million (October 31, 2019 – $253 million). Thedecrease in our maximum exposure to loss relative to last year was related to the repayment of existing financing facilities.
We provide senior financing to unaffiliated structured entities that are established by third parties to acquire loans. Thesefacilities tend to be longer in term than the CLO warehouse facilities and benefit from credit enhancement designed to cover amultiple of historical losses. As at October 31, 2020, our maximum exposure to loss associated with the outstanding seniorfinancing facilities was $3.1 billion (October 31, 2019 – $2.8 billion). The increase in our maximum exposure to loss relative to lastyear was driven by increased client utilization and the addition of new financing facilities.
Investment fundsWe invest in hedge funds primarily to provide clients with desired exposures to reference funds. As we make investments in thereference funds, exposures to the funds are simultaneously transferred to clients through derivative transactions. Our maximumexposure to loss in the reference funds is limited to our investments in the funds. As at October 31, 2020, our maximum exposureto loss was $2.3 billion (October 31, 2019 – $1.8 billion). The increase in our maximum exposure to loss relative to last year was dueto increased holdings in third-party investment funds.
We also provide liquidity facilities to certain third-party investment funds. The funds issue unsecured variable-rate preferredshares and invest in portfolios of tax exempt bonds. As at October 31, 2020, our maximum exposure to these funds was$278 million (October 31, 2019 – $275 million).
Third-party securitization vehiclesWe hold interests in certain unconsolidated third-party securitization vehicles, which are structured entities. We, as well as otherfinancial institutions, are obligated to provide funding to these entities up to our maximum commitment level and are exposed tocredit losses on the underlying assets after various credit enhancements. As at October 31, 2020, our maximum exposure to lossin these entities was $10.4 billion (October 31, 2019 – $10.7 billion). The decrease in our maximum exposure to loss compared tolast year reflects a decrease in the securitized assets in these entities, partially offset by the impact of foreign exchangetranslation. Interest and non-interest income earned in respect of these investments was $112 million (October 31, 2019 –$195 million).
Guarantees, retail and commercial commitmentsWe provide our clients with guarantees and commitments that expose us to liquidity and funding risks. Our maximum potentialamount of future payments in relation to our commitments and guarantee products as at October 31, 2020 amounted to$386.7 billion compared to $380.3 billion last year. The increase compared to last year was primarily driven by growth in othercommitments to extend credit, backstop liquidity facilities and sponsored member guarantees partially offset by a reduction insecurities lending indemnifications. Refer to Liquidity and funding risk and Note 24 of our 2020 Annual Consolidated FinancialStatements for details regarding our guarantees and commitments.
Risk management
We are in the business of managing the risks inherent to the financial services industry as we aim to create maximum value forour shareholders, clients, employees and communities. The ability to manage risk is a core competency of the bank, and issupported by our strong risk conduct and risk-aware culture. Our view of risks is dynamic, and reflects the pace of change in thefinancial services industry.
Top and emerging risks
An important component of our risk management approach is to ensure that top and emerging risks, as they evolve, areidentified, managed, and incorporated into our existing risk management assessment, measurement, monitoring and escalationprocesses. These practices are intended to ensure a forward-looking risk assessment is maintained by management in the courseof business development and as part of the execution of ongoing risk oversight responsibilities. Top and emerging risks arediscussed by senior management and the Board on a regular basis.
Management’s Discussion and Analysis Royal Bank of Canada: Annual Report 2020 53

We have developed supplementary internal guidance to support enterprise-wide identification and assessment of allmaterial risks, including those that are not readily apparent. Top and emerging risks encompass those that could materiallyimpact our financial results, reputation, business model, or strategy in the short to medium term, as well as those that couldpotentially impact us as the risks evolve. In addition to the Impact of pandemic risk factor outlined in the Significantdevelopments: COVID-19 section, the following represents our top and emerging risks:
Top & emerging risks Description
Business and economicconditions
Our financial results may be affected to varying degrees by the general business and economicconditions in the geographic regions in which we operate. These conditions may include factors such asconsumer saving and spending habits as well as consumer borrowing and repayment patterns,unemployment rates, the impact of containment measures associated with the COVID-19 pandemic orother health crises on businesses’ operations, the level of business investment and overall businesssentiment, the level of government spending as well as fiscal and monetary stimulus, the level of activityand volatility of the financial markets, and inflation. For example, economic downturns may result inhigher unemployment rates and lower household incomes, lower corporate earnings, changes inbusiness investment and consumer spending, and could adversely affect our business, including but notlimited to the demand for our loan and other products and result in lower earnings, including highercredit losses.
Our financial results are also sensitive to changes in interest rates, as described in the Systemic risksection, and to weaker investor confidence and market conditions, which may lead to lower clientactivity and unfavourable changes in earnings.
Additional risks are emerging around how countries will seek to recoup the unprecedented levels ofstimulus measures introduced in response to the COVID-19 pandemic and balance budgets in the future,and around the potential implications that a prolonged low interest rate environment will have, forexample, on increasing wealth inequality and extended retirement ages, among others.
For details on how we are managing our risks associated with the COVID-19 pandemic, refer to the Impactof pandemic risk factor in the Significant developments: COVID-19 section of this 2020 Annual Report.
Information technology andcyber risks
Information technology (IT) and cyber risks remain top risks, not only for the financial services sector,but for other industries worldwide. We continue to be subject to heightened risks in the form of cyber-attacks, data breaches, cyber extortion and similar compromises, due to: (i) the size, scale, and globalnature of our operations; (ii) our heavy reliance on the internet to conduct day-to-day businessactivities; (iii) our intricate technological infrastructure; and (iv) our use of third-party service providers.Additionally, clients’ use of personal devices can create further avenues for potential cyber-relatedincidents, as the bank has little or no control over the safety of these devices. IT and cyber risks haveincreased during the COVID-19 pandemic, as increased malicious activities are creating more threats forcyberattacks including COVID-19 phishing emails, malware-embedded mobile apps that purport to trackinfection rates, and targeting of vulnerabilities in remote access platforms as many companies continueto operate with work from home arrangements. Resulting implications could include businessinterruptions, service disruptions, financial loss, theft of intellectual property and confidentialinformation, litigation, enhanced regulatory attention and penalties, as well as reputational damage.Furthermore, the adoption of emerging technologies, such as cloud computing, AI and robotics, call forcontinued focus and investment to manage risks effectively. For more details on how we are managingthese risks, refer to the Operational risk section.
Canadian housing andhousehold indebtedness
Canadian housing and household indebtedness risks are heightened as a result of a rise inunemployment and decline in labour participation. Interest rate cuts, government support programs andrelief programs offered by financial institutions have helped households and may have contributedtowards an increase in savings and a decrease in household indebtedness. However, concerns related tohousing affordability in certain markets and levels of Canadian household debt that were alreadyelevated before the additional challenges brought on by the COVID-19 pandemic could continue to rise ifthe COVID-19 pandemic worsens, if the period to economic recovery is prolonged or as relief programsexpire, resulting in, among other things, higher credit losses.
Additional risks are emerging with uncertainty surrounding the real estate rental market, changingconsumer preferences and work arrangements, and the continued impact from industries significantlyaffected by the COVID-19 pandemic, all of which may have an impact on future real estate investmentand demand. For example, uncertainties within the smaller size condo market have arisen during theCOVID-19 pandemic, driven by a combination of a decline in short-term rentals and a shift in long-termrental preferences away from key metropolitan areas to adapt to ongoing work from homearrangements. Both factors have contributed to an increase in vacancy rates and a reduction in rentalincome in certain metropolitan markets which could impact sale prices into the future and result inhigher household indebtedness, which could have negative credit implications for this lending portfolio.
Geopolitical uncertainty Persistent trade tensions, policy changes, and uncertainties pertaining to Brexit and the politicaldirection of the U.S., U.K. and Europe, continue to impact global economic growth prospects and marketsentiment. The Canadian economy is vulnerable to continued trade tensions given the country’s tradingrelationships with the U.S. and China. Tensions remain elevated between China and the U.S. over anumber of issues including trade, technology and human rights. More broadly, the post-pandemic futureof global trade remains uncertain, as countries may look to decrease reliance on the global supply chain,and the impact of Brexit in Europe remains uncertain as the U.K. and Europe have yet to finalize a Brexitdeal in advance of the December 31, 2020 transition date. The changing political landscape in Hong Kongand tensions between China and its neighbors add further to global and economic uncertainty. We haveand will continue to monitor all of these developments and will assess the implications they have on us.
54 Royal Bank of Canada: Annual Report 2020 Management’s Discussion and Analysis
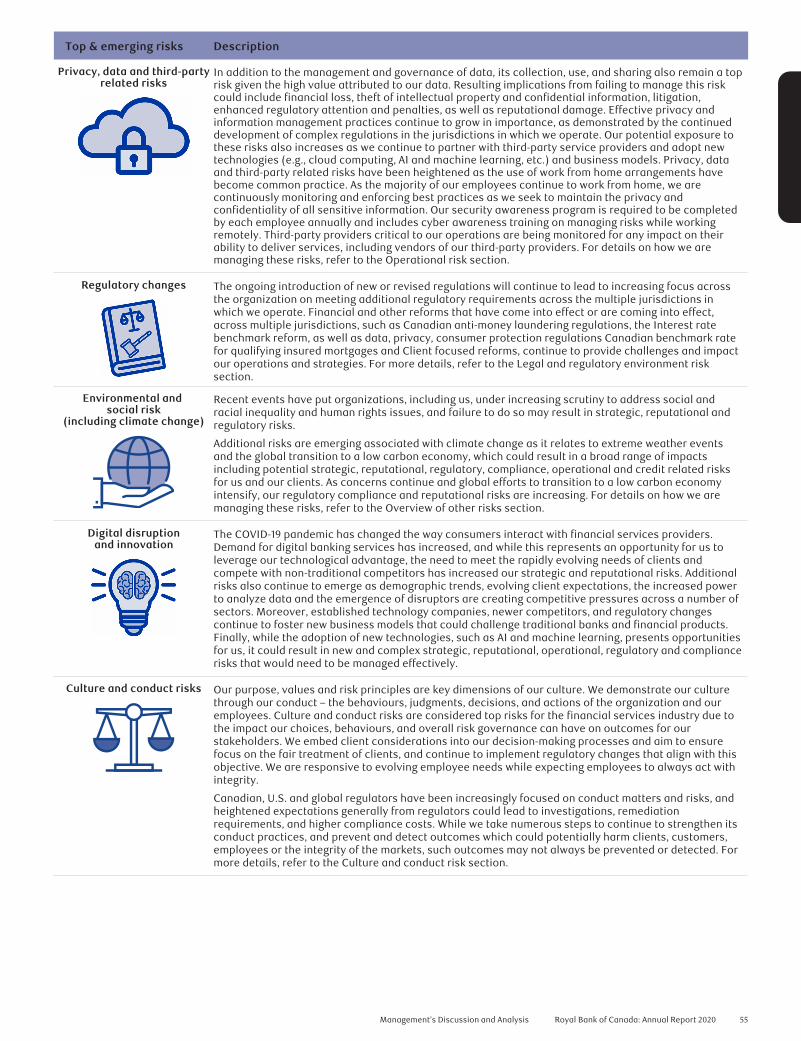
Top & emerging risks Description
Privacy, data and third-partyrelated risks
In addition to the management and governance of data, its collection, use, and sharing also remain a toprisk given the high value attributed to our data. Resulting implications from failing to manage this riskcould include financial loss, theft of intellectual property and confidential information, litigation,enhanced regulatory attention and penalties, as well as reputational damage. Effective privacy andinformation management practices continue to grow in importance, as demonstrated by the continueddevelopment of complex regulations in the jurisdictions in which we operate. Our potential exposure tothese risks also increases as we continue to partner with third-party service providers and adopt newtechnologies (e.g., cloud computing, AI and machine learning, etc.) and business models. Privacy, dataand third-party related risks have been heightened as the use of work from home arrangements havebecome common practice. As the majority of our employees continue to work from home, we arecontinuously monitoring and enforcing best practices as we seek to maintain the privacy andconfidentiality of all sensitive information. Our security awareness program is required to be completedby each employee annually and includes cyber awareness training on managing risks while workingremotely. Third-party providers critical to our operations are being monitored for any impact on theirability to deliver services, including vendors of our third-party providers. For details on how we aremanaging these risks, refer to the Operational risk section.
Regulatory changes The ongoing introduction of new or revised regulations will continue to lead to increasing focus acrossthe organization on meeting additional regulatory requirements across the multiple jurisdictions inwhich we operate. Financial and other reforms that have come into effect or are coming into effect,across multiple jurisdictions, such as Canadian anti-money laundering regulations, the Interest ratebenchmark reform, as well as data, privacy, consumer protection regulations Canadian benchmark ratefor qualifying insured mortgages and Client focused reforms, continue to provide challenges and impactour operations and strategies. For more details, refer to the Legal and regulatory environment risksection.
Environmental andsocial risk
(including climate change)
Recent events have put organizations, including us, under increasing scrutiny to address social andracial inequality and human rights issues, and failure to do so may result in strategic, reputational andregulatory risks.
Additional risks are emerging associated with climate change as it relates to extreme weather eventsand the global transition to a low carbon economy, which could result in a broad range of impactsincluding potential strategic, reputational, regulatory, compliance, operational and credit related risksfor us and our clients. As concerns continue and global efforts to transition to a low carbon economyintensify, our regulatory compliance and reputational risks are increasing. For details on how we aremanaging these risks, refer to the Overview of other risks section.
Digital disruptionand innovation
The COVID-19 pandemic has changed the way consumers interact with financial services providers.Demand for digital banking services has increased, and while this represents an opportunity for us toleverage our technological advantage, the need to meet the rapidly evolving needs of clients andcompete with non-traditional competitors has increased our strategic and reputational risks. Additionalrisks also continue to emerge as demographic trends, evolving client expectations, the increased powerto analyze data and the emergence of disruptors are creating competitive pressures across a number ofsectors. Moreover, established technology companies, newer competitors, and regulatory changescontinue to foster new business models that could challenge traditional banks and financial products.Finally, while the adoption of new technologies, such as AI and machine learning, presents opportunitiesfor us, it could result in new and complex strategic, reputational, operational, regulatory and compliancerisks that would need to be managed effectively.
Culture and conduct risks Our purpose, values and risk principles are key dimensions of our culture. We demonstrate our culturethrough our conduct – the behaviours, judgments, decisions, and actions of the organization and ouremployees. Culture and conduct risks are considered top risks for the financial services industry due tothe impact our choices, behaviours, and overall risk governance can have on outcomes for ourstakeholders. We embed client considerations into our decision-making processes and aim to ensurefocus on the fair treatment of clients, and continue to implement regulatory changes that align with thisobjective. We are responsive to evolving employee needs while expecting employees to always act withintegrity.
Canadian, U.S. and global regulators have been increasingly focused on conduct matters and risks, andheightened expectations generally from regulators could lead to investigations, remediationrequirements, and higher compliance costs. While we take numerous steps to continue to strengthen itsconduct practices, and prevent and detect outcomes which could potentially harm clients, customers,employees or the integrity of the markets, such outcomes may not always be prevented or detected. Formore details, refer to the Culture and conduct risk section.
Management’s Discussion and Analysis Royal Bank of Canada: Annual Report 2020 55

Overview
As a global financial institution with a diversified business model, we actively manage a variety of risks to help protect andenable our businesses by following these risk management principles:
Risk management principles
• Effectively balance risk and reward to enable sustainable growth;• Shared responsibility for risk management;• Always uphold our Purpose and Vision, and consistently abide by our Values and Code of Conduct to maintain our
reputation and the trust of our clients, colleagues and communities;• Undertake only risks we understand and make thoughtful and future-focused risk decisions;• Maintain a healthy and robust control environment to protect our stakeholders;• Use judgment and common sense;• Always be operationally prepared and financially resilient for a potential crisis.
The dynamic nature of the financial services industry, and technological innovation, necessitate that our processes, tools andpractices are continuously improving and responsive to the changing landscape and emerging risks. We seek to accomplish thisthrough an effective and evolving risk management approach. All risk-taking activities and exposures are within the Board-approved risk appetite, risk limits and corresponding capital and liquidity requirements. We seek to ensure that our businessactivities and transactions provide an appropriate balance of return for the risks assumed and the costs incurred. Ourorganizational design and governance processes are intended to ensure that our Group Risk Management (GRM) function isindependent from the businesses it supports.
Risk driversWe define risk as the potential for downside volatility of earnings, or the potential for an adverse effect on our resiliency. Riskcan be realized through losses, or an undesirable outcome with respect to volatility of earnings in relation to expected earnings,capital adequacy, or liquidity. Our principal risks include credit, market, liquidity, insurance, operational, regulatory compliance,strategic, reputation, legal and regulatory environment, competitive, and systemic risks, that have been classified into fourcategories based on the level of control and influence that we can exert against these risks. These categories are maintained byGRM and reviewed regularly to ensure all principal risks are reflected. This classification methodology provides a commonlanguage and discipline for the identification and assessment of risk in existing businesses, new businesses, products orinitiatives, as well as acquisitions and alliances.
Transactional /Positional
Co
ntro
l and
infl
uenc
e
Macroeconomic
Strategic
Operational /RegulatoryCompliance
MoreMore
LessLess
Adverse changes in the macroeconomic environment can lead to a material impact on the real economy orthe financial system in any of the regions in which we operate. – Examples include deterioration in the Canadian housing market, abrupt changes in the geopolitical environment, unfavourable global trade agreements or the outbreak of a pandemic or other health crises.
Macroeconomic risk is the least controllable type of risk arising from the business environment in which weoperate.However, we have in place a number of controls to mitigate the impacts of systemic risk, including ourdiversified business model and funding sources, financial crisis management strategies and protocols,stress testing programs, and product and geographic diversification.
Resultant impacts can materialize as loss of revenue, as well as the realization of credit, market oroperational risk losses.
Business strategy is a major driver of our risk appetite, including acquisitions and dispositions, responses tothreats posed by non-traditional competitors and responses to proposed changes in the regulatoryenvironment.Choosing the wrong strategy, or poorly executing on the correct strategy, could result in reputational riskconsequences, impact our revenue mix, and/or affect our exposure to earnings volatility and loss absorptioncapacity.There is a fair degree of control and influence that we can exert in managing strategic and reputation risk. While the legal and regulatory environment and competitive risks are less controllable, we seek to influencethem through our role as a corporate entity and as an active participant in the Canadian and global financialservices industry.
The complexity and scope of our operations across the globe exposes us to operational and regulatorycompliance risks.We have a certain level of control over these risks through our people and systems, as well as how werespond to external events.
Credit, market, liquidity and insurance risks are an integral part of our day-to-day business activities.We earn revenue by taking these transactional / positional risks.We understand these risks well and have the greatest level of control and influence over them.
56 Royal Bank of Canada: Annual Report 2020 Management’s Discussion and Analysis

Enterprise risk management
Under the oversight of the Board and senior management, the ERMF provides an overview of our enterprise-wide programs formanaging risk, including identifying, assessing, measuring, controlling, monitoring and reporting on the significant risks that facethe organization.
Risk governanceWe have an effective and well-established governance framework in place to ensure that risks impacting our businesses areidentified, appropriately categorized, assessed, managed and communicated to the Board in a timely manner. The riskgovernance framework has been established, and is maintained in alignment with, the expectations of OSFI, the Basel Committeeon Banking Supervision’s (BCBS) corporative governance principles, and the requirements and expectations of other regulatorsin the jurisdictions and businesses in which we conduct business, and in accordance with industry best practices. The Boardoversees the implementation of our risk management framework, while employees at all levels of the organization areresponsible for managing the day-to-day risks that arise in the context of their mandates. As illustrated below, we use the threelines of defence governance model which is intended to ensure that risks are appropriately and adequately managed throughoutthe enterprise to achieve our strategic objectives.
The Board establishes the tone from above and sets the standards of conduct and champions our values as set out in our Code of Conduct. The Board alsoapproves our risk appetite, provides oversight and carries out its risk management mandate primarily through its committees:The Risk Committee oversees our risk management program which is designed to ensure that the policies, procedures and controls used by management aresufficient to keep risks within our risk appetite. The Risk Committee’s oversight role is designed to ensure that the risk management function is adequatelyindependent from the businesses whose activities it reviews. Its oversight activities include the review of the GRM function which evaluates GRM’s successagainst its key priorities, the mandate of the Chief Risk Officer (CRO), the GRM organizational structure, and the function’s budget and resources.The Audit Committee assists the Board in its oversight of (i) the integrity of our financial statements; (ii) the qualifications, performance andindependence of our external auditors; (iii) the performance of our internal audit function and internal controls; and (iv) compliance with legal andregulatory requirements.The Governance Committee recommends individuals for Board member election or re-election, oversees the process for evaluating Board Committee anddirector effectiveness, and oversees management of culture and conduct, including breaches of our Code of Conduct. Additional responsibilities include (i) developing and recommending governance frameworks, principles and policies to the Board; (ii) overseeing corporate citizenship matters; (iii) monitoringdevelopments in corporate governance and adapting best practices; and (iv) reviewing shareholder proposals and recommending responses to the Board.The Human Resources Committee assists the Board in its oversight of compensation policies and programs, compensation for the CEO and Group Executives(GE), as well as compensation risk management. It also oversees our pension plans, key talent management strategies and practices, and managementsuccession plans for key senior leadership roles.
AUDIT COMMITTEERISK COMMITTEE
BOARD OF DIRECTORS
GOVERNANCE COMMITTEE HUMAN RESOURCES COMMITTEE
Actively shapes enterprise risk appetite and recommends it for Board approval.Visibly supports and communicates enterprise risk appetite, ensuring that sufficient resources and expertise are in place to help provideeffective oversight of adherence to the enterprise risk appetite.Seeks to ensure principles, policies, authorities, resources, responsibilities and reporting are in place to support the control infrastructurenecessary for an effective enterprise-wide risk management program. Oversees culture and conduct strategy and key activities.The Compensation Risk Management Oversight Committee (CRMOC) oversees the design of major compensation programs in an effort to ensurealignment with sound risk management principles and that risks that may not be fully captured in our current financial performance areappropriately considered in variable compensation payouts, including our enterprise risk profile relative to risk appetite. The CRMOC has theresponsibility for ensuring that our compensation programs align with the Financial Stability Board (FSB) Principles for Sound CompensationPractices and Implementation Standards and other applicable guidance and best practices.
THE GROUP EXECUTIVE AND GROUP RISK COMMITTEE
All employees across our businesses’functional areasAccountable for: Identification; Assessment; Measurement; Mitigation; Monitoring; and Reporting of risk against approved policies and appetite
FIRST LINE OF DEFENCE
RISK OWNERSRISK OWNERS
The CRO has direct access to theRisk CommitteeThe Chief Compliance Officer (CCO) and theChief Anti-Money Laundering Officer (CAMLO)have direct access to the Audit CommitteeEstablishes risk management practices andprovides risk guidanceProvides oversight of the effectiveness ofFirst Line risk management practicesMonitors and independently reports on thelevel of risk against established risk appetite
SECOND LINE OF DEFENCE
RISK OVERSIGHTRISK OVERSIGHT
RISKMANAGEMENT
GLOBALCOMPLIANCE AND
ANTI- MONEYLAUNDERING
Internal AuditIndependent assurance to managementand the Board on the effectiveness ofrisk management practices
THIRD LINE OF DEFENCE
INDEPENDENT ASSURANCEINDEPENDENT ASSURANCE
Management’s Discussion and Analysis Royal Bank of Canada: Annual Report 2020 57

Risk appetiteEffective risk management protects us from unacceptablelosses or undesirable outcomes with respect to earningsvolatility, capital adequacy or liquidity, reputation risk or otherrisks while supporting and enabling our overall businessstrategy. It requires the clear articulation of our risk appetite,which is the amount and type of risk that we are able and willingto accept in the pursuit of our business objectives. It reflects ourself-imposed upper bound to risk-taking, set at levels inside ofregulatory limits and constraints, and influences our riskmanagement philosophy, Code of Conduct, business practicesand resource allocation. It provides clear boundaries and setsan overall tone for balancing risk-reward trade-offs to ensurethe long term viability of the organization.
Our risk appetite is integrated into our strategic, financial,and capital planning processes, as well as ongoing businessdecision-making processes and is reviewed and approvedannually by the Board.
Our Enterprise Risk Appetite Framework (ERAF) outlines thefoundational aspects of our approach to risk appetite,articulates our quantitative and qualitative risk appetitestatements and their supporting measures and associatedconstraints, which can be applied at the enterprise, businesssegment, business unit and legal entity level, and describes ourrequirements and expectations to embed effective risk appetitepractices throughout the organization.
Risk Appetite Framework Components
Risk Appetite
Risk Capacity
Risk Profile
Delegated Authorities/Risk Limits
Risk Posture
The allocation of our risk appetite across the bank is supported by the establishment of delegated authorities or risklimits. These delegated authorities or risk limits represent the maximum level of risk permitted for a line of business,portfolio, individual or group and are used to govern ongoing operations. Risk posture, the anticipated shift in risk profile asa result of changes in objectives, strategies, and external factors, is used to provide insights on key areas that may requiremanagement attention to ensure strategies are able to be executed successfully within our risk appetite.
Risk appetite statementsQuantitative statements Qualitative statements
• Manage earnings volatility and exposure to futurelosses under normal and stressed conditions.
• Avoid excessive concentrations of risk.• Ensure sound management of operational and
regulatory compliance risk.• Ensure capital adequacy and sound management of
liquidity and funding risk.• Maintain strong credit ratings and a risk profile that is
in the top half of our peer group.
• Undertake only risk we understand. Make thoughtfuland future-focused risk decisions, takingenvironmental and social considerations intoaccount.
• Effectively balance risk and reward to enablesustainable growth.
• Maintain a healthy and robust control environment toprotect our stakeholders.
• Always be operationally prepared and financiallyresilient for a potential crisis.
• Always uphold our Purpose and Vision andconsistently abide by our Values and Code of Conductto maintain our reputation and the trust of ourclients, colleagues, and communities.
Risk measurementQuantifying risk is a key component of our enterprise-wide risk and capital management processes. Risk measurement andplanning processes are integrated across the enterprise in regards to forward-looking projections and analyses, including amongothers, stress testing, recovery and resolution planning as well as credit provisioning. The degree of integration across ourFinance and Risk functions continues to increase in measuring both financial and risk performance.
Certain risks, such as credit, market, liquidity and insurance risks, can be more easily quantified than others, such asoperational, reputation, strategic, legal, and regulatory and compliance risks. For the risks that are more difficult to quantify,greater emphasis is placed on qualitative risk factors and assessment of activities to gauge the overall level of risk. In addition,judgmental risk measures and techniques such as stress testing, and scenario and sensitivity analyses can be used to assess andmeasure risks, and we are continuously evolving our risk measures and techniques to manage our risks. Our primary methods formeasuring risk include:• Quantifying expected loss: representing those losses that are statistically expected to occur as a result of conducting
business in a given time period;• Quantifying unexpected loss: an estimate of the deviation of actual earnings from expected earnings, over a specified time
horizon;• Stress testing: Provides a forward-looking perspective and evaluates the potential effects of a set of specified changes in
risk factors, corresponding to exceptional but plausible adverse economic and financial market events; and• Back-testing: Compares the realized values to the parameter estimates that are currently used in an effort to ensure the
parameters remain appropriate for regulatory and economic capital calculations.
58 Royal Bank of Canada: Annual Report 2020 Management’s Discussion and Analysis

Stress testingStress testing is an important component of our risk management framework. Stress testing results are used for:• Assessing the viability of long-term business plans and strategies;• Monitoring our risk profile relative to our risk appetite in terms of earnings and capital at risk;• Setting limits;• Identifying key risks to, and potential shifts in, our capital and liquidity levels, as well as our financial position;• Enhancing our understanding of available mitigating actions in response to potential adverse events; and• Assessing the adequacy of our capital and liquidity levels.
Our enterprise-wide stress tests evaluate key balance sheet, income statement, leverage, capital, and liquidity impacts arisingfrom risk exposures and changes in earnings. The results are used by the Board, Group Risk Committee (GRC) and seniormanagement risk committees to understand our performance drivers under stress, and review stressed capital, leverage, andliquidity ratios against regulatory thresholds and internal limits. The results are also incorporated into our Internal CapitalAdequacy Assessment Process (ICAAP) and capital plan analyses.
We evaluate a number of enterprise-wide stress scenarios over a multi-year horizon, featuring a range of severities. OurBoard reviews the recommended scenarios, and GRM leads the scenario assessment process. Results from across theorganization are integrated to develop an enterprise-wide view of the impacts, with input from subject matter experts in GRM,Corporate Treasury, Finance, and Economics. Generally, our stress testing scenarios evaluate global recessions, equity marketcorrections, elevated debt levels, trade policies, changes in interest rates, real estate price corrections, and shocks to creditspreads and commodity markets, among other factors. During fiscal 2020, our stress testing exercises were tailored specificallyto the COVID-19 pandemic, which we assessed through multiple scenarios and sensitivities to estimate the potential impactthrough credit, market, liquidity risk and capital planning as well as operational risk projections. The unprecedented economicimpact resulting from the COVID-19 pandemic generated historic stress levels for most parameters on a real-time basis. As aresult, more frequent stress testing was undertaken to focus on the material drivers of stress. Scenarios were adjusted to reflecta heightened stress and significant deterioration in the macroeconomic and market parameters as a starting point. In tandem,alternative paths were defined with sustained shocks and potential recovery routes.
Ongoing stress testing and scenario analyses within specific risk types, such as market risk, liquidity risk, Interest Rate Riskin the Banking Book (IRRBB), retail and wholesale credit risk, operational risk, and insurance risk, supplement and support ourenterprise-wide analyses. Results from these risk-specific programs are used in a variety of decision-making processes includingrisk limit setting, portfolio composition evaluation, risk appetite articulation and business strategy implementation.
In addition to ongoing enterprise-wide and risk specific stress testing programs, we use ad hoc and reverse stress testing todeepen our knowledge of the risks we face. Ad hoc stress tests are one-off analyses used to investigate developing conditions orto stress a particular portfolio in more depth. Reverse stress tests, starting with a severe outcome and aiming to reverse-engineer scenarios that might lead to it, are used in risk identification and understanding of risk/return boundaries.
In addition to internal stress tests, we participate in a number of regulator-required stress test exercises, on a periodic basis,across several jurisdictions.
Model governance and validationQuantitative models are used for many purposes including, but not limited to, the valuation of financial products, theidentification, measurement and management of different types of risk, stress testing, assessing capital adequacy, informingbusiness and risk decisions, measuring compliance with internal limits, meeting financial reporting and regulatory requirements,and issuing public disclosures.
Model risk is the risk of adverse financial and/or reputational consequences to the enterprise arising from the use or misuseof a model at any stage throughout its life cycle and is managed through our model risk governance and oversight structure. Thegovernance and oversight structure, which is implemented through our three lines of defence governance model, is founded onthe basis that model risk management is a shared responsibility across the three lines spanning all stages of the model’s lifecycle. We continue to evolve our governance model to take into account the growing use of AI methods and applications in ourmodels across our organization.
Prior to their use, models are subject to an independent validation and approval by our enterprise model risk managementfunction, a team of modelling professionals with reporting lines independent of those of the model owners, developers and users.The validation seeks to ensure that models are sound and capable of fulfilling their intended use. In addition to independentlyvalidating models prior to use, our enterprise model risk management function provides controls that span the life-cycle of amodel, including model change management procedures, requirements for ongoing monitoring, and annual assessments toensure each model continues to serve its intended purpose.
Risk controlOur enterprise-wide risk management approach is supported by a comprehensive set of risk controls that are defined in ourERMF. The ERMF serves as the foundation for our approach to risk management and sets the expectations for the developmentand communication of policies, the establishment of formal independent risk review and approval processes, and theestablishment of delegated authorities and limits. The ERMF is further reinforced and supported by a number of additionalBoard-approved risk frameworks, various policies thereunder and a comprehensive set of risk controls. Together, our riskframeworks and supporting policies provide direction and insight on how respective risks are identified, assessed, measured,managed, mitigated, monitored and reported. The enterprise-wide policies are considered our minimum requirements,articulating the parameters within which business groups and employees must operate.
Management’s Discussion and Analysis Royal Bank of Canada: Annual Report 2020 59

Enterprise Risk ManagementFramework
Enterprise Risk AppetiteFramework
Enterprise Culture andConduct Risks
Framework
Enterprise-Wide Policies for Multiple Risk Types(e.g. Product Risk Review and Approval Policy; Policy on Risk Limits and Risk Approval Authorities; Stress-Testing Policy)
Segment or Region Specific Risk Policy and Procedures
The approval hierarchy for risk frameworks and policy documents:
Board of Directors or Board Committees
Senior management committees (e.g. Policy Review Committee, Operational Risk Committee, Asset Liability Committee) for most policies.Board or Board Committee approval is required in some instances (e.g. RBC Code of Conduct, Dividend Policy)
Generally by business or Functional Unit management/committees. Group Risk Management approval is required if there are significantrisk implications
Enterprise Risk Policy Architecture
Data PolicyCredit RiskMitigation
Policy
DividendPolicy
OperationalRisk
ManagementPolicy
Market RiskPolicy
Privacy RiskManagement
Policy
LiquidityRisk Policy
InsuranceRisk
MitigationPolicy
InformationSecurity
Policy
FiduciaryRisk Policy
Supporting Risk-Specific Enterprise-Wide Policies (examples)
DataManagementFramework
Credit RiskManagementFramework
CapitalManagementFramework
OperationalRisk
ManagementFramework
Market RiskManagementFramework
RegulatoryCompliance
ManagementFramework
LiquidityRisk
ManagementFramework
InsuranceRisk
ManagementFramework
InformationTechnology
RiskManagementFramework
ReputationRisk
ManagementFramework
Delegated authorities and risk limitsRisk appetite is designed to account for strategic and forward-looking considerations whereas authorities and risk limits areused to govern and monitor our day-to-day business activities. Delegated authorities and limits for credit, market, liquidity andinsurance risks are established by the Board and delegated to senior management at levels below risk appetite and regulatoryrequirements. Senior management can then delegate some or all of their authorities onwards to others in the organization. Thedelegated authorities enable the approval of single name, geographic and industry sectors, and product and portfolio exposureswithin defined parameters and limits. They are also used to manage concentration risk, establish underwriting and inventorylimits for trading and investment banking activities and set market risk tolerances. Transactions that exceed seniormanagement’s delegated authorities require the approval of the Risk Committee of the Board.
Risk review and approval processesRisk review and approval processes provide a control mechanism and are established by GRM based on the nature, size andcomplexity of the risk involved. In general, the risk review and approval process involves a formal review and approval by anindividual, group or committee that is independent from the originator. The approval responsibilities are governed by delegatedauthorities and risk limits based on the following categories: transactions, projects and initiatives, and new products andservices.
Risk monitoring and reportingEnterprise and business segment level risk monitoring and reporting are critical components of our enterprise risk managementprogram and support the ability of senior management and the Board to effectively perform their risk management and oversightresponsibilities. In addition, we publish a number of external reports on risk matters to comply with regulatory requirements. Ona quarterly basis, we provide our Enterprise Risk Report to senior management and the Risk Committee of the Board whichincludes, among others, top and emerging risks, risk profile relative to our risk appetite, portfolio quality metrics and a range ofrisks we face along with an analysis of the related issues, key trends and, when required, management actions. On an annualbasis, we provide a benchmarking review to the Board which compares our performance to peers across a variety of risk metricsand includes a composite risk scorecard which provides an objective measure of our ranking relative to the peer group. Inaddition to our regular risk monitoring, other risk specific presentations are provided to, and discussed with, senior managementand the Board on top and emerging risks or changes in our risk profile.
Culture and conduct riskOur values set the tone of our organizational culture and translate into desired behaviours as articulated in our Code of Conductand leadership model. We define conduct as the manifestation of culture through the behaviours, judgment, decisions, andactions of the organization and its individuals. Our organizational direction establishes the expectation of good conductoutcomes as the operating norm for the organization, all employees, and third-party service providers operating on our behalf,thereby allowing our good conduct to drive positive outcomes for our clients, our employees, stakeholders, financial markets andour reputation. We hold ourselves to the highest standards of conduct to build the trust of our clients, investors, colleagues andcommunity. The desired outcomes from effective culture and conduct practices align with our values and support our riskappetite statements.
60 Royal Bank of Canada: Annual Report 2020 Management’s Discussion and Analysis

Risk culture is a subset of our overall culture that influences how, individually and collectively, we take and manage risks.Our risk culture helps us identify and understand risks, openly discuss risks, and act on the organization’s current and perceivedfuture risks. Our risk culture practices are grounded in our existing risk management and human resource disciplines andprotocols. When combined with the elements of effective leadership and values, these practices provide a base from which theresulting risk culture and conduct can be assessed, monitored, sustained and subjected to ongoing enhancement.
Our Board-approved Enterprise Culture and Conduct Risks Framework provides organizational direction and describes ourapproach to a set of related topics applicable to all risk categories such as fair outcomes for clients and other stakeholders,culture, including accountability and risk culture, conduct risk, sales conduct and client practices, and misconduct.
On a regular basis, management communicates behavioural expectations to our employees with an emphasis on conductand values. Our leadership model also supports and encourages effective challenge between the businesses and controlfunctions. These behavioural expectations are supported by multiple online tools and resources which are designed to helpemployees live our values, report misconduct and raise concerns, including those that might have ethical implications. We arecommitted to fostering an environment where employees feel safe to speak up without retaliation. Employees have the ability toreport matters through a global anonymous Conduct Hotline. In addition, our Code of Conduct outlines an employee’sresponsibility to be truthful, respect others, and comply with laws, regulations and our policies. Anyone who breaches or fails toreport an actual or possible breach of the Code of Conduct is subject to corrective or disciplinary action. This can range fromreprimands and impacts on performance ratings and compensation, to termination of employment relationships with theorganization.
Culture FactorsInfluential to Managing
Conduct Risk
Tone from AboveAccountabilitySpeaking Up
IncentivesRisk Awareness
Organizational Directionarticulated through:
ValuesLeadership ModelCode of Conduct
Risk AppetiteRisk Principles
Outcomes forStakeholders
ClientsEmployees
Financial MarketsRegulators
Our ReputationShareholders
Individual &Collective Conductexhibited through:
BehavioursJudgmentDecisionsActions
Drives actual
Apply lessons learned
Sets expected
InfluencesShapes
The shaded text along with the tables specifically marked with an asterisk (*) in the following sections of the MD&A representour disclosures on credit, market and liquidity and funding risks in accordance with IFRS 7, Financial Instruments: Disclosures,and include discussion on how we measure our risks and the objectives, policies and methodologies for managing these risks.Therefore, these shaded text and marked tables represent an integral part of our 2020 Annual Consolidated FinancialStatements.
Transactional/positional risk drivers
Credit risk
Credit risk is the risk of loss associated with an obligor’s potential inability or unwillingness to fulfill its contractual obligationson a timely basis and may arise directly from the risk of default of a primary obligor (e.g., issuer, debtor, counterparty,borrower or policyholder), indirectly from a secondary obligor (e.g., guarantor or reinsurer), through off-balance sheetexposures, contingent credit risk, associated credit risk and/or transactional risk. Credit risk includes counterparty credit riskarising from both trading and non-trading activities.
The responsibility for managing credit risk is shared broadly following the three lines of defence governance model. TheBoard delegates credit risk approval authorities through risk appetites and risk limits to the President & CEO and CRO. Credittransactions in excess of these authorities must be approved by the Risk Committee of the Board. To facilitate day-to-daybusiness activities, the CRO has been empowered to further delegate credit risk approval authorities to individuals withinGRM, the business segments, and functional units as necessary.
We balance our risk and return by setting the following objectives for the management of credit risk:• Ensuring credit quality is not compromised for growth;• Mitigating credit risk in transactions, relationships and portfolios;• Using our credit risk rating and scoring systems or other approved credit risk assessment or rating methodologies,
policies and tools;• Pricing appropriately for the credit risk taken;• Detecting and preventing inappropriate credit risk through effective systems and controls;• Applying consistent credit risk exposure measurements;
Management’s Discussion and Analysis Royal Bank of Canada: Annual Report 2020 61

• Ongoing credit risk monitoring and administration;• Transferring credit risk to third parties where appropriate through approved credit risk mitigation techniques (e.g., sale,
hedging, insurance, securitization); and• Avoiding activities that are inconsistent with our values, Code of Conduct or policies.
The Enterprise Credit Risk Management Framework (ECRMF) describes the principles, methodologies, systems, roles andresponsibilities, reports and controls that exist for managing credit risk within the enterprise. Additional supporting policiesexist that are designed to provide further clarification of roles and responsibilities, acceptable practices, limits and keycontrols within the enterprise.
Credit risk measurementWe quantify credit risk at both the individual obligor and portfolio levels to manage expected credit losses and minimizeunexpected losses in order to limit earnings volatility and ensure we are adequately capitalized.
We employ a variety of risk measurement methodologies to measure and quantify credit risk for our wholesale and retailcredit portfolios. The wholesale portfolio is comprised of businesses, sovereigns, public sector entities, banks and otherfinancial institutions, as well as certain high net worth individuals and small businesses. The retail portfolio is comprised ofresidential mortgages, personal loans, credit cards, and small business loans. Our credit risk rating systems are designed toassess and quantify the risk inherent in credit activities in an accurate and consistent manner. The resulting ratings andscores are then used for both client- and transaction-level risk decision-making and as key inputs for our risk measurementand capital calculations.
Measurement of economic and regulatory capitalEconomic capital, which is our internal quantification of risks, is used for limit setting. It is also used for internal capitaladequacy and allocation of capital to the Insurance segment. Our methodology for allocating capital to our businesssegments, other than Insurance, is based on regulatory requirements. For further details, refer to the Capital managementsection.
In measuring credit risk to determine regulatory capital, two principal approaches are available: Internal Ratings Based(IRB) Approach and Standardized Approach.
The Standardized Approach applies primarily to our Caribbean banking operations and City National and is based on riskweights prescribed by OSFI that are used to calculate RWA for credit risk exposure.
The IRB Approach, which applies to most of our credit risk exposures, utilizes three key parameters which form the basis ofour credit risk measures for both regulatory and economic capital.• Probability of default (PD): An estimated percentage that represents the likelihood of default within a given time period of
an obligor for a specific rating grade or for a particular pool of exposure.• Exposure at default (EAD): An amount expected to be owed by an obligor at the time of default.• Loss given default (LGD): An estimated percentage of EAD that is not expected to be recovered during the collections and
recovery process.
These parameters are determined based primarily on historical experience from internal credit risk rating systems inaccordance with supervisory standards.
Each credit facility is assigned an LGD rate that is largely driven by factors that impact the extent of losses anticipated inthe event the obligor defaults. These factors mainly include seniority of debt, collateral and the industry sector in which theobligor operates. Estimated LGD rates draw primarily on internal loss experiences. Where we have limited internal loss data,we also refer to appropriate external data to supplement the estimation process. LGD rates are estimated to reflectconditions that might be expected to prevail in a period of an economic downturn, with additional conservatism added toreflect data limitations and statistical uncertainties identified in the estimation process.
EAD is estimated based on the current exposure to the obligor and the possible future changes in that exposure driven byfactors such as the nature of the credit commitment. As with LGD, rates are estimated to reflect an economic downturn, withadded conservatism to reflect data and statistical uncertainties identified in the modelling process.
Estimates of PD, LGD and EAD are reviewed, and then validated and back-tested by an independent validation teamwithin the bank, on an annual basis. In addition, quarterly monitoring and back-testing is performed by the estimation team.These ratings and risk measurements are used to determine our expected losses as well as economic and regulatory capital,setting of risk limits, portfolio management and product pricing.
Financial and regulatory measurement distinctionsExpected loss models are used for both regulatory capital and accounting purposes. Under both models, expected losses arecalculated as the product of PD, LGD and EAD. However, there are certain key differences under current Basel and IFRSreporting frameworks which could lead to significantly different expected loss estimates, including:• Basel PDs are based on long-run averages over an entire economic cycle. IFRS PDs are based on current conditions,
adjusted for estimates of future conditions that will impact PD under probability-weighted macroeconomic scenarios.• Basel PDs consider the probability of default over the next 12 months. IFRS PDs consider the probability of default over
the next 12 months only for instruments in stage 1. Expected credit losses for instruments in stage 2 are calculated usinglifetime PDs.
• Basel LGDs are based on severe but plausible downturn economic conditions. IFRS LGDs are based on current conditions,adjusted for estimates of future conditions that will impact LGD under probability-weighted macroeconomic scenarios.
For further details, refer to the Critical accounting policies and estimates section.
Gross credit risk exposureGross credit risk is categorized as i) lending-related and other credit risk or ii) trading-related credit risk; and is calculatedbased on the Basel III framework. Under this method, EAD for all lending-related and other credit transactions and trading-related repo-style transactions is calculated before taking into account any collateral and is inclusive of an estimate of
62 Royal Bank of Canada: Annual Report 2020 Management’s Discussion and Analysis

potential future changes to that credit exposure. EAD for derivatives is calculated inclusive of collateral in accordance withregulatory guidelines.
Lending-related and other credit risk includes:• Loans and acceptances outstanding, undrawn commitments, and other exposures, including contingent liabilities such as
letters of credit and guarantees, debt securities carried at FVOCI or amortized cost and deposits with financialinstitutions. Undrawn commitments represent an estimate of the contractual amount that may be drawn upon at the timeof default of an obligor.
Trading-related credit risk includes:• Repo-style transactions, which include repurchase and reverse repurchase agreements and securities lending and
borrowing transactions. For repo-style transactions, gross exposure represents the amount at which securities wereinitially financed, before taking collateral into account.
• Derivative amounts which represent the credit equivalent amount, as defined by OSFI as the replacement cost plus anadd-on amount for potential future credit exposure, scaled by a regulatory factor.
Credit risk assessmentWholesale credit riskThe wholesale credit risk rating system is designed to measure the credit risk inherent in our wholesale credit activities.
Each obligor is assigned a borrower risk rating (BRR), reflecting an assessment of the credit quality of the obligor. EachBRR has a PD calibrated against it. The BRR differentiates the riskiness of obligors and represents our evaluation of theobligor’s ability and willingness to meet its contractual obligations on time over a three year time horizon. The assignment ofBRRs is based on the evaluation of the obligor’s business risk and financial risk through fundamental credit analysis, as wellas data-driven modelling. The determination of the PD associated with each BRR relies primarily on internal default historysince 2006. PD estimates are designed to be a long-run average of our experience across the economic cycle in accordancewith regulatory guidelines.
Our rating system is designed to stratify obligors into 22 grades. The following table aligns the relative rankings of our22-grade internal risk ratings with the external ratings used by S&P and Moody’s.
Internal ratings map* Table 41
PD Bands
Ratings Business and Bank Sovereign BRR S&P Moody’s Description1 0.0000% – 0.0300% 0.0000% – 0.0150% 1+ AAA Aaa
Investment Grade
2 0.0000% – 0.0300% 0.0151% – 0.0250% 1H AA+ Aa13 0.0000% – 0.0350% 0.0251% – 0.0350% 1M AA Aa2
4 0.0351% – 0.0475% 1L AA- Aa35 0.0476% – 0.0650% 2+H A+ A16 0.0651% – 0.0875% 2+M A A27 0.0876% – 0.1150% 2+L A- A38 0.1151% – 0.1475% 2H BBB+ Baa19 0.1476% – 0.1925% 2M BBB Baa210 0.1926% – 0.3170% 2L BBB- Baa3
11 0.3171% – 0.5645% 2-H BB+ Ba1
Non-investmentGrade
12 0.5646% – 0.9360% 2-M BB Ba213 0.9361% – 1.5380% 2-L BB- Ba314 1.5381% – 2.3030% 3+H B+ B115 2.3031% – 3.3460% 3+M B B216 3.3461% – 6.7890% 3+L B- B317 6.7891% – 10.2880% 3H CCC+ Caa118 10.2881% – 13.0635% 3M CCC Caa219 13.0636% – 22.1820% 3L CCC- Caa320 22.1821% – 99.9990% 4 CC Ca
21 100% 5 D CImpaired22 100% 6 D C
* This table represents an integral part of our 2020 Annual Consolidated Financial Statements.
Counterparty credit riskCounterparty credit risk is the risk that a party with whom the bank has entered into a financial or non-financial contract will failto fulfill its contractual agreement and default on its obligation. It incorporates not only the contract’s current value, but alsoconsiders how that value can move as market conditions change. Counterparty credit risk usually arises from trading-relatedderivative and repo-style transactions. Derivative transactions include forwards, futures, swaps and options, and can haveunderlying references that are either financial (e.g., interest rate, foreign exchange, credit, or equity) or non-financial (e.g.,precious metal and commodities). For further details on our derivative instruments and credit risk mitigation, refer to Note 8 ofour 2020 Annual Consolidated Financial Statements.
Trading counterparty credit activities are undertaken in a manner consistent with the relevant requirements under theECRMF and the Enterprise Market Risk Management Framework (EMRMF), in line with our credit risk management policydocuments and with approval in accordance with the appropriate delegated authorities.
Management’s Discussion and Analysis Royal Bank of Canada: Annual Report 2020 63

The primary risk mitigation techniques for trading counterparty credit risk are close-out netting and collateralization.Close-out netting considers the net value of contractual obligations between counterparties in a default situation, therebyreducing overall credit exposure. Collateralization is when a borrower pledges assets as security, which provides recourse to thelender in the event of default. The policies that we maintain in relation to the recognition of risk mitigation from these techniquesincorporate such considerations as:• The use of standardized agreements such as the International Swaps and Derivatives Association Master Agreement and
Credit Support Annex;• Restricting eligible collateral to high quality liquid assets, primarily cash and highly-rated government securities, subject to
appropriate haircuts; and• The use of initial margin and variation margin arrangements in accordance with regulatory requirements and internal risk
standards.
Similarly, for securities finance and repurchase trading activity we mitigate counterparty credit risk via the use of standardizedsecurities finance agreements, and by taking collateral generally in the form of eligible liquid securities.
We also mitigate counterparty credit risk through the use of central counterparties (CCPs). These highly-regulated entitiesintermediate trades between participating bilateral counterparties and mitigate credit risk through the use of initial andvariation margin and the ability to net offsetting trades amongst participants. The specific structure and capitalization, includingcontingent capital arrangements, of individual CCPs are analyzed as part of assigning an internal counterparty credit risk ratingand determining appropriate counterparty credit risk limits.
Wrong-way riskWrong-way risk is the risk that exposure to a counterparty is adversely correlated with the credit quality of that counterparty.There are two types of wrong-way risk:• Specific wrong-way risk, which exists when our exposure to a particular counterparty is positively correlated with the PD of
the counterparty due to the nature of our transactions with them (e.g., loans collateralized by shares or debt issued by thecounterparty or a related party). Specific wrong-way risk over-the-counter (OTC) derivative trades are done on an exceptionbasis only, and are permitted only when explicitly pre-approved by GRM. Factors considered in reviewing such trades includethe credit quality of the counterparty, the nature of the asset(s) underlying the derivative and the existence of creditmitigation.
• General wrong-way risk, which exists when there is a positive correlation between the PD of the counterparties and generalmacroeconomic or market factors. This typically occurs with derivatives (e.g., the size of the exposure increases) or withcollateralized transactions (e.g., the value of the collateral declines). We monitor general wrong-way counterparty credit riskusing a variety of metrics including stress scenarios, investment strategy concentration, the ability of counterparties togenerate cash and liquidity, liquidity of the collateral and terms of financing.
Retail credit riskCredit scoring is the primary risk rating system for assessing obligor and transaction risk for retail exposures. Scoring modelsuse internal and external data to assess and score borrowers, predict future performance and manage limits for existing loansand collection activities. Credit scores are one of the factors employed in the acquisition of new clients and management ofexisting clients. The credit score of the borrower is used to assess the predicted credit risk for each independent acquisitionor account management action, leading to an automated decision or guidance for an adjudicator. Credit scoring improvescredit decision quality, adjudication timeframes and consistency in the credit decision process and facilitates risk-basedpricing. Since the onset of COVID-19, we adapted our retail credit risk methodology by enhancing our product level creditstrategies with advanced analytics and portfolio monitoring.
To arrive at a retail risk rating, borrower scores are categorized and associated with PDs for further grouping into riskrating categories. The following table approximates the mapping of PD bands to various summarized risk levels for retailexposures:
Internal ratings map* Table 42
PD bands Description0.030% – 1.828% Low risk
1.829% – 5.670% Medium risk
5.671% – 99.99% High risk
100% Impaired/Default
* This table represents an integral part of our 2020 Annual Consolidated Financial Statements.
Credit risk mitigation
We seek to reduce our exposure to credit risk through a variety of means, including the structuring of transactions and theuse of collateral.
Structuring of transactionsSpecific credit policies and procedures set out the requirements for structuring transactions. Risk mitigants include the useof guarantees, collateral, seniority, loan-to-value requirements and covenants. Product-specific guidelines set outappropriate product structuring as well as client and guarantor criteria.
CollateralWhen we advance credit, we often require obligors to pledge collateral as security. The extent of risk mitigation provided bycollateral depends on the amount, type and quality of the collateral taken. Specific requirements relating to collateralvaluation and management are set out in our credit risk management policies.
64 Royal Bank of Canada: Annual Report 2020 Management’s Discussion and Analysis

The types of collateral used to secure credit or trading facilities within the bank are varied. For example, our securitiesfinancing and collateralized OTC derivatives activities are primarily secured by cash and highly-rated liquid government andagency securities. Wholesale lending to business clients is often secured by pledges of the assets of the business, such asaccounts receivable, inventory, operating assets and commercial real estate. In Canadian Banking and Wealth Management,collateral typically consists of a pledge over a real estate property, or a portfolio of debt securities and equities trading on arecognized exchange.
• We employ a risk-based approach to property valuation. Property valuation methods include automated valuation models(AVM) and appraisals. An AVM is a tool that estimates the value of a property by reference to market data including sales ofcomparable properties and price trends specific to the Metropolitan Statistical Area in which the property being valued islocated. Using a risk-based approach, we also employ appraisals which can include drive-by or full on-site appraisals.
• We continue to actively manage our entire mortgage portfolio and perform stress testing, based on a combination ofincreasing unemployment, rising interest rates and a downturn in real estate markets.
• We are compliant with regulatory requirements that govern residential mortgage underwriting practices, includingloan-to-value parameters and property valuation requirements.
There were no significant changes regarding our risk management policies on collateral or to the quality of the collateralheld during the period.
Credit risk approval
The Board, GE, GRC and other senior management committees work together to ensure the ECRMF and supporting policies,processes and procedures exist to manage credit risk and approve related credit risk limits. Reports are provided to theBoard, the GRC, and senior executives to keep them informed of our risk profile, including significant credit risk issues, shiftsin exposures and trending information, to ensure appropriate and timely actions can be taken where necessary. Ourenterprise-wide credit risk policies set out the minimum requirements for the management of credit risk in a variety ofborrower, transactional and portfolio management contexts.
Transaction approvalCredit transactions are governed by our RBC Enterprise Policy on Risk Limits and Risk Approval Authorities that captures thelimits delegated to management and the credit rules policy, which outlines the minimum standards for managing credit riskat the individual client relationship and/or transaction level. The credit rules policy is further supported by business and/orproduct-specific policies and guidelines as appropriate. Transaction approvals are subject to delegated approval authoritiesand if they exceed senior management’s authorities the approval of the Risk Committee of the Board is required.
Product approvalProposals for credit products and services are comprehensively reviewed and approved under a risk assessment frameworkand are subject to approval authorities which increase as the level of risk increases. New and amended products must bereviewed relative to all risk drivers, including credit risk. All existing products must be reviewed following a risk-basedassessment approach on a regular basis.
Credit risk limits• Credit risk authorities are delegated by the Board and take into account both regulatory constraints and internal risk
management judgment. Limits are established at the following levels: single name limits, regional, country andindustrial sector limits (notional and economic capital), regulatory large exposure limits, product and portfolio limits,and underwriting and distribution risk limits. These limits apply across all businesses, portfolios, transactions andproducts.
• We actively manage credit exposures and limits to ensure alignment with our risk appetite, to maintain our targetbusiness mix and to ensure that there is no undue concentration risk.• Concentration risk is defined as the risk arising from large exposures that are highly correlated such that their
ability to meet contractual obligations could be similarly affected by changes in economic, political or other riskdrivers.
• Credit concentration limits are reviewed on a regular basis after taking into account business, economic, financialand regulatory environments.
Credit risk administrationLoan forbearanceIn our overall management of borrower relationships, economic or legal reasons may necessitate forbearance to certain clientswith respect to the original terms and conditions of their loans. We have specialized groups and formalized policies that directthe management of delinquent or defaulted borrowers. We strive to identify borrowers in financial difficulty early and modifytheir loan terms to maximize collection and to avoid foreclosure, repossession, or other legal remedies. In these circumstances, aborrower may be granted concessions that would not otherwise be considered. Examples of such concessions to retail borrowersmay include rate reduction, payment deferral, principal forgiveness and term extensions. Concessions to wholesale borrowersmay include payment deferral, restructuring the agreements, modifying the original terms of the agreement and/or relaxation ofcovenants. For both retail and wholesale loans, the appropriate remediation techniques are based on the individual borrower’ssituation, our policy and the customer’s willingness and capacity to meet the new arrangement.
Management’s Discussion and Analysis Royal Bank of Canada: Annual Report 2020 65

Credit risk exposure by portfolio, sector and geographyThe following table presents our credit risk exposures under the Basel regulatory defined classes and reflects EAD. Theclassification of our sectors aligns with our view of credit risk by industry.
Credit risk exposure by portfolio, sector and geography Table 43
As at
October 312020
October 312019
Credit risk (1) Counterparty credit risk (2) Credit risk (1) Counterparty credit risk (2)
(Millions of Canadian dollars)On-balance
sheet amount
Off-balance sheetamount (3) Repo-style
transactions DerivativesTotal
exposureOn-balance
sheet amount
Off-balance sheetamount (3) Repo-style
transactions DerivativesTotal
exposureUndrawn Other (4) Undrawn Other (4)
RetailResidential secured (5) $ 338,653 $ 88,728 $ – $ – $ – $ 427,381 $ 316,047 $ 64,825 $ – $ – $ – $ 380,872Qualifying revolving (6) 24,328 67,779 – – – 92,107 26,834 73,530 – – – 100,364Other retail 68,325 14,183 67 – – 82,575 61,095 13,927 72 – – 75,094
Total retail $ 431,306 $ 170,690 $ 67 $ – $ – $ 602,063 $ 403,976 $ 152,282 $ 72 $ – $ – $ 556,330
WholesaleAgriculture $ 9,560 $ 1,854 $ 34 $ – $ 108 $ 11,556 $ 9,084 $ 1,744 $ 46 $ – $ 79 $ 10,953Automotive 8,410 7,564 289 – 791 17,054 9,710 6,990 298 – 1,217 18,215Banking 39,228 1,501 562 42,745 19,891 103,927 45,444 1,857 615 46,601 17,908 112,425Consumer discretionary 14,436 9,303 510 – 649 24,898 15,972 8,641 766 – 533 25,912Consumer staples 6,069 6,945 538 – 1,252 14,804 5,346 8,543 518 – 1,116 15,523Oil & gas 7,800 10,779 1,600 – 2,492 22,671 8,165 10,661 1,390 – 1,551 21,767Financial services 32,853 22,257 3,256 109,772 21,162 189,300 30,194 21,023 2,749 118,239 16,688 188,893Financing products 3,755 1,098 522 90 1,055 6,520 667 848 516 81 1,146 3,258Forest products 1,155 851 125 – 41 2,172 1,468 688 97 – 27 2,280Governments 245,204 4,727 1,624 43,806 6,963 302,324 105,011 8,120 1,432 8,228 7,214 130,005Industrial products 6,962 9,397 723 – 801 17,883 7,793 8,237 565 – 644 17,239Information technology 4,632 5,073 257 13 3,898 13,873 4,604 5,704 229 9 2,355 12,901Investments 17,636 2,963 437 13 230 21,279 16,507 2,722 398 9 309 19,945Mining & metals 1,692 3,930 979 – 338 6,939 1,698 4,209 878 – 227 7,012Public works & infrastructure 1,345 2,007 340 – 239 3,931 1,738 1,769 397 – 192 4,096Real estate & related 72,006 13,729 1,573 – 1,180 88,488 61,178 12,372 1,374 – 728 75,652Other services 24,965 12,285 1,336 5 1,857 40,448 25,528 11,811 1,148 35 1,645 40,167Telecommunication & media 4,987 7,451 83 – 1,752 14,273 4,855 9,645 109 – 1,872 16,481Transportation 7,492 5,612 1,533 – 1,714 16,351 5,390 6,557 2,141 – 1,844 15,932Utilities 8,739 18,705 3,849 – 3,852 35,145 9,189 19,233 4,266 – 3,347 36,035Other sectors 1,699 647 1 17 9,291 11,655 1,677 382 2 8 19,904 21,973
Total wholesale $ 520,625 $ 148,678 $ 20,171 $ 196,461 $ 79,556 $ 965,491 $ 371,218 $ 151,756 $ 19,934 $ 173,210 $ 80,546 $ 796,664
Total exposure (7) $ 951,931 $ 319,368 $ 20,238 $ 196,461 $ 79,556 $ 1,567,554 $ 775,194 $ 304,038 $ 20,006 $ 173,210 $ 80,546 $ 1,352,994
By geography (8)Canada $ 688,813 $ 247,258 $ 10,887 $ 85,735 $ 31,490 $ 1,064,183 $ 551,503 $ 224,258 $ 9,890 $ 65,915 $ 37,273 $ 888,839U.S. 188,791 54,101 8,086 53,445 21,390 325,813 149,514 58,344 8,694 55,391 17,387 289,330Europe 40,331 15,450 1,131 43,287 21,537 121,736 41,860 18,600 1,258 40,529 21,644 123,891Other International 33,996 2,559 134 13,994 5,139 55,822 32,317 2,836 164 11,375 4,242 50,934
Total exposure (7) $ 951,931 $ 319,368 $ 20,238 $ 196,461 $ 79,556 $ 1,567,554 $ 775,194 $ 304,038 $ 20,006 $ 173,210 $ 80,546 $ 1,352,994
(1) EAD for standardized exposures are reported net of allowance for impaired assets and EAD for IRB exposures are reported gross of all allowance for credit losses andpartial write-offs as per regulatory definitions.
(2) Counterparty credit risk EAD reflects exposure amounts after netting. Collateral is included in EAD for repo-style transactions to the extent allowed by regulatoryguidelines. Exchange traded derivatives are included in Other sectors.
(3) EAD for undrawn credit commitments and other off-balance sheet amounts are reported after the application of credit conversion factors.(4) Includes other off-balance sheet exposures such as letters of credit and guarantees.(5) Includes residential mortgages and home equity lines of credit.(6) Includes credit cards, unsecured lines of credit and overdraft protection products.(7) Excludes securitization, banking book equities and other assets not subject to the standardized or IRB approach as well as exposures from the Paycheck Protection
Program (PPP) instituted by the U.S. government in Q2 2020. For further details on the PPP, refer to the Significant developments: COVID-19 section.(8) Geographic profile is based on country of residence of the borrower.
2020 vs. 2019Total credit risk exposure increased $215 billion or 16% from last year, primarily due to higher deposits with the Bank of Canada,volume growth in loans and acceptances in our retail and wholesale portfolios, an increase in securities and higher repo-styletransactions.
Retail exposure increased $46 billion or 8%, primarily driven by volume growth in the residential secured portfolio.Wholesale exposure increased $169 billion or 21%, mainly due to higher deposits with the Bank of Canada, higher government
debt securities and repo-style transactions, largely driven by our cash and liquidity management activities. Volume growth inloans and acceptances also contributed to the increase.
The geographic mix of our credit risk exposure changed slightly from the prior year. Our exposure in Canada, the U.S., Europeand Other International was 68%, 21%, 8%, and 3%, respectively (October 31, 2019 – 66%, 21%, 9% and 4%, respectively).
Our exposure in Canada increased $175 billion or 20% compared to the prior year, largely due to higher deposits with theBank of Canada driven by our cash and liquidity management activities and volume growth in the residential secured portfolio.
Our exposure in the U.S. increased $37 billion or 13% compared to the prior year, mainly due to an increase in securities andvolume growth in loans and acceptances.
Our exposure in Europe decreased $2 billion or 2% compared to the prior year.Our exposure in Other International increased $5 billion or 10% compared to the prior year, largely due to an increase in
securities and higher repo-style transactions.
66 Royal Bank of Canada: Annual Report 2020 Management’s Discussion and Analysis

Net European exposure by country and client type (1), (2) Table 44
As at
October 31
2020October 31
2019Asset type Client type
(Millions of Canadian dollars)Loans
Outstanding Securities (3)Repo-style
transactions Derivatives Financials Sovereign Corporate Total Total
U.K. $ 9,417 $ 10,114 $ 592 $ 4,834 $13,207 $ 2,579 $ 9,171 $ 24,957 $23,487Germany 2,247 7,785 22 177 5,112 2,548 2,571 10,231 7,227France 1,498 2,546 18 380 1,256 2,072 1,114 4,442 9,211
Total U.K., Germany, France $ 13,162 $ 20,445 $ 632 $ 5,391 $19,575 $ 7,199 $12,856 $ 39,630 $39,925
Ireland $ 761 $ 21 $ 376 $ 50 $ 631 $ 1 $ 576 $ 1,208 $ 1,467Italy 114 114 – 17 55 82 108 245 821Portugal – 10 – – – – 10 10 67Spain 266 215 2 37 109 21 390 520 520
Total peripheral $ 1,141 $ 360 $ 378 $ 104 $ 795 $ 104 $ 1,084 $ 1,983 $ 2,875
Luxembourg $ 2,696 $ 6,930 $ 38 $ 60 $ 1,887 $ 6,425 $ 1,412 $ 9,724 $11,723Netherlands 1,406 754 22 216 607 7 1,784 2,398 2,250Norway 114 1,433 28 31 1,394 57 155 1,606 2,553Sweden 153 1,747 – 20 863 910 147 1,920 2,225Switzerland 827 5,239 149 192 562 5,031 814 6,407 5,308Other 2,169 2,045 88 170 1,404 1,095 1,973 4,472 4,818
Total other Europe $ 7,365 $ 18,148 $ 325 $ 689 $ 6,717 $13,525 $ 6,285 $ 26,527 $28,877
Net exposure to Europe (4), (5) $ 21,668 $ 38,953 $ 1,335 $ 6,184 $27,087 $20,828 $20,225 $ 68,140 $71,677
(1) Geographic profile is based on country of risk, which reflects our assessment of the geographic risk associated with a given exposure. Typically, this is the residence ofthe borrower.
(2) Exposures are calculated on a fair value basis and net of collateral, which includes $137.7 billion against repo-style transactions (October 31, 2019 – $120.5 billion) and$13.5 billion against derivatives (October 31, 2019 – $11.4 billion).
(3) Securities include $5.3 billion of trading securities (October 31, 2019 – $9.4 billion), $19.1 billion of deposits (October 31, 2019 – $22.5 billion), and $14.6 billion of debtsecurities carried at FVOCI (October 31, 2019 – $12.9 billion).
(4) Excludes $2.5 billion (October 31, 2019 – $1.5 billion) of exposures to supranational agencies, predominately in Luxembourg.(5) Reflects $1.4 billion of mitigation through credit default swaps, which are largely used to hedge single name exposures and market risk (October 31, 2019 – $1.0 billion).
2020 vs. 2019Net credit risk exposure to Europe decreased $3.5 billion or 5% from last year, mainly driven by lower trading securities acrossmost of Europe. Lower deposits with central banks in France and Luxembourg, partially offset by higher deposits with centralbanks in Switzerland and the U.K. also contributed to the decrease. These factors were partially offset by volume growth in loans,mainly in Germany, the U.K., and France.
Our European corporate loan book is managed on a global basis with underwriting standards reflecting the same approachto the use of our balance sheet as we have applied in both Canada and the U.S. PCL on loans during the year was $303 million.GIL was $206 million with a GIL ratio of 95 bps, up 51 bps from last year, across a few sectors including the oil & gas sector.
Management’s Discussion and Analysis Royal Bank of Canada: Annual Report 2020 67

Residential mortgages and home equity lines of credit (insured vs. uninsured)Residential mortgages and home equity lines of credit are secured by residential properties. The following table presents abreakdown by geographic region.
Residential mortgages and home equity lines of credit Table 45
As at October 31, 2020
(Millions of Canadian dollars,except percentage amounts)
Residential mortgagesHome equity
lines of creditInsured (1) Uninsured Total Total
Region (2)
CanadaAtlantic provinces $ 8,181 51% $ 7,824 49% $ 16,005 $ 1,684Quebec 13,265 36 24,059 64 37,324 3,300Ontario 37,779 26 110,247 74 148,026 16,147Alberta 21,245 52 19,300 48 40,545 5,830Saskatchewan and Manitoba 9,350 48 10,163 52 19,513 2,148B.C. and territories 14,491 25 43,383 75 57,874 7,926
Total Canada (3) $ 104,311 33% $ 214,976 67% $ 319,287 $ 37,035U.S. (4) 1 – 20,331 100 20,332 1,651Other International (4) – – 2,978 100 2,978 1,282
Total International $ 1 –% $ 23,309 100% $ 23,310 $ 2,933
Total $ 104,312 30% $ 238,285 70% $ 342,597 $ 39,968
As at October 31, 2019
(Millions of Canadian dollars,except percentage amounts)
Residential mortgagesHome equity
lines of credit
Insured (1) Uninsured Total Total
Region (2)
CanadaAtlantic provinces $ 7,715 52% $ 7,169 48% $ 14,884 $ 1,838Quebec 12,385 36 22,091 64 34,476 3,512Ontario 36,195 28 92,947 72 129,142 16,585Alberta 20,688 53 18,143 47 38,831 6,324Saskatchewan and Manitoba 8,951 49 9,238 51 18,189 2,363B.C. and territories 14,711 28 37,534 72 52,245 8,267
Total Canada (3) $ 100,645 35% $ 187,122 65% $ 287,767 $ 38,889U.S. (4) 1 – 17,011 100 17,012 1,652Other International (4) 5 – 3,307 100 3,312 1,373
Total International $ 6 –% $ 20,318 100% $ 20,324 $ 3,025
Total $ 100,651 33% $ 207,440 67% $ 308,091 $ 41,914
(1) Insured residential mortgages are mortgages whereby our exposure to default is mitigated by insurance through CMHC or otherprivate mortgage default insurers.
(2) Region is based upon the address of the property mortgaged. The Atlantic provinces are comprised of Newfoundland and Labrador,Prince Edward Island, Nova Scotia and New Brunswick, and B.C. and territories are comprised of British Columbia, Nunavut, NorthwestTerritories and Yukon.
(3) Total consolidated residential mortgages in Canada of $319 billion (October 31, 2019 – $288 billion) is largely comprised of $291 billion(October 31, 2019 – $263 billion) of residential mortgages and $10 billion (October 31, 2019 – $7 billion) of mortgages with commercialclients, of which $7 billion (October 31, 2019 – $4 billion) are insured mortgages, both in Canadian Banking, and $18 billion (October 31,2019 – $18 billion) of residential mortgages in Capital Markets held for securitization purposes.
(4) Home equity lines of credit include term loans collateralized by residential mortgages.
Home equity lines of credit are uninsured and reported within the personal loan category. As at October 31, 2020, home equitylines of credit in Canadian Banking were $37 billion (October 31, 2019 – $39 billion).
68 Royal Bank of Canada: Annual Report 2020 Management’s Discussion and Analysis

Residential mortgages portfolio by amortization periodThe following table provides a summary of the percentage of residential mortgages that fall within the remaining amortizationperiods based upon current customer payment amounts, which incorporate payments larger than the minimum contractualamount and/or higher frequency of payments.
Residential mortgages portfolio by amortization period Table 46
As at
October 31
2020October 31
2019
CanadaU.S. and otherInternational Total Canada
U.S. and otherInternational Total
Amortization period≤ 25 years 77% 35% 74% 72% 38% 70%> 25 years ≤ 30 years 22 65 25 24 62 26> 30 years ≤ 35 years 1 – 1 3 – 3> 35 years – – – 1 – 1
Total 100% 100% 100% 100% 100% 100%
Average loan-to-value (LTV) ratiosThe following table provides a summary of our average LTV ratio for newly originated and acquired uninsured residentialmortgages and RBC Homeline Plan® products by geographic region:
Average LTV ratio Table 47
For the year ended
October 31
2020October 31
2019Uninsured Uninsured
Residentialmortgages (1)
RBC HomelinePlan® products (2)
Residentialmortgages (1)
RBC HomelinePlan® products (2)
Region (3)
Atlantic provinces 74% 75% 74% 74%Quebec 73 73 72 73Ontario 71 68 70 68Alberta 73 72 73 72Saskatchewan and Manitoba 74 75 74 74B.C. and territories 69 66 68 65U.S. 72 n.m. 74 n.m.Other International 69 n.m. 71 n.m.
Average of newly originatedand acquired for theperiod (4), (5) 71% 69% 71% 69%
Total Canadian Bankingresidential mortgagesportfolio (6) 57% 49% 57% 50%
(1) Residential mortgages exclude residential mortgages within the RBC Homeline Plan® products.(2) RBC Homeline Plan® products are comprised of both residential mortgages and home equity lines of credit.(3) Region is based upon address of the property mortgaged. The Atlantic provinces are comprised of Newfoundland and Labrador, Prince
Edward Island, Nova Scotia and New Brunswick, and B.C. and territories are comprised of British Columbia, Nunavut, NorthwestTerritories and Yukon.
(4) The average LTV ratio for newly originated and acquired uninsured residential mortgages and RBC Homeline Plan® products is calculatedon a weighted basis by mortgage amounts at origination.
(5) For newly originated mortgages and RBC Homeline Plan® products, LTV is calculated based on the total facility amount for the residentialmortgage and RBC Homeline Plan® product divided by the value of the related residential property.
(6) Weighted by mortgage balances and adjusted for property values based on the Teranet – National Bank National Composite House PriceIndex.
n.m. not meaningful
Management’s Discussion and Analysis Royal Bank of Canada: Annual Report 2020 69

Credit quality performanceThe following credit quality performance tables and analysis provide information on loans, which represents loans, acceptancesand commitments, and other financial assets.
Provision for credit losses Table 48
For the year ended
(Millions of Canadian dollars, except percentage amounts)
October 31
2020October 31
2019
Personal & Commercial Banking $ 2,875 $ 1,470Wealth Management 212 117Capital Markets 1,140 304Corporate Support and other 4 –
PCL – Loans $ 4,231 $ 1,891PCL – Other financial assets 120 (27)
Total PCL $ 4,351 $ 1,864
PCL on loans is comprised of:Retail $ 1,071 $ 133Wholesale 1,560 67
PCL on performing loans $ 2,631 $ 200
Retail $ 937 $ 1,092Wholesale 663 599
PCL on impaired loans $ 1,600 $ 1,691
PCL – Loans $ 4,231 $ 1,891
PCL on loans as a % of average net loans and acceptances 0.63% 0.31%PCL on impaired loans as a % of average net loans and acceptances 0.24% 0.27%
Additional information by geography (1)
CanadaResidential mortgages $ 35 $ 32Personal 395 488Credit cards 471 505Small business 49 36
Retail $ 950 $ 1,061Wholesale 163 292
PCL on impaired loans $ 1,113 $ 1,353
U.S.Retail $ 5 $ 12Wholesale 377 223
PCL on impaired loans $ 382 $ 235
Other InternationalRetail $ (18) $ 19Wholesale 123 84
PCL on impaired loans $ 105 $ 103
PCL on impaired loans $ 1,600 $ 1,691
(1) Geographic information is based on residence of the borrower.
2020 vs. 2019Total PCL was $4,351 million. PCL on loans of $4,231 million increased $2,340 million, or 124% from the prior year, due to higherprovisions primarily in Personal & Commercial Banking, Capital Markets and Wealth Management. The PCL on loans ratio of63 bps increased 32 bps.
PCL on performing loans of $2,631 million increased $2,431 million, primarily reflecting higher provisions in Personal &Commercial Banking, Capital Markets and Wealth Management due to the impact of the COVID-19 pandemic.
PCL on impaired loans of $1,600 million decreased $91 million or 5%, primarily due to lower provisions in Personal &Commercial Banking, partially offset by higher provisions in Capital Markets.
PCL on other financial assets of $120 million, compared to $(27) million in the prior year, largely reflecting higher provisionsin Capital Markets due to the impact of the COVID-19 pandemic, while the prior year reflected recoveries in Personal &Commercial Banking, mainly due to favourable parameter updates.
PCL on loans in Personal & Commercial Banking increased $1,405 million, largely reflecting higher provisions on performing loansin our Canadian Banking and Caribbean Banking portfolios primarily as a result of unfavourable changes in both macroeconomicfactors and our credit quality outlook due to the impact of the COVID-19 pandemic. These factors were partially offset by lowerprovisions on impaired loans in our Canadian Banking commercial and retail portfolios due to the impact of the COVID-19 relatedgovernment support and payment deferral programs.
70 Royal Bank of Canada: Annual Report 2020 Management’s Discussion and Analysis
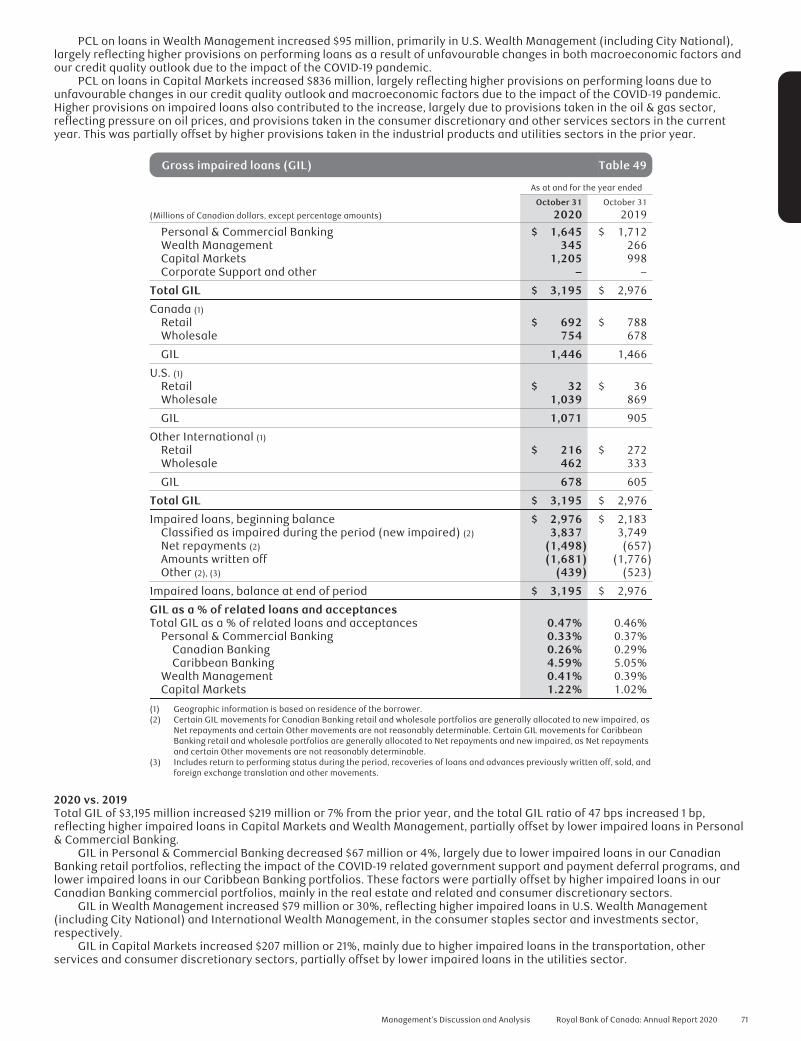
PCL on loans in Wealth Management increased $95 million, primarily in U.S. Wealth Management (including City National),largely reflecting higher provisions on performing loans as a result of unfavourable changes in both macroeconomic factors andour credit quality outlook due to the impact of the COVID-19 pandemic.
PCL on loans in Capital Markets increased $836 million, largely reflecting higher provisions on performing loans due tounfavourable changes in our credit quality outlook and macroeconomic factors due to the impact of the COVID-19 pandemic.Higher provisions on impaired loans also contributed to the increase, largely due to provisions taken in the oil & gas sector,reflecting pressure on oil prices, and provisions taken in the consumer discretionary and other services sectors in the currentyear. This was partially offset by higher provisions taken in the industrial products and utilities sectors in the prior year.
Gross impaired loans (GIL) Table 49
As at and for the year ended
(Millions of Canadian dollars, except percentage amounts)
October 31
2020October 31
2019
Personal & Commercial Banking $ 1,645 $ 1,712Wealth Management 345 266Capital Markets 1,205 998Corporate Support and other – –
Total GIL $ 3,195 $ 2,976
Canada (1)
Retail $ 692 $ 788Wholesale 754 678
GIL 1,446 1,466
U.S. (1)
Retail $ 32 $ 36Wholesale 1,039 869
GIL 1,071 905
Other International (1)
Retail $ 216 $ 272Wholesale 462 333
GIL 678 605
Total GIL $ 3,195 $ 2,976
Impaired loans, beginning balance $ 2,976 $ 2,183Classified as impaired during the period (new impaired) (2) 3,837 3,749Net repayments (2) (1,498) (657)Amounts written off (1,681) (1,776)Other (2), (3) (439) (523)
Impaired loans, balance at end of period $ 3,195 $ 2,976
GIL as a % of related loans and acceptancesTotal GIL as a % of related loans and acceptances 0.47% 0.46%
Personal & Commercial Banking 0.33% 0.37%Canadian Banking 0.26% 0.29%Caribbean Banking 4.59% 5.05%
Wealth Management 0.41% 0.39%Capital Markets 1.22% 1.02%
(1) Geographic information is based on residence of the borrower.(2) Certain GIL movements for Canadian Banking retail and wholesale portfolios are generally allocated to new impaired, as
Net repayments and certain Other movements are not reasonably determinable. Certain GIL movements for CaribbeanBanking retail and wholesale portfolios are generally allocated to Net repayments and new impaired, as Net repaymentsand certain Other movements are not reasonably determinable.
(3) Includes return to performing status during the period, recoveries of loans and advances previously written off, sold, andforeign exchange translation and other movements.
2020 vs. 2019Total GIL of $3,195 million increased $219 million or 7% from the prior year, and the total GIL ratio of 47 bps increased 1 bp,reflecting higher impaired loans in Capital Markets and Wealth Management, partially offset by lower impaired loans in Personal& Commercial Banking.
GIL in Personal & Commercial Banking decreased $67 million or 4%, largely due to lower impaired loans in our CanadianBanking retail portfolios, reflecting the impact of the COVID-19 related government support and payment deferral programs, andlower impaired loans in our Caribbean Banking portfolios. These factors were partially offset by higher impaired loans in ourCanadian Banking commercial portfolios, mainly in the real estate and related and consumer discretionary sectors.
GIL in Wealth Management increased $79 million or 30%, reflecting higher impaired loans in U.S. Wealth Management(including City National) and International Wealth Management, in the consumer staples sector and investments sector,respectively.
GIL in Capital Markets increased $207 million or 21%, mainly due to higher impaired loans in the transportation, otherservices and consumer discretionary sectors, partially offset by lower impaired loans in the utilities sector.
Management’s Discussion and Analysis Royal Bank of Canada: Annual Report 2020 71

Allowance for credit losses Table 50
As at
(Millions of Canadian dollars)
October 31
2020October 31
2019
Personal & Commercial Banking $ 4,424 $ 2,710Wealth Management 404 252Capital Markets 1,281 455Corporate Support and other 6 2
ACL on loans $ 6,115 $ 3,419ACL on other financial assets 147 45
Total ACL $ 6,262 $ 3,464
ACL on loans is comprised of:Retail $ 2,932 $ 1,886Wholesale 2,234 701
ACL on performing loans $ 5,166 $ 2,587ACL on impaired loans $ 949 $ 832
Additional information by geography (1)
CanadaRetail $ 164 $ 187Wholesale 220 172
ACL on impaired loans $ 384 $ 359
U.S.Retail $ 1 $ 1Wholesale 267 141
ACL on impaired loans $ 268 $ 142
Other InternationalRetail $ 116 $ 156Wholesale 181 175
ACL on impaired loans $ 297 $ 331
ACL on impaired loans $ 949 $ 832
(1) Geographic information is based on residence of the borrower.
2020 vs. 2019Total ACL of $6,262 million increased $2,798 million or 81% from the prior year, primarily reflecting an increase of $2,696 million inACL on loans.
ACL on performing loans of $5,166 million increased $2,579 million from the prior year, primarily reflecting higher ACL inPersonal & Commercial Banking, Capital Markets and Wealth Management due to the impact of the COVID-19 pandemic.
ACL on impaired loans of $949 million increased $117 million from the prior year, primarily due to higher ACL in CapitalMarkets, partially offset by lower ACL in Personal & Commercial Banking.
72 Royal Bank of Canada: Annual Report 2020 Management’s Discussion and Analysis

Market risk
Market risk is defined to be the impact of market prices upon our financial condition. This includes potential gains or lossesdue to changes in market determined variables such as interest rates, credit spreads, equity prices, commodity prices, foreignexchange rates and implied volatilities.
The measures of financial condition impacted by market risk are as follows:
1. Positions whose revaluation gains and losses are reported in Revenue, which includes:a) Changes in the fair value of instruments classified or designated as FVTPL, andb) Hedge ineffectiveness.
2. CET1 capital, which includes:a) All of the above, plusb) Changes in the fair value of FVOCI securities where revaluation gains and losses are reported as OCI,c) Changes in the Canadian dollar value of investments in foreign subsidiaries, net of hedges, due to foreign exchange
translation, andd) Changes in the fair value of employee benefit plan deficits.
3. CET1 ratio, which includes:a) All of the above, plusb) Changes in RWA resulting from changes in traded market risk factors, andc) Changes in the Canadian dollar value of RWA due to foreign exchange translation.
4. The economic value of the Bank, which includes:a) Points 1 and 2 above, plusb) Changes in the economic value of other non-trading positions, net interest income, and fee based income, as a
result of changes in market risk factors.
Market risk controls – FVTPL positionsAs an element of the ERAF, the Board approves our overall market risk constraints. GRM creates and manages the controlstructure for FVTPL positions which ensures that business is conducted on a basis consistent with Board requirements. TheMarket and Trading Credit Risk function within GRM is responsible for creating and managing the controls and governanceprocedures that ensure that risk taken is consistent with risk appetite constraints set by the Board. These controls includelimits on probabilistic measures of potential loss such as Value-at-Risk, Stressed Value-at-Risk and Incremental Risk Chargeas defined below:
Value-at-Risk (VaR) is a statistical measure of potential loss for a financial portfolio computed at a given level ofconfidence and over a defined holding period. We measure VaR at the 99th percentile confidence level for price movementsover a one-day holding period using historic simulation of the last two years of equally weighted historic market data.These calculations are updated daily with current risk positions, with the exception of certain less material positions thatare not actively traded and are updated on at least a monthly basis.
Stressed Value-at-Risk (SVaR) is calculated in an identical manner as VaR with the exception that it is computed using afixed historical one-year period of extreme volatility and its inverse rather than the most recent two-year history. Thestress period used was updated in early Q3 2020 from the 2008/2009 period covering the Global Financial Crisis to a one-year period covering the market volatility observed during Q2 2020. SVaR is calculated daily for all portfolios, with theexception of certain less material positions that are not actively traded and are updated on at least a monthly basis.
VaR and SVaR are statistical estimates based on historical market data and should be interpreted with knowledge of theirlimitations, which include the following:
• VaR and SVaR will not be predictive of future losses if the realized market movements differ significantly from thehistorical periods used to compute them.
• VaR and SVaR project potential losses over a one-day holding period and do not project potential losses for riskpositions held over longer time periods.
• VaR and SVaR are measured using positions at close of business and do not include the impact of trading activity overthe course of a day.
We validate our VaR and SVaR measures through a variety of means – including subjecting the models to vetting andvalidation by a group independent of the model developers and by back-testing the VaR against daily marked-to-marketrevenue to identify and examine events in which actual outcomes in trading revenue exceed the VaR projections.
Incremental Risk Charge (IRC) captures the risk of losses under default or rating changes for issuers of certain traded fixedincome instruments. IRC is measured over a one year horizon at a 99.9% confidence level, and captures different liquidityhorizons for instruments and concentrations in issuers under a constant level of risk assumption. Changes in measured risklevels are primarily associated with changes in inventory from the applicable fixed income trading portfolios.
Stress tests – Our market risk stress testing program is used to identify and control risk due to large changes in market pricesand rates. We conduct stress testing daily on positions that are marked-to-market. The stress tests simulate both historical andhypothetical events which are severe and long term in duration. Historical scenarios are taken from actual market events andrange in duration up to 90 days. Examples include the Global Financial Crisis of 2008 and the Taper Tantrum panic of 2013.Hypothetical scenarios are designed to be forward-looking at potential future market stresses, and are designed to be severe butplausible. We are constantly evaluating and refining these scenarios as market conditions change. Stress results are calculatedassuming an instantaneous revaluation of our positions with no management action.
Management’s Discussion and Analysis Royal Bank of Canada: Annual Report 2020 73

These measures are computed on all positions that are FVTPL for financial reporting purposes, with the exception of those in adesignated hedging relationship and those in our insurance businesses.
Market risk measures – FVTPL positions
Market risk measures* Table 51
October 31, 2020 October 31, 2019
For the year ended For the year ended
(Millions of Canadian dollars) As at Average High Low As at Average High Low
Equity $ 23 $ 33 $ 64 $ 13 $ 22 $ 19 $ 32 $ 11Foreign exchange 3 3 6 1 3 4 13 2Commodities 3 3 7 1 2 2 4 1Interest rate (1) 47 54 178 11 13 14 19 11Credit specific (2) 7 6 7 4 5 5 6 4Diversification (3) (18) (25) n.m. n.m. (17) (17) n.m. n.m.
Market risk VaR $ 65 $ 74 $ 232 $ 18 $ 28 $ 27 $ 45 $ 15
Market risk Stressed VaR $ 86 $ 109 $ 228 $ 49 $ 85 $ 106 $ 161 $ 76
* This table represents an integral part of our 2020 Annual Consolidated Financial Statements.(1) General credit spread risk and funding spread risk associated with uncollateralized derivatives are included under interest rate VaR.(2) Credit specific risk captures issuer-specific credit spread volatility.(3) Market risk VaR is less than the sum of the individual risk factor VaR results due to portfolio diversification.n.m. not meaningful
2020 vs. 2019Average market risk VaR of $74 million increased $47 million from the prior year, largely due to the impact of credit spreadswidening and significant market volatility experienced in the second quarter of 2020 being included in the historical VaR periodsstarting in April 2020. These factors impacted loan underwriting commitments, as well as fixed income and equity portfolios. Asindicated in the Trading revenue and VaR graph below, VaR levels declined during the second half of fiscal 2020 as overall marketvolatility and credit spreads improved, combined with a reduction of loan underwriting commitments.
Average SVaR of $109 million increased $3 million from the prior year. Similar to VaR, SVaR was also impacted by changes incredit spreads and overall market volatility in fiscal 2020, and the SVaR period was updated this year as outlined in the Marketrisk controls section above. However, the increase in average SVaR is lower than that of average VaR as the historical periodused to calculate SVaR reflects a period of similar market volatility.
The following chart displays a bar graph of our daily trading profit and loss and a line graph of our daily market risk VaR. We had13 days with net trading losses in 2020 largely due to the significant market volatility experienced in the second quarter of 2020.Four of these net trading loss days exceeded VaR.
Nov 1, 2019
Jan 31, 2020
Apr 30, 2020
Jul 31, 2020
Oct 31, 2020
150
100
50
0
-200
-100
-150
-50
-250
Trading Revenue (1) Market Risk VaR
Trading revenue (1) and VaR (Millions of Canadian dollars)
(1) Includes loan underwriting commitments.
74 Royal Bank of Canada: Annual Report 2020 Management’s Discussion and Analysis

The following chart displays the distribution of daily trading profit and loss in 2020 and 2019 with 13 days of losses in 2020 asmentioned above and 1 day of losses in 2019. The largest reported profit was $99 million with an average daily profit of $21 million.
Freq
uenc
y in
Num
ber
of D
ays
Daily net trading revenue (C$ millions), excluding structured entities
2020 2019
< -1
00 -90
-80
-70
-60
-50
-40
-30
-20
-10 0 10 20 30 40 50 60 70 80 90 100
0102030405060708090
100
Trading Revenue (1) for the year ended October 31, 2020 (teb)
(1) Includes loan underwriting commitments.
Market risk measures for assets and liabilities of RBC Insurance®
We offer a range of insurance products to clients and hold investments to meet the future obligations to policyholders. Theinvestments which support actuarial liabilities are predominantly fixed income assets designated as FVTPL. Consequently,changes in the fair values of these assets are recorded in the Consolidated Statements of Income and are largely offset bychanges in the fair value of the actuarial liabilities, the impact of which is reflected in Insurance policyholder benefits, claims andacquisition expense. As at October 31, 2020, we held assets in support of $12.2 billion of liabilities with respect to insuranceobligations (October 31, 2019 – $11.4 billion).
Market risk controls – Interest Rate Risk in the Banking Book (IRRBB) positions1
IRRBB activity arises primarily from traditional customer-originated banking products such as deposits and loans, andincludes related hedges as well as the interest rate risk from securities held for liquidity management. Factors contributing toIRRBB include the mismatch between asset and liability repricing dates, relative changes in asset and liability rates inresponse to market rate scenarios, and other product features that could affect the expected timing of cash flows, such asoptions to pre-pay loans or redeem term deposits prior to contractual maturity. IRRBB exposures are subject to limits andcontrols and are regularly measured and reported with independent oversight from GRM.
The Board approves the risk appetite for IRRBB, and the Asset-Liability Committee (ALCO), along with GRM, providesongoing governance of IRRBB measurement and management through risk policies, limits, operating standards and othercontrols. IRRBB reports are reviewed regularly by GRM, ALCO, the GRC, the Risk Committee of the Board and the Board.
IRRBB measurementTo monitor and control IRRBB, we assess two primary metrics, Net Interest Income (NII) risk and Economic Value of Equity(EVE) risk, under a range of market shocks, scenarios, and time horizons. Market scenarios include currency-specific paralleland non-parallel yield curve changes, interest rate volatility shocks, and regulator-prescribed interest rate shock scenarios.
In measuring NII risk, detailed structural balance sheets and income statements are dynamically simulated to determinethe impact of market stress scenarios on projected NII. Assets, liabilities and off-balance sheet positions are simulated overvarious time horizons. The simulations incorporate product maturities, renewals and growth along with prepayment andredemption behaviour. Product pricing and volumes are forecast based on past experience and expectations for a givenmarket stress scenario. EVE risk captures the market value sensitivity to changes in rates. In measuring EVE risk, deterministic(single-scenario) and stochastic (multiple-scenario) valuation techniques are applied to detailed spot position data. NII andEVE risks are measured for a range of market risk stress scenarios which include extreme but plausible changes in marketrates and volatilities. The IRRBB measures do not include the benefit of management actions to reduce exposures.
Management of NII and EVE risk is complementary and supports our efforts to generate a sustainable high-quality NII stream. NIIand EVE risks for specific units are measured daily, weekly or monthly depending on their materiality, complexity and hedge strategy.
A number of assumptions affecting cash flows, product re-pricing and the administration of rates underlie the modelsused to measure NII and EVE risk. The key assumptions pertain to the expected funding profile of mortgage rate commitments,fixed rate loan prepayment behaviour, term deposit redemption behaviour, and the treatment of non-maturity deposits. Allassumptions are derived empirically based on historical client behaviour and product pricing with consideration of possibleforward-looking changes. All models and assumptions used to measure IRRBB are subject to independent oversight by GRM.
Market risk measures – IRRBB SensitivitiesThe following table shows the potential before-tax impact of an immediate and sustained 100 bps increase or decrease ininterest rates on projected 12-month NII and EVE, assuming no subsequent hedging. Rate floors are applied within thedeclining rates scenarios which prevent EVE valuation and NII simulation rate levels from falling below a minimum averagelevel of negative 25 bps across major currencies. Interest rate risk measures are based upon interest rate exposures at aspecific time, which over time, can change in response to business activities and management actions.
1 IRRBB positions include the impact of derivatives in hedge accounting relationships and FVOCI securities used for interest rate risk management.
Management’s Discussion and Analysis Royal Bank of Canada: Annual Report 2020 75

Market risk – IRRBB measures* Table 52
2020 2019EVE risk NII risk (1)
(Millions of Canadian dollars)Canadian
dollar impactU.S. dollar
impact TotalCanadian
dollar impactU.S. dollar
impact Total EVE risk NII risk (1)
Before-tax impact of:100 bps increase in rates (2) $ (1,486) $ (270) $(1,756) $ 571 $ 247 $ 818 $(1,356) $ 479100 bps decrease in rates (2) 1,145 176 1,321 (472) (149) (621) 920 (637)
* This table represents an integral part of our 2020 Annual Consolidated Financial Statements.(1) Represents the 12-month NII exposure to an instantaneous and sustained shift in interest rates.(2) The IRRBB 100 bps rate increase and decrease scenarios were updated on a prospective basis in accordance with OSFI’s B-12: Interest Rate Risk Management guideline,
which became effective January 1, 2020. This resulted in the inclusion of EVE and NII risk arising from Capital Markets and treasury related services within Investor &Treasury Services banking book activities in 2020.
As at October 31, 2020, an immediate and sustained -100 bps shock would have had a negative impact to our NII of $621 million,down from $637 million last year. An immediate and sustained +100 bps shock at the end of October 31, 2020 would have had anegative impact to our EVE of $1,756 million, up from $1,356 million reported last year. The year-over-year change in NII sensitivityis largely attributed to higher business and retail deposit growth, while the year-over-year change in EVE sensitivity is mainly dueto growth in bank’s book capital base. During 2020, NII and EVE risks remained within approved limits.
Market risk measures for other material non-trading portfoliosInvestment securities carried at FVOCIWe held $81.9 billion of investment securities carried at FVOCI as at October 31, 2020, compared to $57.7 billion in the prior year.We hold debt securities carried at FVOCI primarily as investments, as well as to manage liquidity risk and hedge interest rate riskin our non-trading banking balance sheet. As at October 31, 2020, our portfolio of investment securities carried at FVOCI isinterest rate sensitive and would impact OCI by a pre-tax change in value of $7 million as measured by the change in the value ofthe securities for a one basis point parallel increase in yields. The portfolio also exposes us to credit spread risk of a pre-taxchange in value of $20 million, as measured by the change in value for a one basis point widening of credit spreads. The value ofthe investment securities carried at FVOCI included in our IRRBB measure as at October 31, 2020 was $79.0 billion. Our investmentsecurities carried at FVOCI also include equity exposures of $0.5 billion as at October 31, 2020, compared to $0.4 billion in theprior year.
Non-trading foreign exchange rate riskForeign exchange rate risk is the potential adverse impact on earnings and economic value due to changes in foreign currencyrates. Our revenue, expenses and income denominated in currencies other than the Canadian dollar are subject tofluctuations as a result of changes in the value of the average Canadian dollar relative to the average value of thosecurrencies. Our most significant exposure is to the U.S. dollar, due to our operations in the U.S. and other activities conductedin U.S. dollars. Other significant exposures are to the British pound and the Euro, due to our activities conductedinternationally in these currencies. A strengthening or weakening of the Canadian dollar compared to the U.S. dollar, Britishpound and the Euro could reduce or increase, as applicable, the translated value of our foreign currency denominatedrevenue, expenses and earnings and could have a significant effect on the results of our operations. We are also exposed toforeign exchange rate risk arising from our investments in foreign operations. For unhedged equity investments, when theCanadian dollar appreciates against other currencies, the unrealized translation losses on net foreign investments decreasesour shareholders’ equity through the other components of equity and decreases the translated value of the RWA of the foreigncurrency-denominated asset. The reverse is true when the Canadian dollar depreciates against other currencies.Consequently, we consider these impacts in selecting an appropriate level of our investments in foreign operations to behedged.
Derivatives related to non-trading activityDerivatives are also used to hedge market risk exposure unrelated to our trading activity. Hedge accounting is elected whereapplicable. These derivatives are included in our IRRBB measure and other internal non-trading market risk measures. We useinterest rate swaps to manage our IRRBB, funding and investment activities. Interest rate swaps are also used to hedge changesin the fair value of certain fixed-rate instruments. We also use foreign exchange derivatives to manage our exposure to equityinvestments in subsidiaries that are denominated in foreign currencies, particularly the U.S. dollar, British Pound, and Euro.
For further details on the application of hedge accounting and the use of derivatives for hedging activities, refer to Notes 2 and 8of our 2020 Annual Consolidated Financial Statements.
76 Royal Bank of Canada: Annual Report 2020 Management’s Discussion and Analysis

Linkage of market risk to selected balance sheet itemsThe following tables provide the linkages between selected balance sheet items with positions included in our trading market riskand non-trading market risk disclosures, which illustrates how we manage market risk for our assets and liabilities throughdifferent risk measures:
Linkage of market risk to selected balance sheet items Table 53
As at October 31, 2020
Market risk measure
(Millions of Canadian dollars)
Balance sheetamount Traded risk (1)
Non-tradedrisk (2)
Non-traded riskprimary risk sensitivity
Assets subject to market riskCash and due from banks $ 118,888 $ – $ 118,888 Interest rateInterest-bearing deposits with banks 39,013 21,603 17,410 Interest rateSecurities
Trading 136,071 124,884 11,187 Interest rate, credit spreadInvestment, net of applicable allowance 139,743 – 139,743 Interest rate, credit spread, equity
Assets purchased under reverse repurchaseagreements and securities borrowed 313,015 264,394 48,621 Interest rate
LoansRetail 457,976 10,392 447,584 Interest rateWholesale 208,655 6,855 201,800 Interest rateAllowance for loan losses (5,639) – (5,639) Interest rate
Segregated fund net assets 1,922 – 1,922 Interest rateOther
Derivatives 113,488 109,175 4,313 Interest rate, foreign exchangeOther assets 90,937 6,475 84,462 Interest rate
Assets not subject to market risk (3) 10,479
Total assets $ 1,624,548 $ 543,778 $ 1,070,291
Liabilities subject to market riskDeposits $ 1,011,885 $ 107,450 $ 904,435 Interest rateSegregated fund liabilities 1,922 – 1,922 Interest rateOther
Obligations related to securities sold short 29,285 29,285 –Obligations related to assets sold under
repurchase agreements and securities loaned 274,231 255,922 18,309 Interest rateDerivatives 109,927 108,147 1,780 Interest rate, foreign exchangeOther liabilities 86,994 8,977 78,017 Interest rate
Subordinated debentures 9,867 – 9,867 Interest rateLiabilities not subject to market risk (4) 13,670
Total liabilities $ 1,537,781 $ 509,781 $ 1,014,330
Total equity $ 86,767
Total liabilities and equity $ 1,624,548
(1) Traded risk includes positions that are classified or designated as FVTPL and positions whose revaluation gains and losses are reported in revenue. Market riskmeasures of VaR, SVaR, IRC and stress testing are used as risk controls for traded risk.
(2) Non-traded risk includes positions used in the management of the IRRBB and other non-trading portfolios. Other material non-trading portfolios include positions fromRBC Insurance® and investment securities, net of applicable allowance, not included in IRRBB.
(3) Assets not subject to market risk include $10,479 million of physical and other assets.(4) Liabilities not subject to market risk include $13,670 million of payroll related and other liabilities.
Management’s Discussion and Analysis Royal Bank of Canada: Annual Report 2020 77

As at October 31, 2019
Market risk measure
(Millions of Canadian dollars)
Balance sheetamount Traded risk (1)
Non-tradedrisk (2)
Non-traded riskprimary risk sensitivity
Assets subject to market riskCash and due from banks $ 26,310 $ – $ 26,310 Interest rateInterest-bearing deposits with banks 38,345 22,287 16,058 Interest rateSecurities
Trading 146,534 136,609 9,925 Interest rate, credit spreadInvestment, net of applicable allowance 102,470 – 102,470 Interest rate, credit spread, equity
Assets purchased under reverse repurchaseagreements and securities borrowed 306,961 246,068 60,893 Interest rate
LoansRetail 426,086 10,876 415,210 Interest rateWholesale 195,870 7,111 188,759 Interest rateAllowance for loan losses (3,100) – (3,100) Interest rate
Segregated fund net assets 1,663 – 1,663 Interest rateOther
Derivatives 101,560 99,318 2,242 Interest rate, foreign exchangeOther assets 79,802 4,648 75,154 Interest rate
Assets not subject to market risk (3) 6,434
Total assets $ 1,428,935 $ 526,917 $ 895,584
Liabilities subject to market riskDeposits $ 886,005 $ 99,137 $ 786,868 Interest rateSegregated fund liabilities 1,663 – 1,663 Interest rateOther
Obligations related to securities sold short 35,069 35,069 –Obligations related to assets sold under repurchase
agreements and securities loaned 226,586 218,612 7,974 Interest rateDerivatives 98,543 96,512 2,031 Interest rate, foreign exchangeOther liabilities 79,040 8,918 70,122 Interest rate
Subordinated debentures 9,815 – 9,815 Interest rateLiabilities not subject to market risk (4) 8,589
Total liabilities $ 1,345,310 $ 458,248 $ 878,473
Total equity $ 83,625
Total liabilities and equity $ 1,428,935
(1) Traded risk includes positions that are classified or designated as FVTPL and positions whose revaluation gains and losses are reported in revenue. Market riskmeasures of VaR, SVaR, IRC and stress testing are used as risk controls for traded risk.
(2) Non-traded risk includes positions used in the management of the IRRBB and other non-trading portfolios. Other material non-trading portfolios include positions fromRBC Insurance® and investment securities, net of applicable allowance, not included in IRRBB.
(3) Assets not subject to market risk include $6,434 million of physical and other assets.(4) Liabilities not subject to market risk include $8,589 million of payroll related and other liabilities.
Liquidity and funding risk
Liquidity and funding risk (liquidity risk) is the risk that we may be unable to generate sufficient cash or its equivalents in atimely and cost-effective manner to meet our commitments as they come due. Liquidity risk arises from mismatches in thetiming and value of on-balance sheet and off-balance sheet cash flows.
Our liquidity profile is structured to ensure that we have sufficient liquidity to satisfy current and prospectivecommitments in both normal and stressed conditions. To achieve this goal, we operate under a comprehensive Liquidity RiskManagement Framework (LRMF) and Pledging Policy. We also employ several liquidity risk mitigation strategies that include:• Achieving an appropriate balance between the level of exposure allowed under our risk appetite and the cost of risk
mitigation;• Maintaining broad funding access, including preserving and promoting a reliable base of core client deposits and ongoing
access to diversified wholesale funding sources;• A comprehensive liquidity stress testing program, contingency, recovery and resolution planning and status monitoring to
ensure sufficiency of unencumbered marketable securities and demonstrated capacity to monetize specific asset classes;• Governance of pledging activity through limits and liquid asset buffers for potential pledging activity;• Timely and granular risk measurement information;• Transparent liquidity transfer pricing and cost allocation; and• Our three lines of defense governance model.
Commencing in the second quarter of 2020, governments and federal agencies expanded the eligibility criteria to their existingfunding programs and announced new programs to provide further liquidity to banks. In addition to these measures, OSFIannounced a series of regulatory measures and provided additional guidance to allow banks to focus on their resilience effortsand to enhance the financial system’s stability. Subsequently, governments and federal agencies have assessed and willcontinue to assess the need of these programs. Effective October 21, 2020, certain programs, such as the Bankers’ AcceptancePurchase Facility and the revised insured mortgage purchase program through the CMHC were discontinued and the existingterm repo facilities will be reduced to pre-pandemic levels over time. The remaining measures continue to provide additionalflexibility in lending activities permitting banks to fall below the regulatory minimum through the use of available buffers abovethe regulatory authorized minimum for the Liquidity Coverage Ratio (LCR) and temporary modifications in limits, including thoseused for covered bonds, and adjustments to other liquidity metrics.
78 Royal Bank of Canada: Annual Report 2020 Management’s Discussion and Analysis

Risk controlOur liquidity risk objectives, policies and methodologies are reviewed regularly, and are updated to reflect changing marketconditions and business mix. This includes aligning with local regulatory developments. We continue to maintain liquidity andfunding that is appropriate for the execution of our strategy. Liquidity risk remains well within our risk appetite.
The Board annually approves the delegation of liquidity risk authorities to senior management. The Risk Committee of theBoard annually approves the LRMF and the Pledging Policy and is responsible for their oversight. The Board, the RiskCommittee of the Board, the GRC and the ALCO regularly review reporting on our enterprise-wide liquidity position. The GRC,the Policy Review Committee (PRC) and/or the ALCO also review liquidity documents prepared for the Board or itscommittees.• The PRC annually approves the Liquidity Risk Policy, which establishes minimum risk control elements in accordance with
the Board-approved risk appetite and the LRMF.• The ALCO annually approves the Liquidity Contingency Plan (LCP) and provides strategic direction and oversight to
Corporate Treasury, other functions, and business segments on the management of liquidity.
These policies are supported by operational, desk and product-level policies that implement risk control elements, such asparameters, methodologies, management limits and authorities that govern the measurement and management of liquidity.Stress testing is also employed to assess the robustness of the control framework and inform liquidity contingency plans.
Risk measurementLiquidity risk is measured by applying scenario-specific assumptions against our assets and liabilities and off-balance sheetcommitments to derive expected cash flow profiles over varying time horizons. For example, government bonds generally canbe quickly and easily converted to cash without significant loss of value regardless of their contractual maturity. Similarly,while relationship-based deposits contractually can be withdrawn immediately, in practice, these balances can be relativelystable sources of funding depending on several factors, such as the nature of the client and their intended use. Riskmethodologies and underlying assumptions are periodically reviewed and validated to ensure their alignment with ouroperating environment, expected economic and market conditions, rating agency preferences, regulatory requirements andgenerally accepted industry practices.
To manage liquidity risk within our liquidity risk appetite, we set limits on various metrics reflecting a range of time horizonsand severity of stress conditions and develop contingency, recovery and resolution plans. Our liquidity risk measurement andcontrol activities are divided into three categories as follows:
Structural (longer-term) liquidity riskTo guide our secured and unsecured wholesale term funding activities, we employ both internal and regulatory metrics tomanage and control the structural alignment between long-term illiquid assets and longer-term funding sourced fromwholesale investors and core relationship deposits.
Tactical (shorter-term) liquidity riskTo address potential immediate cash flow risks in times of stress, we use short-term net cash flow limits to control risk ofmaterial units, subsidiaries and currencies, and perform stress testing assessments. Net cash flow positions are determinedby applying internally-derived risk assumptions and parameters to known and anticipated cash flows for all materialunencumbered assets, liabilities and off-balance sheet activities. Encumbered assets are not considered a source of availableliquidity. We also control tactical liquidity by adhering to relevant regulatory standards, such as LCR.
Contingency liquidity riskContingency liquidity risk planning assesses the impact of sudden stress events and our planned responses. Our LCP,maintained and administered by Corporate Treasury, has been developed to guide our potential responses to liquidity crises.Under leadership of Corporate Treasury, both enterprise and regional Liquidity Crisis Teams (LCT) meet regularly to assessour liquidity status, approve the LCP, and in times of stress provide valuable linkages to front line and risk functions tosupport the crisis management process. LCT’s include members from key business segments, GRM, Finance, Operations, andCommunications with relevant subject matter expertise.
Our stress tests, which include elements of scenario and sensitivity analyses, measure our prospective exposure to systemicand RBC-specific events over a period of several weeks. Different levels of severity are considered for each type of crisis withsome scenarios reflecting multiple-downgrades to our credit ratings.
The contingency liquidity risk planning process identifies contingent funding needs (e.g., draws on committed credit andliquidity lines, demands for more collateral and deposit run-off) and sources (e.g., contingent liquid asset sales and incrementalwholesale funding capacity) under various stress scenarios, and as a result, informs requirements for our earmarkedunencumbered liquid asset portfolios.
Our unencumbered liquid asset portfolios consist of diversified, highly rated and liquid marketable securities, overnightgovernment reverse repos and deposits with central banks. These portfolios are subject to minimum asset quality levels and, asappropriate, other eligibility guidelines (e.g., maturity, diversification and eligibility for central bank advances) to maximize readyaccess to additional cash should it be required. These securities, when added to other unencumbered liquid assets that we holdas a result of capital markets or other activities, contribute to our liquidity reserve, and are reflected in the asset encumbrancedisclosures shown below.
Management’s Discussion and Analysis Royal Bank of Canada: Annual Report 2020 79

Liquidity reserve and asset encumbranceThe following tables provide summaries of our liquidity reserve and asset encumbrance. In both tables, unencumbered assetsrepresent, to varying degrees, a ready source of funding. Unencumbered assets are the difference between total and encumberedassets from both on- and off-balance sheet sources. The encumbered assets include: (i) bank-owned liquid assets that are eitherpledged as collateral (e.g., repo financing and derivative pledging) or not freely available due to regulatory or internal policyrequirements (e.g., earmarked to satisfy mandatory reserve or regional capital adequacy requirements and to maintaincontinuous access to payment and settlement systems); (ii) securities received as collateral from securities financing andderivative transactions which have either been re-hypothecated where permissible (e.g., to obtain financing through repos or tocover securities sold short) or have no liquidity value since re-hypothecation is prohibited; and (iii) illiquid assets that have beensecuritized and sold into the market or that have been pledged as collateral in support of structured term funding vehicles. Asper our liquidity management framework and practice, encumbered assets are not considered a source of liquidity.
Liquidity reserveOur liquidity reserve consists of available unencumbered liquid assets. Although unused wholesale funding capacity, which isregularly assessed, could be another potential source of liquidity to mitigate stressed conditions, it is excluded in thedetermination of the liquidity reserve. In addition, uncommitted and undrawn central bank borrowing facilities that could beaccessed subject to satisfying certain preconditions as set by various central banks (e.g., BoC, the Fed, Bank of England, andBank of France), as well as amounts that qualify as eligible collateral at the Federal Reserve Bank of New York (FRBNY) andFederal Home Loan Bank (FHLB) are also excluded from the determination of the liquidity reserve.
Liquidity reserve Table 54
As at October 31, 2020
(Millions of Canadian dollars)Bank-ownedliquid assets
Securities receivedas collateral from
securitiesfinancing and
derivativetransactions
Total liquidassets
Encumberedliquid assets
Unencumberedliquid assets
Cash and due from banks $ 118,888 $ – $118,888 $ 4,022 $ 114,866Interest-bearing deposits with banks 39,013 – 39,013 – 39,013Securities issued or guaranteed by sovereigns, central banks
or multilateral development banks (1) 236,910 309,512 546,422 358,233 188,189Other securities 93,781 101,317 195,098 89,764 105,334Other liquid assets (2) 30,305 – 30,305 27,934 2,371
Total liquid assets $ 518,897 $410,829 $929,726 $ 479,953 $ 449,773
As at October 31, 2019 (3)
(Millions of Canadian dollars)Bank-ownedliquid assets
Securities receivedas collateral from
securitiesfinancing and
derivativetransactions
Total liquidassets
Encumberedliquid assets
Unencumberedliquid assets
Cash and due from banks $ 26,310 $ – $ 26,310 $ 2,860 $ 23,450Interest-bearing deposits with banks 38,345 – 38,345 329 38,016Securities issued or guaranteed by sovereigns, central banks
or multilateral development banks (1) 206,960 311,019 517,979 345,753 172,226Other securities 90,026 115,261 205,287 96,184 109,103Other liquid assets (2) 21,732 – 21,732 21,316 416
Total liquid assets $ 383,373 $ 426,280 $ 809,653 $ 466,442 $ 343,211
As at
(Millions of Canadian dollars)
October 31
2020October 31
2019 (3)
Royal Bank of Canada $261,940 $ 136,511Foreign branches 44,037 61,528Subsidiaries 143,796 145,172
Total unencumbered liquid assets $449,773 $ 343,211
(1) Includes liquid securities issued by provincial governments and U.S. government-sponsored entities working under U.S. Federal government’s conservatorship (e.g.,Federal National Mortgage Association and Federal Home Loan Mortgage Corporation).
(2) Encumbered liquid assets amount represents cash collateral and margin deposit amounts pledged related to OTC and exchange-traded derivative transactions.(3) The presentation has been revised to conform with current period presentation.
The liquidity reserve is typically most affected by routine flows of client banking activity where liquid asset portfolios adjust tothe change in cash balances, and additionally from capital markets activities where business strategies and client flows may alsoaffect the addition or subtraction of liquid assets in the overall calculation of the liquidity reserve. Corporate Treasury alsoaffects liquidity reserves through the management of funding issuances where reserves absorb timing mismatches between debtissuances and deployment into business activities.
80 Royal Bank of Canada: Annual Report 2020 Management’s Discussion and Analysis

2020 vs. 2019Total liquid assets increased $120 billion or 15% and total unencumbered liquid assets increased $107 billion or 31% from the prioryear, primarily due to higher deposits with central banks and an increase in on-balance sheet securities, reflecting higher clientdeposits and liquidity management activities implemented as a result of the COVID-19 pandemic.
Asset encumbranceThe table below provides a summary of our on- and off-balance sheet amounts for cash, securities and other assets,distinguishing between those that are encumbered or available for sale or use as collateral in secured funding transactions.Other assets, such as mortgages and credit card receivables, can also be monetized, albeit over longer timeframes than thoserequired for marketable securities. As at October 31, 2020, our unencumbered assets available as collateral comprised 28% oftotal assets (October 31, 2019 – 23%)1.
Asset encumbrance Table 55
As at
October 31
2020October 31
2019
Encumbered Unencumbered Encumbered Unencumbered
(Millions ofCanadian dollars)
Pledged ascollateral Other (1)
Available ascollateral (2) Other (3) Total
Pledged ascollateral Other (1)
Available ascollateral (2), (4) Other (3), (4) Total
Cash and due from banks $ – $ 4,022 $ 114,866 $ – $ 118,888 $ – $ 2,860 $ 23,450 $ – $ 26,310Interest-bearing deposits
with banks – – 39,013 – 39,013 – 329 38,016 – 38,345Securities
Trading 48,505 – 91,245 3,684 143,434 44,431 – 99,420 2,683 146,534Investment, net of
applicable allowance 13,337 – 126,353 53 139,743 16,376 – 86,045 49 102,470Assets purchased under
reverse repurchaseagreements andsecurities borrowed (5) 400,807 17,209 37,879 5,037 460,932 399,013 22,793 49,325 5,214 476,345
LoansRetail
Mortgage securities 31,460 – 40,050 – 71,510 31,345 – 40,401 – 71,746Mortgage loans 62,131 – 26,389 182,567 271,087 42,103 – 22,598 171,644 236,345Non-mortgage loans 5,711 – 12,006 97,662 115,379 7,094 – 9,534 101,367 117,995
Wholesale – – – 208,655 208,655 – – – 195,870 195,870Allowance for loan losses – – – (5,639) (5,639) – – – (3,100) (3,100)Segregated fund net
assets – – – 1,922 1,922 – – – 1,663 1,663Other
Derivatives – – – 113,488 113,488 – – – 101,560 101,560Others (6) 27,934 – 2,371 71,111 101,416 21,316 – 416 64,504 86,236
Total assets $ 589,885 $ 21,231 $ 490,172 $ 678,540 $1,779,828 $ 561,678 $ 25,982 $ 369,205 $ 641,454 $ 1,598,319
(1) Includes assets restricted from use to generate secured funding due to legal or other constraints.(2) Represents assets that are readily available for use as collateral, including NHA MBS, our unencumbered mortgage loans that qualify as eligible collateral at FHLB, as
well as loans that qualify as eligible collateral for discount window facility available to us and lodged at the FRBNY.(3) Other unencumbered assets are not subject to any restrictions on their use to secure funding or as collateral but would not be considered readily available. This also
includes loans that could be used to collateralize central bank advances, including those for pledging to the BoC under the expanded eligibility criteria announced in Q22020.
(4) Amounts have been revised from those previously presented.(5) Includes bank-owned liquid assets and securities received as collateral from off-balance sheet securities financing, derivative transactions, and margin lending. Includes
$17.2 billion (October 31, 2019 – $22.8 billion) of collateral received through reverse repurchase transactions that cannot be rehypothecated in its current legal form.(6) The Pledged as collateral amount represents cash collateral and margin deposit amounts pledged related to OTC and exchange-traded derivative transactions.
Funding
Funding strategyCore funding, comprising capital, longer-term wholesale liabilities and a diversified pool of personal and, to a lesser extent,commercial and institutional deposits, is the foundation of our structural liquidity position.
Deposit and funding profileAs at October 31, 2020, relationship-based deposits, which are the primary source of funding for retail loans and mortgages, were$708 billion or 54% of our total funding (October 31, 2019 – $594 billion or 51%). The remaining portion is comprised of short- andlong-term wholesale funding.
Funding for highly liquid assets consists primarily of short-term wholesale funding that reflects the monetization period ofthose assets. Long-term wholesale funding is used mostly to fund less liquid wholesale assets and to support liquidity assetbuffers.
On April 18, 2018, the Department of Finance published bail-in regulations under the Canada Deposit Insurance Corporation(CDIC) Act and the Bank Act, which became effective September 23, 2018. Senior long-term debt issued by the bank on or afterSeptember 23, 2018, that has an original term greater than 400 days and is marketable, subject to certain exceptions, is subject tothe Canadian Bank Recapitalization (Bail-in) regime. Under the Bail-in regime, in circumstances when the Superintendent ofFinancial Institutions has determined that a bank may no longer be viable, the Governor in Council may, upon a recommendationof the Minister of Finance that he or she is of the opinion that it is in the public interest to do so, grant an order directing the CDIC
1 Amounts have been revised from those previously presented
Management’s Discussion and Analysis Royal Bank of Canada: Annual Report 2020 81

to convert all or a portion of certain shares and liabilities of that bank into common shares. As at October 31, 2020, the notionalvalue of issued and outstanding long-term debt subject to conversion under the Bail-in regime was $37,365 million (October 31,2019 – $20,320 million).
For further details on our wholesale funding, refer to the Composition of wholesale funding tables below.
Long-term debt issuanceDuring 2020, we continued to experience more favourable unsecured wholesale funding access and pricing compared to manyglobal peers. We issued, either directly or through our subsidiaries, unsecured long-term funding of $20 billion in variouscurrencies and markets, which was more than offset by maturities.
We primarily use residential mortgage and credit card securitization programs as alternative sources of funding and forliquidity and asset/liability management purposes. Our total secured long-term funding includes outstanding MBS sold,covered bonds that are collateralized with residential mortgages and securities backed by credit card receivables.
Compared to 2019, our outstanding MBS sold increased $0.7 billion. Our covered bonds and securitized credit cardreceivables decreased $0.1 billion and $1.4 billion, respectively.
For further details, refer to the Off-balance sheet arrangements section.
Long-term funding sources* Table 56
As at
(Millions of Canadian dollars)
October 31
2020October 31
2019
Unsecured long-term funding $ 88,055 $ 94,662Secured long-term funding 63,043 63,853Subordinated debentures 9,574 9,788
$160,672 $168,303
* This table represents an integral part of our 2020 Annual Consolidated Financial Statements.
Our wholesale funding activities are well-diversified by geography, investor segment, instrument, currency, structure andmaturity. We maintain an ongoing presence in different funding markets which allows us to continuously monitor marketdevelopments and trends, identify opportunities and risks, and take appropriate and timely actions. We operate long-term debtissuance registered programs. The following table summarizes these programs with their authorized limits by geography.
Programs by geography Table 57
Canada U.S. Europe/Asia
• Canadian Shelf Program – $25 billion • U.S. Shelf Program – US$40 billion • European Debt Issuance Program – US$40 billion
• Global Covered Bond Program – €60 billion
• Japanese Issuance Programs – ¥1 trillion
We also raise long-term funding using Canadian Senior Notes, Canadian National Housing Act MBS, Canada Mortgage Bonds,credit card receivable-backed securities, Kangaroo Bonds (issued in the Australian domestic market by foreign firms) and YankeeCertificates of Deposit (issued in the U.S. domestic market by foreign firms). We continuously evaluate opportunities to expandinto new markets and untapped investor segments since diversification expands our wholesale funding flexibility, minimizesfunding concentration and dependency, and generally reduces financing costs. As presented in the following charts, our currentlong-term debt profile is well-diversified by both currency and product. Maintaining competitive credit ratings is also critical tocost-effective funding.
Canadian dollar37%
Other13%
Euro19%
U.S. dollar31%
Long-term debt (1) – funding mix by currency of issuance
Unsecuredfunding51%
MBS/CMB (2)14%
Covered Bonds30%
Cards securitization5%
Long-term debt (1) – funding mix by product
(1) Based on original term to maturity greater than 1 year (1) Based on original term to maturity greater than 1 year(2) Mortgage-backed securities and Canada Mortgage Bonds
82 Royal Bank of Canada: Annual Report 2020 Management’s Discussion and Analysis

The following table provides our composition of wholesale funding based on remaining term to maturity:
Composition of wholesale funding (1) Table 58
As at October 31, 2020
(Millions of Canadian dollars)Less than
1 month1 to 3
months3 to 6
months6 to 12
months
Less than1 year
sub-total1 year to
2 years2 years and
greater Total
Deposits from banks (2) $ 8,681 $ 133 $ 73 $ – $ 8,887 $ – $ – $ 8,887Certificates of deposit and commercial paper 2,542 6,858 11,145 23,783 44,328 – – 44,328Asset-backed commercial paper (3) 2,618 2,167 1,381 6,081 12,247 – – 12,247Senior unsecured medium-term notes (4) 37 4,466 9,836 7,163 21,502 9,413 37,259 68,174Senior unsecured structured notes (5) 230 165 401 1,136 1,932 1,485 5,333 8,750Mortgage securitization – 1,171 267 2,178 3,616 2,561 12,225 18,402Covered bonds/asset-backed securities (6) – 3,688 5,919 5,131 14,738 6,896 23,196 44,830Subordinated liabilities – 1,499 – 1,000 2,499 205 6,870 9,574Other (7) 7,906 892 1,134 1,037 10,969 624 6,726 18,319
Total $ 22,014 $ 21,039 $ 30,156 $ 47,509 $ 120,718 $ 21,184 $ 91,609 $ 233,511
Of which:– Secured $ 10,089 $ 7,508 $ 7,643 $ 13,573 $ 38,813 $ 9,457 $ 35,421 $ 83,691– Unsecured 11,925 13,531 22,513 33,936 81,905 11,727 56,188 149,820
As at October 31, 2019
(Millions of Canadian dollars)Less than
1 month1 to 3
months3 to 6
months6 to 12
months
Less than1 year
sub-total1 year to
2 years2 years and
greater Total
Deposits from banks (2) $ 4,087 $ – $ 388 $ 33 $ 4,508 $ – $ – $ 4,508Certificates of deposit and commercial paper 2,917 12,037 17,390 22,038 54,382 132 – 54,514Asset-backed commercial paper (3) 2,542 3,188 6,543 3,905 16,178 – – 16,178Senior unsecured medium-term notes (4) 11 2,293 9,183 14,188 25,675 18,856 29,756 74,287Senior unsecured structured notes (5) 847 676 171 1,342 3,036 1,810 5,047 9,893Mortgage securitization – 524 1,796 727 3,047 3,523 11,015 17,585Covered bonds/asset-backed securities (6) – – 6,282 2,305 8,587 14,337 23,426 46,350Subordinated liabilities – 2,000 – 998 2,998 2,500 4,290 9,788Other (7) 9,489 1,224 157 1,663 12,533 141 9,976 22,650
Total $ 19,893 $ 21,942 $ 41,910 $ 47,199 $ 130,944 $ 41,299 $ 83,510 $ 255,753
Of which:– Secured $ 10,339 $ 3,929 $ 14,621 $ 6,937 $ 35,826 $ 17,860 $ 34,441 $ 88,127– Unsecured 9,554 18,013 27,289 40,262 95,118 23,439 49,069 167,626
(1) Excludes bankers’ acceptances and repos.(2) Excludes deposits associated with services we provide to banks (e.g., custody, cash management).(3) Only includes consolidated liabilities, including our collateralized commercial paper program.(4) Includes deposit notes.(5) Includes notes where the payout is tied to movements in foreign exchange, commodities and equities.(6) Includes credit card and mortgage loans.(7) Includes tender option bonds (secured) of $8,199 million (October 31, 2019 – $8,014 million), bearer deposit notes (unsecured) of $2,036 million (October 31, 2019 –
$4,813 million), other long-term structured deposits (unsecured) of $8,071 million (October 31, 2019 – $9,823 million), and FHLB advances (secured) of $13 million(October 31, 2019 – $nil).
Management’s Discussion and Analysis Royal Bank of Canada: Annual Report 2020 83

Credit ratingsOur ability to access unsecured funding markets and to engage in certain collateralized business activities on a cost-effectivebasis are primarily dependent upon maintaining competitive credit ratings. Credit ratings and outlooks provided by ratingagencies reflect their views and methodologies. Ratings are subject to change, based on a number of factors including, but notlimited to, our financial strength, competitive position, liquidity and other factors not completely within our control.
The following table presents our major credit ratings:
Credit ratings (1) Table 59
As at December 1, 2020
Short-term debt Legacy senior long-term debt (2) Senior long-term debt (3) OutlookMoody’s (4) P-1 Aa2 A2 stableStandard & Poor’s (5) A-1+ AA- A stableFitch Ratings (6) F1+ AA+ AA negativeDBRS (7) R-1 (high) AA (high) AA stable
(1) Credit ratings are not recommendations to purchase, sell or hold a financial obligation inasmuch as they do not comment on market price or suitability fora particular investor. Ratings are determined by the rating agencies based on criteria established from time to time by them, and are subject to revision orwithdrawal at any time by the rating organization.
(2) Includes senior long-term debt issued prior to September 23, 2018 and senior long-term debt issued on or after September 23, 2018 which is excluded fromthe Bail-in regime.
(3) Includes senior long-term debt issued on or after September 23, 2018 which is subject to conversion under the Bail-in regime.(4) On November 18, 2020, Moody’s affirmed our ratings with a stable outlook.(5) On October 28, 2020, Standard & Poor’s affirmed our ratings with a stable outlook.(6) On April 3, 2020, Fitch Ratings upgraded our rating for legacy senior long-term debt to AA+ from AA and revised our outlook to negative from stable.(7) On June 11, 2020, DBRS affirmed our ratings with a stable outlook.
Additional contractual obligations for rating downgradesWe are required to deliver collateral to certain counterparties in the event of a downgrade to our current credit rating. Thefollowing table provides the additional collateral obligations required at the reporting date in the event of a one-, two- or three-notch downgrade to our credit ratings. These additional collateral obligations are incremental requirements for each successivedowngrade and do not represent the cumulative impact of multiple downgrades. The amounts reported change periodically as aresult of several factors, including the transfer of trading activity to centrally cleared financial market infrastructures andexchanges, the expiration of transactions with downgrade triggers, the imposition of internal limitations on new agreements toexclude downgrade triggers, as well as normal course mark-to-market. There is no outstanding senior debt issued in the marketthat contains rating triggers that would lead to early prepayment of principal.
Additional contractual obligations for rating downgrades Table 60
As at
October 31
2020October 31
2019
(Millions of Canadian dollars)One-notch
downgradeTwo-notch
downgradeThree-notch
downgradeOne-notch
downgradeTwo-notch
downgradeThree-notchdowngrade
Contractual derivatives funding or margin requirements $ 318 $ 78 $ 149 $ 165 $ 64 $ 124Other contractual funding or margin requirements (1) 187 – – 180 176 –
(1) Includes GICs issued by our municipal markets business out of New York.
84 Royal Bank of Canada: Annual Report 2020 Management’s Discussion and Analysis

Liquidity Coverage Ratio (LCR)The LCR is a Basel III metric that measures the sufficiency of high-quality liquid assets (HQLA) available to meet liquidity needsover a 30-day period in an acute stress scenario. The BCBS and OSFI regulatory minimum coverage level for LCR is 100%.However, in accordance with OSFI’s announcement released during Q2 2020, addressing concerns around the impact of theCOVID-19 pandemic, Canadian banks remain temporarily permitted to fall below the regulatory minimum level of 100% by usingtheir HQLA buffer.
OSFI requires Canadian banks to disclose the LCR using the standard Basel disclosure template and calculated using theaverage of daily LCR positions during the quarter.
Liquidity coverage ratio (1) Table 61
For the three months ended
October 31
2020July 31
2020
(Millions of Canadian dollars, except percentage amounts)Total unweighted
value (average) (2)Total weighted
value (average)Total unweighted
value (average) (2)Total weighted
value (average)
High-quality liquid assetsTotal high-quality liquid assets (HQLA) n.a. $ 362,130 n.a. $ 363,107
Cash outflowsRetail deposits and deposits from small business customers,
of which: $ 328,988 $ 31,305 $ 315,366 $ 30,611Stable deposits (3) 112,745 3,382 105,342 3,160Less stable deposits 216,243 27,923 210,024 27,451
Unsecured wholesale funding, of which: 381,795 175,207 362,969 161,583Operational deposits (all counterparties) and deposits in
networks of cooperative banks (4) 166,253 39,457 157,399 37,514Non-operational deposits 184,917 105,125 173,445 91,944Unsecured debt 30,625 30,625 32,125 32,125
Secured wholesale funding n.a. 26,032 n.a. 25,635Additional requirements, of which: 253,070 58,184 252,341 61,042
Outflows related to derivative exposures and other collateralrequirements 43,442 16,668 50,398 20,632
Outflows related to loss of funding on debt products 8,524 8,524 9,154 9,154Credit and liquidity facilities 201,104 32,992 192,789 31,256
Other contractual funding obligations (5) 18,928 18,928 19,408 19,408Other contingent funding obligations (6) 563,574 8,682 592,465 8,488
Total cash outflows n.a. $ 318,338 n.a. $ 306,767
Cash inflowsSecured lending (e.g., reverse repos) $ 260,609 $ 40,151 $ 261,600 $ 41,235Inflows from fully performing exposures 10,408 6,121 10,689 6,232Other cash inflows 21,656 21,656 23,108 23,108
Total cash inflows n.a. $ 67,928 n.a. $ 70,575Total adjusted
valueTotal adjusted
value
Total HQLA $ 362,130 $ 363,107Total net cash outflows 250,410 236,192
Liquidity coverage ratio 145% 154%
(1) The LCR is calculated in accordance with OSFI’s LAR guideline, which, in turn, reflects liquidity-related requirements issued by the BCBS as updated in accordance withthe regulatory guidance issued in fiscal 2020. The LCR for the quarter ended October 31, 2020 is calculated as an average of 63 daily positions.
(2) With the exception of other contingent funding obligations, unweighted inflow and outflow amounts are items maturing or callable in 30 days or less. Other contingentfunding obligations also include debt securities with remaining maturity greater than 30 days.
(3) As defined by the BCBS, stable deposits from retail and small business customers are deposits that are insured and are either held in transactional accounts or the bankhas an established relationship with the client making the withdrawal unlikely.
(4) Operational deposits from customers other than retail and small and medium-sized enterprises, are deposits which clients need to keep with the bank in order tofacilitate their access and ability to use payment and settlement systems primarily for clearing, custody and cash management activities.
(5) Other contractual funding obligations primarily include outflows from unsettled securities trades and outflows from obligations related to securities sold short.(6) Other contingent funding obligations include outflows related to other off-balance sheet facilities that carry low LCR runoff factors (0% — 5%).n.a. not applicable
We manage our LCR position within a target range that reflects our liquidity risk tolerance and takes into account business mix,asset composition and funding capabilities. The range is subject to periodic review in light of changes to internal requirementsand external developments. Our LCR is currently above our normal target range as a result of the ongoing COVID-19 pandemic.Our increased liquidity levels in the current and prior quarters of 2020 were largely driven by client deposit inflows resulting fromindustry-wide impacts of the pandemic and corresponding central bank actions.
We maintain HQLAs in major currencies with dependable market depth and breadth. Our treasury management practicesensure that the levels of HQLA are actively managed to meet target LCR objectives. Our Level 1 assets, as calculated according toOSFI LAR and the BCBS LCR requirements, represent 89% of total HQLA. These assets consist of cash, placements with centralbanks and highly rated securities issued or guaranteed by governments, central banks and supranational entities.
LCR captures cash flows from on- and off-balance sheet activities that are either expected or could potentially occur within30 days in an acute stress scenario. Cash outflows result from the application of withdrawal and non-renewal factors to demand
Management’s Discussion and Analysis Royal Bank of Canada: Annual Report 2020 85

and term deposits, differentiated by client type (wholesale, retail and small- and medium-sized enterprises). Cash outflows alsoarise from business activities that create contingent funding and collateral requirements, such as repo funding, derivatives, shortsales of securities and the extension of credit and liquidity commitments to clients. Cash inflows arise primarily from maturingsecured loans, interbank loans and non-HQLA securities.
LCR does not reflect any market funding capacity that we believe would be available in a stress situation. All maturingwholesale debt is assigned 100% outflow in the LCR calculation.
Q4 2020 vs. Q3 2020The average LCR for the quarter ended October 31, 2020 was 145%, which translates into a surplus of approximately $112 billion,compared to 154% and a surplus of approximately $127 billion in the prior quarter. While average LCR remains at higher thannormal levels due to sustained increases in client deposits driven largely due to industry-wide impacts of the pandemic andassociated actions taken by central banks, it has declined quarter over quarter due to liquidity optimization actions taken bymanagement. As we expect liquidity levels will continue to be influenced by central bank policy into fiscal 2021, we will continueto manage our LCR in reflection of these and other industry-wide developments.
Contractual maturities of financial assets, financial liabilities and off-balance sheet itemsThe following tables provide remaining contractual maturity profiles of all our assets, liabilities, and off-balance sheet items attheir carrying value (e.g., amortized cost or fair value) at the balance sheet date. Off-balance sheet items are allocated based onthe expiry date of the contract.
Details of contractual maturities and commitments to extend funds are a source of information for the management ofliquidity risk. Among other purposes, these details form a basis for modelling a behavioural balance sheet with effectivematurities to calculate liquidity risk measures. For further details, refer to the Risk measurement section.
Contractual maturities of financial assets, financial liabilities and off-balance sheet items Table 62
As at October 31, 2020
(Millions of Canadian dollars)Less than
1 month1 to 3
months3 to 6
months6 to 9
months9 to 12
months1 year
to 2 years2 years
to 5 years5 years
and greater
With nospecific
maturity Total
AssetsCash and deposits with banks $155,418 $ 2 $ – $ – $ – $ – $ – $ – $ 2,481 $ 157,901Securities
Trading (1) 82,486 51 49 25 80 50 98 9,615 43,617 136,071Investment, net of applicable
allowance 3,213 4,762 6,445 10,765 9,079 26,313 25,315 53,355 496 139,743Assets purchased under reverse
repurchase agreements andsecurities borrowed 162,269 61,661 47,211 25,083 9,990 2 – – 6,799 313,015
Loans, net of applicable allowance 24,334 21,593 24,742 28,236 25,951 132,783 266,935 56,253 80,165 660,992Other
Customers’ liability underacceptances 12,157 6,402 50 – – – 5 – (107) 18,507
Derivatives 5,035 10,946 4,932 3,433 2,726 13,550 20,205 52,650 11 113,488Other financial assets 32,713 2,741 1,520 499 71 323 257 2,099 2,692 42,915
Total financial assets $477,625 $108,158 $84,949 $68,041 $47,897 $173,021 $312,815 $ 173,972 $136,154 $1,582,632Other non-financial assets 4,540 1,411 97 860 234 1,939 1,802 5,988 25,045 41,916
Total assets $482,165 $109,569 $85,046 $68,901 $48,131 $174,960 $314,617 $ 179,960 $161,199 $1,624,548
Liabilities and equityDeposits (2)
Unsecured borrowing $ 74,636 $ 35,167 $53,458 $34,733 $29,763 $ 21,843 $ 58,702 $ 17,234 $590,020 $ 915,556Secured borrowing 2,794 6,605 4,022 6,242 4,142 7,400 18,705 6,427 – 56,337Covered bonds – 1,942 5,412 1,295 2,501 3,707 16,195 8,940 – 39,992
OtherAcceptances 12,158 6,401 50 – – – – – 9 18,618Obligations related to securities
sold short 29,285 – – – – – – – – 29,285Obligations related to assets sold
under repurchase agreementsand securities loaned 219,075 19,396 20,606 376 1,492 4,971 – – 8,315 274,231
Derivatives 4,467 11,553 4,423 3,355 2,709 11,900 20,985 50,396 139 109,927Other financial liabilities 34,767 2,183 1,133 484 435 851 2,180 10,994 563 53,590
Subordinated debentures – – – – – 205 110 9,552 – 9,867
Total financial liabilities $377,182 $ 83,247 $89,104 $46,485 $41,042 $ 50,877 $116,877 $ 103,543 $599,046 $1,507,403Other non-financial liabilities 1,053 5,395 209 212 193 951 1,010 11,910 9,445 30,378Equity – – – – – – – – 86,767 86,767
Total liabilities and equity $378,235 $ 88,642 $89,313 $46,697 $41,235 $ 51,828 $117,887 $ 115,453 $695,258 $1,624,548
Off-balance sheet itemsFinancial guarantees $ 401 $ 1,745 $ 2,186 $ 3,137 $ 3,004 $ 700 $ 4,529 $ 1,383 $ 56 $ 17,141Commitments to extend credit 5,285 4,803 14,821 16,163 12,306 45,633 161,524 16,876 4,828 282,239Other credit-related commitments 1,982 903 1,634 1,745 1,400 260 623 10 78,768 87,325Other commitments 7 14 20 20 20 82 209 344 551 1,267
Total off-balance sheet items $ 7,675 $ 7,465 $18,661 $21,065 $16,730 $ 46,675 $166,885 $ 18,613 $ 84,203 $ 387,972
(1) Trading debt securities classified as FVTPL have been included in the less than 1 month category as there is no expectation to hold these assets to their contractualmaturity.
(2) A major portion of relationship-based deposits are repayable on demand or at short notice on a contractual basis while, in practice, these customer balances form a corebase for our operations and liquidity needs, as explained in the preceding Deposit and funding profile section.
86 Royal Bank of Canada: Annual Report 2020 Management’s Discussion and Analysis

As at October 31, 2019
(Millions of Canadian dollars)Less than
1 month1 to 3
months3 to 6
months6 to 9
months9 to 12
months1 year
to 2 years2 years
to 5 years5 years
and greater
With nospecific
maturity Total
AssetsCash and deposits with banks $ 62,095 $ 3 $ – $ – $ – $ – $ – $ – $ 2,557 $ 64,655Securities
Trading (1) 96,229 14 45 10 21 64 97 8,601 41,453 146,534Investment, net of applicable
allowance 3,069 3,960 3,857 2,886 3,511 16,203 24,638 43,907 439 102,470Assets purchased under reverse
repurchase agreements andsecurities borrowed 164,870 62,971 41,569 10,985 14,993 133 – – 11,440 306,961
Loans, net of applicable allowance 23,097 17,145 25,854 28,796 29,533 120,524 232,364 51,049 90,494 618,856Other
Customers’ liability underacceptances 12,940 5,119 27 – – – – – (24) 18,062
Derivatives 5,668 8,635 4,265 3,227 3,547 9,815 18,753 47,649 1 101,560Other financial assets 28,296 1,400 1,193 48 61 169 277 1,861 2,164 35,469
Total financial assets $ 396,264 $ 99,247 $ 76,810 $ 45,952 $ 51,666 $ 146,908 $ 276,129 $ 153,067 $ 148,524 $ 1,394,567Other non-financial assets 2,907 1,475 108 865 109 1,373 1,507 1,696 24,328 34,368
Total assets $ 399,171 $ 100,722 $ 76,918 $ 46,817 $ 51,775 $ 148,281 $ 277,636 $ 154,763 $ 172,852 $ 1,428,935
Liabilities and equityDeposits (2)
Unsecured borrowing $ 50,872 $ 36,251 $ 47,307 $ 38,376 $ 42,885 $ 28,886 $ 51,557 $ 20,230 $ 470,027 $ 786,391Secured borrowing 2,588 4,874 10,679 3,596 2,395 10,351 19,535 5,755 – 59,773Covered bonds – – 4,828 – 5,255 10,818 13,263 5,677 – 39,841
OtherAcceptances 12,944 5,119 27 – – – – – 1 18,091Obligations related to securities
sold short 35,069 – – – – – – – – 35,069Obligations related to assets sold
under repurchase agreementsand securities loaned 192,855 14,281 13,462 6 – 4 – – 5,978 226,586
Derivatives 6,325 7,779 4,519 3,430 3,442 9,155 17,348 46,515 30 98,543Other financial liabilities 29,008 1,066 849 290 443 272 701 8,510 691 41,830
Subordinated debentures – – – – – – 316 9,499 – 9,815
Total financial liabilities $ 329,661 $ 69,370 $ 81,671 $ 45,698 $ 54,420 $ 59,486 $ 102,720 $ 96,186 $ 476,727 $ 1,315,939Other non-financial liabilities 1,314 5,288 276 154 142 898 903 11,179 9,217 29,371Equity – – – – – – – – 83,625 83,625
Total liabilities and equity $ 330,975 $ 74,658 $ 81,947 $ 45,852 $ 54,562 $ 60,384 $ 103,623 $ 107,365 $ 569,569 $ 1,428,935
Off-balance sheet itemsFinancial guarantees $ 427 $ 2,409 $ 2,088 $ 2,829 $ 2,382 $ 986 $ 5,394 $ 45 $ 48 $ 16,608Lease commitments 69 137 204 197 198 719 1,619 3,032 – 6,175Commitments to extend credit 2,996 6,367 8,821 10,655 11,638 41,740 150,267 27,827 3,865 264,176Other credit-related commitments 469 934 1,615 1,863 1,365 191 634 10 92,392 99,473Other commitments 35 – – – – – – – 484 519
Total off-balance sheet items $ 3,996 $ 9,847 $ 12,728 $ 15,544 $ 15,583 $ 43,636 $ 157,914 $ 30,914 $ 96,789 $ 386,951
(1) Trading debt securities classified as FVTPL have been included in the less than 1 month category as there is no expectation to hold these assets to their contractualmaturity.
(2) A major portion of relationship-based deposits are repayable on demand or at short notice on a contractual basis while, in practice, these customer balances form a corebase for our operations and liquidity needs, as explained in the preceding Deposit and funding profile section.
Management’s Discussion and Analysis Royal Bank of Canada: Annual Report 2020 87

Contractual maturities of financial liabilities and off-balance sheet items – undiscounted basisThe following tables provide remaining contractual maturity analysis of our financial liabilities and off-balance sheet items. Theamounts disclosed in the following table are the contractual undiscounted cash flows of all financial liabilities (e.g., par value oramount payable upon maturity). The amounts do not reconcile directly with those in our consolidated balance sheets as the tableincorporates only cash flows relating to payments on maturity and do not recognize premiums, discounts or mark-to-marketadjustments recognized in the instruments’ carrying values as at the balance sheet date. Financial liabilities are based upon theearliest period in which they are required to be paid. For off-balance sheet items, the undiscounted cash flows potentially payableunder financial guarantees and commitments to extend credit are classified on the basis of the earliest date they can be called.
Contractual maturities of financial liabilities and off-balance sheet items – undiscounted basis* Table 63
As at October 31, 2020
(Millions of Canadian dollars)On
demandWithin1 year
1 yearto 2 years
2 yearsto 5 years
5 yearsand greater Total
Financial liabilitiesDeposits (1) $ 510,849 $ 343,201 $ 33,168 $ 91,871 $ 31,706 $ 1,010,795Other
Acceptances 9 18,609 – – – 18,618Obligations related to securities sold short – 29,121 – – – 29,121Obligations related to assets sold under repurchase
agreements and securities loaned 8,315 260,945 4,971 – – 274,231Other liabilities 199 37,681 188 358 8,678 47,104
Lease liabilities – 633 604 1,545 2,575 5,357Subordinated debentures – – 205 110 9,552 9,867
519,372 690,190 39,136 93,884 52,511 1,395,093
Off-balance sheet itemsFinancial guarantees (2) $ 17,141 $ – $ – $ – $ – $ 17,141Other commitments (3) – 81 82 209 344 716Commitments to extend credit (2) 239,212 43,025 2 – – 282,239
256,353 43,106 84 209 344 300,096
Total financial liabilities and off-balance sheet items $ 775,725 $ 733,296 $ 39,220 $ 94,093 $ 52,855 $ 1,695,189
As at October 31, 2019
(Millions of Canadian dollars)On
demandWithin1 year
1 yearto 2 years
2 yearsto 5 years
5 yearsand greater Total
Financial liabilitiesDeposits (1) $ 406,042 $ 315,398 $ 50,218 $ 83,651 $ 30,560 $ 885,869Other
Acceptances – 18,091 – – – 18,091Obligations related to securities sold short – 35,125 – – – 35,125Obligations related to assets sold under repurchase
agreements and securities loaned 5,977 220,592 4 – – 226,573Other liabilities 617 31,794 190 640 8,512 41,753
Subordinated debentures – – – 316 9,499 9,815
412,636 621,000 50,412 84,607 48,571 1,217,226
Off-balance sheet itemsFinancial guarantees (2) $ 16,608 $ – $ – $ – $ – $ 16,608Lease commitments – 805 719 1,619 3,032 6,175Commitments to extend credit (2) 226,021 38,148 6 1 – 264,176
242,629 38,953 725 1,620 3,032 286,959
Total financial liabilities and off-balance sheet items $ 655,265 $ 659,953 $ 51,137 $ 86,227 $ 51,603 $ 1,504,185
* This table represents an integral part of our 2020 Annual Consolidated Financial Statements.(1) A major portion of relationship-based deposits are repayable on demand or at short notice on a contractual basis while, in practice, these customer balances form a core
base for our operations and liquidity needs, as explained in the preceding Deposit and funding profile.(2) We believe that it is highly unlikely that all or substantially all of these guarantees and commitments will be drawn or settled within one year, and contracts may expire
without being drawn or settled. The management of the liquidity risk associated with potential extensions of funds is outlined in the preceding Risk measurement section.(3) Includes commitments related to short-term and low-dollar value leases, leases not yet commenced, and lease payments related to non-recoverable tax.
Regulatory developmentsNet stable funding ratioOn January 1, 2020, the OSFI regulatory minimum for the Net Stable Funding Ratio (NSFR) of 100% became effective, inaccordance with the revised LAR guidelines. The NSFR is determined based on the liquidity characteristics and maturity profile ofour assets, liabilities, and off-balance sheet exposures and is intended to reduce structural funding risk by requiring banks tomaintain a surplus of available stable funding over the required stable funding. We are in compliance with this requirement. Therequirement to disclose consolidated NSFR and its major components will become effective for Canadian Domestic SystemicallyImportant Banks (D-SIB) on January 31, 2021.
88 Royal Bank of Canada: Annual Report 2020 Management’s Discussion and Analysis

Insurance risk
Insurance risk refers to the potential financial loss that may arise where the amount, timing and/or frequency of benefit and/orpremium payments under insurance and reinsurance contracts are different than expected. Insurance risk is distinct from thoserisks covered by other parts of our risk management framework (e.g., credit, market and operational risk) where those risks areancillary to, or accompany, the risk transfer. The four insurance sub-risks are: morbidity, mortality, longevity, and travel risk.
Our Insurance Risk Framework provides an overview of our processes and tools for identifying, assessing, managing,mitigating and reporting on the insurance risks that face the organization. These are also supported by our robust three lines ofdefence governance structure.
Operational/regulatory compliance risk drivers
Operational risk
Operational risk is the risk of loss or harm resulting from people, inadequate or failed internal processes, controls and systemsor from external events. Operational risk is inherent in all of our activities and third-party activities and failure to manageoperational risk can result in direct or indirect financial loss, reputational impact or regulatory scrutiny and proceedings in thevarious jurisdictions where we operate.
Our management of operational risk follows the three lines of defence governance model, encompassing the organizational rolesand responsibilities for a coordinated enterprise-wide approach. For further details, refer to the Risk management – Enterpriserisk management section.
Operational risk frameworkWe have an Enterprise Operational Risk Framework which sets out the processes to identify, assess, monitor, measure, reportand communicate on operational risk. The processes are established through the following:• Risk identification and assessment tools, including the collection and analysis of risk event data, help risk owners
understand and proactively manage operational risk exposures. Risk assessments ensure alignment between risk exposuresand efforts to manage them. Management uses outputs of these tools to make informed risk decisions.
• Risk monitoring tools alert management to changes in the operational risk profile. When paired with escalation andmonitoring triggers, risk monitoring tools can identify risk trends, warn management of risk levels that approach or exceeddefined limits, as well as prompt actions and mitigation plans to be undertaken.
• Risk capital measurement provides credible estimation of potential risk exposure, surfaces risk vulnerabilities, and informsstrategic and capital planning decisions, which ultimately ensures that the bank is sufficiently resilient to withstandoperational risk losses both in normal times and under stress situations.
• Risk reporting and communication processes ensure that relevant operational risk information is made available tomanagement in a timely manner to support risk-informed business decisions.
Conclusions from the operational risk programs enable learning based on what has happened to us, whether it could happenelsewhere in the organization, and what controls we need to amend or implement. These conclusions support the articulation ofour operational risk appetite and are used to inform the overall level of operational risk exposure which thereby defines ouroperational risk profile. This profile includes significant operational risk exposures, potential new and emerging exposures andtrends, and overall conclusions on the control environment and risk outlook. We proactively identify and investigate corporateinsurance opportunities to mitigate and reduce potential future impacts of operational risk.
We consider the potential risks and rewards of our decisions to strike a balance between accepting potential losses versusincurring costs of mitigation, the expression of which is in the form of our operational risk appetite. Our operational risk appetiteis established at the Board level and cascaded throughout each of our business segments.
Management reports have been implemented at various levels to support proactive management of operational risk andtransparency of risk exposures. These reports are provided to senior management on a regular basis and provide detail on themain drivers of the risk status and trend for each of our business segments and the bank overall. In addition, changes to theoperational risk profile that are not aligned to our business strategy or operational risk appetite are identified and discussed atGRC and the Risk Committee of the Board.
Management’s Discussion and Analysis Royal Bank of Canada: Annual Report 2020 89

Our operations expose us to many different operational risks, which may adversely affect our businesses and financialresults. The following list is not exhaustive, as other factors could also adversely affect our results.
Operational risk Management strategy
Cybersecurity Cybersecurity is the risk to the business associated with cyber-attacks initiated to disrupt ordisable our operations or to expose or damage data. We have a dedicated team of technology andcybersecurity professionals that manage a comprehensive program to help protect theorganization against breaches and other incidents by ensuring appropriate security andoperational controls are in place. We continue to strengthen our cyber-control framework and toimprove our resilience and cybersecurity capabilities including 24 hour monitoring, cyberintelligence analysis of internal and external threats and alerting of potentially suspicious securityevents and incidents. Throughout the year, investments continued to be made on the program andmultiple scenarios, assessments and simulations were conducted to test our resiliency strategy.
Data management andprivacy
Data management is the risk of failing to manage information appropriately throughout itslifecycle due to inadequate processes and controls, resulting in legal or regulatory consequences,reputational damage or financial loss. Privacy is the risk of improper creation or collection, use,disclosure, retention or destruction of information. The collection, use and sharing of data, as wellas the management and governance of data, are increasingly important as we continue to invest indigital solutions and innovation, as well as, expanding our business activities. This is also reflectedthrough recent regulatory developments relating to data privacy. The Chief Privacy Office and theChief Data Office partner with cross-functional teams to develop and implement enterprise-widestandards and practices that describe how data is used, protected, managed and governed.
Money laundering andTerrorist financing
Money laundering and Terrorist financing risk is the risk that our products and services are used tofacilitate the laundering of proceeds of crime, including the financing of terrorist activity. Wemaintain an enterprise-wide program designed to deter, detect and report suspected moneylaundering and terrorist financing activities across our organization, while seeking to ensurecompliance with the laws and regulations of the various jurisdictions in which we operate. OurGlobal AML Compliance Group is dedicated to the continuous development and maintenance ofrobust policies, guidelines, training and risk-assessment tools and models to help our employeesdeal with ever-evolving money laundering and terrorist financing risks. The global anti-moneylaundering/anti-terrorist financing program is regularly evaluated in an effort to ensure it remainsaligned with industry standards, best practices and all applicable laws, regulations and guidance.Risks of non-compliance include enforcement actions, criminal prosecutions and reputationaldamage.
Third-party risk Third-party risk is the risk of failure to effectively manage third parties which may expose us toservice disruptions, regulatory action, financial loss, litigation or reputational damage. We have arisk-based enterprise-wide program designed to provide oversight for third-party relationshipsthat enables us to respond effectively to events that can cause service disruptions, financial lossor various other risks that could impact us. Our approach to third-party risk mitigation is outlinedin policies and standards that establish the minimum requirements for identifying and managingrisks throughout the engagement with a third party, while ensuring compliance with globalregulatory expectations. We seek to monitor third-party providers critical to our operations for anyimpact on their ability to deliver services to us, including vendors of our third-party providers.
Business continuity risk Business continuity risk is the risk of being unable to maintain, continue or restore essentialbusiness operations during and/or after an event that prevents us from conducting business in thenormal course. Exposure to disruptive operational events interrupts the continuity of our businessoperations and could negatively impact our financial results, reputation, client outcomes and/orresult in harm to our employees. These operational events could result from the impact of severeweather, pandemics, failed processes, technology failures or cyber threats. Our risk-basedenterprise-wide business continuity management program considers multiple scenarios toaddress the consequences of a disruption and its effects on the availability of our people,processes, facilities, technology, and third-party arrangements. Our approach to businesscontinuity management is outlined in policies and standards embedded across the organizationand the related risks are regularly measured, monitored, reported and integrated in ouroperational risk management and control framework.
Operational risk capitalRequirements for operational risk capital are determined in accordance with OSFI issued guidelines. Currently, our operationalrisk capital is assessed using the Standardized Approach (TSA) which is a formula-based calculation predicated on gross income.Upon implementation of final Basel III reforms, OSFI will require deposit-taking institutions to adopt a new StandardizedApproach (SA) for measurement of operational risk capital. The SA methodology is based on the Business Indicator Component(BIC), which is a financial statement-based proxy for operational risk, and the Internal Loss Multiplier, a scaling factor that isbased on the historical internal loss average relative to the BIC. Once implemented, SA will replace TSA. For further details onoperational risk capital, refer to the Capital management section.
Operational risk loss eventsAs at October 31, 2020, our operational risk losses remain within our risk appetite. For further details on our contingencies,including litigation, refer to Notes 24 and 25 of our 2020 Annual Consolidated Financial Statements.
90 Royal Bank of Canada: Annual Report 2020 Management’s Discussion and Analysis

Regulatory compliance risk
Regulatory compliance risk is the risk of potential non-conformance with laws, rules, regulations and prescribed practices in anyjurisdiction in which we operate. Issues regarding compliance with laws and regulations can arise in a number of areas in a largecomplex financial institution such as the bank, and are often the result of inadequate or failed internal processes, controls,people or systems.
Laws and regulations are in place to protect the financial and other interests of our clients, investors and the public. As alarge-scale global financial institution, we are subject to numerous laws and extensive and evolving regulation by governmentalagencies, supervisory authorities and self-regulatory organizations in Canada, the U.S., the U.K., Europe and other jurisdictions inwhich we operate. In recent years, such regulation has become increasingly extensive and complex. In addition, regulatoryscrutiny and expectations in Canada, the U.S., the U.K., Europe and globally for large financial institutions, with respect to, amongother things, governance, risk management practices and controls, conduct as well as the enforcement of regulatory compliancematters has intensified. Failure to comply with these requirements and expectations or resolve any identified deficiencies couldresult in increased regulatory oversight and restrictions. Recent resolution of such matters involving other global financialinstitutions have involved the payment of substantial penalties, agreements with respect to future operation of their business,actions with respect to relevant personnel and guilty pleas with respect to criminal charges.
Operating in this increasingly complex regulatory environment and intense regulatory enforcement environment, we are andhave been subject to a variety of legal proceedings, including civil claims and lawsuits, criminal charges, regulatory scrutiny,examinations and proceedings, investigations, audits and requests for information by various governmental regulatory agenciesand law enforcement authorities in various jurisdictions, and we anticipate that our ongoing business activities will give rise tosuch matters in the future. The global scope of the bank’s operations also means that a single issue may give rise to overlappingregulatory investigations, regulatory proceedings and or civil litigation claims in different jurisdictions. RBC can be subject tosuch proceedings due to alleged violations of law or, if determined by regulators, allegedly inadequate policies, procedures orremediation of deficiencies. Changes to laws, including tax laws, regulations or regulatory policies, as well as the changes in howthey are interpreted, implemented or enforced, could adversely affect us, for example, by lowering barriers to entry in thebusinesses in which we operate, increasing our costs of compliance, or limiting our activities and ability to execute our strategicplans. Further, there is no assurance that we always will be, or be deemed to be, in compliance with laws, regulations orregulatory policies or expectations. Accordingly, it is possible that we could receive a judicial or regulatory enforcementjudgment or decision that results in fines, damages, penalties, and other costs or injunctions, criminal convictions, or loss oflicenses or registrations that would damage our reputation, and negatively impact our earnings and ability to conduct some ofour businesses. In addition, we are subject to litigation arising in the ordinary course of our business and the adverse resolutionof any litigation could have a significant adverse effect on our results or could give rise to significant reputational damage, whichin turn could impact our future business prospects.
Our Regulatory Compliance Management Framework outlines how we manage and mitigate the regulatory compliance risksassociated with failing to comply with, or adapt to, current and changing laws and regulations in the jurisdictions in which weoperate.
Regulatory compliance risk includes the regulatory risks associated with financial crimes (which include, but are not limitedto, money laundering, bribery, and sanctions), privacy, market conduct, consumer protection, business conduct, as well asprudential and other generally applicable non-financial requirements. Specific compliance policies, procedures and supportingframeworks have been developed to manage regulatory compliance risk.
Strategic risk drivers
Strategic risk
Strategic risk is the risk that the enterprise or particular business areas will make inappropriate strategic choices, or will beunable to successfully implement selected strategies or achieve the expected benefits. Business strategy is a major driver of ourrisk appetite and consequently the strategic choices we make in terms of business mix determine how our risk profile changes.
Responsibility for selecting and successfully implementing business strategies is mandated to the individual heads of eachbusiness segment. Oversight of strategic risk is the responsibility of the heads of the business segments and their operatingcommittees, the Enterprise Strategy group, the GE, and the Board. The Enterprise Strategy group supports the management ofstrategic risk through the strategic planning process, articulated within our Enterprise Strategic Planning Policy, ensuringalignment across our business, financial, capital and risk planning.
Our annual business portfolio review and project approval request processes help identify and mitigate strategic risk byensuring strategies for new initiatives, lines of business, and the enterprise as a whole align with our risk appetite and riskposture. GRM provides oversight of strategic risk by providing independent reviews of these processes, establishing enterpriserisk frameworks, and independently monitoring and reporting on the level of risk established against our risk appetite metrics inaccordance with the three lines of defence governance model.
For details on the key strategic priorities for our business segments, refer to the Business segment results section.
Reputation risk
Reputation risk is the risk of an adverse impact on stakeholders’ perception of the bank due to i) the actions or inactions of thebank, its employees, third-party service providers, or clients, ii) the perceived misalignment of these actions or inactions withstakeholder expectations of the bank, or iii) negative public sentiment towards a global or industry issue. Our reputation isrooted in the perception of our stakeholders, and the trust and loyalty they place in us is core to our purpose as a financialservices organization. A strong and trustworthy reputation will generally strengthen our market position, reduce the cost ofcapital, increase shareholder value, strengthen our resiliency, and help attract and retain top talent. Conversely, damage to ourreputation can result in reduced share price and market capitalization, increased cost of capital, loss of strategic flexibility,inability to enter or expand into markets, loss of client loyalty and business, regulatory fines and penalties, restrictiveagreements with regulators or prosecutors, or criminal prosecutions. The sources of reputation risk are widespread; risk to our
Management’s Discussion and Analysis Royal Bank of Canada: Annual Report 2020 91

reputation can occur in connection with credit, regulatory, legal and operational risks. We can also experience reputation riskfrom a failure to maintain an effective control environment, exhibit good conduct and maintain appropriate culture practices.
Managing our reputation risk is an integral part of our organizational culture and our overall enterprise risk managementapproach, as well as a priority for employees and our Board. Our Board-approved Reputation Risk Management Frameworkprovides an overview of our approach to identify, assess, manage, monitor and report on reputation risk. This framework outlinesgovernance authorities, roles and responsibilities, and controls and mechanisms to manage our reputation risk, including ourculture of integrity, compliance with our Code of Conduct and operating within our risk appetite.
Our governance of reputation risk aims to be holistic and provide an integrated view of potential reputation issues acrossthe organization. This governance structure ensures that ownership and accountability for reputation risk are understood acrossthe enterprise, both proactive and reactive reputation risk decisions are escalated to a senior executive committee for reviewand evaluation, and reporting on reputation risk is comprehensive and integrated.
Legal and regulatory environment risk
Legal and regulatory environment risk is the risk that new or modified laws and regulations, and the interpretation or applicationof laws and regulations, will negatively impact the way in which we operate, both in Canada and in the other jurisdictions inwhich we conduct business. The full impact of some of these changes on our business will not be known until final rules areimplemented and market practices have developed in response. We continue to respond to these and other developments andare working to minimize any potential adverse business or economic impact. The following provides a high-level summary ofsome of the key regulatory changes that have potential to increase or decrease our costs, impact our profitability and increasethe complexity of our operations. A summary of the additional regulatory changes instituted by governments globally and byOSFI during 2020 in response to the COVID-19 pandemic are included in the Significant developments: COVID-19, Liquidity andfunding risk and Capital Management sections of this 2020 Annual Report.
Global uncertaintySignificant uncertainty about the impacts of the COVID-19 pandemic, trade policy and geopolitical tensions continue to pose risksto the global economic outlook. In October 2020, the International Monetary Fund (IMF) projected global growth to decline -4.4%in calendar 2020, a moderate improvement from the -4.9% projection in June, yet well below October 2019 levels, as economicactivity in advanced economies improved sooner than expected after initial containment measures were eased. The IMFprojected global growth in 2021 of 5.2%, down from 5.4% projected in June, consistent with the expectations around persistentsocial distancing and continued containment measures. Estimates around the expected recovery beyond calendar 2020 remainuncertain, as timelines are largely dependent on the duration of the COVID-19 pandemic, including additional subsequent wavesof the COVID-19 pandemic, and the effectiveness of the fiscal and monetary policy measures introduced in response to theCOVID-19 pandemic. Trade policy also remains a source of uncertainty, as the U.K. and European Union (EU) have yet to finalize aBrexit deal in advance of the December 31, 2020 transition date. While the Canada-United States-Mexico Agreement is noweffective, reducing uncertainty about trade within North America, the post-pandemic future of global trade remains uncertain ascountries may look to decrease reliance on the global supply chain. Our diversified business model, as well as our product andgeographic diversification, continue to help mitigate the risks posed by global uncertainty.
Canadian anti-money laundering (AML) regulationsThe amendments to Canada’s Proceeds of Crime (Money Laundering) and Terrorist Financing Act regulations will becomeeffective June 2021. These amendments aim to improve the effectiveness of Canada’s anti-money laundering and counter-terrorism financing regime, and align compliance with international standards. We have assessed the requirements and do notanticipate significant challenges in meeting the requirements by the effective date.
Interest rate benchmark reformLondon Interbank Offered Rate (LIBOR) is the most widely referenced benchmark interest rate across the globe for derivatives,bonds, loans and other floating rate instruments; however, there is a regulator-led push to transition the market from LIBOR andcertain other benchmark rates to alternative risk-free, or nearly risk-free, rates that are based on actual overnight transactions.In addition to the U.S. and U.K., regulators and national central banks internationally, including the BoC, have warned the marketthey will need to be prepared for certain benchmark rates (including most tenors of LIBOR) to be discontinued at the end ofcalendar 2021. Derivatives, floating rate notes, loans and other financial contracts whose terms extend beyond the relevantdiscontinuation date, and that refer to certain benchmark rates (including LIBOR) as the reference rate, will be impacted. As aresult, clearing agencies are moving towards new benchmark rates and we are working with them on the transition. For furtherdetails, refer to the Critical accounting policies and estimates section in this 2020 Annual Report.
Canadian benchmark rate for qualifying insured mortgagesOn February 18, 2020, the Department of Finance Canada announced changes to the minimum qualifying rate for insuredmortgages. As a result of a review conducted by the federal financial agencies, it was concluded that the minimum qualifyingbenchmark rate should be more responsive to changes in market conditions. While the government has suspended its originaleffective date of April 6, 2020 until further notice due to the impact of the COVID-19 pandemic, the new benchmark rate will be theweekly median 5-year fixed insured mortgage rate plus 2%, compared to the current benchmark rate of the five-year fixed rateposted by the D-SIBs. We are currently assessing the impacts and we will continue to monitor for any further developments,including any future changes to the benchmark rate for uninsured mortgages.
92 Royal Bank of Canada: Annual Report 2020 Management’s Discussion and Analysis

Client focused reformsThe Canadian securities administrator published amendments to National Instrument 31-103 to implement the Client FocusedReforms (Reforms), which are intended to increase the standard of conduct required for Canadian securities registrants. TheReforms enhance core requirements relating to conflicts of interest, suitability, know-your-product and know-your-clientrequirements, and also introduce new requirements relating to relationship disclosure, training and recordkeeping. The changescome into effect in two phases: the first phase relating to conflicts of interest and the related disclosure requirements comes intoeffect on June 30, 2021, extended from its previous effective date of December 31, 2020 due to the impact of the COVID-19pandemic, and the second phase relating to the remaining requirements, on December 31, 2021. The requirements will primarilyimpact our Personal & Commercial Banking and Wealth Management platforms. We are continuing to evaluate the requirementsand their impacts on our businesses.
U.S. regulatory initiativesPolicymakers continue to evaluate and implement reforms to various U.S. financial regulations, which could result in eitherexpansion or reduction to the U.S. regulatory requirements and associated changes in compliance costs. In May 2020, the Officeof the Comptroller of the Currency released revisions to the regulation implementing the Community Reinvestment Act (CRA),intended to increase bank lending, investment, and services in low- and moderate-income communities, which becomes effectiveon January 1, 2023. We will continue to monitor developments and any resulting implications for us.
U.K. and European regulatory reformIn addition to the implications from Brexit, other forthcoming regulatory developments include:• Sustainability-Related Disclosures Regulation which will require financial services firms to disclose their approaches to
considering environmental, social and governance factors as part of their advice and investment decision processes. Theserequirements are effective on March 10, 2021 and we are currently assessing the impacts.
• The EU’s Central Securities Depositary Regulation rules which are intended to increase discipline in the settlement ofsecurities transactions. The EU has revised the effective date to February 2022, extended from its previous effective date ofFebruary 2021.
For further details on regulatory capital and related requirements, refer to the risk and Capital management sections of this 2020Annual Report.
Competitive risk
Competitive risk is the risk of an inability to build or maintain a sustainable competitive advantage in a given market or markets,and includes the potential for loss of market share due to competitors offering superior products and services. Competitive riskcan arise within or outside the financial sector, from traditional or non-traditional competitors, domestically or globally. There isintense competition for clients among financial services companies in the markets in which we operate. Client loyalty andretention can be influenced by a number of factors, including new technology used or services offered by our competitors,relative service levels and prices, product and service attributes, our reputation, actions taken by our competitors, andadherence with competition and anti-trust laws. Other companies, such as insurance companies and non-financial companies, aswell as new technological applications, are increasingly offering services traditionally provided by banks. This competition couldalso reduce our revenue which could adversely affect our results.
We identify and assess competitive risks as part of our overall risk management process. Our products and services areregularly benchmarked against existing and potential competitors. In addition, we regularly conduct risk reviews of our products,services, mergers and acquisitions strategy, as well as we seek to ensure adherence to competition and anti-trust laws. Ourannual strategy-setting process also plays an integral role in managing competitive risk.
Macroeconomic risk drivers
Systemic risk
Systemic risk is the risk that the financial system as a whole, or a major part of it – either in an individual country, a region, orglobally – is put in real and immediate danger of collapse or serious damage due to an unforeseen event causing a substantiveshock to the financial system with the likelihood of material damage to the economy, and which would result in financial,reputation, legal or other risks for us.
Systemic risk is considered to be the least controllable risk facing us, leading to increased vulnerabilities as experiencedduring the 2008 global financial crisis and the COVID-19 pandemic. Our ability to mitigate systemic risk when undertakingbusiness activities is limited, other than through collaborative mechanisms between key industry participants, and, asappropriate, the public sector and regulators to reduce the frequency and impact of these risks. The two most significantmeasures in mitigating the impact of systemic risk are diversification and stress testing.
Our diversified business model, portfolios, products, activities and funding sources help mitigate the potential impacts fromsystemic risk as well as having established risk limits to ensure our portfolio is diversified, and concentration risk is reduced andremains within our risk appetite.
Stress testing involves consideration of the simultaneous movements in a number of risk factors. It is used to ensure ourbusiness strategies and capital planning are robust by measuring the potential impacts of credit, market, liquidity, andoperational risks on us, under adverse economic conditions. Our enterprise-wide stress testing program evaluates the potentialeffects of a set of specified changes in risk factors, corresponding to exceptional but plausible adverse economic and financialmarket events. These stress scenarios are evaluated across the organization, and results are integrated to develop anenterprise-wide view of the impacts on our financial results and capital requirements. For further details on our stress testing,refer to the Enterprise risk management section.
Our financial results are affected by the business and economic conditions in the geographic regions in which we operate.These conditions include consumer saving and spending habits as well as consumer borrowing and repayment patterns,business investment, government spending, exchange rates, sovereign debt risks, the level of activity and volatility of the capital
Management’s Discussion and Analysis Royal Bank of Canada: Annual Report 2020 93

markets, strength of the economy and inflation. Given the importance of our Canadian and U.S. operations, a continuedeconomic downturn may largely affect our personal and business lending activities and may result in higher provisions for creditlosses. Deterioration and uncertainty in global capital markets could result in continued high volatility that would impact resultsin Capital Markets, while in Wealth Management weaker market conditions could lead to lower average fee-based client assetsand transaction volumes. In addition, worsening financial and credit market conditions may adversely affect our ability to accesscapital markets on favourable terms and could negatively affect our liquidity, resulting in increased funding costs and lowertransaction volumes in Capital Markets and Investor & Treasury Services.
Our financial results are also sensitive to changes in interest rates. Central banks globally reduced benchmark interest ratesin 2020, largely in response to the impact of the COVID-19 pandemic in an effort to provide support to maintain the resilience andstability of the financial systems. A continuing low interest rate environment in Canada, the U.S. and globally would result in netinterest income continuing to be unfavourably impacted by spread compression across many of our businesses while anincrease in interest rates would benefit our businesses. However, a significant increase in interest rates could also adverselyimpact household balance sheets, leading to credit deterioration which might negatively impact our financial results, particularlyin some of our Personal & Commercial Banking and Wealth Management businesses.
Overview of other risks
In addition to the risks described in the risk sections, there are other risk factors, described below, which may affect ourbusinesses and financial results. The following discussion is not exhaustive as other factors could also adversely affect ourresults.
Government fiscal, monetary and other policiesOur businesses and earnings are affected by monetary policies that are adopted by the BoC, the Fed in the U.S., the ECB in theEU and monetary authorities in other jurisdictions in which we operate, as well as the fiscal policies of the governments ofCanada, the U.S., Europe and such other jurisdictions. Such policies can also adversely affect our clients and counterparties inCanada, the U.S. and internationally, which may increase the risk of default by such clients and counterparties.
Tax risk and transparencyTax risk refers to the risk of loss related to unexpected tax liabilities. The tax laws and systems that are applicable to us arecomplex and wide-ranging. As a result, we ensure that any decisions or actions related to tax always reflect our assessment ofthe long-term costs and risks involved, including their impact on our reputation and our relationship with clients, shareholders,and regulators.
Our approach to taxation is grounded in principles which are reflected in our Code of Conduct, is governed by our EnterpriseTax Risk Management Policy, and incorporates the fundamentals of our risk drivers. Oversight of our tax policy and themanagement of tax risk is the responsibility of the GE, the CFO and the Senior Vice President, Taxation. We discuss our taxstrategy with the Audit Committee annually and provide updates on our tax position on a regular basis.
Our tax strategy is designed to provide transparency and support our business strategy, and is aligned with our corporatevision and values. We seek to maximize shareholder value by structuring our businesses in a tax-efficient manner whileconsidering reputational risk by being in compliance with all laws and regulations. Our policy seeks to ensure that we:
• Act with integrity and in a straightforward, open and honest manner in all tax matters;• Ensure tax strategy is aligned with our business strategy supporting only bona fide transactions with a business purpose
and economic substance;• Ensure all intercompany transactions are conducted on arm’s length terms;• Ensure our full compliance and full disclosure to tax authorities of our statutory obligations; and• Endeavour to work with the tax authorities to build positive long-term relationships and where disputes occur, address
them constructively.
With respect to assessing the needs of our clients, we consider a number of factors including the purpose of thetransactions. We seek to ensure that we only support bona fide client transactions with a business purpose and economicsubstance. Should we become aware of client transactions that are aimed at evading their tax obligations, we will not proceedwith the transactions.
We operate in 36 countries worldwide. Our activities in these countries are subject to both Canadian and international taxlegislation and other regulations, and are fully disclosed to the relevant tax authorities. The Taxation group and GRM bothregularly review the activities of all entities in an effort to ensure compliance with tax requirements and other regulations.
Given that we operate globally, complex tax legislation and accounting principles have resulted in differing legalinterpretations between the respective tax authorities we deal with and ourselves, and we are at risk of tax authoritiesdisagreeing with prior positions we have taken for tax purposes. When this occurs, we are committed to an open and transparentdialogue with the tax authorities to facilitate a quick assessment and prompt resolution of the issues where possible. Failure toadequately manage tax risk and resolve issues with tax authorities in a satisfactory manner could adversely impact our results,potentially to a material extent in a particular period, and/or significantly impact our reputation.
94 Royal Bank of Canada: Annual Report 2020 Management’s Discussion and Analysis

Tax contributionIn 2020, total income and other tax expense, including income taxes in the Consolidated Statements of Comprehensive Income andChanges in Equity, to various levels of governments globally totalled $3.9 billion (2019 – $4.0 billion). In Canada, total income andother tax expense for the year ended October 31, 2020 to various levels of government totalled $2.7 billion (2019 – $2.9 billion).
Payroll taxes
Income taxes
Value added andsales taxes
Capital taxes
Property taxesInsurance premium taxesBusiness taxes
0
1,000
2,000
6,000
5,000
4,000
3,000
2020 2019
Income and other tax expense – by category(Millions of Canadian dollars)
0
1,000
2,000
6,000
5,000
4,000
3,000
Other International U.S. Canada
2020 2019
Income and other tax expense – by geography(Millions of Canadian dollars)
For further details on income and other tax expense, refer to the Financial performance section.
Environmental and social riskEnvironmental and Social (E&S) risk is the potential for an E&S issue associated with us, a client, transaction, product, supplieror activity, to have a negative impact on our financial position, operations, legal and regulatory compliance, or reputation. E&Sissues include, but are not limited to, site contamination, waste management, land and resource use, biodiversity, water qualityand availability, climate change, environmental regulation, human rights (including, but not limited to, Indigenous Peoples’rights), and community engagement. GRM is responsible for developing and maintaining policies to identify, assess, monitor andreport on E&S risk, and to regularly review and update E&S risk policies. These policies seek to identify sectors, clients andbusiness activities that may expose us to E&S risk, establish requirements to manage, mitigate and monitor E&S risk, includingwhen to apply enhanced due diligence and escalation procedures. Business segments and functional areas are responsible forincorporating E&S risk management requirements within their operations.
We recognize the importance of E&S risk management practices and processes and are committed to regular and transparentdisclosure. Global practices in the identification, assessment and management of climate-related risks and opportunities arerapidly evolving. We are working to advance our understanding of the impact climate-related risks may have on our business andour clients’ businesses. As a signatory to the Equator Principles (EP), we report annually on projects assessed according to the EPframework. RBC GAM and BlueBay Asset Management LLP are signatories to the United Nations Principles for ResponsibleInvestment (UN PRI) and report annually on their responsible investment activities to the UN PRI. RBC Europe Limited (RBCEL), awholly owned subsidiary of the bank, is a member of the Green Bond Principles and reports annually on its green bondunderwriting activities. Our Corporate Citizenship team coordinates our enterprise-wide approach to addressing and reporting onclimate change, material E&S and human rights issues, as well as discloses our performance in our annual ESG PerformanceReport. We published our Human Rights Statement in October 2020, recognizing the need to consider human rights impacts in ourbusiness and portfolios. The Human Rights Statement sets out our commitment to respect internationally-recognized human rightsin line with the United Nations Guiding Principles on Business and Human Rights. We also publish an annual Modern Slavery ActStatement, which sets out the steps that we have taken to ensure that slavery and human trafficking are not taking place in oursupply chains or our business, and climate-related disclosures that consider the recommendations of the FSB’s Task Force onClimate-related Financial Disclosures (TCFD).
TCFD DisclosureGovernanceThe Board and its Committees oversee senior management who is responsible for execution of the management of E&S risks andopportunities, which include climate change. The Board provides oversight of our strategic approach to climate change and ourE&S risks, which includes how we manage climate-related risks and opportunities. We have established an internal enterprise-wide Climate Working Group co-chaired by two GE members, focused on providing strategic direction on advancing ourunderstanding of climate-related risks and developing strategies to address climate-related risks and opportunities for us andour clients. GRM has a dedicated E&S risk team that develops approaches to identify, assess, monitor and report on climate-related risks, as appropriate. Performance goals on climate-related risks have been established at the management level.
StrategyWe recognize we have a role to play in accelerating the transition to a low-carbon economy and mitigating the risks associatedwith climate change. Our enterprise strategy to addressing climate-related risks and opportunities includes supporting ourclients in the low-carbon transition, advancing our capabilities in climate risk management and investing in technology toaddress complex environmental challenges. Our participation in the rapidly evolving sustainable finance market facilitates insupporting the low-carbon transition. We are also active participants in industry groups that support the development ofstrategies and plans to transition to a low-carbon economy.
Risk ManagementClimate-related risks may be a transverse risk type which requires us to consider how financial and non-financial factors mayimpact us and our clients. We initially identified climate change as an emerging risk in 2017 and, as such, our strategy andapproach to managing it is reported on a regular basis to senior management and the Board. We define climate risk as riskrelated to the transition to a lower-carbon economy (transition risk) and risk related to the physical impacts of climate change
Management’s Discussion and Analysis Royal Bank of Canada: Annual Report 2020 95

(physical risk). We conduct portfolio, client and scenario analyses to assess our exposure to, and the impact of, climate-relatedrisks. We may be exposed to climate risk through emerging regulatory and legal requirements, disruptions to our operations andservices, and the products and services we provide to our clients. Both we and our clients may also be exposed to climate riskthrough technological change and market forces, in addition to the factors outlined above. Additionally, we and our clients mayalso be vulnerable to physical climate risk. We regularly review the risks that we face and reflect on those that affect our clients,considering:
Emergingregulatory and
legalrequirements
• Climate change regulations, frameworks, and guidance that apply to banks, insurers and asset managersare rapidly evolving. Several central banks and regulators are taking steps toward introducing or havealready introduced rules to address the financial and economic risks of climate change, for example, the EUpublished regulations on Sustainability-Related Disclosures which will require financial firms to disclosetheir approaches to considering environmental, social and governance factors as part of their advice andinvestment decision process. As regulations and formal requirements evolve, we will monitor suchdevelopments and update our disclosures as necessary.
• For clients in sectors categorized as medium and high environmental risk, such as those in carbon-intensive sectors, we evaluate whether clients have assessed and quantified the regulatory impacts ofclimate change.
Disruptions tooperationsand clientservices
• We identify properties that we lease or own, which contain business processes and supporting applicationsthat require enhanced facility infrastructure to mitigate site disruptions, such as those caused by extremeweather events. We classify critical environment sites based on our business risk tolerance for site-specificdowntime and, among other things, site location, power supply, exposure to flooding, geological stabilityand other hazards.
• We take steps to mitigate and adapt to climate change through our building design and our purchasingdecisions.
• As required, we assess the impact of climate-related events (e.g., floods, hurricanes) on our businesses andclient operations.
Products andservices we
provide
• We maintain a diversified lending portfolio, which improves our resilience to geographic or sectoraldownturns and minimizes concentrations of credit exposure.
• Each business segment is responsible for identifying material climate-related risks and opportunities,which are integrated into risk management processes as necessary. We have conducted climate scenarioanalysis on parts of our portfolio to assess the impact of transition and physical risk drivers under differentscenarios, including a 2oC scenario.
• We provide products, services and advice to assist clients in responding to climate-related risks andopportunities (i.e., carbon trading services, green bond underwriting, clean technology lending andadvisory services and responsible investing).
• Our asset management businesses integrate ESG issues into their investment process when doing so mayhave a material impact on investment risk or return.
• RBC Insurance® provides policy administration for property and casualty products sold through AvivaCanada Inc., and is therefore not directly exposed to climate-related risks associated with these products.The insurance industry as a whole has exposure to longer-term shifts in climate patterns, such as risingtemperatures and hurricanes, which may indirectly impact our Insurance business results.
Metrics & TargetsWe have commitments associated with financing, investments, risk management and carbon reduction in our operations,research, partnerships, and philanthropy, and performance is reported on in our annual TCFD Report. As a signatory to theCarbon Disclosure Project, we have publicly reported climate-related data since 2003, including multi-year data in accordancewith the Greenhouse Gas (GHG) Protocol. We also receive third-party limited assurance on our energy and emissions metrics. Weare working with industry peers toward developing an approach to conducting climate scenario analysis, including a view onperforming stress testing for climate risk.
Other factorsOther factors that may affect our results include changes in government trade policy, changes in accounting standards and theireffect on our accounting policies, estimates and judgments, currency and interest rate movements in Canada, the U.S., and otherjurisdictions in which we operate or conduct business, changes to our credit ratings, the timely and successful development ofnew products and services, technological changes, effective design, implementation and execution of processes and theirassociated controls, fraud by internal and external parties, the possible impact on our business from disease or illness thataffects local, national or global economies, disruptions to public infrastructure, including transportation, communication, powerand water, international conflicts and other political developments including those relating to the war on terrorism, and oursuccess in anticipating and managing the associated risks.
We caution that the foregoing discussion of risk factors, many of which are beyond our control, is not exhaustive and otherfactors could also affect our results.
Capital management
We actively manage our capital to maintain strong capital ratios and high ratings while providing strong returns to ourshareholders. In addition to the regulatory requirements, we consider the expectations of credit rating agencies, depositors andshareholders, as well as our business plans, stress tests, peer comparisons and our internal capital ratio targets. Our goal is tooptimize our capital usage and structure, and to provide support for our business segments and clients. We also aim to generatebetter returns for our shareholders, while protecting depositors and creditors.
Capital management frameworkOur capital management framework establishes policies and processes for defining, measuring, raising and investing all forms ofcapital in a coordinated and consistent manner. It sets our overall approach to capital management, including guiding principlesand roles and responsibilities relating to capital adequacy and transactions, dividends, solo capital and management of RWA andleverage ratio exposures. We manage and monitor capital from several perspectives, including regulatory capital and solo capital.
96 Royal Bank of Canada: Annual Report 2020 Management’s Discussion and Analysis

Our capital planning process is dynamic and involves various teams including Finance, Corporate Treasury, GRM, Economicsand our businesses, and covers internal capital ratio targets, potential capital transactions as well as projected dividend payoutsand share repurchases. This process considers our business operating plans, enterprise-wide stress testing and Internal CapitalAdequacy Assessment Process (ICAAP), regulatory capital changes and requirements, accounting changes, internal capitalrequirements, rating agency metrics and solo capital.
Our capital plan is established on an annual basis and is aligned with the management actions included in the annualbusiness operating plan, which includes forecast growth in assets and earnings taking into account our business strategies, theprojected market and economic environment, and peer positioning. This includes incorporating potential capital transactionsbased on our projected internal capital generation, business forecasts, market conditions and other developments, such asaccounting and regulatory changes, that may impact capital requirements. All of the components in the capital plan aremonitored throughout the year and are revised as deemed appropriate.
Total capital requirements
Capital available and targetcapital ratios
Capital impacts ofstress scenarios
Enterprise-wideStress Testing ICAAP
Capital Plan andBusiness
Operating Plan
Capital impacts of stress scenarios
Our enterprise-wide stress testing and annual ICAAP processes provide key inputs for capital planning, including settinginternal capital ratio targets. The stress scenarios are evaluated across the organization, and results are integrated to developan enterprise-wide view of financial impacts and capital requirements, which in turn facilitate the planning of mitigating actionsto absorb adverse events. ICAAP assesses capital adequacy and requirements covering all material risks, with a cushion forplausible contingencies. In accordance with OSFI guidelines, major components of our ICAAP process include comprehensive riskassessment, stress testing, capital assessment and planning, Board and senior management oversight, monitoring and reportingand internal control review.
Our internal capital targets are established to maintain robust capital positions in excess of OSFI’s Basel III regulatorytargets. The stress test results of our enterprise-wide stress testing and ICAAP processes are incorporated into the OSFI CapitalBuffers, D-SIB/Globally Systemically Important Banks (G-SIB) surcharge, and Domestic Stability Buffer (DSB), with a view toensure that the bank has adequate capital to underpin risks and absorb losses under all plausible stress scenarios, including theCOVID-19 pandemic, given our risk profile and appetite. In addition, we include a discretionary cushion on top of OSFI’sregulatory targets to reflect our risk appetite, our forecasts of potential negative downturns and to maintain our capital strengthfor forthcoming regulatory and accounting changes, peer comparatives, rating agencies sensitivities and solo capital level.
The Board is responsible for the ultimate oversight of capital management, including the annual review and approval of thecapital plan. ALCO and GE share responsibility for capital management and receive regular reports detailing our compliance withapproved limits and guidelines. The Audit and Risk Committees jointly approve the ICAAP process.
Basel IIIOur consolidated regulatory capital requirements are determined by guidelines issued by OSFI, which are based on the minimumBasel III capital ratios adopted by the BCBS.
Under Basel III, banks select from two main approaches, the Standardized Approach or the IRB Approach, to calculate theirminimum regulatory capital required to support credit, market and operational risks. We adopted the Basel III IRB approach tocalculate credit risk capital for consolidated regulatory reporting purposes. While the majority of our credit risk exposures arereported under the Basel III IRB Approach for regulatory capital purposes, certain portfolios continue to use the Basel IIIStandardized Approach for credit risk (for example, our Caribbean Banking operations and City National). For consolidatedregulatory reporting of market risk capital, we use both Internal Models-based and Standardized Approaches. EffectiveNovember 1, 2019, we adopted the Standardized Approach (SA) for consolidated regulatory reporting of operational risk as theuse of the Advanced Measurement Approach was discontinued by OSFI. We determine our regulatory leverage ratio based onOSFI’s Leverage Requirements (LR) Guideline, which reflects the BCBS Basel III leverage ratio requirements. We are required tomaintain a minimum leverage ratio that meets or exceeds 3%.
All federally regulated banks with a Basel III leverage ratio total exposure exceeding €200 billion at their financial year-endare required, at a minimum, to publicly disclose in the first quarter following their year-end, the twelve indicators used in theG-SIB assessment methodology, with the goal of enhancing the transparency of the relative scale of banks’ potential globalsystemic importance and data quality. The FSB publishes an updated list of G-SIBs annually. On November 11, 2020, we werere-designated as a G-SIB by the FSB. This designation requires us to maintain a higher loss absorbency requirement (commonequity as a percentage of RWA) of 1% consistent with the D-SIB requirement.
On April 18, 2018, OSFI released its final guideline on Total Loss Absorbing Capacity (TLAC), which applies to Canadian D-SIBsas part of the Federal Government’s Bail-in regime. The guideline is consistent with the TLAC standard released on November 9,2015 by the FSB for institutions designated as G-SIBs, but tailored to the Canadian context. The TLAC requirement is intended toaddress the sufficiency of a systemically important bank’s loss absorbing capacity in supporting its recapitalization in the eventof its failure. TLAC is defined as the aggregate of Tier 1 capital, Tier 2 capital, and other TLAC instruments, which allow conversionin whole or in part into common shares under the CDIC Act and meet all of the eligibility criteria under the guideline.
TLAC requirements established two minimum standards, which are required to be met effective November 1, 2021: the risk-based TLAC ratio, which builds on the risk-based capital ratios described in the Capital Adequacy Requirements (CAR) guideline,and the TLAC leverage ratio, which builds on the leverage ratio described in OSFI’s LR guideline. On April 16, 2020, OSFI notifiedsystemically important banks of the requirement to maintain a minimum TLAC ratio of 22.5%, which includes the DSB currentlyset at 1.0%. OSFI continues to require a TLAC leverage ratio of 6.75%. We began issuing bail-in eligible debt in the fourth quarterof 2018 and this has contributed to increasing our TLAC ratio. We expect our TLAC ratio to increase through normal courserefinancing of maturing unsecured term debt.
Management’s Discussion and Analysis Royal Bank of Canada: Annual Report 2020 97

On June 20, 2018, OSFI announced that all D-SIBs are required to publicly disclose their Pillar 2 DSB as part of their quarterlydisclosures, similar to other current capital-related disclosure requirements. The level of the buffer ranges between 0% and 2.5%of the entity’s total RWA for the six systemically important banks in Canada. The DSB requirements must be met at the CET1capital level. OSFI will undertake a review of the DSB on a semi-annual basis, in June and December, and will publicly announceany changes at that time. However, on March 13, 2020, OSFI announced a decrease in the DSB from 2.25% to 1.0% of total RWA,with the buffer decrease effective immediately, in response to the disruption related to the COVID-19 pandemic and in support ofthe banks’ ability to supply additional credit to the economy. At that time, OSFI also committed to not increasing the DSB for aperiod of 18 months and announced its expectation that all banks should not increase their dividend payments and should stopany share buybacks. On June 23, 2020, OSFI reaffirmed the DSB at 1.0% of total RWA.
On March 27, 2020, OSFI announced a series of regulatory adjustments and guidance, and continues to release regulationsimplementing and/or clarifying certain aspects on a rolling basis, to further support the financial and operational resilience ofthe banking sector in response to the COVID-19 pandemic, including:• Regulatory adjustments to RWA:
• Delaying the past due treatment of all loan deferrals for a period of six months from the grant date, thereby alleviatingany increase to RWA when clients request payment deferrals for their loans including, but not limited to, mortgages,credit cards, auto loans, small business loans or commercial loans; and
• Temporary measures until at least April 2021 to reduce stressed VaR multipliers from three to one and the permanentexclusion of Funding Valuation Adjustment hedges from market risk.
• Modifications for increases in expected credit loss provisions on CET1 capital by applying a 70% after-tax exclusion rate forgrowth in Stage 1 and Stage 2 allowances between Q1 2020 and the respective quarter for the remainder of fiscal 2020.Thereafter, the exclusion rate will be reduced to 50% and 25% in fiscal 2021 and 2022, respectively. These modifications arenot available for a financial institution’s IRB portfolio in any quarter in which the financial institution has a shortfall inallowances.
• Permitting the use of available buffers above the regulatory authorized minimum for the leverage ratio.
In relation to the relief programs launched by the Government of Canada and described in the Significant developments:COVID-19 section in this 2020 Annual Report, on March 30, 2020, OSFI provided guidance on the associated capital treatment ofthese programs:• Loans issued under the CEBA program are to be excluded from risk-based capital and leverage ratios as they are fully
guaranteed by the government.• The appropriate risk-weighting for both the guaranteed and unsecured portion of the loans issued as part of the EDC BCAP
Guarantee program should be in accordance with existing regulatory guidelines. However, the full amount of the loan isrequired to be included in the leverage ratio calculation.
• Risk-based capital and leverage ratio calculations should reflect only the financial institutions’ own proportion of new loansissued under the BDC lending programs.
Further regulatory guidance was provided by OSFI on April 9, 2020 and April 16, 2020, in support of capital and liquiditymeasures, which became effective immediately:• Leverage ratio exposure amounts are to exclude central bank reserves and sovereign-issued securities that qualify as HQLA
until December 31, 2021, extended from the previous announced end date of April 30, 2021.• Reduction in the current regulatory capital floor for financial institutions using the IRB approach from 75% to 70% of RWA
under the SA. The reduced floor factor will remain in place until the adoption of the Basel III reforms in Q1 2023.• Exclusion of exposures acquired through the Paycheck Protection Program (PPP) instituted by the U.S. government from
RWA and leverage exposure amounts.
OSFI has assessed and will continue to assess the need for these relief measures. Effective August 31, 2020, certain reliefmeasures, such as the past due treatment of all loan deferrals after September 30, 2020, are viewed by OSFI as no longerwarranted and are being gradually phased out based on the timing of when payment deferrals were granted. We haveincorporated the above adjustments and guidance, as applicable, into our results and in our on-going capital planning activities.
The following table provides a summary of OSFI’s current regulatory target ratios under Basel III and Pillar 2 requirements. Weare in compliance with all current capital and leverage requirements imposed by OSFI:
Basel III – OSFI regulatory targets Table 64
Basel IIIcapital and
leverage ratios
OSFI regulatory target requirementsfor large banks under Basel III RBC capital
andleverage
ratios as atOctober 31,
2020
DomesticStabilityBuffer (3)
MinimumincludingCapitalBuffers,
D-SIB/G-SIBsurcharge and
DomesticStability
Buffer
Minimum CapitalBuffers (1)
MinimumincludingCapitalBuffers
D-SIB/G-SIBSurcharge (2)
MinimumincludingCapital
Buffers andD-SIB/G-SIBsurcharge (2)
Common Equity Tier 1 4.5% 2.5% 7.0% 1.0% 8.0% 12.5% 1.0% 9.0%Tier 1 capital 6.0% 2.5% 8.5% 1.0% 9.5% 13.5% 1.0% 10.5%Total capital 8.0% 2.5% 10.5% 1.0% 11.5% 15.5% 1.0% 12.5%Leverage ratio 3.0% n.a. 3.0% n.a. 3.0% 4.8% n.a. 3.0%
(1) The capital buffers include the capital conservation buffer and the countercyclical capital buffer as prescribed by OSFI.(2) A capital surcharge, equal to the higher of our D-SIB surcharge and the BCBS’s G-SIB surcharge, is applicable to risk-weighted capital.(3) Effective March 13, 2020, in accordance with the revised guidance noted above, OSFI lowered the level for the DSB to 1.0% of RWA from 2.25%. On June 23, 2020, OSFI
reaffirmed the DSB at 1.0% of total RWA.n.a. not applicable.
98 Royal Bank of Canada: Annual Report 2020 Management’s Discussion and Analysis

Regulatory capital, RWA and capital ratiosUnder Basel III, regulatory capital consists of CET1, Additional Tier 1 and Tier 2 capital.
CET1 capital comprises the highest quality of capital. Regulatory adjustments under Basel III include full deductions ofcertain items and additional capital components that are subject to threshold deductions.
Tier 1 capital comprises predominantly CET1 and Additional Tier 1 items including non-cumulative preferred shares andlimited recourse capital notes (LRCNs) that meet certain criteria. Tier 2 capital primarily includes subordinated debentures thatmeet certain criteria and certain loan loss allowances. Total capital is defined as the sum of Tier 1 and Tier 2 capital. Preferredshares, LRCNs, and subordinated debentures issued after January 1, 2013 require Non-viability contingent capital (NVCC) featuresto be included into regulatory capital. NVCC requirements ensure that non-common regulatory capital instruments bear lossesbefore banks seek government funding.
Regulatory capital ratios are calculated by dividing CET1, Tier 1 and Total capital by their respective RWA.
The following chart provides a summary of the major components of CET1, Additional Tier 1 and Tier 2 capital.
Common Equity Tier 1 (CET1) (1) Additional Tier 1 Capital Tier 2 Capital+ +
Tier 1 Capital
Common sharesRetained earningsOther components of equityNon-controlling interests in subsidiariesCET1 instruments
Goodwill and other intangiblesDeferred tax assets on loss carryforwardsDefined benefit pension fund assetsNon-significant investments in CET1 instruments of financial institutions (3)
Shortfall of provisions to expected losses
Preferred sharesLimited recourse capital notes
Non-significant investments in Tier 1instruments of Financial Institutions (3)
Significant investments in other Financial Institutions and insurance subsidiaries Tier 1 instruments
Non-significant investments in Tier 2 instruments of Financial Institutions (3)
Significant investments in other Financial Institutions and insurance subsidiaries Tier 2 instruments
Significant investments in insurance subsidiaries and CET1 instruments in other financial institutionsMortgage servicing rightsDeferred tax assets relating to temporary differences
Total Capital
Subordinated debenturesCertain loan loss allowancesNon-controlling interests in subsidiaries Tier 2 instruments
Ded
ucti
ons
Thre
sho
ldD
educ
tio
ns (2
)
Higher qualitycapital
Lower qualitycapital
Non-controlling interests in subsidiaries Tier 1 instruments
(1) Effective March 27, 2020, in accordance with OSFI’s regulatory adjustments, modifications for increases in expected credit loss provisions for CET1 capital aresubject to applying a 70% after-tax exclusion rate for growth in Stage 1 and Stage 2 allowances, relative to January 31, 2020 balances.
(2) First level: The amount by which each of the items exceeds a 10% threshold of CET1 capital (after all deductions but before threshold deductions) will bededucted from CET1 capital. Second level: The aggregate amount of the three items not deducted from the first level above and in excess of 15% of CET1 capitalafter regulatory adjustments will be deducted from capital, and the remaining balance not deducted will be risk-weighted at 250%.
(3) Non-significant investments are subject to certain CAR criteria that drive the amount eligible for deduction.
The following tables provide details on our regulatory capital, RWA, and capital and leverage ratios. Our capital position remainsstrong and our capital and leverage ratios remain well above OSFI regulatory targets:
Regulatory capital, risk-weighted assets (RWA) and capital and leverage ratios Table 65
As at
(Millions of Canadian dollars, except percentage amounts and as otherwise noted)October 31
2020October 31
2019Capital (1)
CET1 capital $ 68,082 $ 62,184Tier 1 capital 74,005 67,861Total capital 84,928 77,888
Risk-weighted Assets (RWA) used in calculation of capital ratios (1)
Credit risk $448,821 $417,835Market risk 27,374 28,917Operational risk 70,047 66,104
Total RWA $546,242 $512,856
Capital ratios and Leverage ratio (1)
CET1 ratio 12.5% 12.1%Tier 1 capital ratio 13.5% 13.2%Total capital ratio 15.5% 15.2%Leverage ratio 4.8% 4.3%Leverage ratio exposure (billions) $ 1,552.9 $ 1,570.5
(1) Capital, RWA, and capital ratios are calculated using OSFI’s CAR guideline and the Leverage ratio is calculated using OSFI’s LR guidelineas updated in accordance with the regulatory guidance issued in fiscal 2020 by OSFI in response to the COVID-19 pandemic. Both the CARguideline and LR guideline are based on the Basel III framework.
Management’s Discussion and Analysis Royal Bank of Canada: Annual Report 2020 99

Regulatory capital Table 66
As at
(Millions of Canadian dollars)
October 31
2020October 31
2019CET1 capital: instruments and reserves and regulatory adjustmentsDirectly issued qualifying common share capital (and equivalent for non-joint
stock companies) plus related stock surplus $ 17,732 $ 17,888Retained earnings 59,573 55,680Accumulated other comprehensive income (and other reserves) 3,414 4,248Directly issued capital subject to phase out from CET1 (only applicable to
non-joint stock companies) – –Common share capital issued by subsidiaries and held by third parties (amount
allowed in group CET1) 12 12Regulatory adjustments applied to CET1 under Basel III (12,649) (15,644)
Common Equity Tier 1 capital (CET1) $ 68,082 $ 62,184
Additional Tier 1 capital: instruments and regulatory adjustmentsDirectly issued qualifying Additional Tier 1 instruments plus related
stock surplus $ 5,921 $ 4,175Directly issued capital instruments to phase out from Additional Tier 1 – 1,500Additional Tier 1 instruments issued by subsidiaries and held by third parties
(amount allowed in group AT1) 2 2Regulatory adjustments applied to Additional Tier 1 under Basel III – –
Additional Tier 1 capital (AT1) $ 5,923 $ 5,677
Tier 1 capital (T1 = CET1 + AT1) $ 74,005 $ 67,861
Tier 2 capital: instruments and provisions and regulatory adjustmentsDirectly issued qualifying Tier 2 instruments plus related stock surplus $ 9,049 $ 6,998Directly issued capital instruments subject to phase out from Tier 2 488 2,509Tier 2 instruments issued by subsidiaries and held by third parties
(amount allowed in group Tier 2) 29 25Collective allowance 1,357 495Regulatory adjustments applied to Tier 2 under Basel III – –
Tier 2 capital (T2) $ 10,923 $ 10,027
Total capital (T1 + T2) $ 84,928 $ 77,888
2020 vs. 2019
October 31,2019 (1)
12.1%
166 bps(32) bps
(30) bps(29) bps
12.5%
Internalcapital
generation(excl. PCL) (2)
RWA growth - downgrades
Sharerepurchases
RWA growth - business
Regulatoryupdates
RWA decrease- models &
methodology
Other October 31,2020 (1)
18 bps (16) bps (3) bps
(39) bps
PCL net ofcapital
modification
Continuity of CET1 ratio (Basel III)
(1) Represents rounded figures.(2) Internal capital generation of $8.5 billion which represents Net income available to shareholders excluding PCL, less common and preferred shares dividends
and distributions on other equity instruments.
Our CET1 ratio was 12.5%, up 40 bps from last year, mainly reflecting internal capital generation, partially offset by higher RWA,the impact of higher PCL net of related capital modifications for expected loss provisioning, the impact of regulatory changesand share repurchases.
Our Tier 1 capital ratio of 13.5% was up 30 bps, reflecting the factors noted above under the CET1 ratio and the favourableimpact of the issuance of LRCNs, partially offset by the redemption of preferred shares.
100 Royal Bank of Canada: Annual Report 2020 Management’s Discussion and Analysis

Our Total capital ratio of 15.5% was up 30 bps, reflecting the factors noted above under the Tier 1 capital ratio. Total capitalratio was also positively impacted by the inclusion of excess provisions, net of capital modifications applied, partially offset bythe net redemption of subordinated debentures.
Our Leverage ratio of 4.8% was up 50 bps, mainly reflecting internal capital generation, the impact of regulatorymodifications for central bank reserves and sovereign-issued securities qualifying as HQLA, and the issuance of LRCNs. Thesefactors were partially offset by higher leverage exposures, the impact of higher PCL net of capital modifications for expected lossprovisioning, the redemption of preferred shares, share repurchases and the impact of the adoption of IFRS 16.
Leverage exposures decreased by $17.6 billion mainly due to the impact of regulatory modifications for central bank reservesand sovereign-issued securities qualifying as HQLA, partially offset by business growth mainly in cash, loans and securities, theimpact of foreign exchange translation, and the impact of the adoption of IFRS 16.
Basel III RWAOSFI requires banks to meet minimum risk-based capital requirements for exposures to credit risk, operational risk, and wherethey have significant trading activity, market risk. RWA is calculated for each of these risk types and added together to determinetotal RWA. In addition, a minimum capital floor requirement must be maintained as prescribed under OSFI’s CAR guidelines.Effective April 9, 2020, the capital floor requirement was set to 70% of RWA as calculated under current Basel III standardizedcredit risk and market risk approaches as defined in the CAR guidelines. If the capital requirement is less than the requiredthreshold, a floor adjustment to RWA must be applied to the reported RWA as prescribed by OSFI CAR guidelines.
Total risk-weighted assets Table 67
2020 2019
Averageof risk-
weights (2)
Risk-weighted assets
As at October 31 (Millions of Canadian dollars,except percentage amounts) Exposure (1)
Standardizedapproach
Advancedapproach Other Total Total
Credit riskLending-related and other
Residential mortgages $ 302,980 8% $ 9,294 $ 15,310 $ – $ 24,604 $ 23,629Other retail 299,180 20% 6,848 53,696 – 60,544 59,443Business 378,188 58% 51,175 167,628 – 218,803 215,342Sovereign 281,426 5% 2,385 12,986 – 15,371 9,400Bank 29,911 17% 1,720 3,508 – 5,228 7,648
Total lending-related and other $1,291,685 25% $ 71,422 $253,128 $ – $324,550 $315,462
Trading-relatedRepo-style transactions $ 857,349 1% $ 88 $ 9,352 $ 56 $ 9,496 $ 10,469Derivatives – including CVA – CET1 phase-in
adjustment 93,930 46% 2,073 22,347 18,497 42,917 33,617
Total trading-related $ 951,279 6% $ 2,161 $ 31,699 $18,553 $ 52,413 $ 44,086
Total lending-related and other and trading-related $2,242,964 17% $ 73,583 $284,827 $18,553 $376,963 $359,548
Bank book equities 3,456 143% – 4,931 – 4,931 4,583Securitization exposures 64,421 18% 5,270 6,219 – 11,489 7,794Regulatory scaling factor n.a. n.a. n.a. 17,385 – 17,385 17,089Other assets 29,459 129% n.a. n.a. 38,053 38,053 28,821
Total credit risk $2,340,300 19% $ 78,853 $313,362 $56,606 $448,821 $417,835
Market riskInterest rate $ 2,309 $ 5,532 $ – $ 7,841 $ 7,264Equity 2,066 1,562 – 3,628 3,381Foreign exchange 2,544 373 – 2,917 1,756Commodities 238 49 – 287 296Specific risk 4,932 1,053 – 5,985 8,885Incremental risk charge – 6,716 – 6,716 7,335
Total market risk $ 12,089 $ 15,285 $ – $ 27,374 $ 28,917
Operational risk $ 70,047 n.a. n.a. $ 70,047 $ 66,104
Total risk-weighted assets $2,340,300 $ 160,989 $328,647 $56,606 $546,242 $512,856
(1) Total exposure represents EAD which is the expected gross exposure upon the default of an obligor. This amount is before any allowance against impaired loans orpartial write-offs and does not reflect the impact of credit risk mitigation and collateral held.
(2) Represents the average of counterparty risk weights within a particular category.n.a. not applicable.
2020 vs. 2019During the year, RWA was up $33 billion, primarily driven by the impact of net credit downgrades, business growth mainly inderivatives, cash and lending as well as the impact of foreign exchange translation. The unfavourable impact of regulatorychanges reflecting the adoption of IFRS 16 and removal of allowed grandfathering and transitioning treatment for certainsecuritization and counterparty credit risk exposures, also contributed to the increase. These factors were partially offset by netnormal course model and methodology changes, including capital modifications associated with the reduction in market risk.The impact of foreign exchange translation on RWA is largely mitigated with economic hedges in our CET1 ratio.
Management’s Discussion and Analysis Royal Bank of Canada: Annual Report 2020 101

Selected capital management activity
Selected capital management activity Table 68
For the year ended October 31, 2020
(Millions of Canadian dollars, except number of shares)
Issuance orredemption date
Number ofshares (000s) Amount
Tier 1 capitalCommon shares activity
Issued in connection with share-basedcompensation plans (1) 1,043 $ 80
Purchased for cancellation (7,860) (97)Issuance of limited recourse capital notes
Series 1 (2), (3), (4) 1,750 $ 1,750Redemption of preferred shares, Series W (3) October 1, 2020 (12,000) $ (300)Redemption of preferred shares, Series AA (3) October 1, 2020 (12,000) (300)Redemption of preferred shares, Series AC (3) October 1, 2020 (8,000) (200)Redemption of preferred shares, Series AE (3) October 1, 2020 (10,000) (250)Redemption of preferred shares, Series AF (3) October 1, 2020 (8,000) (200)Redemption of preferred shares, Series AG (3) October 1, 2020 (10,000) (250)Tier 2 capitalRedemption of December 6, 2024 subordinated
debentures (5) December 6, 2019 $ (2,000)Issuance of December 23, 2029 subordinated
debentures (4), (5) December 23, 2019 1,500Redemption of June 4, 2025 subordinated
debentures (4), (5) June 4, 2020 (1,000)Issuance of June 30, 2030 subordinated
debentures (4), (5) June 23, 2020 1,250OtherPurchase and cancellation of preferred shares
Series C-2 (3) December 17, 2019 (5) $ (8)
(1) Amounts include cash received for stock options exercised during the period and fair value adjustments to stock options.(2) For the LRCNs, the number of shares represent the number of notes issued.(3) For further details, refer to Note 20 of our 2020 Annual Consolidated Financial Statements.(4) NVCC instruments.(5) For further details, refer to Note 19 of our 2020 Annual Consolidated Financial Statements.
On February 27, 2019, we announced a normal course issuer bid (NCIB) to purchase up to 20 million of our common shares,commencing on March 1, 2019 and continuing until February 29, 2020, or such earlier date as we complete the repurchase of allshares permitted under the bid. This NCIB was completed on February 26, 2020, with 14.0 million common shares repurchasedand cancelled at a total cost of approximately $1,457 million.
On February 27, 2020, we announced an NCIB program to purchase up to 20 million of our common shares, commencing onMarch 2, 2020 and continuing until March 1, 2021, or such earlier date as we complete the repurchase of all shares permittedunder the bid. Since the inception of this NCIB, the total number of common shares repurchased and cancelled wasapproximately 0.4 million, at a cost of approximately $39 million. In accordance with OSFI’s announcement of its expectation thatshare buybacks should be stopped, we ceased the repurchase of our common shares effective March 13, 2020.
In fiscal 2020, the total number of common shares repurchased and cancelled under our NCIB programs was approximately7.9 million. The total cost of the shares repurchased was $814 million.
We determine the amount and timing of the purchases under the NCIB, subject to prior consultation with OSFI. Purchasesmay be made through the TSX, the NYSE and other designated exchanges and alternative Canadian trading systems. The pricepaid for repurchased shares is the prevailing market price at the time of acquisition.
On December 6, 2019, we redeemed all $2,000 million of our outstanding 2.99% subordinated debentures due on December 6,2024 for 100% of their principal amount plus interest accrued to, but excluding, the redemption date.
On December 17, 2019, we purchased for cash 200,000 depositary shares, each representing a one-fortieth interest in a shareof our Fixed Rate/Floating Rate Non-Cumulative First Preferred Shares, Series C-2 (C-2 Preferred Shares), for aggregate totalconsideration, including accrued dividends, of US$6 million. The purchased depositary and underlying C-2 Preferred Shares weresubsequently cancelled. The C-2 Preferred Shares do not qualify as Tier 1 regulatory capital.
On December 23, 2019, we issued $1,500 million of NVCC subordinated debentures. The notes bear interest at a fixed rate of2.88% per annum until December 23, 2024, and at the three-month Canadian Dollar Offered Rate (CDOR) plus 0.89% thereafteruntil their maturity on December 23, 2029.
On June 4, 2020, we redeemed all $1,000 million of our outstanding NVCC 2.48% subordinated debentures due on June 4, 2025for 100% of their principal amount plus interest accrued to, but excluding, the redemption date.
On June 23, 2020, we issued $1,250 million of NVCC subordinated debentures. The notes bear interest at a fixed rate of 2.088%per annum until June 30, 2025, and at the three-month CDOR plus 1.31% thereafter until their maturity on June 30, 2030.
102 Royal Bank of Canada: Annual Report 2020 Management’s Discussion and Analysis

On July 28, 2020, we issued $1,750 million of LRCN Series 1 at a price of $1,000 per note. The LRCN Series 1 bear interest at afixed rate of 4.5% per annum until November 24, 2025, and thereafter at a rate per annum, reset every fifth year, equal to the5-Year Government of Canada Yield plus 4.137% until maturity on November 24, 2080.
On October 1, 2020, we redeemed Non-Cumulative First Preferred Shares at a price of $25 per share, including all 12 millionissued and outstanding Series W shares; all 12 million issued and outstanding Series AA shares; all 8 million issued andoutstanding Series AC shares; all 10 million issued and outstanding Series AE shares; all 8 million issued and outstanding SeriesAF shares; and all 10 million issued and outstanding Series AG shares.
On November 2, 2020, we issued $1,250 million of LRCN Series 2, at a price per note of $1,000. The LRCN Series 2 bear interest at afixed rate of 4% per annum until February 24, 2026, and thereafter at a rate per annum, reset every fifth year, equal to the 5-YearGovernment of Canada Yield plus 3.167% until maturity on February 24, 2081.
DividendsOur common share dividend policy reflects our earnings outlook, payout ratio objective and the need to maintain adequatelevels of capital to support business plans. In 2020, our dividend payout ratio was 55%. Common share dividends paid during theyear were $6.1 billion. In accordance with OSFI’s announcement on March 13, 2020 of its expectation that all banks should notincrease their dividend payment, we have maintained our dividend payment since that date.
Selected share data (1) Table 69
2020 2019
(Millions of Canadian dollars, except number of sharesand as otherwise noted)
Number ofshares (000s) Amount
Dividendsdeclared
per shareNumber of
shares (000s) Amount
Dividendsdeclared
per shareCommon shares issued 1,423,861 $17,628 $ 4.29 1,430,678 $ 17,645 $ 4.07Treasury shares – common shares (1,388) (129) (582) (58)
Common shares outstanding 1,422,473 $17,499 1,430,096 $ 17,587
Stock options and awardsOutstanding 7,735 7,697Exercisable 3,314 2,980Available for grant 7,082 8,171
First preferred shares issuedNon-cumulative Series W (2), (3) – $ – $ 1.05 12,000 $ 300 $ 1.23Non-cumulative Series AA (3) – – 0.95 12,000 300 1.11Non-cumulative Series AC (3) – – 0.98 8,000 200 1.15Non-cumulative Series AE (3) – – 0.96 10,000 250 1.13Non-cumulative Series AF (3) – – 0.95 8,000 200 1.11Non-cumulative Series AG (3) – – 0.96 10,000 250 1.13Non-cumulative Series AZ (4), (5) 20,000 500 0.93 20,000 500 0.96Non-cumulative Series BB (4), (5) 20,000 500 0.91 20,000 500 0.96Non-cumulative Series BD (4), (5) 24,000 600 0.85 24,000 600 0.90Non-cumulative Series BF (4), (5) 12,000 300 0.90 12,000 300 0.90Non-cumulative Series BH (5) 6,000 150 1.23 6,000 150 1.23Non-cumulative Series BI (5) 6,000 150 1.23 6,000 150 1.23Non-cumulative Series BJ (5) 6,000 150 1.31 6,000 150 1.31Non-cumulative Series BK (4), (5) 29,000 725 1.38 29,000 725 1.38Non-cumulative Series BM (4), (5) 30,000 750 1.38 30,000 750 1.38Non-cumulative Series BO (4), (5) 14,000 350 1.20 14,000 350 1.27Non-cumulative Series C-2 (6) 15 23 US$67.50 20 31 US$ 67.50
Other equity instruments issuedLimited recourse capital notes
Series 1 (4), (5), (7) 1,750 1,750 4.50% – – –
Preferred shares and other equityinstruments issued 168,765 $ 5,948 227,020 $ 5,706
Treasury instruments – preferred sharesand other equity instruments (8) (2) (3) 34 1
Preferred shares and other equityinstruments outstanding 168,763 $ 5,945 227,054 $ 5,707
Dividends on common shares $ 6,111 $ 5,840Dividends on preferred shares and
distributions on other equityinstruments (9) 268 269
(1) For further details about our capital management activity, refer to Note 20 of our 2020 Annual Consolidated Financial Statements.(2) Effective February 24, 2010, we have the right to convert these shares into common shares at our option, subject to certain restrictions.(3) On October 1, 2020, we redeemed Non-Cumulative First Preferred Shares at a price of $25 per share, including all 12 million issued and outstanding Series W shares; all
12 million issued and outstanding Series AA shares; all 8 million issued and outstanding Series AC shares; all 10 million issued and outstanding Series AE shares; all8 million issued and outstanding Series AF shares; and all 10 million issued and outstanding Series AG shares.
(4) Dividend rate will reset every five years.(5) NVCC instruments.(6) Represents 615,400 depositary shares relating to preferred shares Series C-2. Each depositary share represents one-fortieth interest in a share of Series C-2.(7) For LRCNs, the number of shares represent the number of notes issued and the dividends declared per share represent the annual interest rate percentage applicable to the
notes issued as at the reporting date. In connection with the issuance of LRCN Series 1, on July 28, 2020, we issued $1,750 million of First Preferred Shares Series BQ (SeriesBQ) at a price of $1,000 per Series BQ. The Series BQ were issued to a consolidated trust to be held as trust assets in connection with the LRCN structure.
(8) Positive amounts represent a short position in treasury instruments.(9) Excludes distributions to non-controlling interests.
Management’s Discussion and Analysis Royal Bank of Canada: Annual Report 2020 103

As at November 27, 2020, the number of outstanding common shares was 1,423,065,739, net of treasury shares held of 917,878, andthe number of stock options and awards was 7,616,167.
NVCC provisions require the conversion of the capital instrument into a variable number of common shares in the event thatOSFI deems a bank to be non-viable or a federal or provincial government in Canada publicly announces that a bank hasaccepted or agreed to accept a capital injection. If a NVCC trigger event were to occur, our NVCC capital instruments as atOctober 31, 2020, which are the preferred shares Series AZ, BB, BD, BF, BH, BI, BJ, BK, BM, BO, LRCN Series 1 and subordinateddebentures due on September 29, 2026, January 20, 2026, January 27, 2026, July 25, 2029, December 23, 2029 and June 30, 2030would be converted into common shares pursuant to an automatic conversion formula with a conversion price based on thegreater of: (i) a contractual floor price of $5.00, and (ii) the current market price of our common shares at the time of the triggerevent (10-day weighted average). Based on a floor price of $5.00 and including an estimate for accrued dividends and interest,these NVCC capital instruments would convert into a maximum of 3,870 million common shares, in aggregate, which wouldrepresent a dilution impact of 73.12% based on the number of common shares outstanding as at October 31, 2020.
Attributed capitalOur methodology for allocating capital to our business segments is based on the Basel III regulatory capital requirements, withthe exception of Insurance. For Insurance, the allocation of capital is based on fully diversified economic capital. Risk-basedcapital attribution provides a uniform base for performance measurement among business segments, which compares to ouroverall corporate return objective and facilitates management decisions in resource allocation in conjunction with other factors.
The calculation and attribution of capital involves a number of assumptions and judgments by management which aremonitored to ensure that the regulatory capital framework remains comprehensive and consistent. The models are benchmarkedto leading industry practices via participation in surveys, reviews of methodologies and ongoing interaction with external riskmanagement industry professionals.
For additional information on the risks highlighted below, refer to the Risk management section.
Royal Bank ofCanada
Personal &Commercial
Banking
WealthManagement Insurance Investor &
Treasury Services Capital Markets
RWA (C$ millions) (1)
Credit $448,821Market 27,374Operational 70,047 $546,242
Attributed capital (1)
Credit 64%Market 5Operational 11Goodwilland other intangibles 19Other (2) 1
RWA (C$ millions) (1)
Credit $166,609Market 424Operational 27,783 $194,816
RWA (C$ millions) (1)
Credit $74,148Market 422Operational 18,908 $93,478
RWA (C$ millions) (1)
Credit $16,771Market 3,373Operational 4,897 $25,041
RWA (C$ millions) (1)
Credit $168,457Market 22,062Operational 18,028 $208,549
Attributed capital (1)
Credit 70%Market –Operational 12Goodwilland other intangibles 19Other (2) (1)
Attributed capital (1)
Credit 44%Market 1Operational 11Goodwilland other intangibles 44Other (2) –
Attributed capital (1)
Based on EconomicCapital:Credit 9%Market 16Operational 10Goodwilland other intangibles 10Other (2) 55
Attributed capital (1)
Credit 52%Market 16Operational 15Goodwilland other intangibles 16Other (2) 1
Attributed capital (1)
Credit 76%Market 10Operational 7Goodwilland other intangibles 7Other (2) –
RWA (C$ millions) (1), (3)
Credit $12,277Market –Operational – $12,277
(1) RWA amount represents period-end spot balances. Attributed Capital represents average balances.(2) Other includes (a) non-Insurance segments: equity required to underpin Basel III regulatory capital deductions other than Goodwill and other intangibles as well as capital
modifications for expected loss provisioning and (b) Insurance segment: equity required to underpin risks associated with business, fixed assets and insurance risks.(3) Insurance RWA represents our investments in the insurance subsidiaries capitalized at the regulatory prescribed rate as required under OSFI CAR guideline.
Other considerations affecting capitalCapital treatment for equity investments in other entities is determined by a combination of accounting and regulatoryguidelines based on the size or nature of the investment. Three broad approaches apply as follows:• Consolidation: entities which we control are consolidated on our Consolidated Balance Sheets.• Deduction: certain holdings are deducted from our regulatory capital. These include all unconsolidated “substantial
investments,” as defined by the Bank Act (Canada) in the capital of financial institutions, as well as all investments ininsurance subsidiaries.
• Risk weighting: equity investments that are not deducted from capital are risk-weighted at a prescribed rate fordetermination of capital charges.
104 Royal Bank of Canada: Annual Report 2020 Management’s Discussion and Analysis

Regulatory capital approach for securitization exposuresOur securitization regulatory capital approach reflects Chapter 7 of OSFI’s CAR guidelines. For our securitization exposures, weuse an internal assessment approach (IAA) for exposures related to our ABCP business, and as per regulatory guidelines forother securitization exposures we use a combination of approaches including an external ratings based approach, an IRBapproach and a standardized approach.
While our IAA rating methodologies are based in large part on criteria that are published by External Credit AssessmentInstitutions (ECAIs) such as S&P and therefore are similar to the methodologies used by these institutions, they are not identical.Our ratings process includes a comparison of the available credit enhancement in a securitization structure to a stressed level ofprojected losses. The stress level used is determined by the desired risk profile of the transaction. As a result, we stress the cashflows of a given transaction at a higher level in order to achieve a higher rating. Conversely, transactions that only pass lowerstress levels achieve lower ratings.
Most of the other securitization exposures (non-ABCP) carry external ratings and we use the external rating for determiningthe proper capital allocation for these positions. We periodically compare our own ratings to ECAIs ratings to ensure that theratings provided by ECAIs are reasonable.
GRM is responsible for providing risk assessments for capital purposes in respect of all our banking book exposures. GRM isindependent of the business originating the securitization exposures and performs its own analysis, sometimes in conjunctionwith but always independent of the applicable business. GRM has developed asset class specific criteria guidelines whichprovide the rating methodologies for each asset class. The guidelines are reviewed periodically and are subject to the ratingsreplication process mandated by Pillar I of the Basel rules.
Regulatory developmentsBasel III reformsUnder the new Basel III reforms, OSFI revised its capital requirement for operational risk applicable to deposit taking institutionsand a new Standardized Approach (SA) will be required. On January 20, 2020, OSFI extended the effective implementation date toQ1 2022 from the previous effective date of Q1 2021.
On March 27, 2020, the BCBS extended the effective implementation dates of the following regulatory requirements in recognitionof the operational challenges brought about by the COVID-19 pandemic for both bank supervisors such as OSFI and the banksthey supervise, including:• Basel III reforms (credit risk and operational risk) to January 1, 2023 from the previous effective date of January 1, 2022.• Minimum capital requirements for market risk to January 1, 2023 from the previous effective date of January 1, 2022.• Revised Pillar 3 disclosure requirements deferred to January 1, 2023.
On March 27, 2020, OSFI also announced the effective implementation requirements for the Basel III reforms applicable to us andother Canadian D-SIBs to January 31, 2023, which is aligned with the BCBS and the Minimum capital requirements for market riskto January 31, 2024.
Global systemically important banks (G-SIB)On April 3, 2020, the BCBS announced its postponement of the implementation of the revised G-SIB framework from 2021 to 2022in order to provide additional operational capacity for banks and supervisors in light of the COVID-19 pandemic.
Basel III reforms – Credit valuation adjustment (CVA)On July 8, 2020, BCBS revised its standard on the regulatory capital treatment of CVA risk for derivatives and securities financingtransactions. The revised standard reflects recalibrated risk weights, guidance on the treatment of certain client clearedderivatives and permits recalibration between the two CVA framework methodologies allowed. These changes bring the CVAframeworks more in alignment with the updated Minimum capital requirement for market risk. While the BCBS effective date forthis standard is January 1, 2023, OSFI has allowed deferral of the implementation date to January 1, 2024 to align with the OSFIimplementation date of the market risk framework. We are currently assessing the impact of the guidelines and do not anticipateany issues with meeting OSFI’s effective implementation date.
Accounting and control matters
Critical accounting policies and estimates
Application of critical accounting policies, judgments, estimates and assumptionsOur significant accounting policies are described in Note 2 of our 2020 Annual Consolidated Financial Statements. Certain ofthese policies and related estimates are recognized as critical because they require us to make particularly subjective orcomplex judgments about matters that are inherently uncertain and significantly different amounts could be reported underdifferent conditions or using different assumptions. Certain critical judgments relating to allowance for credit losses and goodwillare particularly complex in the current uncertain environment. The COVID-19 pandemic has continued to evolve and theeconomic environment in which we operate could be subject to sustained volatility, which could continue to impact our financialresults, as the duration of the COVID-19 pandemic, and the effectiveness of steps undertaken by governments and central banksremains uncertain. We continue to monitor and assess the impacts of the COVID-19 pandemic on our critical accountingjudgments, estimates and assumptions. For further information, refer to Notes 2, 5 and 10 of our 2020 Annual ConsolidatedFinancial Statements.
Our critical accounting judgments, estimates and assumptions relate to the fair value of financial instruments, allowance forcredit losses, goodwill and other intangible assets, employee benefits, consolidation, derecognition of financial assets,application of the effective interest method, provisions, insurance claims and policy benefit liabilities, and income taxes. Ourcritical accounting policies and estimates have been reviewed and approved by our Audit Committee, in consultation withmanagement, as part of their review and approval of our significant accounting policies, judgments, estimates and assumptions.
Management’s Discussion and Analysis Royal Bank of Canada: Annual Report 2020 105

Changes in accounting policiesDuring the first quarter of 2020, we adopted IFRS 16. As permitted by the transition provisions of IFRS 16, we elected not to restatecomparative period results; accordingly, all comparative information prior to the first quarter of 2020 is presented in accordancewith our previous accounting policies, as described in Note 2 of our 2020 Annual Consolidated Financial Statements. As a resultof the adoption of IFRS 16, we recognized right-of-use assets, lease liabilities and an adjustment to opening retained earnings asat November 1, 2019. Refer to Note 2 of our 2020 Annual Consolidated Financial Statements for details of these changes.
During the first quarter of 2020, we early adopted amendments to IFRS 9 Financial Instruments (IFRS 9), IAS 39 FinancialInstruments: Recognition and Measurement and IFRS 7 Financial Instruments: Disclosures (Amendments). Refer to Note 2 of our2020 Annual Consolidated Financial Statements for details of these changes.
Fair value of financial instrumentsThe fair value of a financial instrument is the price that would be received to sell an asset or paid to transfer a liability in anorderly transaction between market participants at the measurement date. We determine fair value by incorporating factors thatmarket participants would consider in setting a price, including commonly accepted valuation approaches.
We give priority to third-party pricing services and valuation techniques with the highest and most consistent accuracy. Thelevel of accuracy is determined over time by comparing third-party price values to traders’ or system values, other pricingservice values and, when available, actual trade data. Other valuation techniques are used when a price or quote is not available.Some valuation processes use models to determine fair value. We have a systematic and consistent approach to control the useof models.
In determining fair value, a hierarchy is used which prioritizes the inputs to valuation techniques. The fair value hierarchygives the highest priority to unadjusted quoted prices in active markets and the lowest priority to unobservable inputs. Fairvalues established based on this hierarchy require the use of observable market data whenever available. Level 1 inputs areunadjusted quoted prices in active markets for identical assets or liabilities that we have the ability to access at themeasurement date. Level 2 inputs include quoted prices for similar assets or liabilities in active markets, quoted prices foridentical or similar assets or liabilities in markets that are not active, and model inputs that are either observable, or can becorroborated by observable market data for substantially the full term of the assets or liabilities. Level 3 inputs include one ormore inputs that are unobservable and significant to the fair value of the asset or liability. Unobservable inputs are used tomeasure fair value to the extent that observable inputs are not available at the measurement date. The availability of inputs forvaluation may affect the selection of valuation techniques. The classification of a financial instrument in the fair value hierarchyfor disclosure purposes is based upon the lowest level of input that is significant to the measurement of fair value.
Where observable prices or inputs are not available, management judgment is required to determine fair values byassessing other relevant sources of information such as historical data, proxy information from similar transactions, and throughextrapolation and interpolation techniques. For more complex or illiquid instruments, significant judgment is required todetermine the model used, select the model inputs, and in some cases, apply valuation adjustments to the model value or quotedprice for inactively traded financial instruments. The selection of model inputs may be subjective and the inputs may beunobservable. Unobservable inputs are inherently uncertain as there is little or no market data available from which todetermine the level at which the transaction would occur under normal business circumstances. Appropriate parameteruncertainty and market risk valuation adjustments for such inputs and other model risk valuation adjustments are assessed in allsuch instances
Valuation adjustments may be subjective as they require significant judgment in the input selection, such as the probabilityof default and recovery rate, and are intended to arrive at a fair value that is determined based on assumptions that marketparticipants would use in pricing the financial instrument. The realized price for a transaction may be different from its recordedvalue that was previously estimated using management judgment, and may therefore impact unrealized gains and lossesrecognized in Non-interest income – Trading revenue or Other.
For further information on the fair value of financial instruments, refer to Notes 2 and 3 of our 2020 Annual ConsolidatedFinancial Statements.
Allowance for credit lossesAn allowance for credit losses (ACL) is established for all financial assets, except for financial assets classified or designated asFVTPL and equity securities designated as FVOCI, which are not subject to impairment assessment. Assets subject to impairmentassessment include certain loans, debt securities, interest-bearing deposits with banks, customers’ liability under acceptances,accounts and accrued interest receivable, and finance and operating lease receivables. Off-balance sheet items subject toimpairment assessment include financial guarantees and undrawn loan commitments.
We measure the ACL on each balance sheet date according to a three-stage expected credit loss impairment model:• Performing financial assets
• Stage 1 – From initial recognition of a financial asset to the date on which the asset has experienced a significantincrease in credit risk relative to its initial recognition, a loss allowance is recognized equal to the credit lossesexpected to result from defaults occurring over the 12 months following the reporting date.
• Stage 2 – Following a significant increase in credit risk relative to the initial recognition of the financial asset, a lossallowance is recognized equal to the credit losses expected over the remaining lifetime of the asset.
• Impaired financial assets• Stage 3 – When a financial asset is considered to be credit-impaired, a loss allowance is recognized equal to credit
losses expected over the remaining lifetime of the asset. Interest income is calculated based on the carryingamount of the asset, net of the loss allowance, rather than on its gross carrying amount.
The ACL is a discounted probability-weighted estimate of the cash shortfalls expected to result from defaults over the relevanttime horizon. For loan commitments, credit loss estimates consider the portion of the commitment that is expected to be drawnover the relevant time period. For financial guarantees, credit loss estimates are based on the expected payments required underthe guarantee contract. For finance lease receivables, credit loss estimates are based on cash flows consistent with the cashflows used in measuring the lease receivable.
The ACL represents an unbiased estimate of expected credit losses on our financial assets as at the balance sheet date.Judgment is required in making assumptions and estimations when calculating the ACL, including movements between the threestages, the inclusion of forward looking information and the application of expert credit judgment. The underlying assumptionsand estimates may result in changes to the provisions from period to period that significantly affect our results of operations.
106 Royal Bank of Canada: Annual Report 2020 Management’s Discussion and Analysis

For further information on allowance for credit losses, refer to Notes 2, 4 and 5 of our 2020 Annual Consolidated FinancialStatements.
Goodwill and other intangible assetsWe allocate goodwill to groups of cash-generating units (CGU). Goodwill is not amortized and is tested for impairment on anannual basis, or more frequently if there are objective indications of impairment. We test for impairment by comparing therecoverable amount of a CGU with its carrying amount.
We estimate the value in use and fair value less costs of disposal of our CGUs primarily using a discounted cash flow methodwhich incorporates each CGU’s internal forecasts of revenues and expenses. Significant management judgment is applied in thedetermination of expected future cash flows (uncertainty in timing and amount), discount rates (based on CGU-specific risks)and terminal growth rates. CGU-specific risks include country risk, business/operational risk, geographic risk (including politicalrisk, devaluation risk and government regulation), currency risk and price risk (including product pricing risk and inflation). If theforecast earnings and other assumptions in future periods deviate significantly from the current amounts used in our impairmenttesting, the value of our goodwill could become impaired.
We assess for indicators of impairment of our other intangible assets at each reporting period. If there is an indication thatan asset may be impaired, an impairment test is performed by comparing the carrying amount of the intangible asset to itsrecoverable amount. Where it is not possible to estimate the recoverable amount of an individual asset, we estimate therecoverable amount of the CGU to which the asset belongs. Significant judgment is applied in estimating the useful lives andrecoverable amounts of our intangible assets and assessing whether certain events or circumstances constitute objectiveevidence of impairment. We do not have any intangible assets with indefinite lives.
For further details, refer to Notes 2 and 10 of our 2020 Annual Consolidated Financial Statements.
Employee benefitsWe sponsor a number of benefit programs for eligible employees, including registered pension plans, supplemental pensionplans, health, dental, disability and life insurance plans.
The calculation of defined benefit expenses and obligations depends on various assumptions such as discount rates,healthcare cost trend rates, projected salary increases, retirement age, and mortality and termination rates. Discount rates aredetermined using a yield curve based on spot rates from high quality corporate bonds. All other assumptions are determined byus and are reviewed by the actuaries. Actual experience that differs from the actuarial assumptions will affect the amounts ofbenefit obligations and remeasurements that we recognize. The weighted average assumptions used and the sensitivity of keyassumptions are presented in Note 17 of our 2020 Annual Consolidated Financial Statements.
Consolidation of structured entitiesSubsidiaries are those entities, including structured entities, over which we have control. We control an entity when we areexposed, or have rights, to variable returns from our involvement with the entity and have the ability to affect those returnsthrough our power over the investee. We have power over an entity when we have existing rights that give us the current abilityto direct the activities that most significantly affect the entity’s returns (relevant activities). Power may be determined on thebasis of voting rights or, in the case of structured entities, other contractual arrangements.
We are not deemed to control an entity when we exercise power over an entity as the agent of a third party or parties. Indetermining whether we are acting as an agent, we consider the overall relationship between us, the investee and other partiesto the arrangement with respect to the following factors: (i) the scope of our decision-making power; (ii) the rights held by otherparties; (iii) the remuneration to which we are entitled; and (iv) our exposure to variability of returns.
The determination of control is based on the current facts and circumstances and is continuously assessed. In somecircumstances, different factors and conditions may indicate that various parties control an entity depending on whether thosefactors and conditions are assessed in isolation or in totality. Significant judgment is applied in determining whether we controlan entity, specifically, assessing whether we have substantive decision-making rights over the relevant activities and whether weare exercising our power as a principal or an agent.
We consolidate all subsidiaries from the date control is transferred to us, and cease consolidation when an entity is nolonger controlled by us. Our consolidation conclusions affect the classification and amount of assets, liabilities, revenues andexpenses reported in our Consolidated Financial Statements.
For further details, refer to Note 7 of our 2020 Annual Consolidated Financial Statements.
Derecognition of financial assetsWe periodically enter into transactions in which we transfer financial assets such as loans or mortgage-backed securities tostructured entities or trusts that issue securities to investors. We derecognize the assets when our contractual rights to the cashflows from the assets have expired; when we retain the rights to receive the cash flows but assume an obligation to pay those cashflows to a third party subject to certain pass-through requirements; or when we transfer our contractual rights to receive the cashflows and substantially all of the risks and rewards of the assets have been transferred. When we retain substantially all of therisks and rewards of the transferred assets, the transferred assets are not derecognized from our Consolidated Balance Sheetsand are accounted for as secured financing transactions. When we neither retain nor transfer substantially all risks and rewards ofownership of the assets, we derecognize the assets if control over the assets is relinquished. If we retain control over thetransferred assets, we continue to recognize the transferred assets to the extent of our continuing involvement. Management’sjudgment is applied in determining whether we have transferred or retained substantially all risk and rewards of ownership of thetransferred financial asset.
The majority of assets transferred under repurchase agreements, securities lending agreements, and in our Canadianresidential mortgage securitization transactions do not qualify for derecognition. As a result, we continue to record theassociated transferred assets on our Consolidated Balance Sheets and no gains or losses are recognized for those securitizationactivities. Otherwise, a gain or loss is recognized on securitization by comparing the carrying amount of the transferred assetwith its fair value at the date of the transfer. For further information on derecognition of financial assets, refer to Notes 2 and 6 ofour 2020 Annual Consolidated Financial Statements.
Management’s Discussion and Analysis Royal Bank of Canada: Annual Report 2020 107

Application of the effective interest methodInterest is recognized in Interest income and Interest expense in the Consolidated Statements of Income generally for all interestbearing financial instruments using the effective interest method. The effective interest rate is the rate that discounts estimatedfuture cash flows over the expected life of the financial asset or liability to the net carrying amount upon initial recognition.Significant judgment is applied in determining the effective interest rate due to uncertainty in the timing and amounts of futurecash flows.
ProvisionsProvisions are liabilities of uncertain timing or amount and are recognized when we have a present legal or constructiveobligation as a result of a past event, it is probable that an outflow of resources will be required to settle the obligation, and areliable estimate can be made of the amount of the obligation. Provisions are measured as the best estimate of the considerationrequired to settle the present obligation at the reporting date. Significant judgment is required in determining whether a presentobligation exists and in estimating the probability, timing and amount of any outflows. We record provisions related to litigation,asset retirement obligations and other items.
The forward-looking nature of these estimates requires us to use a significant amount of judgment in projecting the timingand amount of future cash flows. We record our provisions on the basis of all available information at the end of the reportingperiod and make adjustments on a quarterly basis to reflect current expectations. Should actual results differ from ourexpectations, we may incur expenses in excess of the provisions recognized.
Insurance claims and policy benefit liabilitiesInsurance claims and policy benefit liabilities represent current claims and estimates for future insurance policy benefits.Liabilities for life insurance contracts are determined using the Canadian Asset Liability Method, which incorporatesassumptions for mortality, morbidity, policy lapses and surrenders, investment yields, policy dividends, operating and policymaintenance expenses, and provisions for adverse deviation. Key assumptions are reviewed annually and updated in responseto actual experience and market conditions. Liabilities for property and casualty insurance represent estimated provisions forreported and unreported claims. Liabilities for life and property and casualty insurance are included in Insurance claims andpolicy benefit liabilities. Changes in Insurance claims and policy benefit liabilities are included in the Insurance policyholderbenefits, claims and acquisition expense in our Consolidated Statements of Income in the period in which the estimates change.Refer to Note 15 of our 2020 Annual Consolidated Financial Statements for further information.
Income taxesWe are subject to income tax laws in various jurisdictions where we operate, and the complex tax laws are potentially subject todifferent interpretations by us and the relevant taxation authority. Management’s judgment is applied in interpreting the relevanttax laws, in assessing the probability of acceptance of our tax positions by the relevant tax authorities and estimating theexpected timing and amount of the provision for current and deferred income taxes. A deferred tax asset or liability is determinedfor each temporary difference based on the tax rates that are expected to be in effect in the period that the asset is realized orthe liability is settled. Where the temporary differences will not reverse in the foreseeable future, no deferred tax amount isrecognized.
On a quarterly basis, we review whether it is probable that the benefits associated with our deferred tax assets will berealized, using both positive and negative evidence. Refer to Note 22 of our 2020 Annual Consolidated Financial Statements forfurther information.
Future changes in accounting policy and disclosure
Conceptual Framework for Financial Reporting (Conceptual Framework)In March 2018, the IASB issued its revised Conceptual Framework. This replaces the previous version of the ConceptualFramework issued in 2010. The revised Conceptual Framework will be effective on November 1, 2020. The Conceptual Frameworkis not a standard, and does not override the concepts or requirements in any standard. It may be used to develop consistentaccounting policies where there is no applicable standard in place. The revisions include a few new concepts, updated definitionsand recognition criteria for assets and liabilities and clarifies some important concepts. These amendments are not expected tohave a material impact on our Consolidated Financial Statements.
Interest Rate Benchmark ReformIn August 2020, the IASB issued Interest Rate Benchmark Reform – Phase 2, Amendments to IFRS 9, IAS 39, IFRS 7, IFRS 4 Insurancecontracts and IFRS 16 (Phase 2 Amendments). The Phase 2 Amendments address issues that arise upon replacing the existinginterest rate benchmark with the alternative interest rates and introduces additional disclosure requirements. The Phase 2Amendments provide two key reliefs:• Modifications made as a direct result of the Reform on an economically equivalent basis are reflected prospectively in the
effective interest rate rather than as an immediate gain or loss.• If qualifying criteria are met, hedging relationships that are directly impacted by the Reform would be able to continue hedge
accounting upon transition to alternative interest rates.The Phase 2 Amendments will be effective for us on November 1, 2021, with earlier adoption permitted. We are currently assessingthe impact of the adoption of the Phase 2 Amendments on our Consolidated Financial Statements.
To manage our transition to alternative interest rates, we have implemented a comprehensive enterprise-wide program andgovernance structure that addresses the key areas of impact including contract remediation, funding and liquidity planning, riskmanagement, financial reporting and valuation, systems, processes, client education and communication. Transition activitiesare focused on two broad streams of work: (i) developing new alternative risk-free rate linked products, and (ii) conversion ofexisting LIBOR based contracts to alternative risk-free rates. Our program timelines are ultimately dependent on broader marketacceptance of products that reference the new alternative risk-free rates and our clients’ readiness and ability to adopt thereplacement products. Significant matters that we continue to evaluate include client product offerings, short and long termfunding strategies, and our hedging programs. We are following the recommended target dates for cessation of LIBOR-basedproducts provided by our regulators.
108 Royal Bank of Canada: Annual Report 2020 Management’s Discussion and Analysis

IFRS 17 Insurance Contracts (IFRS 17)In May 2017, the IASB issued IFRS 17 to establish a comprehensive global insurance standard which provides guidance on therecognition, measurement, presentation and disclosures of insurance contracts. IFRS 17 requires entities to measure insurancecontract liabilities at their current fulfillment values using one of three approaches. In June 2020, the IASB issued amendments toIFRS 17, including deferral of the effective date by two years. This new standard will be effective for us on November 1, 2023 andwill be applied retrospectively with restatement of comparatives unless impracticable. We are currently assessing the impact ofadopting this standard and the amendments on our Consolidated Financial Statements.
Controls and procedures
Disclosure controls and proceduresOur disclosure controls and procedures are designed to provide reasonable assurance that information required to be disclosedby us in reports filed or submitted under Canadian and U.S. securities laws is recorded, processed, summarized and reportedwithin the time periods specified under those laws and include controls and procedures that are designed to ensure thatinformation is accumulated and communicated to management, including the President and Chief Executive Officer, and theChief Financial Officer, to allow timely decisions regarding required disclosure.
As of October 31, 2020, management evaluated, under the supervision of and with the participation of the President and ChiefExecutive Officer and the Chief Financial Officer, the effectiveness of our disclosure controls and procedures as defined underrules adopted by the U.S. SEC. Based on that evaluation, the President and Chief Executive Officer and the Chief Financial Officerconcluded that our disclosure controls and procedures were effective as of October 31, 2020.
Internal control over financial reportingManagement is responsible for establishing and maintaining adequate internal control over financial reporting. Internal controlover financial reporting is designed to provide reasonable assurance regarding the reliability of financial reporting and thepreparation of financial statements for external purposes in accordance with IFRS. However, because of its inherent limitations,internal control over financial reporting may not prevent or detect misstatements on a timely basis. See Management’s Report onInternal Control over Financial Reporting and the Report of Independent Registered Public Accounting Firm.
There were no changes in our internal control over financial reporting during the year ended October 31, 2020 that havematerially affected, or are reasonably likely to materially affect, our internal control over financial reporting.
Related party transactions
In the ordinary course of business, we provide normal banking services and operational services, and enter into othertransactions with associated and other related corporations, including our joint venture entities, on terms similar to thoseoffered to non-related parties. We grant loans to directors, officers and other employees at rates normally accorded to preferredclients. In addition, we offer deferred share and other plans to non-employee directors, executives and certain other keyemployees. For further information, refer to Notes 12 and 26 of our audited 2020 Annual Consolidated Financial Statements.
Supplementary information
Selected annual information Table 70
(Millions of Canadian dollars, except per share amounts) 2020 2019 2018
Total revenue $ 47,181 $ 46,002 $ 42,576Net income attributable to:
Shareholders 11,432 12,860 12,400Non-controlling interest 5 11 31
$ 11,437 $ 12,871 $ 12,431
Basic earnings per share $ 7.84 $ 8.78 $ 8.39Diluted earnings per share 7.82 8.75 8.36Dividends declared per common shares 4.29 4.07 3.77Total assets $1,624,548 $1,428,935 $1,334,734Deposits 1,011,885 886,005 836,197
Management’s Discussion and Analysis Royal Bank of Canada: Annual Report 2020 109

Net interest income on average assets and liabilities Table 71
Average balances Interest Average rate
(Millions of Canadian dollars, except for percentage amounts) (1) 2020 2019 2018 2020 2019 2018 2020 2019 2018
AssetsDeposits with other banks
Canada $ 13,891 $ 10,990 $ 10,300 $ 115 $ 231 $ 198 0.83% 2.10% 1.92%U.S. 36,008 25,392 27,522 160 505 429 0.44 1.99 1.56Other International 22,202 20,463 21,587 32 (53) (61) 0.14 (0.26) (0.28)
72,101 56,845 59,409 307 683 566 0.43 1.20 0.95
SecuritiesTrading 131,685 130,647 125,153 4,622 4,573 3,785 3.51 3.50 3.02Investment, net of applicable allowance 128,121 97,764 90,470 1,866 2,254 1,885 1.46 2.31 2.08
259,806 228,411 215,623 6,488 6,827 5,670 2.50 2.99 2.63
Asset purchased under reverse repurchaseagreements and securities borrowed 363,418 346,173 266,709 4,668 8,960 5,536 1.28 2.59 2.08
Loans (2)Canada
Retail 404,051 379,853 364,473 14,534 15,352 13,533 3.60 4.04 3.71Wholesale 93,238 89,503 77,985 4,179 4,988 3,682 4.48 5.57 4.72
497,289 469,356 442,458 18,713 20,340 17,215 3.76 4.33 3.89U.S. 111,931 96,492 79,695 3,034 3,099 3,008 2.71 3.21 3.77Other International 37,985 32,430 28,932 1,673 1,424 1,026 4.40 4.39 3.55
647,205 598,278 551,085 23,420 24,863 21,249 3.62 4.16 3.86
Total interest-earning assets 1,342,530 1,229,707 1,092,826 34,883 41,333 33,021 2.60 3.36 3.02Non-interest-bearing deposits with other banks 72,698 29,430 31,695 – – – – – –Customers’ liability under acceptances 18,572 17,447 16,015 – – – – – –Other assets 202,893 159,599 154,395 – – – – – –
Total assets $1,636,700 $ 1,436,200 $ 1,294,900 $ 34,883 $ 41,333 $ 33,021 2.13% 2.88% 2.55%
Liabilities and shareholders’ equityDeposits (3)
Canada $ 612,675 $ 555,467 $ 513,240 $ 7,378 $ 10,420 $ 7,718 1.20% 1.88% 1.50%U.S. 105,892 97,563 98,651 658 1,524 1,313 0.62 1.56 1.33Other International 93,597 83,349 77,414 747 1,044 811 0.80 1.25 1.05
812,164 736,379 689,305 8,783 12,988 9,842 1.08 1.76 1.43
Obligations related to securities sold short 35,937 34,799 32,642 2,200 1,995 1,627 6.12 5.73 4.98Obligations related to assets sold under repurchase
agreements and securities loaned 308,723 262,929 184,934 2,622 6,147 3,261 0.85 2.34 1.76Subordinated debentures 9,518 9,405 9,131 280 365 322 2.94 3.88 3.53Other interest-bearing liabilities 24,957 16,496 15,352 163 89 17 0.65 0.54 0.11
Total interest-bearing liabilities 1,191,299 1,060,008 931,364 14,048 21,584 15,069 1.18 2.04 1.62Non-interest-bearing deposits 158,468 133,702 129,696 – – – – – –Acceptances 18,646 17,473 16,030 – – – – – –Other liabilities 183,355 143,948 142,122 – – – – – –
Total liabilities $1,551,768 $ 1,355,131 $ 1,219,212 $ 14,048 $ 21,584 $ 15,069 0.91% 1.59% 1.24%
Equity $ 84,925 $ 81,052 $ 75,720 n.a. n.a. n.a. n.a. n.a. n.a.
Total liabilities and shareholders’ equity $1,636,700 $ 1,436,200 $ 1,294,900 $ 14,048 $ 21,584 $ 15,069 0.86% 1.50% 1.16%
Net interest income and margin $1,636,700 $ 1,436,200 $ 1,294,900 $ 20,835 $ 19,749 $ 17,952 1.27% 1.38% 1.39%
Net interest income and margin (average earningassets, net)Canada $ 779,433 $ 700,153 $ 637,214 $ 14,185 $ 14,375 $ 13,076 1.82% 2.05% 2.05%U.S. 356,916 329,655 275,895 4,959 4,058 3,616 1.39 1.23 1.31Other International 206,183 199,898 179,717 1,691 1,316 1,260 0.82 0.66 0.70
Total $1,342,532 $ 1,229,706 $ 1,092,826 $ 20,835 $ 19,749 $ 17,952 1.55% 1.61% 1.64%
(1) Insurance segment assets and liabilities are included in Other assets and Other liabilities, respectively.(2) Interest income includes loan fees of $797 million (2019 – $672 million; 2018 – $621 million).(3) Deposits include personal chequing and savings deposits with average balances of $218 billion (2019 – $189 billion; 2018 – $182 billion), interest expense of $0.5 billion
(2019 – $1.1 billion; 2018 – $0.8 billion) and average rates of 0.2% (2019 – 0.6%; 2018 – 0.4%). Deposits also include term deposits with average balances of $443 billion (2019– $421 billion; 2018 – $389 billion), interest expense of $6.8 billion (2019 – $9.2 billion; 2018 – $7.4 billion) and average rates of 1.53% (2019 – 2.19%; 2018 – 1.89%).
n.a. not applicable
110 Royal Bank of Canada: Annual Report 2020 Management’s Discussion and Analysis
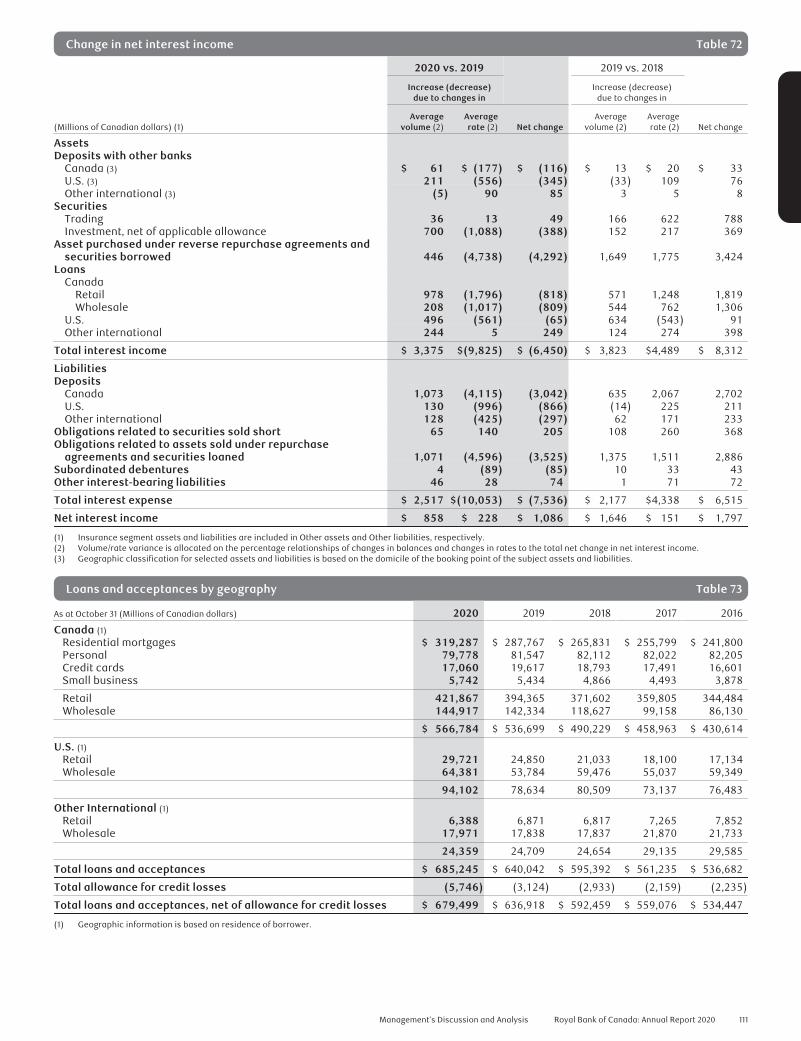
Change in net interest income Table 72
2020 vs. 2019 2019 vs. 2018
Increase (decrease)due to changes in
Increase (decrease)due to changes in
(Millions of Canadian dollars) (1)Average
volume (2)Averagerate (2) Net change
Averagevolume (2)
Averagerate (2) Net change
AssetsDeposits with other banks
Canada (3) $ 61 $ (177) $ (116) $ 13 $ 20 $ 33U.S. (3) 211 (556) (345) (33) 109 76Other international (3) (5) 90 85 3 5 8
SecuritiesTrading 36 13 49 166 622 788Investment, net of applicable allowance 700 (1,088) (388) 152 217 369
Asset purchased under reverse repurchase agreements andsecurities borrowed 446 (4,738) (4,292) 1,649 1,775 3,424
LoansCanada
Retail 978 (1,796) (818) 571 1,248 1,819Wholesale 208 (1,017) (809) 544 762 1,306
U.S. 496 (561) (65) 634 (543) 91Other international 244 5 249 124 274 398
Total interest income $ 3,375 $(9,825) $ (6,450) $ 3,823 $4,489 $ 8,312
LiabilitiesDeposits
Canada 1,073 (4,115) (3,042) 635 2,067 2,702U.S. 130 (996) (866) (14) 225 211Other international 128 (425) (297) 62 171 233
Obligations related to securities sold short 65 140 205 108 260 368Obligations related to assets sold under repurchase
agreements and securities loaned 1,071 (4,596) (3,525) 1,375 1,511 2,886Subordinated debentures 4 (89) (85) 10 33 43Other interest-bearing liabilities 46 28 74 1 71 72
Total interest expense $ 2,517 $(10,053) $ (7,536) $ 2,177 $4,338 $ 6,515
Net interest income $ 858 $ 228 $ 1,086 $ 1,646 $ 151 $ 1,797
(1) Insurance segment assets and liabilities are included in Other assets and Other liabilities, respectively.(2) Volume/rate variance is allocated on the percentage relationships of changes in balances and changes in rates to the total net change in net interest income.(3) Geographic classification for selected assets and liabilities is based on the domicile of the booking point of the subject assets and liabilities.
Loans and acceptances by geography Table 73
As at October 31 (Millions of Canadian dollars) 2020 2019 2018 2017 2016
Canada (1)Residential mortgages $ 319,287 $ 287,767 $ 265,831 $ 255,799 $ 241,800Personal 79,778 81,547 82,112 82,022 82,205Credit cards 17,060 19,617 18,793 17,491 16,601Small business 5,742 5,434 4,866 4,493 3,878
Retail 421,867 394,365 371,602 359,805 344,484Wholesale 144,917 142,334 118,627 99,158 86,130
$ 566,784 $ 536,699 $ 490,229 $ 458,963 $ 430,614
U.S. (1)Retail 29,721 24,850 21,033 18,100 17,134Wholesale 64,381 53,784 59,476 55,037 59,349
94,102 78,634 80,509 73,137 76,483
Other International (1)Retail 6,388 6,871 6,817 7,265 7,852Wholesale 17,971 17,838 17,837 21,870 21,733
24,359 24,709 24,654 29,135 29,585
Total loans and acceptances $ 685,245 $ 640,042 $ 595,392 $ 561,235 $ 536,682
Total allowance for credit losses (5,746) (3,124) (2,933) (2,159) (2,235)
Total loans and acceptances, net of allowance for credit losses $ 679,499 $ 636,918 $ 592,459 $ 559,076 $ 534,447
(1) Geographic information is based on residence of borrower.
Management’s Discussion and Analysis Royal Bank of Canada: Annual Report 2020 111

Loans and acceptances by portfolio and sector Table 74
As at October 31 (Millions of Canadian dollars) 2020 2019 2018 2017 2016
Residential mortgages $ 342,597 $ 308,091 $ 282,471 $ 270,348 $ 254,998Personal 92,011 92,250 92,700 92,294 93,466Credit cards 17,626 20,311 19,415 18,035 17,128Small business 5,742 5,434 4,866 4,493 3,878
Retail $ 457,976 $ 426,086 $ 399,452 $ 385,170 $ 369,470
Agriculture 9,862 9,369 8,325 7,397 6,538Automotive 8,535 9,788 8,761 8,319 7,293Banking 1,453 2,005 1,826 1,163 1,536Consumer discretionary 16,523 16,741 15,453 14,428 13,543Consumer staples 6,116 5,290 4,497 4,581 5,024Oil & gas 7,593 8,145 6,061 5,599 5,346Financial services 28,120 24,961 21,350 15,448 10,139Financing products 5,828 6,368 5,569 4,475 7,255Forest products 1,173 1,486 1,101 913 1,100Governments 4,365 4,252 4,103 9,624 8,538Industrial products 6,955 7,388 7,607 5,674 5,722Information technology 4,830 4,606 4,635 4,086 5,235Investments 15,599 14,657 8,987 8,867 7,221Mining & metals 1,070 1,179 1,301 1,114 1,456Public works & infrastructure 1,415 1,717 1,853 1,586 1,626Real estate & related 62,721 54,032 49,889 44,759 38,164Other services 23,062 21,373 18,467 16,492 17,092Telecommunication & media 5,059 4,757 7,018 4,867 5,765Transportation 7,644 5,426 5,347 5,223 5,110Utilities 7,955 8,826 8,239 6,870 8,752Other sectors 1,391 1,590 5,551 4,580 4,757
Wholesale $ 227,269 $ 213,956 $ 195,940 $ 176,065 $ 167,212
Total loans and acceptances $ 685,245 $ 640,042 $ 595,392 $ 561,235 $ 536,682
Total allowance for credit losses (5,746) (3,124) (2,933) (2,159) (2,235)
Total loans and acceptances, net of allowance forcredit losses $ 679,499 $ 636,918 $ 592,459 $ 559,076 $ 534,447
112 Royal Bank of Canada: Annual Report 2020 Management’s Discussion and Analysis

Gross impaired loans by portfolio and geography Table 75
As at October 31 (Millions of Canadian dollars, except for percentage amounts) 2020 2019 2018 2017 2016Residential mortgages $ 638 $ 732 $ 725 $ 634 $ 709Personal 212 306 302 276 304Small business 90 57 44 38 46
Retail 940 1,095 1,071 948 1,059
Agriculture $ 70 $ 37 $ 29 $ 28 $ 37Automotive 79 28 7 29 43Banking 4 10 18 26 2Consumer discretionary 281 171 138 77 181Consumer staples 112 51 23 55 36Oil & gas 552 509 230 318 1,263Financial services 81 81 80 113 114Financing products - – – – –Forest products 13 35 9 7 21Governments 7 5 15 8 2Industrial products 57 92 42 34 43Information technology 14 16 2 70 66Investments 47 7 8 25 70Mining & metals 30 1 2 3 15Public works & infrastructure 8 12 3 4 16Real estate & related 395 408 290 340 225Other services 251 134 73 158 97Telecommunication & media 6 12 8 12 27Transportation 148 13 58 7 31Utilities 46 211 8 10 79Other sectors 45 35 48 48 58
Wholesale 2,246 1,868 1,091 1,372 2,426
Acquired credit-impaired loans 9 13 21 256 418
Total GIL (1), (2) $ 3,195 $ 2,976 $ 2,183 $ 2,576 $ 3,903
Canada (3)Residential mortgages $ 425 $ 481 $ 431 $ 323 $ 368Personal 177 250 248 198 228Small business 90 57 44 38 46
Retail 692 788 723 559 642
Agriculture 69 36 29 22 27Automotive 20 18 5 4 9Banking 4 10 18 26 –Consumer discretionary 117 71 62 54 105Consumer staples 34 24 10 10 14Oil & gas 90 97 38 16 56Financial services - – 1 3 –Financing products - – – – –Forest products 13 9 9 7 21Governments 2 5 11 2 2Industrial products 54 48 31 25 40Information technology 3 4 1 2 4Investments - 2 – 1 3Mining & metals 4 1 2 3 12Public works & infrastructure 7 10 3 4 16Real estate & related 233 195 134 182 105Other services 85 65 24 47 58Telecommunication & media 4 11 7 10 24Transportation 15 13 11 7 10Utilities – 59 – 1 16Other sectors – – – – –
Wholesale 754 678 396 426 522
Total $ 1,446 $ 1,466 $ 1,119 $ 985 $ 1,164
U.S. (3)Retail $ 32 $ 36 $ 23 $ 59 $ 56Wholesale 1,039 869 401 736 1,736
Total $ 1,071 $ 905 $ 424 $ 795 $ 1,792
Other International (3)Retail $ 216 $ 272 $ 327 $ 345 $ 380Wholesale 462 333 313 451 567
Total $ 678 $ 605 $ 640 $ 796 $ 947
Total GIL (1), (2) $ 3,195 $ 2,976 $ 2,183 $ 2,576 $ 3,903
Allowance on impaired loans (4) (949) (832) (700) (737) (809)
Net impaired loans $ 2,246 $ 2,144 $ 1,483 $ 1,839 $ 3,094
GIL as a % of loans and acceptancesResidential mortgages 0.19% 0.24% 0.26% 0.23% 0.28%Personal 0.23% 0.33% 0.33% 0.30% 0.33%Small business 1.56% 1.05% 0.90% 0.85% 1.19%
Retail 0.21% 0.26% 0.27% 0.25% 0.29%Wholesale 0.99% 0.88% 0.57% 0.92% 1.69%
Total 0.47% 0.46% 0.37% 0.46% 0.73%
Allowance on impaired loans as a % of GIL (4) 29.71% 27.96% 32.08% 28.61% 20.72%
(1) Effective November 1, 2017, the definition of gross impaired loans has been shortened for certain products to align with a definition of default of 90 days past due underIFRS 9. Past due loans greater than 90 days not included in impaired loans were $142 million in 2020 (2019 – $189 million; 2018 – $179 million; 2017 – $307 million; 2016 –$337 million). For further details, refer to Note 5 of our 2020 Annual Consolidated Financial Statements.
(2) Effective November 1, 2017, GIL excludes $229 million of acquired credit impaired loans related to our acquisition of City National that have returned to performing status.(3) Geographic information is based on residence of borrower.(4) Effective November 1, 2017, represents Stage 3 ACL on loans, acceptances, and commitments under IFRS 9 and Allowances for impaired loans under IAS 39.
Management’s Discussion and Analysis Royal Bank of Canada: Annual Report 2020 113

Provision for credit losses by portfolio and geography Table 76
For the year ended October 31 (Millions of Canadian dollars, except for percentage amounts) 2020 2019 2018 2017 2016Residential mortgages $ 28 $ 51 $ 51 $ 56 $ 77Personal 376 487 462 409 458Credit cards 484 518 468 435 442Small business 49 36 30 32 34
Retail 937 1,092 1,011 932 1,011
Agriculture $ 14 $ 8 $ 1 $ 4 $ 10Automotive 28 10 5 14 13Banking – – (1) 3 (3)Consumer discretionary 98 61 81 12 20Consumer staples 28 33 1 6 10Oil & gas 305 98 1 (28) 320Financial services 4 – – (18) 1Financing products – – – – –Forest products 2 9 3 3 3Governments (2) 6 4 1 –Industrial products 31 104 8 11 10Information technology (7) 30 (21) 4 7Investments 7 – 3 – 1Mining & metals 9 – – (4) 6Public works & infrastructure (9) 57 2 1 3Real estate & related 54 57 13 120 34Other services 89 35 22 20 (1)Telecommunication & media (3) 7 – 8 1Transportation 8 9 32 1 (6)Utilities 2 70 1 5 16Other sectors 5 5 (8) 53 30
Wholesale 663 599 147 216 475
Acquired credit-impaired loans – – 2 2 10
Total PCL on impaired loans (1) $ 1,600 $ 1,691 $ 1,160 $ 1,150 $ 1,496
Canada (2)Residential mortgages $ 35 $ 32 $ 44 $ 33 $ 42Personal 395 488 458 413 459Credit cards 471 505 456 426 435Small business 49 36 30 32 34
Retail 950 1,061 988 904 970
Agriculture 10 8 1 2 10Automotive 17 4 1 1 3Banking - – (1) 3 –Consumer discretionary 45 24 28 20 27Consumer staples 8 14 2 3 5Oil & gas 33 34 4 (17) 99Financial services 1 – – – –Financing products - – – – –Forest products 2 5 3 3 4Governments (3) 4 1 1 1Industrial products 12 27 6 8 8Information technology (2) 28 1 1 2Investments (2) – – – 1Mining & metals - – – 1 5Public works & infrastructure 1 45 1 1 3Real estate & related 24 53 14 43 23Other services 25 29 17 15 18Telecommunication & media (4) 5 – 9 1Transportation (6) 9 2 2 3Utilities 1 2 – – –Other sectors 1 1 – (1) –
Wholesale 163 292 80 95 213
Total $ 1,113 $ 1,353 $ 1,068 $ 999 $ 1,183
U.S. (2)Retail $ 5 $ 12 $ 4 $ 3 $ 1Wholesale 377 223 64 117 227
Total $ 382 $ 235 $ 68 $ 120 $ 228
Other International (2)Retail $ (18) $ 19 $ 19 $ 25 $ 41Wholesale 123 84 5 6 44
Total $ 105 $ 103 $ 24 $ 31 $ 85
Total PCL on impaired loans (1) $ 1,600 $ 1,691 $ 1,160 $ 1,150 $ 1,496
Total PCL on performing loans (3) 2,631 200 123 – 50
Total PCL on other financial assets 120 (27) 24
Total PCL $ 4,351 $ 1,864 $ 1,307 $ 1,150 $ 1,546
PCL on loans as a % of average net loans and acceptances 0.63% 0.31% 0.23% 0.21% 0.29%
PCL on impaired loans as a % of average net loans and acceptances (1) 0.24% 0.27% 0.20% 0.21% 0.28%
(1) Effective November 1, 2017, represents Stage 3 PCL under IFRS 9 and PCL on impaired loans under IAS 39.(2) Geographic information is based on residence of borrower.(3) Effective November 1, 2017, represents Stage 1 and 2 PCL on loans, acceptances, and commitments under IFRS 9 and PCL for loans not yet identified as impaired under IAS 39.
114 Royal Bank of Canada: Annual Report 2020 Management’s Discussion and Analysis

Allowance on loans by portfolio and geography (1) Table 77
As at and for the year ended October 31 (Millions of Canadian dollars, except percentage amounts) 2020 2019 2018 2017 2016Allowance on loans at beginning of year $ 3,419 $ 3,088 $ 2,976 $ 2,326 $ 2,120PCL 4,231 1,891 1,283 1,150 1,546Write-offs by portfolio
Residential mortgages (44) (45) (51) (53) (42)Personal (545) (600) (552) (543) (556)Credit cards (617) (655) (599) (565) (564)Small business (38) (36) (35) (38) (40)
Retail $ (1,244) $ (1,336) $ (1,237) $ (1,199) $ (1,202)
Wholesale $ (437) $ (440) $ (207) $ (226) $ (321)
Total write-offs by portfolio $ (1,681) $ (1,776) $ (1,444) $ (1,425) $ (1,523)
Recoveries by portfolioResidential mortgages $ 10 $ 8 $ 8 $ 8 $ 5Personal 134 126 121 116 111Credit cards 133 137 131 131 122Small business 7 8 7 9 10
Retail $ 284 $ 279 $ 267 $ 264 $ 248
Wholesale $ 57 $ 43 $ 65 $ 66 $ 38
Total recoveries by portfolio $ 341 $ 322 $ 332 $ 330 $ 286
Net write-offs $ (1,340) $ (1,454) $ (1,112) $ (1,095) $ (1,237)Exchange rate and other (195) (106) (59) (131) (103)
Total allowance on loans at end of year $ 6,115 $ 3,419 $ 3,088 $ 2,250 $ 2,326
Allowance against impaired loans (2)Canada (3)
Residential mortgages $ 53 $ 50 $ 43 $ 31 $ 35Personal 78 115 107 91 105Small business 33 22 18 19 20
Retail $ 164 $ 187 $ 168 $ 141 $ 160
Agriculture $ 10 $ 6 $ 4 $ 5 $ 6Automotive 12 3 4 4 4Banking – – 1 2 –Consumer discretionary 35 11 22 18 20Consumer staples 7 2 3 2 4Oil & gas 49 29 4 4 7Financial services – – – 1 –Financing products – – – – –Forest products 9 7 3 3 5Governments 2 5 1 1 1Industrial products 15 11 8 9 10Information technology 1 3 – 1 1Investments – 2 – – 1Mining & metals 1 1 – 3 3Public works & infrastructure 2 1 1 1 2Real estate & related 36 35 28 47 29Other services 39 34 7 17 19Telecommunication & media – 11 3 4 4Transportation 2 10 3 2 3Utilities – 1 – – –Other sectors – – – – –
Wholesale $ 220 $ 172 $ 92 $ 124 $ 119
Total $ 384 $ 359 $ 260 $ 265 $ 279
U.S. (3)Retail $ 1 $ 1 $ 1 $ 1 $ 2Wholesale 267 141 164 150 177
Total $ 268 $ 142 $ 165 $ 151 $ 179
Other International (3)Retail $ 116 $ 156 $ 166 $ 168 $ 180Wholesale 181 175 109 153 171
Total $ 297 $ 331 $ 275 $ 321 $ 351
Total allowance on impaired loans (2) $ 949 $ 832 $ 700 $ 737 $ 809
Allowance on performing loans (4)Residential mortgages $ 366 $ 223 $ 206 $ 128 $ 96Personal 1,213 792 754 391 385Credit cards 1,246 832 760 379 386Small business 107 39 33 37 45
Retail $ 2,932 $ 1,886 $ 1,753 $ 935 $ 912
Wholesale $ 2,234 $ 701 $ 635 $ 487 $ 514
Off-balance sheet and other items $ 91 $ 91
Total allowance on performing loans (4) $ 5,166 $ 2,587 $ 2,388 $ 1,513 $ 1,517
Total allowance on loans $ 6,115 $ 3,419 $ 3,088 $ 2,250 $ 2,326
Key ratiosAllowance on loans as a % of loans and acceptances 0.89% 0.53% 0.52% 0.40% 0.43%Net write-offs as a % of average net loans and acceptances 0.20% 0.24% 0.20% 0.20% 0.23%
(1) Includes loans, acceptances, and commitments.(2) Effective November 1, 2017, represents Stage 3 ACL on loans, acceptances and commitments under IFRS 9 and Allowance for impaired loans under IAS 39.(3) Geographic information is based on residence of borrower.(4) Effective November 1, 2017, represents Stage 1 and Stage 2 ACL on loans, acceptances and commitments under IFRS 9 and Allowance for loans not yet identified as
impaired under IAS 39.
Management’s Discussion and Analysis Royal Bank of Canada: Annual Report 2020 115

Credit quality information by Canadian province (1) Table 78
(Millions of Canadian dollars) 2020 2019 2018 2017 2016
Loans and acceptancesAtlantic provinces (2) $ 27,615 $ 27,008 $ 25,305 $ 24,471 $ 23,947Quebec 64,534 62,734 58,067 56,749 53,518Ontario 279,276 257,009 225,606 202,272 185,434Alberta 71,175 71,165 69,497 68,051 66,277Other Prairie provinces (3) 33,758 33,278 32,101 31,318 30,143B.C. and territories (4) 90,426 85,505 79,653 76,102 71,295
Total loans and acceptances in Canada $ 566,784 $ 536,699 $ 490,229 $ 458,963 $ 430,614
Gross impaired loans (5)
Atlantic provinces (2) $ 111 $ 94 $ 89 $ 77 $ 101Quebec 271 250 185 176 207Ontario 393 290 227 213 336Alberta 386 448 335 284 313Other Prairie provinces (3) 178 215 176 125 93B.C. and territories (4) 107 169 107 110 114
Total GIL in Canada $ 1,446 $ 1,466 $ 1,119 $ 985 $ 1,164
PCL on impaired loans (6)
Atlantic provinces (2) $ 43 $ 73 $ 59 $ 66 $ 67Quebec 95 104 94 85 92Ontario 710 844 678 617 654Alberta 151 175 116 112 226Other Prairie provinces (3) 60 85 68 64 64B.C. and territories (4) 54 72 53 55 80
Total PCL on impaired loans in Canada $ 1,113 $ 1,353 $ 1,068 $ 999 $ 1,183
(1) Geographic information is based on residence of borrower.(2) Comprises Newfoundland and Labrador, Prince Edward Island, Nova Scotia and New Brunswick.(3) Comprises Manitoba and Saskatchewan.(4) Comprises British Columbia, Nunavut, Northwest Territories and Yukon.(5) Effective November 1, 2017, the definition of gross impaired loans has been shortened for certain products to align with a definition of default of 90 days past due under
IFRS 9.(6) Effective November 1, 2017, represents Stage 3 PCL under IFRS 9 and PCL on impaired loans under IAS 39.
116 Royal Bank of Canada: Annual Report 2020 Management’s Discussion and Analysis

EDTF recommendations index
We aim to present transparent, high-quality risk disclosures by providing disclosures in this 2020 Annual Report andSupplementary Financial Information package (SFI), and Pillar 3 Report, in accordance with recommendations from the FSB’sEnhanced Disclosure Task Force (EDTF). Information within the SFI and Pillar 3 Report is not and should not be consideredincorporated by reference into this 2020 Annual Report.
The following index summarizes our disclosure by EDTF recommendation:
Location of disclosure
Type of Risk Recommendation Disclosure Annual Report page SFI page
General
1 Table of contents for EDTF risk disclosure 117 12 Define risk terminology and measures 56-61, 222-223 –3 Top and emerging risks 53-55 –4 New regulatory ratios 96-101 –
Risk governance,risk managementand businessmodel
5 Risk management organization 56-61 –6 Risk culture 57-61 –7 Risk in the context of our business activities 104 –8 Stress testing 58-59, 73 –
Capital adequacyand risk-weightedassets (RWA)
9 Minimum Basel III capital ratios andDomestic systemically importantbank surcharge
97-101 –
10 Composition of capital and reconciliation ofthe accounting balance sheet to theregulatory balance sheet
– *
11 Flow statement of the movements inregulatory capital
– 20
12 Capital strategic planning 96-101 –13 RWA by business segments – 2114 Analysis of capital requirement, and related
measurement model information62-65 *
15 RWA credit risk and related riskmeasurements
– *
16 Movement of risk-weighted assets byrisk type
– 21
17 Basel back-testing 58, 62 33
Liquidity 18 Quantitative and qualitative analysis of ourliquidity reserve
80-81, 85-86 –
Funding
19 Encumbered and unencumbered assets bybalance sheet category, and contractualobligations for rating downgrades
81, 84 –
20 Maturity analysis of consolidated totalassets, liabilities and off-balance sheetcommitments analyzed by remainingcontractual maturity at the balancesheet date
86-87 –
21 Sources of funding and funding strategy 81-83 –
Market risk
22 Relationship between the market riskmeasures for trading and non-tradingportfolios and the balance sheet
77-78 –
23 Decomposition of market risk factors 73-76 –24 Market risk validation and back-testing 73 –25 Primary risk management techniques
beyond reported risk measuresand parameters
73-76 –
Credit risk
26 Bank’s credit risk profile 61-72, 165-172 22-33,*Quantitative summary of aggregate credit
risk exposures that reconciles to thebalance sheet
111-116 *
27 Policies for identifying impaired loans 63-65, 106-107, 136-139 –28 Reconciliation of the opening and closing
balances of impaired loans andimpairment allowances during the year
– 24, 29
29 Quantification of gross notional exposurefor OTC derivatives or exchange-traded derivatives
66 35
30 Credit risk mitigation, including collateralheld for all sources of credit risk
64-65 32
Other 31 Other risk types 89-96 –32 Publicly known risk events 92-93, 210-211 –
* These disclosure requirements are satisfied or partially satisfied by disclosures provided in our Pillar 3 Report for the year ended October 31, 2020 and October 31, 2019.
Index for Enhanced Disclosure Task Force recommendations Royal Bank of Canada: Annual Report 2020 117

REPORTS AND CONSOLIDATED FINANCIAL STATEMENTS
Reports
119 Management’s Responsibility for Financial Reporting
119 Management’s Report on Internal Control overFinancial Reporting
120 Independent Auditor’s Report
124 Report of Independent Registered Public AccountingFirm
Consolidated Financial Statements
127 Consolidated Balance Sheets
128 Consolidated Statements of Income
129 Consolidated Statements of Comprehensive Income
130 Consolidated Statements of Changes in Equity
131 Consolidated Statements of Cash Flows
Notes to Consolidated Financial Statements
132 Note 1 General information
132 Note 2 Summary of significant accountingpolicies, estimates and judgments
148 Note 3 Fair value of financial instruments
161 Note 4 Securities
165 Note 5 Loans and allowance for credit losses
172 Note 6 Derecognition of financial assets
173 Note 7 Structured entities
177 Note 8 Derivative financial instruments andhedging activities
187 Note 9 Premises and equipment
188 Note 10 Goodwill and other intangible assets
190 Note 11 Significant dispositions
190 Note 12 Joint ventures and associated companies
191 Note 13 Other assets
191 Note 14 Deposits
192 Note 15 Insurance
194 Note 16 Segregated funds
195 Note 17 Employee benefits – Pension and otherpost-employment benefits
199 Note 18 Other liabilities
200 Note 19 Subordinated debentures
200 Note 20 Equity
203 Note 21 Share-based compensation
205 Note 22 Income taxes
207 Note 23 Earnings per share
208 Note 24 Guarantees, commitments, pledgedassets and contingencies
210 Note 25 Legal and regulatory matters
211 Note 26 Related party transactions
212 Note 27 Results by business
214 Note 28 Nature and extent of risks arising fromfinancial instruments segment
215 Note 29 Capital management
216 Note 30 Offsetting financial assets and financialliabilities
218 Note 31 Recovery and settlement of on-balancesheet assets and liabilities
219 Note 32 Parent company information
220 Note 33 Subsequent events
118 Royal Bank of Canada: Annual Report 2020 Consolidated Financial Statements

Management’s Responsibility for Financial Reporting
The accompanying consolidated financial statements of Royal Bank of Canada were prepared by management, which is responsiblefor the integrity and fairness of the information presented, including the many amounts that must of necessity be based onestimates and judgments. These consolidated financial statements were prepared in accordance with the Bank Act (Canada) andInternational Financial Reporting Standards as issued by the International Accounting Standards Board. Financial informationappearing throughout our Management’s Discussion and Analysis is consistent with these consolidated financial statements.
Our internal controls are designed to provide reasonable assurance that transactions are authorized, assets aresafeguarded and proper records are maintained. These controls include quality standards in hiring and training of employees,policies and procedures manuals, a corporate code of conduct and accountability for performance within appropriate and well-defined areas of responsibility.
The system of internal controls is further supported by a compliance function, which is designed to ensure that we and ouremployees comply with securities legislation and conflict of interest rules, and by an internal audit staff, which conducts periodicaudits of all aspects of our operations.
The Board of Directors oversees management’s responsibilities for financial reporting through an Audit Committee, which iscomposed entirely of independent directors. This Committee reviews our consolidated financial statements and recommendsthem to the Board for approval. Other key responsibilities of the Audit Committee include reviewing our existing internal controlprocedures and planned revisions to those procedures, and advising the directors on auditing matters and financial reportingissues. Our Chief Compliance Officer and Chief Internal Auditor have full and unrestricted access to the Audit Committee.
The Office of the Superintendent of Financial Institutions Canada (OSFI) examines and inquires into our business and affairsas deemed necessary to determine whether the provisions of the Bank Act are being complied with, and that we are in soundfinancial condition. In carrying out its mandate, OSFI strives to protect the rights and interests of our depositors and creditors.
PricewaterhouseCoopers LLP, Independent Registered Public Accounting Firm appointed by our shareholders upon therecommendation of the Audit Committee and Board, has performed an independent audit of the consolidated financial statementsin accordance with Canadian generally accepted auditing standards and the standards of the Public Company AccountingOversight Board as stated in their Independent Auditor’s Report and Report of Independent Registered Public Accounting Firm,respectively. The auditors have full and unrestricted access to the Audit Committee to discuss their audit and related findings.
David I. McKayPresident and Chief Executive Officer
Rod BolgerChief Financial Officer
Toronto, December 1, 2020
Management’s Report on Internal Control over Financial Reporting
Management of Royal Bank of Canada is responsible for establishing and maintaining adequate internal control over financialreporting. Internal control over financial reporting is a process designed by, or under the supervision of, the President and ChiefExecutive Officer and Chief Financial Officer and effected by the Board of Directors, management and other personnel to providereasonable assurance regarding the reliability of financial reporting and the preparation of financial statements for externalpurposes in accordance with International Financial Reporting Standards as issued by the International Accounting StandardsBoard. It includes those policies and procedures that:
• Pertain to the maintenance of records that, in reasonable detail, accurately and fairly reflect the transactions related to anddispositions of our assets;
• Provide reasonable assurance that transactions are recorded as necessary to permit preparation of financial statements inaccordance with generally accepted accounting principles, and our receipts and expenditures are made only in accordancewith authorizations of our management and directors; and
• Provide reasonable assurance regarding prevention or timely detection of unauthorized acquisition, use, or disposition of ourassets that could have a material effect on our financial statements.
Due to its inherent limitations, internal control over financial reporting may not prevent or detect misstatements on a timelybasis. Also, projections of any evaluation of the effectiveness of internal control over financial reporting to future periods aresubject to the risk that the controls may become inadequate because of changes in conditions, or that the degree of compliancewith the policies or procedures may deteriorate.
Management evaluated, under the supervision of and with the participation of the President and Chief Executive Officer andChief Financial Officer, the effectiveness of our internal control over financial reporting as of October 31, 2020, based on thecriteria set forth in Internal Control – Integrated Framework (2013) issued by the Committee of Sponsoring Organizations of theTreadway Commission. Based on that evaluation, management concluded that, as of October 31, 2020, internal control overfinancial reporting was effective based on the criteria established in the Internal Control – Integrated Framework (2013).
The effectiveness of our internal control over financial reporting as of October 31, 2020, has been audited byPricewaterhouseCoopers LLP, Independent Registered Public Accounting Firm, as stated in their Report of IndependentRegistered Public Accounting Firm, which appears herein.
David I. McKayPresident and Chief Executive Officer
Rod BolgerChief Financial Officer
Toronto, December 1, 2020
Consolidated Financial Statements Royal Bank of Canada: Annual Report 2020 119

Independent Auditor’s Report
To the Shareholders and Board of Directors of Royal Bank of Canada
Our opinionIn our opinion, the accompanying consolidated financial statements present fairly, in all material respects, the financial positionof Royal Bank of Canada and its subsidiaries (together, the Bank) as at October 31, 2020 and 2019, and its financial performanceand its cash flows for the years then ended in accordance with International Financial Reporting Standards as issued by theInternational Accounting Standards Board (IFRS).
What we have auditedThe Bank’s consolidated financial statements comprise:• the consolidated balance sheets as at October 31, 2020 and 2019;• the consolidated statements of income for the years then ended;• the consolidated statements of comprehensive income for the years then ended;• the consolidated statements of changes in equity for the years then ended;• the consolidated statements of cash flows for the years then ended; and• the notes to the consolidated financial statements, which include significant accounting policies and other explanatory
information.
Certain required disclosures have been presented elsewhere in the Management’s Discussion and Analysis, rather than in thenotes to the consolidated financial statements. These disclosures are cross-referenced from the consolidated financialstatements and are identified as audited.
Basis for opinionWe conducted our audit in accordance with Canadian generally accepted auditing standards. Our responsibilities under thosestandards are further described in the Auditor’s responsibilities for the audit of the consolidated financial statements section ofour report.
We believe that the audit evidence we have obtained is sufficient and appropriate to provide a basis for our opinion.
IndependenceWe are independent of the Bank in accordance with the ethical requirements that are relevant to our audit of the consolidatedfinancial statements in Canada. We have fulfilled our other ethical responsibilities in accordance with these requirements.
Key audit mattersKey audit matters are those matters that, in our professional judgment, were of most significance in our audit of the consolidatedfinancial statements for the year ended October 31, 2020. These matters were addressed in the context of our audit of theconsolidated financial statements as a whole, and in forming our opinion thereon, and we do not provide a separate opinion onthese matters.
Key audit matter How our audit addressed the key audit matterAllowance for Credit Losses (ACL)Refer to Note 2, Summary of significant accounting policies,estimates and judgments, Note 4, Securities and Note 5, Loansand allowance for credit losses to the consolidated financialstatements.
The Bank’s ACL for financial assets was $6,262 million as atOctober 31, 2020 and represents management’s estimate ofexpected credit losses on financial assets as at the balancesheet date. Performing financial assets are categorized asStage 1 from initial recognition to the date on which the assethas experienced a significant increase in credit risk relative toits initial recognition. Performing financial assets transfer intoStage 2 following a significant increase in credit risk relative tothe initial recognition. Financial assets are categorized asStage 3 when considered to be credit-impaired. As disclosed bymanagement, the measurement of expected credit losses is acomplex calculation that involves a large number ofinterrelated inputs and assumptions such as the financialasset’s probability of default, loss given default and exposureat default, which are modelled based on macroeconomicvariables, and discounted to the reporting date.
Management’s estimation of expected credit losses in Stage 1and Stage 2 considers five distinct future macroeconomicscenarios, each of which includes a forecast of all relevantmacroeconomic variables, designed to capture a wide range ofpossible outcomes, and which are probability-weightedaccording to management’s expectation of the relativelikelihood of the range of outcomes that each scenariorepresents at the reporting date. As disclosed in Note 5, the
Our approach to addressing the matter involved the followingprocedures, amongst others:
• testing the effectiveness of controls relating to theestimation of the ACL, incorporating consideration of theeconomic disruption caused by COVID-19, including controlsover: (i) the probability of default, loss given default andexposure at default models, (ii) the design of multiple futuremacroeconomic scenarios, the forecasting ofmacroeconomic variables, and the probability-weighting ofthese scenarios, (iii) the completeness and accuracy of thedata inputs underlying the ACL calculation, and (iv) theapplication of expert credit judgment;
• testing management’s process for estimating the Stage 1and Stage 2 ACL, including their consideration of theeconomic disruption caused by COVID-19:
O evaluating the appropriateness of the probability ofdefault, loss given default and exposure at defaultmodels used in the estimation of the Stage 1 andStage 2 ACL;
O testing the completeness, accuracy, and relevance ofunderlying data;
O evaluating the reasonableness of significant inputsand assumptions used in the estimation of the ACL,including: a) the design of future macroeconomicscenarios, b) the forecasted macroeconomicvariables, c) the probability-weights assigned to thescenarios; and
O evaluating management’s application of expert creditjudgment;
• evaluating the reasonableness of management’s inputs andassumptions used in the design of the futuremacroeconomic scenarios and the forecasted
120 Royal Bank of Canada: Annual Report 2020 Consolidated Financial Statements

Key audit matter (continued) How our audit addressed the key audit matterCOVID-19 global pandemic significantly impactedmanagement’s determination of the ACL and required theapplication of heightened judgment. As a result, the ACL has ahigher than usual degree of uncertainty and the inputs usedare inherently subject to change, which may materially changethe estimate of Stage 1 and Stage 2 ACL in future periods.
To address the uncertainties inherent in the current and futureenvironment and to reflect all relevant risk factors notcaptured in the Bank’s modelled results, management appliedexpert credit judgment; management applied quantitative andqualitative adjustments for the impacts of the unprecedentedmacroeconomic scenarios arising from the pandemic, thetemporary effects of the bank and government led paymentsupport programs, which may not completely mitigate futurelosses, and the impacts to particularly vulnerable sectorsaffected by COVID-19.
We determined that this is a key audit matter due to:(i) the significant judgment required by management whena) designing future macroeconomic scenarios, b) forecastingmacroeconomic variables, c) probability-weighting scenariosand d) applying expert credit judgment to reflectcharacteristics not already considered in the models;(ii) a high degree of estimation uncertainty due to theeconomic impacts of COVID-19 which led to a high degree ofauditor judgment;(iii) significant audit effort necessary to evaluate auditevidence as the estimation of the ACL is a complex calculationthat involves a large volume of data, interrelated inputs andassumptions, some of which are model based; and(iv) the audit effort included the use of professionals withspecialized skill and knowledge.
macroeconomic variables included evaluating theconsistency of these assumptions with external market andindustry data; and
• using professionals with specialized skill and knowledge toassist in testing (i) the appropriateness of the ACLcalculation, (ii) evaluating the interrelated inputs andassumptions used in the ACL calculation, some of which aremodel-based, including: a) the future macroeconomicscenarios, b) the forecasted macroeconomic variables andc) the probability-weights assigned to the scenarios, and(iii) evaluating the reasonableness of expert creditjudgment applied.
Goodwill Impairment Assessment of Certain CashGenerating Units (CGUs)Refer to Note 2, Summary of significant accounting policies,estimates and judgments, and Note 10, Goodwill and otherintangible assets to the consolidated financial statements.
Management conducts a goodwill impairment test as ofAugust 1 of each year by comparing the carrying value of eachCGU to its recoverable amount. Management calculates therecoverable amount of each CGU using a discounted cash flowmodel that projects future cash flows based on managementforecasts. The discount rates used to determine the presentvalue of each CGU’s projected future cash flows are based onthe bank-wide cost of capital, adjusted for the risks to whicheach CGU is exposed. For each of the CGUs, cash flows beyondthe initial cash flow forecast period are assumed bymanagement to increase at a constant terminal growth rate.
As disclosed by management, as a result of the economicdisruptions triggered by COVID-19, the recoverable amount ofthe Caribbean Banking CGU has declined. The goodwillallocated to the Caribbean Banking CGU as at October 31, 2020was $1,719 million and management determined in theimpairment test that the recoverable amount approximates thecarrying amount. The recoverable amount of a CGU isrepresented by its value in use, except in circumstances wherethe carrying amount of a CGU exceeds its value in use. In suchcases, the greater of the CGU’s fair value less costs of disposaland its value in use is the recoverable amount. Managementestimated the recoverable amount of the Caribbean BankingCGU as the fair value less costs of disposal, and future cashflows were adjusted to approximate the considerations of aprospective third-party buyer. In determining the recoverableamount of the Caribbean Banking CGU, managementdiscounted forecast future cash flows using a pre-tax rate of11.4% in 2020, reflecting a lower interest rate environment, andthe terminal growth rate used was 3.7%, reflecting uncertaintydue to the pandemic. Management also considered reasonablypossible alternative scenarios, including market comparabletransactions, which yielded valuations of the CaribbeanBanking CGU ranging from an immaterial surplus to animmaterial deficit.
Our approach to addressing the matter involved the followingprocedures, amongst others:
• testing the effectiveness of controls relating tomanagement’s goodwill impairment test, including controlsover the determination of the recoverable amount of theCaribbean Banking, Capital Markets and U.S. WealthManagement (including City National) CGUs;
• testing management’s process for determining therecoverable amount of each of these CGUs:
O evaluating the appropriateness of the discountedcash flow models;
O testing the completeness, accuracy, and relevance ofunderlying data used in the models; and
O evaluating the significant assumptions used bymanagement, including a) discount rates, b) terminalgrowth rates, c) future cash flows, andd) adjustments made thereto to approximate theconsiderations of a prospective third-party buyer forthe Caribbean Banking CGU, including evaluatingconsistency with market comparable transactions forthe Caribbean Banking CGU;
• evaluating management’s assumptions related to futurecash flows involved assessing whether the assumptionsused by management were reasonable considering theconsistency with (i) current and past performance of eachCGU, (ii) external market data and industry data, and(iii) evidence obtained in other areas of the audit; and
• using professionals with specialized skill and knowledge toassist in evaluating (i) the appropriateness ofmanagement’s discounted cash flow models, and (ii) thereasonableness of certain significant assumptions,including a) discount rates, b) terminal growth rates, andc) evaluating consistency of the recoverable amount of theCaribbean Banking CGU with market comparabletransactions.
Consolidated Financial Statements Royal Bank of Canada: Annual Report 2020 121

Key audit matter (continued) How our audit addressed the key audit matterAs management has also disclosed, as a result of the economicdisruptions triggered by COVID-19, the recoverable amounts ofcertain CGUs, including Capital Markets and U.S. WealthManagement (including City National), which are moresensitive to economic uncertainties, including interest ratemovements, have declined, but continue to exceed carryingamounts despite impacts from the COVID-19 pandemic. As atOctober 31, 2020 the goodwill allocated to the Capital Marketsand U.S. Wealth Management (including City National) CGUswas $1,078 million and $2,978 million, respectively. Therecoverable amounts of the Capital Markets and U.S. WealthManagement (including City National) CGUs are representedby each CGU’s value in use, estimated using a discounted cashflow method.
As disclosed by management, the estimation of therecoverable amount of each CGU requires the use of significantjudgment; and the models are most sensitive to changes infuture cash flows, discount rates, and terminal growth rates.The environment is rapidly evolving and as a result,management’s economic outlook has a higher than usualdegree of uncertainty, which may, in future periods, materiallychange the expected future cash flows of the CGUs and resultin an impairment charge. Actual experience may differmaterially from current expectations, including in relation tothe duration and severity of the economic contraction and theultimate timing and extent of a future recovery.
We determined that performing procedures relating to goodwillimpairment assessment of the Caribbean Banking, CapitalMarkets and U.S. Wealth Management (including City National)CGUs is a key audit matter due to:(i) the significant judgment required by management whendetermining the recoverable amount of each CGU, includinga) future cash flows, b) discount rates, c) terminal growthrates, and d) for the Caribbean Banking CGU where the fairvalue less costs of disposal was estimated, 1) adjustmentsmade to the cash flows to approximate the considerations of aprospective third-party buyer and 2) consideration of marketcomparable transactions;(ii) a high degree of auditor judgment and subjectivity inperforming procedures over management’s calculation of therecoverable amount of each CGU, and evaluating auditevidence, especially in light of the decline in recoverableamounts; and(iii) the audit effort included the use of professionals withspecialized skill and knowledge.
Uncertain Tax PositionsRefer to Note 2, Summary of significant accounting policies,estimates and judgments, and Note 22, Income taxes to theconsolidated financial statements.
The Bank is subject to income tax laws in various jurisdictionswhere it operates and the complex tax laws are potentiallysubject to different interpretations by management and therelevant taxation authorities. As disclosed by management,significant judgment is required in the interpretation of therelevant tax laws, and in assessing the probability ofacceptance of the Bank’s tax positions to determine taxprovisions, which includes management’s best estimate ofuncertain tax positions that are under audit or appeal by therelevant taxation authorities. Management performs a reviewon a quarterly basis to incorporate its best assessment basedon information available, but additional liability and incometax expense could result based on the acceptance of the Bank’stax positions by the relevant tax authorities.
In some cases, the Bank has received reassessments denyingthe tax deductibility of dividends from transactions includingthose with Tax Indifferent Investors.
We determined that this is a key audit matter due to:(i) the significant judgment required by management, includinga high degree of estimation uncertainty, when a) interpretingthe relevant tax laws, and b) assessing the probability ofacceptance of the Bank’s tax positions, which includesmanagement’s best estimate of tax positions that are underaudit or appeal by relevant taxation authorities;(ii) a high degree of auditor judgment and subjectivity inperforming procedures to evaluate the uncertain tax positions;and(iii) the audit effort included the use of professionals withspecialized skill and knowledge.
Our approach to addressing the matter involved the followingprocedures, amongst others:
• testing the effectiveness of controls relating to theevaluation of uncertain tax positions and the impact on taxprovisions;
• testing management’s process used in (i) assessing theprobability of acceptance of the Bank’s tax positions, whichincludes management’s best estimate of tax positions thatare under audit or appeal by relevant taxation authoritiesand (ii) estimating provisions relating to uncertain taxpositions;
O evaluating the appropriateness of the methods used;O testing the completeness, accuracy, and relevance of
underlying data used;O reviewing correspondence with relevant taxation
authorities;O inquiring of the Bank’s internal and external legal
counsel; andO evaluating the reasonableness of significant
assumptions used by management; and• using professionals with specialized skill and knowledge to
assist in evaluating the significant assumptions, includinga) the application of relevant tax laws, b) whether it isprobable that the relevant tax authorities will accept thetax positions, and c) evidence used by management.
122 Royal Bank of Canada: Annual Report 2020 Consolidated Financial Statements

Other informationManagement is responsible for the other information. The other information comprises the Management’s Discussion andAnalysis and the information, other than the consolidated financial statements and our auditor’s report thereon, included in theannual report.
Our opinion on the consolidated financial statements does not cover the other information and we do not express any form ofassurance conclusion thereon.
In connection with our audit of the consolidated financial statements, our responsibility is to read the other informationidentified above and, in doing so, consider whether the other information is materially inconsistent with the consolidatedfinancial statements or our knowledge obtained in the audit, or otherwise appears to be materially misstated.
If, based on the work we have performed, we conclude that there is a material misstatement of this other information, we arerequired to report that fact. We have nothing to report in this regard.
Responsibilities of management and those charged with governance for the consolidated financial statementsManagement is responsible for the preparation and fair presentation of the consolidated financial statements in accordancewith IFRS, and for such internal control as management determines is necessary to enable the preparation of consolidatedfinancial statements that are free from material misstatement, whether due to fraud or error.
In preparing the consolidated financial statements, management is responsible for assessing the Bank’s ability to continue as agoing concern, disclosing, as applicable, matters related to going concern and using the going concern basis of accountingunless management either intends to liquidate the Bank or to cease operations, or has no realistic alternative but to do so.
Those charged with governance are responsible for overseeing the Bank’s financial reporting process.
Auditor’s responsibilities for the audit of the consolidated financial statementsOur objectives are to obtain reasonable assurance about whether the consolidated financial statements as a whole are free frommaterial misstatement, whether due to fraud or error, and to issue an auditor’s report that includes our opinion. Reasonableassurance is a high level of assurance, but is not a guarantee that an audit conducted in accordance with Canadian generallyaccepted auditing standards will always detect a material misstatement when it exists. Misstatements can arise from fraud orerror and are considered material if, individually or in the aggregate, they could reasonably be expected to influence theeconomic decisions of users taken on the basis of these consolidated financial statements.
As part of an audit in accordance with Canadian generally accepted auditing standards, we exercise professional judgment andmaintain professional skepticism throughout the audit. We also:• Identify and assess the risks of material misstatement of the consolidated financial statements, whether due to fraud or
error, design and perform audit procedures responsive to those risks, and obtain audit evidence that is sufficient andappropriate to provide a basis for our opinion. The risk of not detecting a material misstatement resulting from fraud ishigher than for one resulting from error, as fraud may involve collusion, forgery, intentional omissions, misrepresentations,or the override of internal control.
• Obtain an understanding of internal control relevant to the audit in order to design audit procedures that are appropriate inthe circumstances, but not for the purpose of expressing an opinion on the effectiveness of the Bank’s internal control.
• Evaluate the appropriateness of accounting policies used and the reasonableness of accounting estimates and relateddisclosures made by management.
• Conclude on the appropriateness of management’s use of the going concern basis of accounting and, based on the auditevidence obtained, whether a material uncertainty exists related to events or conditions that may cast significant doubt onthe Bank’s ability to continue as a going concern. If we conclude that a material uncertainty exists, we are required to drawattention in our auditor’s report to the related disclosures in the consolidated financial statements or, if such disclosures areinadequate, to modify our opinion. Our conclusions are based on the audit evidence obtained up to the date of our auditor’sreport. However, future events or conditions may cause the Bank to cease to continue as a going concern.
• Evaluate the overall presentation, structure and content of the consolidated financial statements, including the disclosures,and whether the consolidated financial statements represent the underlying transactions and events in a manner thatachieves fair presentation.
• Obtain sufficient appropriate audit evidence regarding the financial information of the entities or business activities withinthe Bank to express an opinion on the consolidated financial statements. We are responsible for the direction, supervisionand performance of the group audit. We remain solely responsible for our audit opinion.
We communicate with those charged with governance regarding, among other matters, the planned scope and timing of the auditand significant audit findings, including any significant deficiencies in internal control that we identify during our audit.
We also provide those charged with governance with a statement that we have complied with relevant ethical requirementsregarding independence, and to communicate with them all relationships and other matters that may reasonably be thought tobear on our independence, and where applicable, related safeguards.
From the matters communicated with those charged with governance, we determine those matters that were of mostsignificance in the audit of the consolidated financial statements of the current period and are therefore the key audit matters.We describe these matters in our auditor’s report unless law or regulation precludes public disclosure about the matter or when,in extremely rare circumstances, we determine that a matter should not be communicated in our report because the adverseconsequences of doing so would reasonably be expected to outweigh the public interest benefits of such communication.
The engagement partner on the audit resulting in this independent auditor’s report is Samuel May.
PricewaterhouseCoopers LLP
Chartered Professional Accountants, Licensed Public Accountants
Toronto, CanadaDecember 1, 2020
Consolidated Financial Statements Royal Bank of Canada: Annual Report 2020 123

Report of Independent Registered Public Accounting Firm
To the Shareholders and Board of Directors of Royal Bank of Canada
Opinions on the Financial Statements and Internal Control over Financial ReportingWe have audited the accompanying consolidated balance sheets of Royal Bank of Canada and its subsidiaries (together, theBank) as of October 31, 2020 and 2019, and the related consolidated statements of income, comprehensive income, changes inequity and cash flows for the years then ended, including the related notes (collectively referred to as the consolidated financialstatements). We also have audited the Bank’s internal control over financial reporting as of October 31, 2020, based on criteriaestablished in Internal Control – Integrated Framework (2013) issued by the Committee of Sponsoring Organizations of theTreadway Commission (COSO).
In our opinion, the consolidated financial statements referred to above present fairly, in all material respects, the financialposition of the Bank as of October 31, 2020 and 2019, and its financial performance and its cash flows for the years then ended inconformity with International Financial Reporting Standards as issued by the International Accounting Standards Board. Also inour opinion, the Bank maintained, in all material respects, effective internal control over financial reporting as of October 31,2020, based on criteria established in Internal Control – Integrated Framework (2013) issued by the COSO.
Basis for OpinionsThe Bank’s management is responsible for these consolidated financial statements, for maintaining effective internal controlover financial reporting, and for its assessment of the effectiveness of internal control over financial reporting, included in theaccompanying Management’s Report on Internal Control over Financial Reporting. Our responsibility is to express opinions onthe Bank’s consolidated financial statements and on the Bank’s internal control over financial reporting based on our audits. Weare a public accounting firm registered with the Public Company Accounting Oversight Board (United States) (PCAOB) and arerequired to be independent with respect to the Bank in accordance with the U.S. federal securities laws and the applicable rulesand regulations of the Securities and Exchange Commission and the PCAOB.
We conducted our audits in accordance with the standards of the PCAOB. Those standards require that we plan and perform theaudits to obtain reasonable assurance about whether the consolidated financial statements are free of material misstatement,whether due to error or fraud, and whether effective internal control over financial reporting was maintained in all materialrespects.
Our audits of the consolidated financial statements included performing procedures to assess the risks of material misstatementof the consolidated financial statements, whether due to error or fraud, and performing procedures that respond to those risks.Such procedures included examining, on a test basis, evidence regarding the amounts and disclosures in the consolidatedfinancial statements. Our audits also included evaluating the accounting principles used and significant estimates made bymanagement, as well as evaluating the overall presentation of the consolidated financial statements. Our audit of internalcontrol over financial reporting included obtaining an understanding of internal control over financial reporting, assessing therisk that a material weakness exists, and testing and evaluating the design and operating effectiveness of internal control basedon the assessed risk. Our audits also included performing such other procedures as we considered necessary in thecircumstances. We believe that our audits provide a reasonable basis for our opinions.
Definition and Limitations of Internal Control over Financial ReportingAn entity’s internal control over financial reporting is a process designed to provide reasonable assurance regarding thereliability of financial reporting and the preparation of financial statements for external purposes in accordance with generallyaccepted accounting principles. An entity’s internal control over financial reporting includes those policies and procedures that(i) pertain to the maintenance of records that, in reasonable detail, accurately and fairly reflect the transactions and dispositionsof the assets of the entity; (ii) provide reasonable assurance that transactions are recorded as necessary to permit preparationof financial statements in accordance with generally accepted accounting principles, and that receipts and expenditures of theentity are being made only in accordance with authorizations of management and directors of the entity; and (iii) providereasonable assurance regarding prevention or timely detection of unauthorized acquisition, use, or disposition of the entity’sassets that could have a material effect on the financial statements.
Because of its inherent limitations, internal control over financial reporting may not prevent or detect misstatements. Also,projections of any evaluation of effectiveness to future periods are subject to the risk that controls may become inadequatebecause of changes in conditions, or that the degree of compliance with the policies or procedures may deteriorate.
Critical Audit MattersThe critical audit matters communicated below are matters arising from the current period audit of the consolidated financialstatements that were communicated or required to be communicated to the audit committee and that (i) relate to accounts ordisclosures that are material to the consolidated financial statements and (ii) involved our especially challenging, subjective, orcomplex judgments. The communication of critical audit matters does not alter in any way our opinion on the consolidatedfinancial statements, taken as a whole, and we are not, by communicating the critical audit matters below, providing separateopinions on the critical audit matters or on the accounts or disclosures to which they relate.
Allowance for Credit Losses (ACL)As described in Notes 2, 4 and 5 to the consolidated financial statements, the Bank’s ACL for financial assets was $6,262 millionas at October 31, 2020 and represents management’s estimate of expected credit losses on financial assets as at the balancesheet date. Performing financial assets are categorized as Stage 1 from initial recognition to the date on which the asset hasexperienced a significant increase in credit risk relative to its initial recognition. Performing financial assets transfer into Stage 2following a significant increase in credit risk relative to the initial recognition. Financial assets are categorized as Stage 3 whenconsidered to be credit-impaired. As disclosed by management, the measurement of expected credit losses is a complex
124 Royal Bank of Canada: Annual Report 2020 Consolidated Financial Statements

calculation that involves a large number of interrelated inputs and assumptions such as the financial asset’s probability ofdefault, loss given default and exposure at default, which are modelled based on macroeconomic variables, and discounted tothe reporting date. Management’s estimation of expected credit losses in Stage 1 and Stage 2 considers five distinct futuremacroeconomic scenarios, each of which includes a forecast of all relevant macroeconomic variables, designed to capture awide range of possible outcomes, and which are probability-weighted according to management’s expectation of the relativelikelihood of the range of outcomes that each scenario represents at the reporting date. As disclosed in Note 5, the COVID-19global pandemic significantly impacted management’s determination of the ACL and required the application of heightenedjudgment. As a result, the ACL has a higher than usual degree of uncertainty and the inputs used are inherently subject to change,which may materially change the estimate of Stage 1 and Stage 2 ACL in future periods. To address the uncertainties inherent inthe current and future environment and to reflect all relevant risk factors not captured in the Bank’s modelled results,management applied expert credit judgment; management applied quantitative and qualitative adjustments for the impacts ofthe unprecedented macroeconomic scenarios arising from the pandemic, the temporary effects of the bank and government ledpayment support programs, which may not completely mitigate future losses, and the impacts to particularly vulnerable sectorsaffected by COVID-19.
The principal considerations for our determination that performing procedures relating to the estimation of the ACL is a criticalaudit matter are: (i) there was significant judgment required by management when a) designing future macroeconomicscenarios, b) forecasting macroeconomic variables, c) probability-weighting scenarios and d) applying expert credit judgment toreflect characteristics not already considered in the models; (ii) there was a high degree of estimation uncertainty due to theeconomic impacts of COVID-19, which also led to a high degree of auditor judgment; (iii) there was significant audit effortnecessary to evaluate audit evidence as the estimation of the ACL is a complex calculation that involves a large volume of data,interrelated inputs and assumptions, some of which are model-based; and (iv) the audit effort included the use of professionalswith specialized skill and knowledge.
Addressing the matter involved performing procedures and evaluating audit evidence in connection with forming our overallopinion on the consolidated financial statements. These procedures included testing the effectiveness of controls relating tothe estimation of the ACL, incorporating consideration of the economic disruption caused by COVID-19, including controls over:(i) the probability of default, loss given default and exposure at default models, (ii) the design of multiple future macroeconomicscenarios, the forecasting of macroeconomic variables, and the probability-weighting of these scenarios, (iii) the completenessand accuracy of the data inputs underlying the ACL calculation, and (iv) the application of expert credit judgment. Theseprocedures also included testing management’s process for estimating the Stage 1 and Stage 2 ACL, including their considerationof the economic disruption caused by COVID-19, which consisted of, among others: (i) evaluating the appropriateness of theprobability of default, loss given default and exposure at default models used in the estimation of the Stage 1 and Stage 2 ACL,(ii) testing the completeness, accuracy, and relevance of underlying data, and (iii) evaluating the reasonableness of significantinputs and assumptions used in the estimation of the ACL, including: a) the design of future macroeconomic scenarios, b) theforecasted macroeconomic variables, c) the probability-weights assigned to the scenarios, and iv) evaluating management’sapplication of expert credit judgment. Evaluating the reasonableness of management’s inputs and assumptions used in thedesign of the future macroeconomic scenarios and the forecasted macroeconomic variables included evaluating the consistencyof these assumptions with external market and industry data. Professionals with specialized skill and knowledge were used toassist in (i) testing the appropriateness of the ACL calculation, (ii) evaluating the interrelated inputs and assumptions used in theACL calculation, some of which are model-based, including: a) the future macroeconomic scenarios, b) the forecastedmacroeconomic variables and c) the probability-weights assigned to the scenarios, and (iii) evaluating the reasonableness ofexpert credit judgment applied.
Goodwill Impairment Assessment of Certain Cash Generating Units (CGUs)As described in Notes 2 and 10 to the consolidated financial statements, management conducts a goodwill impairment test as ofAugust 1 of each year by comparing the carrying value of each CGU to its recoverable amount. Management calculates therecoverable amount of each CGU using a discounted cash flow model that projects future cash flows based on managementforecasts. The discount rates used to determine the present value of each CGU’s projected future cash flows are based on thebank-wide cost of capital, adjusted for the risks to which each CGU is exposed. For each of the CGUs, cash flows beyond theinitial cash flow forecast period are assumed by management to increase at a constant terminal growth rate. As disclosed bymanagement, as a result of the economic disruptions triggered by COVID-19, the recoverable amount of the Caribbean BankingCGU has declined. As described in Note 10, as at October 31, 2020, the goodwill allocated to the Caribbean Banking CGU was$1,719 million and management determined in the impairment test that the recoverable amount approximates the carryingamount. The recoverable amount of a CGU is represented by its value in use, except in circumstances where the carrying amountof a CGU exceeds its value in use. In such cases, the greater of the CGU’s fair value less costs of disposal and its value in use isthe recoverable amount. Management estimated the recoverable amount of the Caribbean Banking CGU as the fair value lesscosts of disposal, and future cash flows were adjusted to approximate the considerations of a prospective third-party buyer. Indetermining the recoverable amount of the Caribbean Banking CGU, management discounted forecast future cash flows using apre-tax rate of 11.4% in 2020, reflecting a lower interest rate environment, and the terminal growth rate used was 3.7%, reflectinguncertainty due to the pandemic. Management also considered reasonably possible alternative scenarios, including marketcomparable transactions, which yielded valuations of the Caribbean Banking CGU ranging from an immaterial surplus to animmaterial deficit. As management has also disclosed, as a result of the economic disruptions triggered by COVID-19, therecoverable amounts of certain CGUs, including Capital Markets and U.S. Wealth Management (including City National), whichare more sensitive to economic uncertainties, including interest rate movements, have declined, but continue to exceed carryingamounts despite impacts from the COVID-19 pandemic. As at October 31, 2020 the goodwill allocated to the Capital Markets andU.S. Wealth Management (including City National) CGUs was $1,078 million and $2,978 million, respectively. The recoverableamounts of the Capital Markets and U.S. Wealth Management (including City National) CGUs are represented by each CGU’svalue in use, estimated using a discounted cash flow method. As disclosed by management, the estimation of the recoverableamount of each CGU requires the use of significant judgment; and the models are most sensitive to changes in future cash flows,discount rates, and terminal growth rates. The environment is rapidly evolving and as a result, management’s economic outlookhas a higher than usual degree of uncertainty, which may, in future periods, materially change the expected future cash flows ofthe CGUs and result in an impairment charge. Actual experience may differ materially from current expectations, including inrelation to the duration and severity of the economic contraction and the ultimate timing and extent of a future recovery.
Consolidated Financial Statements Royal Bank of Canada: Annual Report 2020 125

The principal considerations for our determination that performing procedures relating to the goodwill impairment assessmentof the Caribbean Banking, Capital Markets and U.S. Wealth Management (including City National) CGUs is a critical audit matterare: (i) there was significant judgment required by management when determining the recoverable amount of each CGU,including a) future cash flows, b) discount rates, c) terminal growth rates, and d) for the Caribbean Banking CGU where the fairvalue less costs of disposal was estimated, 1) adjustments made to the cash flows to approximate the considerations of aprospective third-party buyer and 2) consideration of market comparable transactions; (ii) there was a high degree of auditorjudgment and subjectivity in performing procedures over management’s calculation of the recoverable amount of each CGU, andevaluating audit evidence, especially in light of the decline in recoverable amounts; and (iii) the audit effort included the use ofprofessionals with specialized skill and knowledge.
Addressing the matter involved performing procedures and evaluating audit evidence in connection with forming our overallopinion on the consolidated financial statements. These procedures included testing the effectiveness of controls relating tomanagement’s goodwill impairment test, including controls over the determination of the recoverable amount of the CaribbeanBanking, Capital Markets and U.S. Wealth Management (including City National) CGUs. These procedures also included testingmanagement’s process for determining the recoverable amount of each of these CGUs, which consisted of, among others:(i) evaluating the appropriateness of the discounted cash flow models, (ii) testing the completeness, accuracy, and relevance ofunderlying data used in the models, and (iii) evaluating the significant assumptions used by management, including a) discountrates, b) terminal growth rates, c) future cash flows, and d) adjustments made thereto to approximate the considerations of aprospective third-party buyer for the Caribbean Banking CGU, including evaluating consistency with market comparabletransactions for the Caribbean Banking CGU. Evaluating management’s assumptions related to future cash flows involvedassessing whether the assumptions used by management were reasonable considering the consistency with (i) current and pastperformance of each CGU, (ii) external market data and industry data, and (iii) evidence obtained in other areas of the audit.Professionals with specialized skill and knowledge were used to assist in evaluating (i) the appropriateness of management’sdiscounted cash flow models, and (ii) the reasonableness of certain significant assumptions, including a) discount rates, b)terminal growth rates, and c) evaluating consistency of the recoverable amount of the Caribbean Banking CGU with marketcomparable transactions.
Uncertain Tax PositionsAs described in Note 2 to the consolidated financial statements, the Bank is subject to income tax laws in various jurisdictionswhere it operates and the complex tax laws are potentially subject to different interpretations by management and the relevanttaxation authorities. As disclosed by management, significant judgment is required in the interpretation of the relevant tax laws,and in assessing the probability of acceptance of the Bank’s tax positions to determine tax provisions, which includesmanagement’s best estimate of uncertain tax positions that are under audit or appeal by the relevant taxation authorities.Management performs a review on a quarterly basis to incorporate its best assessment based on information available, butadditional liability and income tax expense could result based on the acceptance of the Bank’s tax positions by the relevant taxauthorities. In some cases, as described in Note 22, the Bank has received reassessments denying the tax deductibility ofdividends from transactions including those with Tax Indifferent Investors.
The principal considerations for our determination that performing procedures relating to the uncertain tax positions is a criticalaudit matter are that: (i) there was significant judgment required by management, including a high degree of estimationuncertainty, when a) interpreting the relevant tax laws, and b) assessing the probability of acceptance of the Bank’s taxpositions, which includes management’s best estimate of tax positions that are under audit or appeal by relevant taxationauthorities; (ii) there was a high degree of auditor judgment and subjectivity in performing procedures to evaluate the uncertaintax positions; and (iii) the audit effort included the use of professionals with specialized skill and knowledge.
Addressing the matter involved performing procedures and evaluating audit evidence in connection with forming our overallopinion on the consolidated financial statements. These procedures included testing the effectiveness of controls relating to theevaluation of uncertain tax positions and the impact on tax provisions. These procedures also included, among others, testingmanagement’s process used in (i) assessing the probability of acceptance of the Bank’s tax positions, which includesmanagement’s best estimate of tax positions that are under audit or appeal by relevant taxation authorities and (ii) estimatingprovisions relating to uncertain tax positions, if applicable. This involved: (i) evaluating the appropriateness of the methodsused, (ii) testing the completeness, accuracy, and relevance of underlying data used, (iii) reviewing correspondence withrelevant taxation authorities, (iv) making inquiries of the Bank’s internal and external legal counsel, and (v) evaluating thereasonableness of significant assumptions used by management. Professionals with specialized skill and knowledge were usedto assist in evaluating the significant assumptions, including a) the application of relevant tax laws, b) whether it is probable thatthe relevant tax authorities will accept the tax positions, and c) evidence used by management.
PricewaterhouseCoopers LLP
Chartered Professional Accountants, Licensed Public AccountantsToronto, CanadaDecember 1, 2020
We have served as the Bank’s auditor since 2016.
126 Royal Bank of Canada: Annual Report 2020 Consolidated Financial Statements
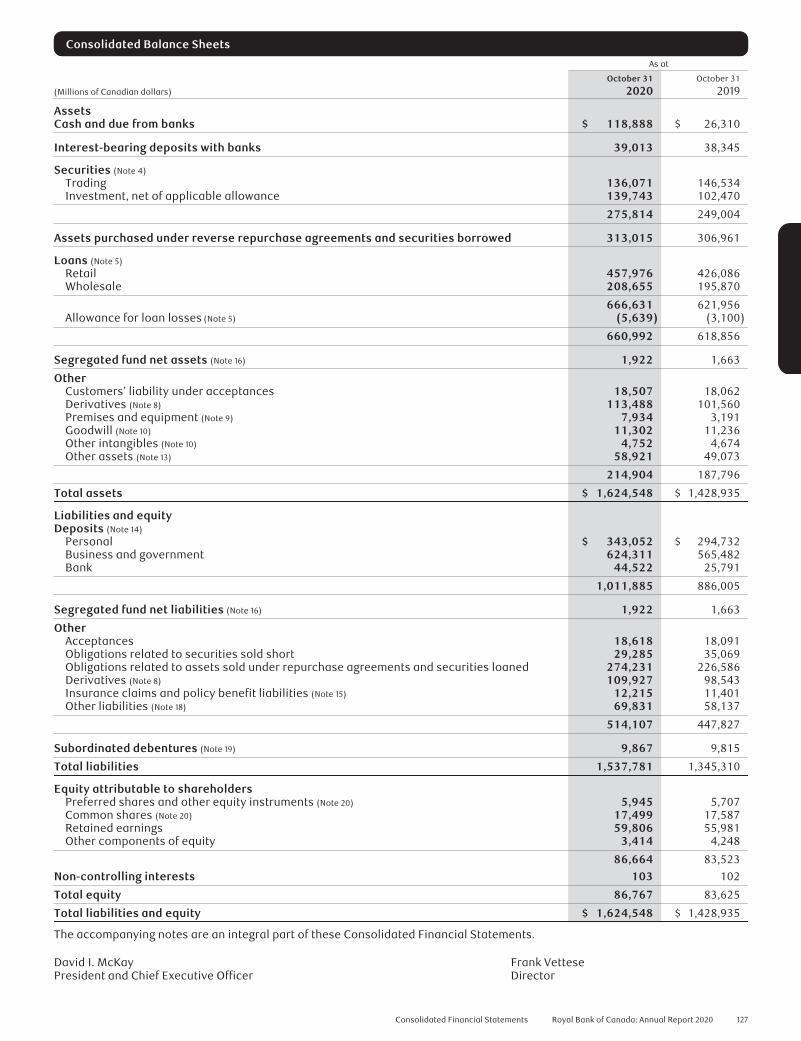
Consolidated Balance Sheets
As at
(Millions of Canadian dollars)
October 31
2020October 31
2019
AssetsCash and due from banks $ 118,888 $ 26,310
Interest-bearing deposits with banks 39,013 38,345
Securities (Note 4)
Trading 136,071 146,534Investment, net of applicable allowance 139,743 102,470
275,814 249,004
Assets purchased under reverse repurchase agreements and securities borrowed 313,015 306,961
Loans (Note 5)
Retail 457,976 426,086Wholesale 208,655 195,870
666,631 621,956Allowance for loan losses (Note 5) (5,639) (3,100)
660,992 618,856
Segregated fund net assets (Note 16) 1,922 1,663
OtherCustomers’ liability under acceptances 18,507 18,062Derivatives (Note 8) 113,488 101,560Premises and equipment (Note 9) 7,934 3,191Goodwill (Note 10) 11,302 11,236Other intangibles (Note 10) 4,752 4,674Other assets (Note 13) 58,921 49,073
214,904 187,796
Total assets $ 1,624,548 $ 1,428,935
Liabilities and equityDeposits (Note 14)
Personal $ 343,052 $ 294,732Business and government 624,311 565,482Bank 44,522 25,791
1,011,885 886,005
Segregated fund net liabilities (Note 16) 1,922 1,663
OtherAcceptances 18,618 18,091Obligations related to securities sold short 29,285 35,069Obligations related to assets sold under repurchase agreements and securities loaned 274,231 226,586Derivatives (Note 8) 109,927 98,543Insurance claims and policy benefit liabilities (Note 15) 12,215 11,401Other liabilities (Note 18) 69,831 58,137
514,107 447,827
Subordinated debentures (Note 19) 9,867 9,815
Total liabilities 1,537,781 1,345,310
Equity attributable to shareholdersPreferred shares and other equity instruments (Note 20) 5,945 5,707Common shares (Note 20) 17,499 17,587Retained earnings 59,806 55,981Other components of equity 3,414 4,248
86,664 83,523Non-controlling interests 103 102
Total equity 86,767 83,625
Total liabilities and equity $ 1,624,548 $ 1,428,935
The accompanying notes are an integral part of these Consolidated Financial Statements.
David I. McKay Frank VettesePresident and Chief Executive Officer Director
Consolidated Financial Statements Royal Bank of Canada: Annual Report 2020 127

Consolidated Statements of Income
For the year ended
(Millions of Canadian dollars, except per share amounts)
October 31
2020October 31
2019
Interest and dividend income (Note 3)
Loans $ 23,420 $ 24,863Securities 6,488 6,827Assets purchased under reverse repurchase agreements and securities borrowed 4,668 8,960Deposits and other 307 683
34,883 41,333
Interest expense (Note 3)
Deposits and other 8,783 12,988Other liabilities 4,985 8,231Subordinated debentures 280 365
14,048 21,584
Net interest income 20,835 19,749
Non-interest incomeInsurance premiums, investment and fee income (Note 15) 5,361 5,710Trading revenue 1,239 995Investment management and custodial fees 6,101 5,748Mutual fund revenue 3,712 3,628Securities brokerage commissions 1,439 1,305Service charges 1,842 1,907Underwriting and other advisory fees 2,319 1,815Foreign exchange revenue, other than trading 1,012 986Card service revenue 969 1,072Credit fees 1,321 1,269Net gains on investment securities 90 125Share of profit in joint ventures and associates (Note 12) 77 76Other 864 1,617
26,346 26,253
Total revenue 47,181 46,002
Provision for credit losses (Notes 4 and 5) 4,351 1,864
Insurance policyholder benefits, claims and acquisition expense (Note 15) 3,683 4,085
Non-interest expenseHuman resources (Note 17 and 21) 15,252 14,600Equipment 1,907 1,777Occupancy 1,660 1,635Communications 989 1,090Professional fees 1,330 1,305Amortization of other intangibles (Note 10) 1,273 1,197Other 2,347 2,535
24,758 24,139
Income before income taxes 14,389 15,914Income taxes (Note 22) 2,952 3,043
Net income $ 11,437 $ 12,871
Net income attributable to:Shareholders $ 11,432 $ 12,860Non-controlling interests 5 11
$ 11,437 $ 12,871
Basic earnings per share (in dollars) (Note 23) $ 7.84 $ 8.78Diluted earnings per share (in dollars) (Note 23) 7.82 8.75Dividends per common share (in dollars) 4.29 4.07
The accompanying notes are an integral part of these Consolidated Financial Statements.
128 Royal Bank of Canada: Annual Report 2020 Consolidated Financial Statements

Consolidated Statements of Comprehensive Income
For the year ended
(Millions of Canadian dollars)
October 31
2020October 31
2019
Net income $ 11,437 $ 12,871
Other comprehensive income (loss), net of taxes (Note 22)
Items that will be reclassified subsequently to income:Net change in unrealized gains (losses) on debt securities and loans at fair value through
other comprehensive incomeNet unrealized gains (losses) on debt securities and loans at fair value through other
comprehensive income (24) 192Provision for credit losses recognized in income 13 (14)Reclassification of net losses (gains) on debt securities and loans at fair value through
other comprehensive income to income (161) (133)
(172) 45
Foreign currency translation adjustmentsUnrealized foreign currency translation gains (losses) 810 65Net foreign currency translation gains (losses) from hedging activities (397) 5Reclassification of losses (gains) on foreign currency translation to income (21) 2Reclassification of losses (gains) on net investment hedging activities to income 21 1
413 73
Net change in cash flow hedgesNet gains (losses) on derivatives designated as cash flow hedges (1,145) (559)Reclassification of losses (gains) on derivatives designated as cash flow hedges to income 72 (135)
(1,073) (694)
Items that will not be reclassified subsequently to income:Remeasurements of employee benefit plans (68) (942)Net fair value change due to credit risk on financial liabilities designated at fair value through
profit or loss (263) 51Net gains (losses) on equity securities designated at fair value through other
comprehensive income 28 25
(303) (866)
Total other comprehensive income (loss), net of taxes (1,135) (1,442)
Total comprehensive income (loss) $ 10,302 $ 11,429
Total comprehensive income attributable to:Shareholders $ 10,295 $ 11,419Non-controlling interests 7 10
$ 10,302 $ 11,429
The accompanying notes are an integral part of these Consolidated Financial Statements.
Consolidated Financial Statements Royal Bank of Canada: Annual Report 2020 129

Co
nso
lid
ated
Stat
emen
tso
fCha
nges
inE
qui
ty
For
the
year
end
edO
cto
ber
31,2
020
Oth
erco
mp
one
nts
ofe
qui
ty
(Mill
ions
ofC
anad
ian
dolla
rs)
Pre
ferr
edsh
ares
and
oth
ereq
uity
inst
rum
ents
Co
mm
on
shar
es
Trea
sury
–p
refe
rred
shar
esan
do
ther
equi
tyin
stru
men
ts
Trea
sury
shar
es–
com
mo
nR
etai
ned
earn
ings
FVO
CI
secu
riti
esan
dlo
ans
Fore
ign
curr
ency
tran
sla
tio
nC
ash
flo
whe
dge
s
Tota
loth
erco
mp
one
nts
ofe
qui
ty
Eq
uity
attr
ibut
able
tosh
areh
old
ers
No
n-co
ntro
llin
gin
tere
sts
Tota
leq
uity
Ba
lanc
eat
beg
inni
ngo
fper
iod
$5
,70
6$
17
,64
5$
1$
(58
)$
55
,98
1$
33
$4
,22
1$
(6)
$4
,24
8$
83
,52
3$
10
2$
83
,62
5Tr
ansi
tio
nad
just
men
t(N
ote
2)–
––
–(1
07
)–
––
–(1
07
)–
(10
7)
Ad
just
edb
alan
ceat
beg
inni
ngo
fper
iod
$5
,70
6$
17
,64
5$
1$
(58
)$
55
,87
4$
33
$4
,22
1$
(6)
$4
,24
8$
83
,41
6$
10
2$
83
,51
8C
hang
esin
equi
tyIs
sues
ofs
hare
cap
ital
and
oth
ereq
uity
inst
rum
ents
1,7
50
80
––
(5)
––
––
1,8
25
–1
,82
5C
om
mo
nsh
ares
pur
chas
edfo
rca
ncel
lati
on
–(9
7)
––
(71
7)
––
––
(81
4)
–(8
14
)R
edem
pti
on
ofp
refe
rred
shar
esan
do
ther
equi
tyin
stru
men
ts(1
,50
8)
––
––
––
––
(1,5
08
)–
(1,5
08
)Sa
les
oft
reas
ury
shar
esan
do
ther
equi
tyin
stru
men
ts–
–1
10
4,6
68
––
––
–4
,77
8–
4,7
78
Pur
chas
eso
ftre
asur
ysh
ares
and
oth
ereq
uity
inst
rum
ents
––
(11
4)
(4,7
39
)–
––
––
(4,8
53
)–
(4,8
53
)Sh
are-
base
dco
mp
ensa
tio
naw
ards
––
––
(3)
––
––
(3)
–(3
)D
ivid
ends
on
com
mo
nsh
ares
––
––
(6,1
11
)–
––
–(6
,11
1)
–(6
,11
1)
Div
iden
dso
np
refe
rred
shar
esan
ddi
stri
buti
ons
on
oth
ereq
uity
inst
rum
ents
––
––
(26
8)
––
––
(26
8)
(6)
(27
4)
Oth
er–
––
–(9
3)
––
––
(93
)–
(93
)N
etin
com
e–
––
–1
1,4
32
––
––
11
,43
25
11
,43
7To
talo
ther
com
pre
hens
ive
inco
me
(lo
ss),
net
oft
axes
––
––
(30
3)
(17
2)
41
1(1
,07
3)
(83
4)
(1,1
37
)2
(1,1
35
)
Bal
anc
eat
end
ofp
erio
d$
5,9
48
$1
7,6
28
$(3
)$
(12
9)
$5
9,8
06
$(1
39
)$
4,6
32
$(1
,07
9)
$3
,41
4$
86
,66
4$
10
3$
86
,76
7
For
the
year
ende
dO
cto
ber
31,2
019
Oth
erco
mp
one
nts
ofe
quit
y
(Mill
ions
ofC
anad
ian
dolla
rs)
Pre
ferr
edsh
ares
and
oth
ereq
uity
inst
rum
ents
Co
mm
on
shar
es
Trea
sury
–p
refe
rred
shar
esan
do
ther
equi
tyin
stru
men
ts
Trea
sury
shar
es–
com
mo
nR
etai
ned
earn
ings
FVO
CI
secu
riti
esan
dlo
ans
Fore
ign
curr
ency
tran
slat
ion
Cas
hfl
ow
hedg
es
Tota
loth
erco
mp
one
nts
ofe
quit
y
Equi
tyat
trib
utab
leto
shar
eho
lder
sN
on-
cont
rolli
ngin
tere
sts
Tota
leq
uity
Ba
lanc
eat
beg
inni
ngo
fper
iod
(No
te2)
$6,
306
$17
,635
$3
$(1
8)$
51,0
18$
(12)
$4,
147
$68
8$
4,82
3$
79,7
67$
94$
79,8
61C
hang
esin
equi
tyIs
sues
ofs
hare
cap
ital
and
oth
ereq
uity
inst
rum
ents
350
136
––
––
––
–48
6–
486
Co
mm
on
shar
esp
urch
ased
for
canc
ella
tio
n–
(126
)–
–(9
04)
––
––
(1,0
30)
–(1
,030
)R
edem
pti
on
ofp
refe
rred
shar
esan
do
ther
equi
tyin
stru
men
ts(9
50)
––
––
––
––
(950
)–
(950
)Sa
les
oft
reas
ury
shar
esan
do
ther
equi
tyin
stru
men
ts–
–18
25,
340
––
––
–5,
522
–5,
522
Pur
chas
eso
ftre
asur
ysh
ares
and
oth
ereq
uity
inst
rum
ents
––
(184
)(5
,380
)–
––
––
(5,5
64)
–(5
,564
)Sh
are-
base
dco
mp
ensa
tio
naw
ards
––
––
(23)
––
––
(23)
–(2
3)D
ivid
ends
on
com
mo
nsh
ares
––
––
(5,8
40)
––
––
(5,8
40)
–(5
,840
)D
ivid
ends
on
pre
ferr
edsh
ares
and
dist
ribu
tio
nso
no
ther
equi
tyin
stru
men
ts–
––
–(2
69)
––
––
(269
)(2
)(2
71)
Oth
er–
––
–5
––
––
5–
5N
etin
com
e–
––
–12
,860
––
––
12,8
6011
12,8
71To
talo
ther
com
pre
hens
ive
inco
me
(lo
ss),
net
oft
axes
––
––
(866
)45
74(6
94)
(575
)(1
,441
)(1
)(1
,442
)
Bal
anc
eat
end
ofp
erio
d$
5,70
6$
17,6
45$
1$
(58)
$55
,981
$33
$4,
221
$(6
)$
4,24
8$
83,5
23$
102
$83
,625
The
acco
mp
anyi
ngno
tes
are
anin
tegr
alp
art
oft
hese
Co
nso
lidat
edFi
nanc
ialS
tate
men
ts.
130 Royal Bank of Canada: Annual Report 2020 Consolidated Financial Statements

Consolidated Statements of Cash Flows
For the year ended
(Millions of Canadian dollars)
October 31
2020October 31
2019
Cash flows from operating activitiesNet income $ 11,437 $ 12,871Adjustments for non-cash items and others
Provision for credit losses 4,351 1,864Depreciation 1,333 627Deferred income taxes (586) (519)Amortization and impairment of other intangibles 1,315 1,307Net changes in investments in joint ventures and associates (73) (74)Losses (Gains) on investment securities (218) (213)Losses (Gains) on disposition of business 8 (158)
Adjustments for net changes in operating assets and liabilitiesInsurance claims and policy benefit liabilities 814 1,401Net change in accrued interest receivable and payable (142) 199Current income taxes 18 (26)Derivative assets (11,928) (7,521)Derivative liabilities 11,384 8,305Trading securities 10,377 (18,276)Loans, net of securitizations (45,639) (42,672)Assets purchased under reverse repurchase agreements and securities borrowed (6,054) (12,359)Obligations related to assets sold under repurchase agreements and securities loaned 47,645 19,772Obligations related to securities sold short (5,784) 2,822Deposits, net of securitizations 126,826 49,808Brokers and dealers receivable and payable 2,301 (480)Other (8,566) (2,413)
Net cash from (used in) operating activities 138,819 14,265
Cash flows from investing activitiesChange in interest-bearing deposits with banks (676) (1,874)Proceeds from sales and maturities of investment securities 113,286 65,377Purchases of investment securities (149,516) (72,435)Net acquisitions of premises and equipment and other intangibles (2,629) (2,261)Proceeds from dispositions – 173Cash used in acquisitions (22) (106)
Net cash from (used in) investing activities (39,557) (11,126)
Cash flows from financing activitiesIssuance of subordinated debentures 2,750 1,500Repayment of subordinated debentures (3,000) (1,100)Issue of common shares, net of issuance costs 70 105Common shares purchased for cancellation (814) (1,030)Issue of preferred shares and other equity instruments, net of issuance costs 1,745 350Redemption of preferred shares and other equity instruments (1,508) (950)Sales of treasury shares 4,778 5,522Purchases of treasury shares (4,853) (5,564)Dividends paid on shares and distributions paid on other equity instruments (6,333) (6,025)Dividends/distributions paid to non-controlling interests (6) (2)Change in short-term borrowings of subsidiaries 13 (263)Repayment of lease liabilities (588)
Net cash from (used in) financing activities (7,746) (7,457)
Effect of exchange rate changes on cash and due from banks 1,062 419
Net change in cash and due from banks 92,578 (3,899)Cash and due from banks at beginning of period (1) 26,310 30,209
Cash and due from banks at end of period (1) $ 118,888 $ 26,310
Cash flows from operating activities include:Amount of interest paid $ 13,058 $ 19,984Amount of interest received 33,244 39,500Amount of dividends received 2,753 2,209Amount of income taxes paid 2,880 2,977
(1) We are required to maintain balances with central banks and other regulatory authorities. The total balances were $2.5 billion as at October 31, 2020 (October 31, 2019 –$2.6 billion; October 31, 2018 – $2.4 billion).
The accompanying notes are an integral part of these Consolidated Financial Statements.
Consolidated Financial Statements Royal Bank of Canada: Annual Report 2020 131

Note 1 General information
Royal Bank of Canada and its subsidiaries (the Bank) provide diversified financial services including Personal and CommercialBanking, Wealth Management, Insurance, Investor and Treasury Services and Capital Markets products and services on a globalbasis. Refer to Note 27 for further details on our business segments.
The parent bank, Royal Bank of Canada, is a Schedule I Bank under the Bank Act (Canada) incorporated and domiciled inCanada. Our corporate headquarters are located at Royal Bank Plaza, 200 Bay Street, Toronto, Ontario, Canada and our headoffice is located at 1 Place Ville-Marie, Montreal, Quebec, Canada. Our common shares are listed on the Toronto Stock Exchangeand New York Stock Exchange with the ticker symbol RY.
These Consolidated Financial Statements are prepared in compliance with International Financial Reporting Standards(IFRS) as issued by the International Accounting Standards Board (IASB). Unless otherwise stated, monetary amounts are statedin Canadian dollars. Tabular information is stated in millions of dollars, except as noted. These Consolidated FinancialStatements also comply with Subsection 308 of the Bank Act (Canada), which states that, except as otherwise specified by theOffice of the Superintendent of Financial Institutions Canada (OSFI), our Consolidated Financial Statements are to be prepared inaccordance with IFRS. Except where otherwise noted, the accounting policies outlined in Note 2 have been consistently appliedto all periods presented.
On December 1, 2020, the Board of Directors authorized the Consolidated Financial Statements for issue.
Note 2 Summary of significant accounting policies, estimates and judgments
The significant accounting policies used in the preparation of these Consolidated Financial Statements, including the accountingrequirements prescribed by OSFI, are summarized below. These accounting policies conform, in all material respects, to IFRS.Except where otherwise noted, the same accounting policies have been applied to all periods presented.
GeneralUse of estimates and assumptionsIn preparing our Consolidated Financial Statements, management is required to make subjective estimates and assumptions thataffect the reported amount of assets, liabilities, net income and related disclosures. Estimates made by management are basedon historical experience and other assumptions that are believed to be reasonable. Key sources of estimation uncertaintyinclude: determination of fair value of financial instruments, the allowance for credit losses, insurance claims and policy benefitliabilities, pensions and other post-employment benefits, income taxes, carrying value of goodwill and other intangible assets,and litigation provisions. Accordingly, actual results may differ from these and other estimates thereby impacting our futureConsolidated Financial Statements. Refer to the relevant accounting policies in this Note for details on our use of estimates andassumptions.
Significant judgmentsIn preparation of these Consolidated Financial Statements, management is required to make significant judgments that affectthe carrying amounts of certain assets and liabilities, and the reported amounts of revenues and expenses recorded during theperiod.
The COVID-19 pandemic continues to evolve and the economic environment in which we operate continues to be subject tosustained volatility, which could continue to negatively impact our financial results, as the duration of the COVID-19 pandemicand the effectiveness of steps undertaken by governments and central banks in response to the COVID-19 pandemic remainuncertain. The current environment requires particularly complex judgments and estimates in certain areas. We are closelymonitoring the changing conditions and their impacts.
Significant judgments have been made in the following areas and discussed as noted in the Consolidated FinancialStatements:
Consolidation of structured entities Note 2Note 7
Application of the effective interest method Note 2
Fair value of financial instruments Note 2Note 3
Derecognition of financial assets Note 2Note 6
Allowance for credit losses Note 2Note 4Note 5
Income taxes Note 2Note 22
Employee benefits Note 2Note 17
Provisions Note 2Note 24Note 25
Goodwill and other intangibles Note 2Note 10
Basis of consolidationOur Consolidated Financial Statements include the assets and liabilities and results of operations of the parent company, RoyalBank of Canada, and its subsidiaries including certain structured entities, after elimination of intercompany transactions,balances, revenues and expenses.
ConsolidationSubsidiaries are those entities, including structured entities, over which we have control. We control an entity when we areexposed, or have rights, to variable returns from our involvement with the entity and have the ability to affect those returnsthrough our power over the investee. We have power over an entity when we have existing rights that give us the current ability
132 Royal Bank of Canada: Annual Report 2020 Consolidated Financial Statements

to direct the activities that most significantly affect the entity’s returns (relevant activities). Power may be determined on thebasis of voting rights or, in the case of structured entities, other contractual arrangements.
We are not deemed to control an entity when we exercise power over an entity in an agency capacity. In determiningwhether we are acting as an agent, we consider the overall relationship between us, the investee and other parties to thearrangement with respect to the following factors: (i) the scope of our decision-making power; (ii) the rights held by otherparties; (iii) the remuneration to which we are entitled; and (iv) our exposure to variability of returns.
The determination of control is based on the current facts and circumstances and is continuously assessed. In somecircumstances, different factors and conditions may indicate that different parties control an entity depending on whether thosefactors and conditions are assessed in isolation or in totality. Significant judgment is applied in assessing the relevant factorsand conditions in totality when determining whether we control an entity. Specifically, judgment is applied in assessing whetherwe have substantive decision-making rights over the relevant activities and whether we are exercising our power as a principalor an agent.
We consolidate all subsidiaries from the date we obtain control and cease consolidation when an entity is no longercontrolled by us. Our consolidation conclusions affect the classification and amount of assets, liabilities, revenues and expensesreported in our Consolidated Financial Statements.
Non-controlling interests in subsidiaries that we consolidate are shown on our Consolidated Balance Sheets as a separatecomponent of equity which is distinct from equity attributable to our shareholders. The net income attributable tonon-controlling interests is separately disclosed in our Consolidated Statements of Income.
Investments in joint ventures and associatesOur investments in associated corporations and limited partnerships over which we have significant influence are accounted forusing the equity method. The equity method is also applied to our interests in joint ventures over which we have joint control.Under the equity method of accounting, investments are initially recorded at cost, and the carrying amount is increased ordecreased to recognize our share of the investee’s net profit or loss, including our proportionate share of the investee’s Othercomprehensive income (OCI), subsequent to the date of acquisition.
Non-current assets held for sale and discontinued operationsNon-current assets (and disposal groups) are classified as held for sale if their carrying amounts will be recovered principallythrough a sale transaction rather than through continuing use. This condition is satisfied when the asset is available forimmediate sale in its present condition, management is committed to the sale, and it is highly probable to occur within one year.Non-current assets (and disposal groups) classified as held for sale are measured at the lower of their previous carrying amountand fair value less costs to sell and if significant, are presented separately from other assets on our Consolidated BalanceSheets.
A disposal group is classified as a discontinued operation if it meets the following conditions: (i) it is a component that canbe distinguished operationally and financially from the rest of our operations and (ii) it represents either a separate major line ofbusiness or is part of a single co-ordinated plan to dispose of a separate major line of business or geographical area ofoperations. Disposal groups classified as discontinued operations are presented separately from our continuing operations inour Consolidated Statements of Income.
Changes in accounting policiesLeasesDuring the first quarter of 2020, we adopted IFRS 16 Leases (IFRS 16) replacing the previous accounting standard for leases, IAS 17Leases (IAS 17) and changed our accounting policies for leases as indicated below. As permitted by the transition provisions forIFRS 16, we elected not to restate comparative period results; accordingly, all comparative information is presented inaccordance with our previous accounting policies, as indicated below. New or amended disclosures have been provided for thecurrent period, where applicable, and comparative period disclosures are consistent with those made in the prior year.
Interest Rate Benchmark ReformDuring the first quarter of 2020, we early adopted amendments to IFRS 9 Financial Instruments, IAS 39 Financial Instruments:Recognition and Measurement and IFRS 7 Financial Instruments: Disclosures (Amendments), applicable from November 1, 2019.These amendments modify certain hedge accounting requirements to provide relief from the effect of uncertainty caused byinterest rate benchmark reform (the Reform) prior to the transition to alternative interest rates. The adoption of the Amendmentsalso introduced additional disclosure requirements. Refer to Note 8 for the notional amount of the hedging instruments which areimpacted by the Reform.
We will cease to apply these Amendments as interbank offered rate (IBOR) based cash flows transition to new risk free ratesor when the hedging relationships to which the relief is applied are discontinued as indicated below.
IFRS Interpretations Committee Interpretation 23 Uncertainty over income tax treatments (IFRIC 23)During the first quarter of 2020, we adopted IFRIC 23 which provides guidance on the recognition and measurement of tax assetsand liabilities under IAS 12 Income taxes when there is uncertainty over income tax treatments, replacing our application of IAS 37Provisions, contingent liabilities and contingent assets for uncertain tax positions as indicated below. The adoption of IFRIC 23had no impact on our consolidated financial statements.
Financial InstrumentsClassification of financial assetsFinancial assets are measured at initial recognition at fair value, and are classified and subsequently measured at fair valuethrough profit or loss (FVTPL), fair value through other comprehensive income (FVOCI) or amortized cost based on our businessmodel for managing the financial instruments and the contractual cash flow characteristics of the instrument.
Debt instruments are measured at amortized cost if both of the following conditions are met and the asset is not designatedas FVTPL: (a) the asset is held within a business model that is Held-to-Collect (HTC) as described below, and (b) the contractualterms of the instrument give rise to cash flows that are solely payments of principal and interest on the principal amountoutstanding (SPPI).
Consolidated Financial Statements Royal Bank of Canada: Annual Report 2020 133

Note 2 Summary of significant accounting policies, estimates and judgments (continued)
Debt instruments are measured at FVOCI if both of the following conditions are met and the asset is not designated asFVTPL: (a) the asset is held within a business model that is Held-to-Collect-and-Sell (HTC&S) as described below, and (b) thecontractual terms of the instrument give rise, on specified dates, to cash flows that are SPPI.
All other debt instruments are measured at FVTPL.Equity instruments are measured at FVTPL, unless the asset is not held for trading purposes and we make an irrevocable
election to designate the asset as FVOCI. This election is made on an instrument-by-instrument basis.
Business model assessmentWe determine our business models at the level that best reflects how we manage portfolios of financial assets to achieve ourbusiness objectives. Judgment is used in determining our business models, which is supported by relevant, objective evidenceincluding:
• How the economic activities of our businesses generate benefits, for example through trading revenue, enhancing yieldsor hedging funding or other costs and how such economic activities are evaluated and reported to key managementpersonnel;
• The significant risks affecting the performance of our businesses, for example, market risk, credit risk, or other risks asdescribed in the Risk Management section of Management’s Discussion and Analysis, and the activities undertaken tomanage those risks;
• Historical and future expectations of sales of the loans or securities portfolios managed as part of a business model;and
• The compensation structures for managers of our businesses, to the extent that these are directly linked to theeconomic performance of the business model.
Our business models fall into three categories, which are indicative of the key strategies used to generate returns:• HTC: The objective of this business model is to hold loans and securities to collect contractual principal and interest
cash flows. Sales are incidental to this objective and are expected to be insignificant or infrequent.• HTC&S: Both collecting contractual cash flows and sales are integral to achieving the objective of the business model.• Other fair value business models: These business models are neither HTC nor HTC&S, and primarily represent business
models where assets are held-for-trading or managed on a fair value basis.
SPPI assessmentInstruments held within a HTC or HTC&S business model are assessed to evaluate if their contractual cash flows are comprisedof solely payments of principal and interest. SPPI payments are those which would typically be expected from basic lendingarrangements. Principal amounts include par repayments from lending and financing arrangements, and interest primarilyrelates to basic lending returns, including compensation for credit risk and the time value of money associated with the principalamount outstanding over a period of time. Interest can also include other basic lending risks and costs (for example, liquidityrisk, servicing or administrative costs) associated with holding the financial asset for a period of time, and a profit margin.
Where the contractual terms introduce exposure to risk or variability of cash flows that are inconsistent with a basic lendingarrangement, the related financial asset is classified and measured at FVTPL.
SecuritiesTrading securities include all securities that are classified as FVTPL by nature and securities designated as FVTPL. Obligations todeliver trading securities sold but not yet purchased are recorded as liabilities and carried at fair value. Realized and unrealizedgains and losses on these securities are generally recorded as Trading revenue or Non-interest income – Other. Dividends andinterest income accruing on Trading securities are recorded in Interest income. Interest and dividends accrued on interest-bearing and equity securities sold short are recorded in Interest expense.
Investment securities include all securities classified as FVOCI and amortized cost. All investment securities are initiallyrecorded at fair value and subsequently measured according to the respective classification.
Investment securities carried at amortized cost are measured using the effective interest method, and are presented net ofany allowance for credit losses, calculated in accordance with our policy for Allowance for credit losses, as described below.Interest income, including the amortization of premiums and discounts on securities measured at amortized cost are recorded ininterest income. Impairment gains or losses recognized on amortized cost securities are recorded in Provision for credit losses(PCL). When a debt instrument measured at amortized cost is sold, the difference between the sale proceeds and the amortizedcost of the security at the time of the sale is recorded as Net gains on Investment securities in Non-interest income.
Debt securities carried at FVOCI are measured at fair value with unrealized gains and losses arising from changes in fairvalue included in Other components of equity. Impairment gains and losses are included in PCL and correspondingly reduce theaccumulated changes in fair value included in Other components of equity. When a debt instrument measured at FVOCI is sold,the cumulative gain or loss is reclassified from Other components of equity to Net gains on Investment securities in Non-interestincome.
Equity securities carried at FVOCI are measured at fair value. Unrealized gains and losses arising from changes in fair valueare recorded in Other components of equity and not subsequently reclassified to profit or loss when realized. Dividends fromFVOCI equity securities are recognized in Interest income.
We account for all of our securities using settlement date accounting and changes in fair value between the trade date andsettlement date are reflected in income for securities measured at FVTPL, and changes in the fair value of securities measured atFVOCI between the trade and settlement dates are recorded in OCI except for changes in foreign exchange rates on debtsecurities, which are recorded in Non-interest income-Other.
Fair value optionA financial instrument with a reliably measurable fair value can be designated as FVTPL (the fair value option) on its initialrecognition even if the financial instrument was not acquired or incurred principally for the purpose of selling or repurchasing.The fair value option can be used for financial assets if it eliminates or significantly reduces a measurement or recognitioninconsistency that would otherwise arise from measuring assets or liabilities, or recognizing related gains and losses on a
134 Royal Bank of Canada: Annual Report 2020 Consolidated Financial Statements

different basis (an accounting mismatch). The fair value option can be elected for financial liabilities if: (i) the election eliminatesan accounting mismatch; (ii) the financial liability is part of a portfolio that is managed on a fair value basis, in accordance with adocumented risk management or investment strategy; or (iii) there is an embedded derivative in the financial or non-financialhost contract and the derivative is not closely related to the host contract. These instruments cannot be reclassified out of theFVTPL category while they are held or issued.
Financial assets designated as FVTPL are recorded at fair value and any unrealized gain or loss arising due to changes in fairvalue is included in Trading revenue or Non-interest income – Other, depending on our business purpose for holding the financialasset.
Financial liabilities designated as FVTPL are recorded at fair value and fair value changes attributable to changes in our owncredit risk are recorded in OCI. Own credit risk amounts recognized in OCI will not be reclassified subsequently to net income.The remaining fair value changes not attributable to changes in our own credit risk are recorded in Trading revenue orNon-interest income – Other, depending on our business purpose for holding the financial liability. Upon initial recognition, if wedetermine that presenting the effects of own credit risk changes in OCI would create or enlarge an accounting mismatch in netincome, the full fair value change in our debt designated as FVTPL is recognized in net income. To make that determination, weassess whether we expect that the effects of changes in the liability’s credit risk will be offset in profit or loss by a change in thefair value of another financial instrument measured at FVTPL. Such an expectation is based on an economic relationship betweenthe characteristics of the liability and the characteristics of the other financial instrument. The determination is made at initialrecognition and is not reassessed. To determine the fair value adjustments on our debt instruments designated as FVTPL, wecalculate the present value of the instruments based on the contractual cash flows over the term of the arrangement by usingour effective funding rate at the beginning and end of the period.
Determination of fair valueThe fair value of a financial instrument is the price that would be received to sell an asset or paid to transfer a liability in anorderly transaction between market participants at the measurement date. We determine fair value by incorporating all factorsthat market participants would consider in setting a price, including commonly accepted valuation approaches.
The Board of Directors provides oversight on valuation of financial instruments, primarily through the Audit Committee andRisk Committee. The Audit Committee reviews the presentation and disclosure of financial instruments that are measured at fairvalue, while the Risk Committee assesses the adequacy of governance structures and control processes for the valuation ofthese instruments.
We have established policies, procedures and controls for valuation methodologies and techniques to ensure that fair valueis reasonably estimated. Major valuation processes and controls include, but are not limited to, profit and loss decomposition,independent price verification (IPV) and model validation standards. These control processes are managed by either Finance orGroup Risk Management and are independent of the relevant businesses and their trading functions. Profit and lossdecomposition is a process to explain the fair value changes of certain positions and is performed daily for trading portfolios. Allfair value instruments are subject to IPV, a process whereby trading function valuations are verified against external marketprices and other relevant market data. Market data sources include traded prices, brokers and price vendors. We give priority tothose third-party pricing services and prices having the highest and most consistent accuracy. The level of accuracy isdetermined over time by comparing third-party price values to traders’ or system values, to other pricing service values and,when available, to actual trade data. Quoted prices for identical instruments from pricing services or brokers are generally notadjusted unless there are issues such as stale prices. If multiple quotes for identical instruments are received, fair value is basedon an average of the prices received or the quote from the most reliable vendor, after the outlier prices that fall outside of thepricing range are removed. Other valuation techniques are used when a price or quote is not available. Some valuationprocesses use models to determine fair value. We have a systematic and consistent approach to control the use of models.Valuation models are approved for use within our model risk management framework. The framework addresses, among otherthings, model development standards, validation processes and procedures and approval authorities. Model validation ensuresthat a model is suitable for its intended use and sets parameters for its use. All models are revalidated regularly by qualifiedpersonnel who are independent of the model design and development. Annually our model risk profile is reported to the Board ofDirectors.
IFRS 13 Fair Value Measurement permits an exception, through an accounting policy choice, to measure the fair value of aportfolio of financial instruments on a net open risk position basis when certain criteria are met. We have elected to use thispolicy choice to determine the fair value of certain portfolios of financial instruments, primarily derivatives, based on a netexposure to market or credit risk.
We record valuation adjustments to appropriately reflect counterparty credit quality of our derivative portfolio, differencesbetween the actual counterparty collateral discount curve and standard overnight index swap (OIS) discounting forcollateralized derivatives, funding valuation adjustments (FVA) for uncollateralized and under-collateralized over-the-counter(OTC) derivatives, unrealized gains or losses at inception of the transaction, bid-offer spreads, unobservable parameters andmodel limitations. These adjustments may be subjective as they require significant judgment in the input selection, such asimplied probability of default (PD) and recovery rate, and are intended to arrive at a fair value that is determined based onassumptions that market participants would use in pricing the financial instrument. The realized price for a transaction may bedifferent from its recorded value, previously estimated using management judgment. Valuation adjustments may thereforeimpact unrealized gains and losses recognized in Non-interest income – Trading revenue or Other.
Valuation adjustments are recorded for the credit risk of our derivative portfolios in order to arrive at their fair values. Creditvaluation adjustments (CVA) take into account our counterparties’ creditworthiness, the current and potential futuremark-to-market of transactions and the effects of credit mitigants such as master netting and collateral agreements. CVAamounts are derived from estimates of exposure at default (EAD), PD, recovery rates on a counterparty basis and market andcredit factor correlations. EAD is the value of expected derivative related assets and liabilities at the time of default, estimatedthrough modelling using underlying risk factors. PD is implied from the market prices for credit protection and the credit ratingsof the counterparty. When market data is unavailable, it is estimated by incorporating assumptions and adjustments that marketparticipants would use for determining fair value using these inputs. Correlation is the statistical measure of how credit andmarket factors may move in relation to one another. Correlation is estimated using historical data. CVA is calculated daily andchanges are recorded in Non-interest income – Trading revenue.
Consolidated Financial Statements Royal Bank of Canada: Annual Report 2020 135

Note 2 Summary of significant accounting policies, estimates and judgments (continued)
FVA are also calculated to incorporate the cost and benefit of funding in the valuation of uncollateralized and under-collateralized OTC derivatives. Future expected cash flows of these derivatives are discounted to reflect the cost and benefit offunding the derivatives by using a funding curve, implied volatilities and correlations as inputs.
Where required, a valuation adjustment is made to reflect the unrealized gain or loss at inception of a financial instrumentcontract where the fair value of that financial instrument is not obtained from a quoted market price or cannot be evidenced byother observable market transactions based on a valuation technique incorporating observable market data.
A bid-offer valuation adjustment is required when a financial instrument is valued at the mid-market price, instead of the bidor offer price for asset or liability positions, respectively. The valuation adjustment takes into account the spread from themid-market price to either the bid or offer price.
Some valuation models require parameter calibration from such factors as market observable option prices. The calibrationof parameters may be sensitive to factors such as the choice of instruments or optimization methodology. A valuationadjustment is also estimated to mitigate the uncertainties of parameter calibration and model limitations.
In determining fair value, a hierarchy is used which prioritizes the inputs to valuation techniques. The fair value hierarchygives the highest priority to unadjusted quoted prices in active markets for identical assets or liabilities (Level 1) and the lowestpriority to unobservable inputs (Level 3). Determination of fair value based on this hierarchy requires the use of observablemarket data whenever available. Level 1 inputs are unadjusted quoted prices in active markets for identical assets or liabilitiesthat we have the ability to access at the measurement date. Level 2 inputs include quoted prices for similar assets or liabilities inactive markets, quoted prices for identical or similar assets or liabilities in markets that are not active, and model inputs that areeither observable, or can be corroborated by observable market data for substantially the full term of the assets or liabilities.Level 3 inputs are one or more inputs that are unobservable and significant to the fair value of the asset or liability.Unobservable inputs are used to measure fair value to the extent that observable inputs are not available at the measurementdate. The availability of inputs for valuation may affect the selection of valuation techniques. The classification of a financialinstrument in the hierarchy for disclosure purposes is based upon the lowest level of input that is significant to the measurementof fair value.
Where observable prices or inputs are not available, management judgment is required to determine fair values byassessing other relevant sources of information such as historical data, proxy information from similar transactions, and throughextrapolation and interpolation techniques. For more complex or illiquid instruments, significant judgment is required in thedetermination of the model used, the selection of model inputs, and in some cases the application of valuation adjustments tothe model value or quoted price for inactively traded financial instruments, as the selection of model inputs may be subjectiveand the inputs may be unobservable. Unobservable inputs are inherently uncertain as there is little or no market data availablefrom which to determine the level at which the transaction would occur under normal business circumstances. Appropriateparameter uncertainty and market risk valuation adjustments for such inputs and other model risk valuation adjustments areassessed in all such instances.
LoansLoans are debt instruments recognized initially at fair value and are subsequently measured in accordance with theClassification of financial assets policy provided above. The majority of our loans are carried at amortized cost using theeffective interest method, which represents the gross carrying amount less allowance for credit losses.
Interest on loans is recognized in Interest income using the effective interest method. The estimated future cash flows usedin this calculation include those determined by the contractual term of the asset and all fees that are considered to be integral tothe effective interest rate. Also included in this amount are transaction costs and all other premiums or discounts. Fees thatrelate to activities such as originating, restructuring or renegotiating loans are deferred and recognized as Interest income overthe expected term of such loans using the effective interest method. Where there is a reasonable expectation that a loan will beoriginated, commitment and standby fees are also recognized as interest income over the expected term of the resulting loansusing the effective interest method. Otherwise, such fees are recorded as other liabilities and amortized into Non-interest incomeover the commitment or standby period. Future prepayment fees on mortgage loans are not included as part of the effectiveinterest rate at origination. If prepayment fees are received on a renewal of a mortgage loan before maturity, the fee is includedas part of the effective interest rate, and if not renewed, the prepayment fee is recognized in interest income at the prepaymentdate.
For loans carried at amortized cost or FVOCI, impairment losses are recognized at each balance sheet date in accordancewith the three-stage impairment model outlined below.
Allowance for credit lossesAn allowance for credit losses (ACL) is established for all financial assets, except for financial assets classified or designated asFVTPL and equity securities designated as FVOCI, which are not subject to impairment assessment. Assets subject to impairmentassessment include loans, debt securities, interest-bearing deposits with banks, customers’ liability under acceptances, accountsand accrued interest receivable, and finance and operating lease receivables. ACL on loans measured at amortized cost ispresented in Allowance for loan losses. ACL on debt securities measured at FVOCI is presented in Other components of equity.Other financial assets carried at amortized cost are presented net of ACL on our Consolidated Balance Sheets.
Off-balance sheet items subject to impairment assessment include financial guarantees and undrawn loan commitments.ACL on off-balance sheet items is separately calculated and included in Other Liabilities – Provisions.
We measure the ACL on each balance sheet date according to a three-stage expected credit loss impairment model:• Performing financial assets
• Stage 1 – From initial recognition of a financial asset to the date on which the asset has experienced a significantincrease in credit risk relative to its initial recognition, a loss allowance is recognized equal to the credit lossesexpected to result from defaults occurring over the 12 months following the reporting date.
• Stage 2 – Following a significant increase in credit risk relative to the initial recognition of the financial asset, a lossallowance is recognized equal to the credit losses expected over the remaining lifetime of the asset.
136 Royal Bank of Canada: Annual Report 2020 Consolidated Financial Statements

• Impaired financial assets• Stage 3 – When a financial asset is considered to be credit-impaired, a loss allowance is recognized equal to credit
losses expected over the remaining lifetime of the asset. Interest income is calculated based on the carryingamount of the asset, net of the loss allowance, rather than on its gross carrying amount.
The ACL is a discounted probability-weighted estimate of the cash shortfalls expected to result from defaults over the relevanttime horizon. For loan commitments, credit loss estimates consider the portion of the commitment that is expected to be drawnover the relevant time period. For financial guarantees, credit loss estimates are based on the expected payments required underthe guarantee contract. For finance lease receivables, credit loss estimates are based on cash flows consistent with the cashflows used in measuring the lease receivable.
Increases or decreases in the required ACL attributable to purchases and new originations, derecognitions or maturities, andchanges in risk, parameters and exposures due to changes in loss expectations or stage transfers are recorded in PCL. Write-offsand recoveries of amounts previously written off are recorded against ACL.
The ACL represents an unbiased estimate of expected credit losses on our financial assets as at the balance sheet date.Judgment is required in making assumptions and estimations when calculating the ACL, including movements between the threestages and the application of forward looking information. The underlying assumptions and estimates may result in changes tothe provisions from period to period that significantly affect our results of operations.
Measurement of expected credit lossesExpected credit losses are based on a range of possible outcomes and consider all available reasonable and supportableinformation including internal and external ratings, historical credit loss experience, and expectations about future cash flows.The measurement of expected credit losses is based primarily on the product of the instrument’s PD, loss given default (LGD),and EAD discounted to the reporting date. The main difference between Stage 1 and Stage 2 expected credit losses for performingfinancial assets is the respective calculation horizon. Stage 1 estimates project PD, LGD and EAD over a maximum period of 12months while Stage 2 estimates project PD, LGD and EAD over the remaining lifetime of the instrument.
An expected credit loss estimate is produced for each individual exposure. Relevant parameters are modeled on a collectivebasis using portfolio segmentation that allows for appropriate incorporation of forward looking information. To reflect othercharacteristics that are not already considered through modelling, expert credit judgment is exercised in determining the finalexpected credit losses.
For a small percentage of our portfolios which lack detailed historical information and/or loss experience, we applysimplified measurement approaches that may differ from what is described above. These approaches have been designed tomaximize the available information that is reliable and supportable for each portfolio and may be collective in nature.
Expected credit losses are discounted to the reporting period date using the effective interest rate.
Expected lifeFor instruments in Stage 2 or Stage 3, loss allowances reflect expected credit losses over the expected remaining lifetime of theinstrument. For most instruments, the expected life is limited to the remaining contractual life.
An exemption is provided for certain instruments with the following characteristics: (a) the instrument includes both a loanand undrawn commitment component; (b) we have the contractual ability to demand repayment and cancel the undrawncommitment; and (c) our exposure to credit losses is not limited to the contractual notice period. For products in scope of thisexemption, the expected life may exceed the remaining contractual life and is the period over which our exposure to credit lossesis not mitigated by our normal credit risk management actions. This period varies by product and risk category and is estimatedbased on our historical experience with similar exposures and consideration of credit risk management actions taken as part ofour regular credit review cycle. Products in scope of this exemption include credit cards, overdraft balances and certain revolvinglines of credit. Judgment is required in determining the instruments in scope for this exemption and estimating the appropriateremaining life based on our historical experience and credit risk mitigation practices.
Assessment of significant increase in credit riskThe assessment of significant increase in credit risk requires significant judgment. Movements between Stage 1 and Stage 2 arebased on whether an instrument’s credit risk as at the reporting date has increased significantly relative to the date it wasinitially recognized. For the purposes of this assessment, credit risk is based on an instrument’s lifetime PD, not the losses weexpect to incur. The assessment is generally performed at the instrument level.
Our assessment of significant increases in credit risk is performed at least quarterly based on three factors. If any of thefollowing factors indicates that a significant increase in credit risk has occurred, the instrument is moved from Stage 1 to Stage 2:
(1) We have established thresholds for significant increases in credit risk based on both a percentage and absolute changein lifetime PD relative to initial recognition. For our wholesale portfolio, a decrease in the borrower’s risk rating is alsorequired to determine that credit risk has increased significantly.
(2) Additional qualitative reviews are performed to assess the staging results and make adjustments, as necessary, tobetter reflect the positions whose credit risk has increased significantly.
(3) Instruments which are 30 days past due are generally considered to have experienced a significant increase in creditrisk, even if our other metrics do not indicate that a significant increase in credit risk has occurred.
The thresholds for movement between Stage 1 and Stage 2 are symmetrical. After a financial asset has transferred to Stage 2, ifits credit risk is no longer considered to have significantly increased relative to its initial recognition, the financial asset willmove back to Stage 1.
For certain instruments with low credit risk as at the reporting date, it is presumed that credit risk has not increasedsignificantly relative to initial recognition. Credit risk is considered to be low if the instrument has a low risk of default, and theborrower has the ability to fulfill their contractual obligations both in the near term and in the longer term, including periods ofadverse changes in the economic or business environment. Certain interest-bearing deposits with banks, assets purchased underreverse repurchase agreements, insurance policy loans, and liquidity facilities extended to our multi-seller conduits have beenidentified as having low credit risk.
To support our clients through the COVID-19 pandemic, we have launched various relief programs. Utilization of a paymentdeferral program does not, all else being equal, automatically trigger a significant increase in credit risk.
Consolidated Financial Statements Royal Bank of Canada: Annual Report 2020 137

Note 2 Summary of significant accounting policies, estimates and judgments (continued)
Use of forward-looking informationThe measurement of expected credit losses for each stage and the assessment of significant increase in credit risk considersinformation about past events and current conditions as well as reasonable and supportable projections of future events andeconomic conditions. The estimation and application of forward-looking information requires significant judgment.
The PD, LGD and EAD inputs used to estimate Stage 1 and Stage 2 credit loss allowances are modelled based on themacroeconomic variables (or changes in macroeconomic variables) that are most closely correlated with credit losses in therelevant portfolio. Each macroeconomic scenario used in our expected credit loss calculation includes a projection of allrelevant macroeconomic variables used in our models for a five year period, subsequently reverting to long-run averages.Macroeconomic variables used in our expected credit loss models include, but are not limited to, unemployment rates, grossdomestic product growth rates, equity return indices, commodity prices, and Canadian housing prices. Depending on their usagein the models, macroeconomic variables may be projected at a country, province/state or more granular level.
Our estimation of expected credit losses in Stage 1 and Stage 2 is a discounted probability-weighted estimate that considersa minimum of three future macroeconomic scenarios. Our base case scenario is based on macroeconomic forecasts publishedby our internal economics group. Upside and downside scenarios vary relative to our base case scenario based on reasonablypossible alternative macroeconomic conditions. Additional and more severe downside scenarios are designed to capture abroader range of potential credit losses in certain sectors. Scenario design, including the identification of additional downsidescenarios, occurs at least on an annual basis and more frequently if conditions warrant.
Scenarios are designed to capture a wide range of possible outcomes and weighted according to our best estimate of therelative likelihood of the range of outcomes that each scenario represents. Scenario weights take into account historicalfrequency, current trends, and forward-looking conditions and are updated on a quarterly basis. All scenarios considered areapplied to all portfolios subject to expected credit losses with the same probabilities.
Our assessment of significant increases in credit risk is based on changes in probability-weighted forward-looking lifetimePDs as at the reporting date, using the same macroeconomic scenarios as the calculation of expected credit losses.
Definition of defaultThe definition of default used in the measurement of expected credit losses is consistent with the definition of default used forour internal credit risk management purposes. Our definition of default may differ across products and consider bothquantitative and qualitative factors, such as the terms of financial covenants and days past due. For retail and wholesaleborrowers, except as detailed below, default occurs when the borrower is more than 90 days past due on any material obligationto us, and/or we consider the borrower unlikely to make their payments in full without recourse action on our part, such as takingformal possession of any collateral held. For certain credit card balances, default occurs when payments are 180 days past due.For these balances, the use of a period in excess of 90 days past due is reasonable and supported by observable data on write-offand recovery rates experienced on historical credit card portfolios. The definition of default used is applied consistently fromperiod to period and to all financial instruments unless it can be demonstrated that circumstances have changed such thatanother definition of default is more appropriate.
Credit-impaired financial assets (Stage 3)Financial assets are assessed for credit-impairment at each balance sheet date and more frequently when circumstanceswarrant further assessment. Evidence of credit-impairment may include indications that the borrower is experiencing significantfinancial difficulty, probability of bankruptcy or other financial reorganization, as well as a measurable decrease in the estimatedfuture cash flows evidenced by the adverse changes in the payments status of the borrower or economic conditions thatcorrelate with defaults. An asset that is in Stage 3 will move back to Stage 2 when, as at the reporting date, it is no longerconsidered to be credit-impaired. The asset will transfer back to Stage 1 when its credit risk at the reporting date is no longerconsidered to have increased significantly from initial recognition, which could occur during the same reporting period as thetransfer from Stage 3 to Stage 2.
When a financial asset has been identified as credit-impaired, expected credit losses are measured as the differencebetween the asset’s gross carrying amount and the present value of estimated future cash flows discounted at the instrument’soriginal effective interest rate. For impaired financial assets with drawn and undrawn components, expected credit losses alsoreflect any credit losses related to the portion of the loan commitment that is expected to be drawn down over the remaining lifeof the instrument.
When a financial asset is credit-impaired, interest ceases to be recognized on the regular accrual basis, which accruesincome based on the gross carrying amount of the asset. Rather, interest income is calculated by applying the original effectiveinterest rate to the amortized cost of the asset, which is the gross carrying amount less the related ACL. Following impairment,interest income is recognized on the unwinding of the discount from the initial recognition of impairment.
ACL for credit-impaired loans in Stage 3 are established at the borrower level, where losses related to impaired loans areidentified on individually significant loans, or collectively assessed and determined through the use of portfolio-based rates,without reference to particular loans.
Individually assessed loans (Stage 3)When individually significant loans are identified as impaired, we reduce the carrying value of the loans to their estimatedrealizable value by recording an individually assessed ACL to cover identified credit losses. The individually assessed ACLreflects the expected amount of principal and interest calculated under the terms of the original loan agreement that will not berecovered, and the impact of time delays in collecting principal and/or interest (time value of money). The estimated realizablevalue for each individually significant loan is the present value of expected future cash flows discounted using the originaleffective interest rate for each loan. When the amounts and timing of future cash flows cannot be estimated with reasonablereliability, the estimated realizable amount may be determined using observable market prices for comparable loans, the fairvalue of collateral underlying the loans, and other reasonable and supported methods based on management judgment.
Individually-assessed allowances are established in consideration of a range of possible outcomes, which may includemacroeconomic or non-macroeconomic scenarios, to the extent relevant to the circumstances of the specific borrower beingassessed. Assumptions used in estimating expected future cash flows reflect current and expected future economic conditionsand are generally consistent with those used in Stage 1 and Stage 2 measurement.
138 Royal Bank of Canada: Annual Report 2020 Consolidated Financial Statements

Significant judgment is required in assessing evidence of credit-impairment and estimation of the amount and timing offuture cash flows when determining expected credit losses. Changes in the amount expected to be recovered would have a directimpact on PCL and may result in a change in the ACL.
Collectively assessed loans (Stage 3)Loans that are collectively assessed are grouped on the basis of similar risk characteristics, taking into account loan type,industry, geographic location, collateral type, past due status and other relevant factors.
The collectively-assessed ACL reflects: (i) the expected amount of principal and interest calculated under the terms of theoriginal loan agreement that will not be recovered, and (ii) the impact of time delays in collecting principal and/or interest (timevalue of money).
The expected principal and interest collection is estimated on a portfolio basis and references historical loss experience ofcomparable portfolios with similar credit risk characteristics, adjusted for the current environment and expected futureconditions. A portfolio specific coverage ratio is applied against the impaired loan balance in determining the collectively-assessed ACL. The time value of money component is calculated by using the discount factors applied to groups of loans sharingcommon characteristics. The discount factors represent the expected recovery pattern of the comparable group of loans, andreflect the historical experience of these groups adjusted for current and expected future economic conditions and/or industryfactors. Significant judgment is required in assessing evidence of impairment and estimation of the amount and timing of futurecash flows when determining expected credit losses. Changes in the amount expected to be recovered would have a directimpact on PCL and may result in a change in the ACL.
Write-off of loansLoans and the related ACL are written off, either partially or in full, when there is no realistic prospect of recovery. Where loansare secured, they are generally written off after receipt of any proceeds from the realization of collateral. In circumstances wherethe net realizable value of any collateral has been determined and there is no reasonable expectation of further recovery, writeoff may be earlier. For credit cards, the balances and related ACL are generally written off when payment is 180 days past due.Personal loans are generally written off at 150 days past due.
ModificationsThe original terms of a financial asset may be renegotiated or otherwise modified, resulting in changes to the contractual termsof the financial asset that affect the contractual cash flows. The treatment of such modifications is primarily based on theprocess undertaken to execute the renegotiation and the nature and extent of the expected changes. In the normal course ofbusiness, modifications which are performed for credit reasons, primarily related to troubled debt restructurings, are generallytreated as modifications of the original financial asset. Modifications which are performed for other than credit reasons aregenerally considered to be an expiry of the original cash flows; accordingly, such renegotiations are treated as a derecognition ofthe original financial asset and recognition of a new financial asset.
Due to the impact of the COVID-19 pandemic, we have established relief programs to help personal and business bankingclients manage the challenges of the COVID-19 pandemic through payment deferrals, interest rate reductions, covenant waivers,and refinancing or credit restructuring. In some cases, the original terms of the associated financial asset are renegotiated orotherwise modified, resulting in changes to the contractual terms of the financial asset that affect the contractual cash flows. Forthese programs, where there is a substantial change in terms from the original financial asset, we derecognize the financial assetand recognize a new financial asset.
If a modification of terms does not result in derecognition of the financial asset, the carrying amount of the financial asset isrecalculated as the present value of the renegotiated or modified contractual cash flows, discounted at the original effectiveinterest rate and a gain or loss is recognized. The financial asset continues to be subject to the same assessments for significantincrease in credit risk relative to initial recognition and credit-impairment, as described above. A modified financial asset willtransfer out of Stage 3 if the conditions that led to it being identified as credit-impaired are no longer present and relateobjectively to an event occurring after the original credit-impairment was recognized. A modified financial asset will transfer outof Stage 2 when it no longer satisfies the relative thresholds set to identify significant increases in credit risk, which are based onchanges in its lifetime PD, days past due and other qualitative considerations. The financial asset continues to be monitored forsignificant increases in credit risk and credit-impairment.
If a modification of terms results in derecognition of the original financial asset and recognition of the new financial asset,the new financial asset will generally be recorded in Stage 1, unless it is determined to be credit-impaired at the time of therenegotiation. For the purposes of assessing for significant increases in credit risk, the date of initial recognition for the newfinancial asset is the date of the modification.
DerivativesWhen derivatives are embedded in other financial instruments or host contracts, such combinations are known as hybridinstruments. Some of the cash flows of a hybrid instrument vary in a way similar to a stand-alone derivative. If the host contractis a financial asset within the scope of IFRS 9, the classification and measurement criteria are applied to the entire hybridinstrument as described in the Classification of financial assets section of Note 2. If the host contract is a financial liability or anasset that is not within the scope of IFRS 9, embedded derivatives are separately recognized if the economic characteristics andrisks of the embedded derivative are not clearly and closely related to the host contract, unless an election has been made toelect the fair value option, as described above. The host contract is accounted for in accordance with the relevant standards.
Derivatives are primarily used in trading activities. Derivatives are also used to manage our exposure to interest, currency,credit and other market risks. The most frequently used derivative products are interest rate and foreign exchange swaps,options, futures and forward rate agreements, equity swaps and credit derivatives. All derivative instruments are recorded on ourConsolidated Balance Sheets at fair value.
When derivatives are used in trading activities, the realized and unrealized gains and losses on these derivatives arerecognized in Trading revenue in Non-interest income. Derivatives with positive fair values are reported as Derivative assets andderivatives with negative fair values are reported as Derivative liabilities. In accordance with our policy for offsetting financialassets and financial liabilities, the net fair value of certain derivative assets and liabilities are reported as an asset or liability, asappropriate. Valuation adjustments are included in the fair value of Derivative assets and Derivative liabilities. Premiums paidand premiums received are shown in Derivative assets and Derivative liabilities, respectively.
Consolidated Financial Statements Royal Bank of Canada: Annual Report 2020 139

Note 2 Summary of significant accounting policies, estimates and judgments (continued)
When derivatives are used to manage our own exposures, we determine for each derivative whether hedge accounting canbe applied, as discussed in the Hedge accounting section below.
Derecognition of financial assetsFinancial assets are derecognized from our Consolidated Balance Sheets when our contractual rights to the cash flows from theassets have expired, when we retain the rights to receive the cash flows of the assets but assume an obligation to pay those cashflows to a third party subject to certain pass-through requirements or when we transfer our contractual rights to receive the cashflows and substantially all of the risk and rewards of the assets have been transferred. When we retain substantially all of therisks and rewards of the transferred assets, the transferred assets are not derecognized from our Consolidated Balance Sheetsand are accounted for as secured financing transactions. When we neither retain nor transfer substantially all risks and rewardsof ownership of the assets, we derecognize the assets if control over the assets is relinquished. If we retain control over thetransferred assets, we continue to recognize the transferred assets to the extent of our continuing involvement.
Management’s judgment is applied in determining whether the contractual rights to the cash flows from the transferredassets have expired or whether we retain the rights to receive cash flows on the assets but assume an obligation to pay for thosecash flows. We derecognize transferred financial assets if we transfer substantially all the risks and rewards of the ownership inthe assets. When assessing whether we have transferred substantially all of the risk and rewards of the transferred assets,management considers the Bank’s exposure before and after the transfer with the variability in the amount and timing of the netcash flows of the transferred assets. In transfers in which we retain the servicing rights, management has applied judgment inassessing the benefits of servicing against market expectations. When the benefits of servicing are greater than fair value, aservicing asset is recognized in Other assets in our Consolidated Balance Sheets. When the benefits of servicing are less than fairvalue, a servicing liability is recognized in Other liabilities in our Consolidated Balance Sheets.
Derecognition of financial liabilitiesWe derecognize a financial liability from our Consolidated Balance Sheets when our obligation specified in the contract expires,or is discharged or cancelled. We recognize the difference between the carrying amount of a financial liability transferred and theconsideration paid in our Consolidated Statements of Income.
InterestInterest is recognized in Interest income and Interest expense in the Consolidated Statements of Income for all interest-bearingfinancial instruments. The effective interest rate is the rate that discounts estimated future cash flows over the expected life ofthe financial asset or liability to the net carrying amount upon initial recognition. Significant judgment is applied in determiningthe effective interest rate due to uncertainty in the timing and amounts of future cash flows.
Dividend incomeDividend income is recognized when the right to receive payment is established. This is the ex-dividend date for listed equitysecurities, and usually the date when shareholders have approved the dividend for unlisted equity securities.
Transaction costsTransaction costs are expensed as incurred for financial instruments classified or designated as FVTPL. For other financialinstruments, transaction costs are capitalized on initial recognition. For financial assets and financial liabilities measured atamortized cost, capitalized transaction costs are amortized through net income over the estimated life of the instrument usingthe effective interest method. For financial assets measured at FVOCI that do not have fixed or determinable payments and nofixed maturity, capitalized transaction costs are recognized in net income when the asset is derecognized or becomes impaired.
Offsetting financial assets and financial liabilitiesFinancial assets and financial liabilities are offset on the balance sheet when there exists both a legally enforceable right to offsetthe recognized amounts and an intention to settle on a net basis, or realize the asset and settle the liability simultaneously.
Assets purchased under reverse repurchase agreements and sold under repurchase agreementsWe purchase securities under agreements to resell (reverse repurchase agreements) and take possession of these securities. Wemonitor the market value of the securities purchased and additional collateral is obtained when appropriate. We have the rightto liquidate the collateral held in the event of counterparty default. Reverse repurchase agreements are treated as collateralizedlending transactions. We also sell securities under agreements to repurchase (repurchase agreements), which are treated ascollateralized borrowing transactions. The securities received under reverse repurchase agreements and securities deliveredunder repurchase agreements are not recognized on, or derecognized from, our Consolidated Balance Sheets, respectively,unless the risks and rewards of ownership are obtained or relinquished.
Reverse repurchase agreements and repurchase agreements are carried on our Consolidated Balance Sheets at theamounts at which the securities were initially acquired or sold, except when they are classified or designated as FVTPL and arerecorded at fair value. Interest earned on reverse repurchase agreements is included in Interest income, and interest incurred onrepurchase agreements is included in Interest expense in our Consolidated Statements of Income. Changes in fair value forreverse repurchase agreements and repurchase agreements designated as FVTPL are included in Trading revenue or Other inNon-interest income.
Hedge accountingWe have elected to continue to apply the hedge accounting principles under IAS 39 instead of those under IFRS 9.
We use derivatives and non-derivatives in our hedging strategies to manage our exposure to interest rate, currency, creditand other market risks. Where hedge accounting can be applied, a hedge relationship is designated and documented at inceptionto detail the particular risk management objective and strategy for undertaking the hedge transaction. The documentationidentifies the specific asset, liability or anticipated cash flows being hedged, the risk that is being hedged, the type of hedging
140 Royal Bank of Canada: Annual Report 2020 Consolidated Financial Statements

instrument used and how effectiveness will be assessed. We assess, both at the inception of the hedge and on an ongoing basis,whether the hedging instruments are ‘highly effective’ in offsetting changes in the fair value or cash flows of the hedged items. Ahedge is regarded as highly effective only if the following criteria are met: (i) at inception of the hedge and throughout its life, thehedge is expected to be highly effective in achieving offsetting changes in fair value or cash flows attributable to the hedged risk,and (ii) actual results of the hedge are within a pre-determined range. We perform effectiveness testing to demonstrate that therelationship has been and is expected to be effective over the remaining term of the hedge. In the case of hedging a forecasttransaction, the transaction must have a high probability of occurring and must present an exposure to variations in cash flowsthat could ultimately affect the reported net profit or loss. Hedge accounting is discontinued when it is determined that thehedging instrument is no longer effective as a hedge, the hedging instrument or hedged item is terminated or sold, or the forecasttransaction is no longer deemed highly probable. Refer to Note 8 for the fair value of derivatives and non-derivative instrumentscategorized by their hedging relationships, as well as derivatives that are not designated in hedging relationships.
While uncertainty due to the Reform exists on hedging relationships to which the Amendments are applied, beginning onNovember 1, 2019, our prospective effectiveness testing is based on existing hedged cash flows or hedged risks. Anyineffectiveness arising from retrospective testing is recognized in net income, rather than discontinuing the hedge as long asother hedge accounting requirements are met.
Fair value hedgesIn a fair value hedging relationship, the carrying value of the hedged item is adjusted for changes in fair value attributable to thehedged risk and recognized in Non-interest income. Changes in fair value of the hedged item, to the extent that the hedgingrelationship is effective, are offset by changes in the fair value of the hedging derivative, which are also recognized inNon-interest income. When hedge accounting is discontinued, the carrying value of the hedged item is no longer adjusted and thecumulative fair value adjustments to the carrying value of the hedged items are amortized to Net income over the expectedremaining life of the hedged items.
We predominantly use interest rate swaps to hedge our exposure to changes in a fixed interest rate instrument’s fair valuecaused by changes in interest rates. As a result of adopting the Amendments, beginning on November 1, 2019, while theuncertainty due to the Reform exists, we apply hedge accounting to IBOR rates which may not be contractually specified whenthat rate is separately identifiable and reliably measurable at inception of the hedge relationship.
Cash flow hedgesIn a cash flow hedging relationship, the effective portion of the change in the fair value of the hedging derivative, net of taxes, isrecognized in OCI and reclassified to profit or loss as the associated hedged forecast transaction occurs, while the ineffectiveportion is recognized in Non-interest income. When hedge accounting is discontinued, the cumulative amounts previouslyrecognized in Other components of equity are reclassified to Net interest income during the periods when the variability in thecash flows of the hedged item affects Net interest income. Unrealized gains and losses on derivatives are reclassifiedimmediately to Net income when the hedged item is sold or terminated early, or when the forecast transaction is no longerexpected to occur.
While uncertainty due to the Reform exists, beginning on November 1, 2019, we apply the relief provided by the Amendmentsthat the IBOR benchmarks, on which the highly probable hedged cash flows are based, are not altered as a result of the Reform.In addition, associated cash flow hedge reserves are not recycled into net income solely due to changes related to the transitionfrom IBOR to new risk free rates.
We predominantly use interest rate swaps to hedge the variability in cash flows related to a variable-rate asset or liability.
Net investment hedgesIn hedging our foreign currency exposure to a net investment in a foreign operation, the effective portion of foreign exchangegains and losses on the hedging instruments, net of applicable taxes, is recognized in OCI and the ineffective portion isrecognized in Non-interest income. The amounts, or a portion thereof, previously recognized in Other components of equity arerecognized in Net income on the disposal, or partial disposal, of the foreign operation.
We use foreign exchange contracts and foreign currency-denominated liabilities to manage our foreign currency exposuresto net investments in foreign operations having a functional currency other than the Canadian dollar.
GuaranteesFinancial guarantee contracts are contracts that contingently require us to make specified payments (in cash, other assets, ourown shares or provision of services) to reimburse the holder for a loss it incurs because a specified debtor fails to make paymentwhen due in accordance with the original or modified terms of a debt instrument. Liabilities are recognized on our ConsolidatedBalance Sheets at the inception of a guarantee for the fair value of the obligation undertaken in issuing the guarantee. Financialguarantees are subsequently remeasured at the higher of (i) the amount of expected credit losses and (ii) the amount initiallyrecognized less, when appropriate, the cumulative amount of income recognized.
If the financial guarantee contract meets the definition of a derivative, it is measured at fair value at each balance sheetdate and reported under Derivatives on our Consolidated Balance Sheets.
Insurance and segregated fundsPremiums from long-duration contracts, primarily life insurance, are recognized when due in Non-interest income – Insurancepremiums, investment and fee income. Premiums from short-duration contracts, primarily property and casualty, and fees foradministrative services are recognized in Insurance premiums, investment and fee income over the related contract period.Unearned premiums of the short-duration contracts, representing the unexpired portion of premiums, are reported in Otherliabilities. Investments made by our insurance operations are classified as FVOCI instruments and amortized cost instruments,except for investments supporting the policy benefit liabilities on life and health insurance contracts and a portion of propertyand casualty contracts. These are designated as FVTPL with changes in fair value reported in Insurance premiums, investmentand fee income.
Insurance claims and policy benefit liabilities represent current claims and estimates for future insurance policy benefits.Liabilities for life insurance contracts are determined using the Canadian Asset Liability Method (CALM), which incorporatesassumptions for mortality, morbidity, policy lapses and surrenders, investment yields, policy dividends, operating and policy
Consolidated Financial Statements Royal Bank of Canada: Annual Report 2020 141

Note 2 Summary of significant accounting policies, estimates and judgments (continued)
maintenance expenses and provisions for adverse deviation. These assumptions are reviewed at least annually and updated inresponse to actual experience and market conditions. Liabilities for property and casualty insurance represent estimatedprovisions for reported and unreported claims. Liabilities for life and property and casualty insurance are included in Insuranceclaims and policy benefit liabilities. Changes in Insurance claims and policy benefit liabilities are included in the Insurancepolicyholder benefits, claims and acquisition expense in our Consolidated Statements of Income in the period in which theestimates change.
Premiums ceded for reinsurance and reinsurance recoveries on policyholder benefits and claims incurred are reported inincome and expense as appropriate. Reinsurance recoverables, which relate to paid benefits and unpaid claims, are included inOther assets.
Acquisition costs for new insurance contracts consist of commissions, premium taxes, certain underwriting costs and othercosts that vary with the acquisition of new contracts. Deferred acquisition costs for life insurance products are implicitlyrecognized in Insurance claims and policy benefit liabilities by CALM. For property and casualty insurance, these costs areclassified as Other assets and amortized over the policy term.
Segregated funds are lines of business in which we issue an insurance contract where the benefit amount is directly linked tothe market value of the investments held in the underlying fund. The contractual arrangement is such that the underlyingsegregated fund assets are registered in our name but the segregated fund policyholders bear the risks and rewards of the funds’investment performance. Liabilities for these contracts are calculated based on contractual obligations using actuarialassumptions and are at least equivalent to the surrender or transfer value calculated by reference to the value of the relevantunderlying funds or indices. Segregated funds’ assets and liabilities are separately presented on our Consolidated BalanceSheets. As the segregated fund policyholders bear the risks and rewards of the funds’ performance, investment income earned bythe segregated funds and expenses incurred by the segregated funds are offset and are not separately presented in ourConsolidated Statements of Income. Fee income we earn from segregated funds includes management fees, mortality, policyadministration and surrender charges, and these fees are recorded in Non-interest income – Insurance premiums, investmentand fee income. We provide minimum death benefit and maturity value guarantees on segregated funds. The liability associatedwith these minimum guarantees is recorded in Insurance claims and policy benefit liabilities.
Liability adequacy tests are performed for all insurance contract portfolios at each balance sheet date to ensure the adequacyof insurance contract liabilities. Current best estimates of future contractual cash flows, claims handling and administration costs,and investment returns from the assets backing the liabilities are taken into account in the tests. When the test results indicate thatthere is a deficiency in liabilities, the deficiency is charged immediately to our Consolidated Statements of Income by writing downthe deferred acquisition costs in Other assets and/or increasing Insurance claims and policy benefit liabilities.
Employee benefits – Pensions and other post-employment benefitsOur defined benefit pension expense, which is included in Non-interest expense – Human resources, consists of the cost ofemployee pension benefits for the current year’s service, net interest on the net defined benefit liability (asset), past service costand gains or losses on settlement. Remeasurements of the net defined benefit obligation, which comprise actuarial gains andlosses and return on plan assets (excluding amounts included in net interest on the net defined benefit liability), are recognizedimmediately in OCI in the period in which they occur. Actuarial gains and losses comprise experience adjustments (the effects ofdifferences between the previous actuarial assumptions and what has actually occurred), as well as the effects of changes inactuarial assumptions. Amounts recognized in OCI will not be reclassified subsequently to net income. Past service cost is thechange in the present value of the defined benefit obligation resulting from a plan amendment or curtailment and is chargedimmediately to income.
For each defined benefit pension plan, we recognize the present value of our defined benefit obligations less the fair value ofthe plan assets as a defined benefit liability reported in Other liabilities – Employee benefit liabilities on our ConsolidatedBalance Sheets. For plans where there is a net defined benefit asset, the amount is reported as an asset in Other assets –Employee benefit assets on our Consolidated Balance sheets.
The calculation of defined benefit expenses and obligations requires significant judgment as the recognition is dependent ondiscount rates and various actuarial assumptions such as healthcare cost trend rates, projected salary increases, retirement ageand mortality and termination rates. Due to the long-term nature of these plans, such estimates and assumptions are subject toinherent risks and uncertainties. For our pension and other post-employment benefit plans, the discount rate is determined byreference to market yields on high quality corporate bonds. Since the discount rate is based on currently available yields, andinvolves management’s assessment of market liquidity, it is only a proxy for future yields. Actuarial assumptions, set inaccordance with current practices in the respective countries of our plans, may differ from actual experience as country specificstatistics are only estimates of future employee behaviour. These assumptions are determined by management and are reviewedby actuaries at least annually. Changes to any of the above assumptions may affect the amounts of benefits obligations,expenses and remeasurements that we recognize.
Our contributions to defined contribution pension plans are expensed when employees have rendered services in exchangefor such contributions. Defined contribution pension expense is included in Non-interest expense – Human resources.
Share-based compensationWe offer share-based compensation plans to certain key employees and to our non-employee directors.
To account for stock options granted to employees, compensation expense is recognized over the applicable vesting periodwith a corresponding increase in equity. Fair value is determined by using option valuation models, which take into account theexercise price of the option, the current share price, the risk free interest rate, the expected volatility of the share price over thelife of the option and other relevant factors. When the options are exercised, the exercise price proceeds together with theamount initially recorded in equity are credited to common shares. Our other share-based compensation plans includeperformance deferred share plans and deferred share unit plans for key employees (the Plans). The obligations for the Plans areaccrued over their vesting periods. The Plans are settled in cash.
For cash-settled awards, our accrued obligations are adjusted to their fair value at each balance sheet date. For share-settled awards, our expected obligations recognized in equity are based on the fair value of our common shares at the date ofgrant. Changes in our obligations, net of related hedges, are recorded as Non-interest expense – Human resources in our
142 Royal Bank of Canada: Annual Report 2020 Consolidated Financial Statements

Consolidated Statements of Income with a corresponding increase in Other liabilities for cash-settled awards and in Retainedearnings for share-settled awards. Compensation expense is recognized in the year the awards are earned by plan participantsbased on the vesting schedule of the relevant plans, net of estimated forfeitures.
The compensation cost attributable to options and awards granted to employees who are eligible to retire or will becomeeligible to retire during the vesting period, is recognized immediately if the employee is eligible to retire on the grant date or overthe period between the grant date and the date the employee becomes eligible to retire.
Our contributions to the employee savings and share ownership plans are expensed as incurred.
Income taxesIncome tax comprises current tax and deferred tax and is recognized in our Consolidated Statements of Income except to theextent that it relates to items recognized directly in equity, in which case it is recognized in equity.
Current income tax payable on profits is recognized as an expense based on the applicable tax laws in each jurisdiction inthe period in which profits arise, calculated using tax rates enacted or substantively enacted by the balance sheet date. Deferredtax is recognized on temporary differences between the carrying amounts of assets and liabilities for accounting and taxpurposes. A deferred income tax asset or liability is determined for each temporary difference, except for earnings related to oursubsidiaries, branches, associates and interests in joint ventures where the temporary differences will not reverse in theforeseeable future and we have the ability to control the timing of reversal. Deferred tax assets and liabilities are determinedbased on the tax rates that are expected to be in effect in the period that the asset is realized or the liability is settled, based ontax rates and tax laws that have been enacted or substantively enacted at the balance sheet date. Current tax assets andliabilities are offset when they are levied by the same taxation authority on either the same taxable entity or different taxableentities within the same tax reporting group (which intends to settle on a net basis), and when there is a legal right to offset.Deferred tax assets and liabilities are offset when the same conditions are satisfied. Our Consolidated Statements of Incomeinclude items that are non-taxable or non-deductible for income tax purposes and, accordingly, this causes the income taxprovision to be different from what it would be if based on statutory rates.
Deferred income taxes accumulated as a result of temporary differences and tax loss carryforwards are included in Otherassets and Other liabilities. On a quarterly basis, we review our deferred income tax assets to determine whether it is probablethat the benefits associated with these assets will be realized; this review involves evaluating both positive and negativeevidence.
We are subject to income tax laws in various jurisdictions where we operate, and the complex tax laws are potentiallysubject to different interpretations by us and the relevant taxation authorities. Significant judgment is required in theinterpretation of the relevant tax laws and in assessing the probability of acceptance of our tax positions to determine our taxprovision, which includes our best estimate of uncertain tax positions that are under audit or appeal by the relevant taxauthorities. We perform a review on a quarterly basis to incorporate our best assessment based on information available, butadditional liability and income tax expense could result based on the acceptance of our tax positions by the relevant taxauthorities.
The determination of our deferred tax asset or liability also requires significant management judgment as the recognition isdependent on our projection of future taxable profits and tax rates that are expected to be in effect in the period the asset isrealized or the liability is settled. Any changes in our projection will result in changes in deferred tax assets or liabilities on ourConsolidated Balance Sheets, and also deferred tax expense on our Consolidated Statements of Income.
Business combinations, goodwill and other intangiblesAll business combinations are accounted for using the acquisition method. Non-controlling interests, if any, are recognized attheir proportionate share of the fair value of identifiable assets and liabilities, unless otherwise indicated. Identifiable intangibleassets are recognized separately from goodwill and included in Other intangibles. Goodwill represents the excess of the pricepaid for the business acquired over the fair value of the net identifiable assets acquired on the date of acquisition.
GoodwillGoodwill is allocated to cash-generating units or groups of cash-generating units for the purpose of impairment testing, which isundertaken at the lowest level at which goodwill is monitored for internal management purposes. Impairment testing isperformed annually as at August 1, or more frequently if there are objective indicators of impairment, by comparing therecoverable amount of a cash-generating unit (CGU) with its carrying amount. The recoverable amount of a CGU is the higher ofits value in use and its fair value less costs of disposal. Value in use is the present value of the expected future cash flows from aCGU. Fair value less costs of disposal is the amount obtainable from the sale of a CGU in an orderly transaction between marketparticipants, less disposal costs. The fair value of a CGU is estimated using valuation techniques such as a discounted cash flowmethod, adjusted to reflect the considerations of a prospective third-party buyer. External evidence such as binding saleagreements or recent transactions for similar businesses within the same industry is considered to the extent that it is available.
Significant judgment is involved in estimating the model inputs used to determine the recoverable amount of our CGUs, inparticular future cash flows, discount rates and terminal growth rates, due to the uncertainty in the timing and amount of cashflows and the forward-looking nature of these inputs. Future cash flows are based on financial plans agreed by managementwhich are estimated based on forecast results, business initiatives, planned capital investments and returns to shareholders.Discount rates are based on the bank-wide cost of capital, adjusted for CGU-specific risks and currency exposure as reflected bydifferences in expected inflation. Bank-wide cost of capital is based on the Capital Asset Pricing Model. CGU-specific risks includecountry risk, business/operational risk, geographic risk (including political risk, devaluation risk, and government regulation),currency risk, and price risk (including product pricing risk and inflation). Terminal growth rates reflect the expected long-termgross domestic product growth and inflation for the countries within which the CGU operates. Changes in these assumptions mayimpact the amount of impairment loss recognized in Non-interest expense.
The carrying amount of a CGU includes the carrying amount of assets, liabilities and goodwill allocated to the CGU. If therecoverable amount is less than the carrying value, the impairment loss is allocated first to reduce the carrying amount of anygoodwill allocated to the CGU and then to the other non-financial assets of the CGU proportionately based on the carryingamount of each asset. Any impairment loss is charged to income in the period in which the impairment is identified. Goodwill isstated at cost less accumulated impairment losses. Subsequent reversals of goodwill impairment are prohibited.
Consolidated Financial Statements Royal Bank of Canada: Annual Report 2020 143

Note 2 Summary of significant accounting policies, estimates and judgments (continued)
Upon disposal of a portion of a CGU, the carrying amount of goodwill related to the portion of the CGU sold is included in thedetermination of gains or losses on disposal. The carrying amount is determined based on the relative fair value of the disposedportion to the total CGU.
Other intangiblesIntangible assets represent identifiable non-monetary assets and are acquired either separately or through a businesscombination, or generated internally. Intangible assets acquired through a business combination are recognized separately fromgoodwill when they are separable or arise from contractual or other legal rights, and their fair value can be measured reliably.The cost of a separately acquired intangible asset includes its purchase price and directly attributable costs of preparing theasset for its intended use. In respect of internally generated intangible assets, cost includes all directly attributable costsnecessary to create, produce, and prepare the asset to be capable of operating in the manner intended by management.Research and development costs that are not eligible for capitalization are expensed. After initial recognition, an intangible assetis carried at its cost less any accumulated amortization and accumulated impairment losses, if any. Intangible assets with afinite-life are amortized on a straight-line basis over their estimated useful lives as follows: computer software – 3 to 10 years;and customer relationships – 10 to 20 years. We do not have any intangible assets with indefinite lives.
Intangible assets are assessed for indicators of impairment at each reporting period. If there is an indication that anintangible asset may be impaired, an impairment test is performed by comparing the carrying amount of the intangible asset toits recoverable amount. Where it is not possible to estimate the recoverable amount of an individual asset, we estimate therecoverable amount of the CGU to which the asset belongs. If the recoverable amount of the asset (or CGU) is less than itscarrying amount, the carrying amount of the intangible asset is written down to its recoverable amount as an impairment loss.
An impairment loss recognized previously is reversed if there is a change in the estimates used to determine the recoverableamount of the asset (or CGU) since the last impairment loss was recognized. If an impairment loss is subsequently reversed, thecarrying amount of the asset (or CGU) is revised to the lower of its recoverable amount and the carrying amount that would havebeen determined (net of amortization) had there been no prior impairment.
Due to the subjective nature of these estimates, significant judgment is required in determining the useful lives andrecoverable amounts of our intangible assets, and assessing whether certain events or circumstances constitute objectiveevidence of impairment. Estimates of the recoverable amounts of our intangible assets rely on certain key inputs, includingfuture cash flows and discount rates. Future cash flows are based on sales projections and allocated costs which are estimatedbased on forecast results and business initiatives. Discount rates are based on the bank-wide cost of capital, adjusted for asset-specific risks. Changes in these assumptions may impact the amount of impairment loss recognized in Non-interest expense.
OtherTranslation of foreign currenciesMonetary assets and liabilities denominated in foreign currencies are translated into Canadian dollars at rates prevailing at thebalance sheet date. Foreign exchange gains and losses resulting from the translation and settlement of these items arerecognized in Non-interest income in the Consolidated Statements of Income.
Non-monetary assets and liabilities that are measured at historical cost are translated into Canadian dollars at historicalrates.
Assets and liabilities of our foreign operations with functional currencies other than Canadian dollars are translated intoCanadian dollars at rates prevailing at the balance sheet date, and income and expenses of these foreign operations aretranslated at average rates of exchange for the reporting period.
Unrealized gains or losses arising as a result of the translation of our foreign operations along with the effective portion ofrelated hedges are reported in Other components of equity on an after-tax basis. Upon disposal or partial disposal of a foreignoperation, an appropriate portion of the accumulated net translation gains or losses is included in Non-interest income.
Premises and equipmentPremises and equipment includes land, buildings, leasehold improvements, computer equipment, furniture, fixtures and otherequipment, and are stated at cost less accumulated depreciation, except for land which is not depreciated, and accumulatedimpairment losses. Cost comprises the purchase price, any costs directly attributable to bringing the asset to the location andcondition necessary for its intended use, and the initial estimate of any disposal costs. Depreciation is recorded principally on astraight-line basis over the estimated useful lives of the assets, which are 25 to 50 years for buildings, 3 to 10 years for computerequipment, and 5 to 10 years for furniture, fixtures and other equipment. The amortization period for leasehold improvements isthe lesser of the useful life of the leasehold improvements or the lease term plus the first renewal period, if reasonably assuredof renewal, up to a maximum of 10 years. Depreciation methods, useful lives, and residual values are reassessed at eachreporting period and adjusted as appropriate. Gains and losses on disposal are recorded in Non-interest income.
Premises and equipment are assessed for indicators of impairment at each reporting period. If there is an indication that anasset may be impaired, an impairment test is performed by comparing the asset’s carrying amount to its recoverable amount.
After the recognition of impairment, the depreciation charge is adjusted in future periods to reflect the asset’s revisedcarrying amount. If an impairment is later reversed, the carrying amount of the asset is revised to the lower of the asset’srecoverable amount and the carrying amount that would have been determined (net of depreciation) had there been no priorimpairment loss. The depreciation charge in future periods is adjusted to reflect the revised carrying amount.
Beginning on November 1, 2019, Premises and equipment includes right-of-use assets due to the adoption of IFRS 16.
Leasing – Policies applicable beginning November 1, 2019 (IFRS 16)At inception of a contract, we assess whether a contract is or contains a lease. A contract is, or contains, a lease if the contractconveys the right to obtain substantially all of the economic benefits from, and direct the use of, an identified asset for a periodof time in return for consideration.
When we are the lessee in a lease arrangement, we initially record a right-of-use asset and corresponding lease liability,except for short-term leases and leases of low-value assets. Short-term leases are leases with a lease term of 12 months or less.
144 Royal Bank of Canada: Annual Report 2020 Consolidated Financial Statements

Low-value assets are unspecialized, common, technologically unsophisticated, widely available, and widely used non-infrastructure assets. For short-term leases and leases of low-value assets, we record the lease payments as an operatingexpense on a straight-line basis over the lease term.
Where we are reasonably certain to exercise extension and termination options, they are included in the lease term.The lease liability is initially measured at the present value of the lease payments that are not paid at the commencement
date, discounted at our incremental borrowing rate. The lease liability is subsequently measured at amortized cost using theeffective interest method, recorded in Interest expense.
The right-of-use asset is initially measured based on the initial amount of the lease liability, adjusted for lease paymentsmade on or before the commencement date, initial direct costs incurred, and an estimate of costs to dismantle, remove, orrestore the asset, less any lease incentives received.
The right-of-use asset is depreciated to the earlier of the lease term and the useful life, unless ownership will transfer to RBCor we are reasonably certain to exercise a purchase option, in which case the useful life of the right-of-use asset is used. Weapply IAS 36 Impairment of assets to determine whether a right-of-use asset is impaired and account for any identifiedimpairment loss as described in the premises and equipment accounting policies above.
Impact of adoption of IFRS 16 – Leases previously classified as operating leasesAs a result of the adoption of IFRS 16, we increased total assets by $5,084 million and total liabilities by $5,191 million, primarilyrepresenting leases of premises and equipment previously classified as operating leases, and reduced retained earnings by$107 million, net of taxes. The adoption of IFRS 16 reduced our CET 1 capital ratio by 14 bps.
At transition, lease liabilities were measured at the present value of the remaining lease payments, discounted at ourincremental borrowing rate as at November 1, 2019. We applied a weighted-average incremental borrowing rate of 2.3%. Right-of-use assets are generally measured at an amount equal to the lease liability, adjusted by any prepaid or accrued lease payments.For a select number of properties, the right-of-use assets were measured as if IFRS 16 had been applied since the commencementdate of the lease, discounted using our incremental borrowing rate as at November 1, 2019. The following practical expedientswere adopted when applying IFRS 16 to leases previously classified as operating leases under IAS 17:
• Election to not separate lease and non-lease components, applied to our real estate leases; and• Exemption from recognition for short-term and low value leases.
The following table reconciles our operating lease commitments at October 31, 2019 to the lease obligations recognized on initialapplication of IFRS 16 at November 1, 2019.
(Millions of Canadian dollars)
Lease commitments disclosed as at October 31, 2019 $ 6,175Less: commitments related to non-recoverable tax (360)Less: commitments for contracts not yet commenced (240)Less: recognition exemption adopted for short-term and low-value leases (83)Plus: commitments for renewal options reasonably certain to be exercised 977Other (26)
Adjusted operating lease commitments as at October 31, 2019 6,443
Discounted as at November 1, 2019 5,557Finance lease liabilities recognized as at October 31, 2019 49
Lease liabilities recognized as at November 1, 2019 $ 5,606
Impact of adoption of IFRS 16 – Leases previously classified as finance leasesThe carrying amount of the right-of-use asset and lease liability at November 1, 2019 for leases previously classified as financeleases under IAS 17 Leases was determined to be equal to the carrying amount of the lease asset and liability under IAS 17immediately before the transition date.
Leasing – Policies applicable prior to November 1, 2019 (IAS 17)A lease is an agreement whereby the lessor conveys to the lessee the right to use an asset for an agreed upon period of time inreturn for a payment or series of payments. A finance lease is a lease that transfers substantially all the risks and rewardsincidental to ownership of the leased asset to the lessee, where title may or may not eventually be transferred. An operatinglease is a lease other than a finance lease.
Operating leasesWhen we are the lessee in an operating lease, we record rental payments on a straight-line basis over the lease term in Non-interest expense.
Finance leasesWhen we are the lessee in a finance lease, we initially record both the leased asset and the related lease obligation in Premisesand equipment, Other intangibles and Other liabilities on our Consolidated Balance Sheets at an amount equal to the fair valueof the leased asset or, if lower, the present value of the minimum lease payments, each determined at the date of inception of thelease. Initial direct costs directly attributed to the lease are recognized as an asset under the finance lease.
ProvisionsProvisions are liabilities of uncertain timing or amount and are recognized when we have a present legal or constructiveobligation as a result of a past event, it is probable that an outflow of resources will be required to settle the obligation, and areliable estimate can be made of the amount of the obligation. Provisions are measured as the best estimate of the considerationrequired to settle the present obligation at the reporting date. Significant judgment is required in determining whether a presentobligation exists and in estimating the probability, timing and amount of any outflows. We record provisions related to litigation,asset retirement obligations and other items.
Consolidated Financial Statements Royal Bank of Canada: Annual Report 2020 145

Note 2 Summary of significant accounting policies, estimates and judgments (continued)
We are required to estimate the results of ongoing legal proceedings, and expenses to be incurred to dispose of capitalassets. The forward-looking nature of these estimates requires us to use a significant amount of judgment in projecting thetiming and amount of future cash flows. We record our provisions on the basis of all available information at the end of thereporting period and make adjustments on a quarterly basis to reflect current expectations. It may not be possible to predict theresolution of these matters or the timing of their ultimate resolution. Should actual results differ from our expectations, we mayincur expenses in excess of the provisions recognized. Where appropriate, we apply judgment in limiting the extent of ourprovisions-related disclosures as not to prejudice our positions in matters of dispute.
When some or all of the economic benefits required to settle a provision are expected to be recovered from a third party,such as an insurer, a separate asset is recognized if it is virtually certain that reimbursement will be received.
Commissions and feesCommissions and fees primarily relate to Investment management and custodial fees, Mutual fund revenue, Securities brokeragecommissions, Services charges, Underwriting and other advisory fees, Card service revenue and Credit fees, and are recognizedbased on the applicable service contracts with customers.
Investment management and custodial fees and Mutual fund revenue are generally calculated as a percentage of daily orperiod-end net asset values (NAV) based on the terms of the contract with customers and are received monthly, quarterly,semiannually or annually, depending on the terms of the contract. Investment management and custodial fees are generallyderived from assets under management (AUM) when our clients solicit the investment capabilities of an investment manager orfrom assets under administration (AUA) where the investment strategy is directed by the client or a designated third-partymanager. Mutual fund revenue is derived from the daily NAV of the mutual funds. Investment management and custodial fees andMutual fund revenue are recognized over time when the service is provided to the customer, provided that it is highly probablethat a significant reversal in the amount of revenue recognized will not occur.
Commissions earned on Securities brokerage services and Service charges that are related to the provision of specifictransaction-type services are recognized when the service is fulfilled. Where services are provided over time, revenue isrecognized as the services are provided.
Underwriting and other advisory fees primarily relate to underwriting of new issuances of debt or equity and variousadvisory services. Underwriting fees are generally expressed as a percentage of the funds raised through issuance and arerecognized when the service has been completed. Advisory fees vary depending on the scope and type of engagement and can befixed in nature or contingent on a future event. Advisory fees are recognized over the period in which the service is provided andare recognized only to the extent that it is highly probable that a significant reversal in the amount of revenue will not occur.
Card service revenue primarily includes interchange revenue and annual card fees. Interchange revenue is calculated as afixed percentage of the transaction amount and recognized when the card transaction is settled. Annual card fees are fixed feesand are recognized over a 12 month period.
Credit fees are primarily earned for arranging syndicated loans and making credit available on undrawn facilities. The timingof the recognition of credit fees varies based on the nature of the services provided.
When service fees and other costs are incurred in relation to commissions and fees earned, we record these costs on a grossbasis in either Non-interest expense – Other or Non-interest expense – Human resources based on our assessment of whether wehave primary responsibility to fulfill the contract with the customer and have discretion in establishing the price for thecommissions and fees earned, which may require judgment.
Earnings per shareEarnings per share is computed by dividing Net income available to common shareholders by the weighted average number ofcommon shares outstanding for the period. Net income available to common shareholders is determined after deducting dividendentitlements of preferred shareholders and distributions on other equity instruments, any gains (losses) on redemption of preferredshares and other equity instruments net of related income taxes and the net income attributable to non-controlling interests.
Diluted earnings per share reflects the potential dilution that could occur if additional common shares are assumed to beissued under securities or contracts that entitle their holders to obtain common shares in the future, to the extent suchentitlement is not subject to unresolved contingencies. For contracts that may be settled in cash or in common shares at ouroption, diluted earnings per share is calculated based on the assumption that such contracts will be settled in shares. Incomeand expenses associated with these types of contracts are excluded from the Net income available to common shareholders, andthe additional number of shares that would be issued is included in the diluted earnings per share calculation. This includescertain convertible shares with the conversion assumed to have taken place at the beginning of the period or on the date ofissue, if later. For stock options whose exercise price is less than the average market price of our common shares, using thetreasury stock method, they are assumed to be exercised and the proceeds are used to repurchase common shares at theaverage market price for the period. The incremental number of common shares issued under stock options and repurchasedfrom proceeds is included in the calculation of diluted earnings per share.
Share capital and other equity instrumentsWe classify a financial instrument that we issue as a financial asset, financial liability or an equity instrument in accordance withthe substance of the contractual arrangement.
Our common shares held by us are classified as treasury shares in equity and accounted for at weighted average cost. Uponthe sale of treasury shares, the difference between the sale proceeds and the cost of the shares is recognized in Retainedearnings. Financial instruments issued by us are classified as equity instruments when there is no contractual obligation totransfer cash or other financial assets. Incremental costs directly attributable to the issue of equity instruments are included inequity as a deduction from the proceeds, net of tax. Financial instruments that will be settled by a variable number of ourcommon shares upon their conversion by the holders as well as the related accrued distributions are classified as liabilities onour Consolidated Balance Sheets. Dividends and yield distributions on these instruments are classified as Interest expense in ourConsolidated Statements of Income. For compound instruments comprised of both liability and equity components, the liabilitycomponent is initially measured at fair value with any residual amount assigned to the equity component.
146 Royal Bank of Canada: Annual Report 2020 Consolidated Financial Statements

Future changes in accounting policy and disclosureThe following standards have been issued, but are not yet effective for us.
Conceptual Framework for Financial Reporting (Conceptual Framework)In March 2018, the IASB issued its revised Conceptual Framework. This replaces the previous version of the ConceptualFramework issued in 2010. The revised Conceptual Framework will be effective on November 1, 2020. The Conceptual Frameworkis not a standard, and does not override the concepts or requirements in any standard. It may be used develop consistentaccounting policies where there is no applicable standard in place. The revisions include a few new concepts, updated definitionsand recognition criteria for assets and liabilities and clarifies some important concepts. These amendments are not expected tohave a material impact on our Consolidated Financial Statements.
IFRS 17 Insurance Contracts (IFRS 17)In May 2017, the IASB issued IFRS 17 to establish a comprehensive global insurance standard which provides guidance on therecognition, measurement, presentation and disclosures of insurance contracts. IFRS 17 requires entities to measure insurancecontract liabilities at their current fulfillment values using one of three approaches. In June 2020, the IASB issued amendments toIFRS 17, including deferral of the effective date by two years. This new standard will be effective for us on November 1, 2023 andwill be applied retrospectively with restatement of comparatives unless impracticable. We are currently assessing the impact ofadopting this standard and the amendments on our Consolidated Financial Statements.
Interest Rate Benchmark ReformIn August 2020, the IASB issued Interest Rate Benchmark Reform – Phase 2, Amendments to IFRS 9, IAS 39, IFRS 7, IFRS 4Insurance contracts and IFRS 16 (Phase 2 Amendments). The Phase 2 Amendments address issues that arise upon replacing theexisting interest rate benchmark with the alternative interest rates and introduces additional disclosure requirements. The Phase2 Amendments provide two key reliefs:
• For modifications resulting from the Reform which are transacted on an economically equivalent basis, the Reformallows the benchmark rate change to be reflected prospectively in the effective interest rate of the instrument ratherthan as an immediate gain or loss.
• If qualifying criteria are met, hedging relationships that are directly impacted by the Reform would be able to continuehedge accounting upon transition to alternative interest rates.
The Phase 2 Amendments will be effective for us on November 1, 2021, with earlier adoption permitted.To manage our transition to alternative interest rates, we have implemented a comprehensive enterprise-wide program and
governance structure that focuses on key areas of impact including contract changes with clients, capital and liquidity planning,risk management, financial reporting and valuation, systems, processes, client education and communication.
We are currently assessing the impact of the adoption of the Phase 2 Amendments on our Consolidated FinancialStatements.
Consolidated Financial Statements Royal Bank of Canada: Annual Report 2020 147

Note 3 Fair value of financial instruments
Carrying value and fair value of financial instrumentsThe following tables provide a comparison of the carrying and fair values for each classification of financial instruments.Embedded derivatives are presented on a combined basis with the host contracts. For measurement purposes, they are carriedat fair value when conditions requiring separation are met.
As at October 31, 2020
Carrying value and fair value Carrying value Fair value
(Millions of Canadian dollars)
Financialinstrumentsclassified as
FVTPL
Financialinstruments
designated asFVTPL
Financialinstrumentsclassified as
FVOCI
Financialinstruments
designated asFVOCI
Financialinstrumentsmeasured at
amortized cost
Financialinstrumentsmeasured at
amortized cost
Totalcarryingamount
Totalfair value
Financial assetsInterest-bearing deposits with banks $ – $ 21,603 $ – $ – $ 17,410 $ 17,410 $ 39,013 $ 39,013
SecuritiesTrading 126,027 10,044 – – – – 136,071 136,071Investment, net of applicable allowance – – 81,395 525 57,823 58,627 139,743 140,547
126,027 10,044 81,395 525 57,823 58,627 275,814 276,618
Assets purchased under reverse repurchaseagreements and securities borrowed 264,394 – – – 48,621 48,621 313,015 313,015
Loans, net of applicable allowanceRetail – 253 260 – 454,429 462,884 454,942 463,397Wholesale 6,197 2,363 744 – 196,746 198,753 206,050 208,057
6,197 2,616 1,004 – 651,175 661,637 660,992 671,454
OtherDerivatives 113,488 – – – – – 113,488 113,488Other assets (1) 3,414 – – – 57,065 57,065 60,479 60,479
Financial liabilitiesDeposits
Personal $ 104 $ 17,096 $ 325,852 $ 324,804 $ 343,052 $ 342,004Business and government (2) 389 107,466 516,456 518,501 624,311 626,356Bank (3) – 18,015 26,507 26,518 44,522 44,533
493 142,577 868,815 869,823 1,011,885 1,012,893
OtherObligations related to securities sold short 29,285 – – – 29,285 29,285Obligations related to assets sold under
repurchase agreements and securitiesloaned – 255,922 18,309 18,309 274,231 274,231
Derivatives 109,927 – – – 109,927 109,927Other liabilities (4) 80 86 65,712 65,719 65,878 65,885
Subordinated debentures – – 9,867 10,071 9,867 10,071
As at October 31, 2019
Carrying value and fair value Carrying value Fair value
(Millions of Canadian dollars)
Financialinstrumentsclassified as
FVTPL
Financialinstruments
designated asFVTPL
Financialinstrumentsclassified as
FVOCI
Financialinstruments
designated asFVOCI
Financialinstruments
measured atamortized cost
Financialinstruments
measured atamortized cost
Totalcarryingamount
Totalfair value
Financial assetsInterest-bearing deposits with banks $ – $ 22,283 $ – $ – $ 16,062 $ 16,062 $ 38,345 $ 38,345
SecuritiesTrading 137,600 8,934 – – – – 146,534 146,534Investment, net of applicable allowance – – 57,223 463 44,784 45,104 102,470 102,790
137,600 8,934 57,223 463 44,784 45,104 249,004 249,324
Assets purchased under reverse repurchaseagreements and securities borrowed 246,068 – – – 60,893 60,894 306,961 306,962
Loans, net of applicable allowanceRetail 275 242 95 – 423,469 424,416 424,081 425,028Wholesale 7,055 1,856 451 – 185,413 184,645 194,775 194,007
7,330 2,098 546 – 608,882 609,061 618,856 619,035
OtherDerivatives 101,560 – – – – – 101,560 101,560Other assets (1) 3,156 – – – 50,375 50,375 53,531 53,531
Financial liabilitiesDeposits
Personal $ 140 $ 17,394 $ 277,198 $ 277,353 $ 294,732 $ 294,887Business and government (2) 151 111,389 453,942 452,536 565,482 564,076Bank (3) – 3,032 22,759 22,773 25,791 25,805
291 131,815 753,899 752,662 886,005 884,768
OtherObligations related to securities sold short 35,069 – – – 35,069 35,069Obligations related to assets sold under
repurchase agreements and securitiesloaned – 218,612 7,974 7,974 226,586 226,586
Derivatives 98,543 – – – 98,543 98,543Other liabilities (4) (1,209) 91 61,039 61,024 59,921 59,906
Subordinated debentures – – 9,815 9,930 9,815 9,930
(1) Includes Customers’ liability under acceptances and financial instruments recognized in Other assets.(2) Business and government deposits include deposits from regulated deposit-taking institutions other than banks.(3) Bank deposits refer to deposits from regulated banks and central banks.(4) Includes Acceptances and financial instruments recognized in Other liabilities.
148 Royal Bank of Canada: Annual Report 2020 Consolidated Financial Statements

Financial assets designated as fair value through profit or lossFor our financial assets designated as FVTPL, we measure the change in fair value attributable to changes in credit risk as thedifference between the total change in the fair value of the instrument during the period and the change in fair value calculatedusing the appropriate risk-free yield curves. For the year ended October 31, 2020, the change in fair value during the periodattributable to changes in credit risk for positions still held was a loss of $379 million and the cumulative change in fair valueattributable to changes in credit risk for positions still held was a loss of $442 million. For the year ended October 31, 2019 therewas no significant change in the fair value of the loans and receivables designated as FVTPL attributable to changes in creditrisk. As at October 31, 2020, the extent to which credit derivatives or similar instruments mitigate the maximum exposure to creditrisk was $520 million (October 31, 2019 – $514 million).
Financial liabilities designated as fair value through profit or lossFor our financial liabilities designated as FVTPL, we take into account changes in our own credit spread and the expectedduration of the instrument to measure the change in fair value attributable to changes in credit risk.
As at or for the year ended October 31, 2020 (1)
Contractualmaturityamount Carrying value
Differencebetween
carrying valueand contractual
maturity amount
Changes in fair value attributableto changes in credit risk included
in OCI for positions still held
(Millions of Canadian dollars) During the period Cumulative (2)
Term depositsPersonal $ 17,279 $ 17,096 $ (183) $ 67 $ 89Business and government (3) 106,153 107,466 1,313 281 491Bank (4) 18,016 18,015 (1) – –
141,448 142,577 1,129 348 580
Obligations related to assets sold underrepurchase agreements and securities loaned 255,908 255,922 14 8 8
Other liabilities 86 86 – – –
$ 397,442 $ 398,585 $ 1,143 $ 356 $ 588
As at or for the year ended October 31, 2019 (1)
(Millions of Canadian dollars)
Contractualmaturityamount Carrying value
Differencebetween
carrying valueand contractual
maturity amount
Changes in fair value attributableto changes in credit risk included
in OCI for positions still held
During the period Cumulative (2)
Term depositsPersonal $ 17,307 $ 17,394 $ 87 $ 3 $ 22Business and government (3) 110,763 111,389 626 (76) 210Bank (4) 3,031 3,032 1 – –
131,101 131,815 714 (73) 232
Obligations related to assets sold underrepurchase agreements and securities loaned 218,604 218,612 8 – –
Other liabilities 91 91 – – –
$ 349,796 $ 350,518 $ 722 $ (73) $ 232
(1) There are no significant changes in fair value attributable to changes in credit risk included in net income for positions still held.(2) The cumulative change is measured from the initial designation of the liabilities as FVTPL. For the year ended October 31, 2020, $2 million of fair value gains previously
included in OCI relate to financial liabilities derecognized during the year (October 31, 2019 – $4 million of fair value losses).(3) Business and government term deposits include amounts from regulated deposit-taking institutions other than regulated banks.(4) Bank term deposits refer to amounts from regulated banks and central banks.
Consolidated Financial Statements Royal Bank of Canada: Annual Report 2020 149

Note 3 Fair value of financial instruments (continued)
Net gains (losses) from financial instruments classified and designated as fair value through profit or lossFinancial instruments classified as FVTPL, which includes mainly trading securities, derivatives, trading liabilities, and financialassets and liabilities designated as FVTPL are measured at fair value with realized and unrealized gains and losses recognized inNon-interest income.
For the year ended
(Millions of Canadian dollars)
October 312020
October 312019
Net gains (losses) (1)Classified as fair value through profit or loss (2) $ (69) $ 3,564Designated as fair value through profit or loss (3) 1,533 (1,821)
$ 1,464 $ 1,743
By product line (1)Interest rate and credit (4) $ 1,490 $ 1,534Equities (501) (144)Foreign exchange and commodities 475 353
$ 1,464 $ 1,743
(1) Excludes the following amounts related to our insurance operations and included in Insurance premiums, investment and fee income in the Consolidated Statements ofIncome: Net gains from financial instruments designated as FVTPL of $329 million (October 31, 2019 – gains of $1,303 million).
(2) Excludes derivatives designated in a hedging relationship. Refer to Note 8 for net gains (losses) on these derivatives.(3) For the year ended October 31, 2020, $1,532 million of net fair value gains on financial liabilities designated as FVTPL, other than those attributable to changes in our own
credit risk, were included in Non-interest income (October 31, 2019 – losses of $1,810 million).(4) Includes gains (losses) recognized on cross currency interest rate swaps.
Net interest income from financial instrumentsInterest and dividend income arising from financial assets and financial liabilities and the associated costs of funding arereported in Net interest income.
For the year ended
(Millions of Canadian dollars)
October 312020
October 312019
Interest and dividend income (1), (2)Financial instruments measured at fair value through profit or loss $ 8,480 $ 12,103Financial instruments measured at fair value through other comprehensive income 957 1,132Financial instruments measured at amortized cost 25,446 28,098
34,883 41,333
Interest expense (1)Financial instruments measured at fair value through profit or loss $ 6,065 $ 10,507Financial instruments measured at amortized cost (3) 7,983 11,077
14,048 21,584Net interest income $ 20,835 $ 19,749
(1) Excludes the following amounts related to our insurance operations and included in Insurance premiums, investment and fee income in the Consolidated Statements ofIncome: Interest income of $521 million (October 31, 2019 – $486 million), and Interest expense of $7 million (October 31, 2019 – $4 million).
(2) Includes dividend income for the year ended October 31, 2020 of $2,670 million (October 31, 2019 – $2,057 million), which is presented in Interest and dividend income inthe Consolidated Statements of Income.
(3) Includes interest expense on lease liabilities for the year ended October 31, 2020 of $123 million due to the adoption of IFRS 16.
Fee income arising from financial instrumentsFor the year ended October 31, 2020, we earned $5,134 million in fees from banking services (October 31, 2019 – $5,270 million). Forthe year ended October 31, 2020, we also earned $13,166 million in fees from investment management, trust, custodial,underwriting, brokerage and other similar fiduciary services to retail and institutional clients (October 31, 2019 – $12,117 million).These fees are included in Non-interest income.
150 Royal Bank of Canada: Annual Report 2020 Consolidated Financial Statements

Fair value of assets and liabilities measured at fair value on a recurring basis and classified using the fair value hierarchyAs at
October 31, 2020 October 31, 2019
Fair valuemeasurements using Netting
adjustments Fair value
Fair valuemeasurements using Netting
adjustments Fair value(Millions of Canadian dollars) Level 1 Level 2 Level 3 Level 1 Level 2 Level 3
Financial assetsInterest-bearing deposits with banks $ – $ 21,603 $ – $ $ 21,603 $ – $ 22,283 $ – $ $ 22,283
SecuritiesTrading
Debt issued or guaranteed by:Canadian government (1)
Federal 12,773 3,012 – 15,785 14,655 5,474 – 20,129Provincial and municipal – 11,562 – 11,562 – 11,282 – 11,282
U.S. state, municipal and agencies (1) 1,508 35,029 44 36,581 2,050 39,584 58 41,692Other OECD government (2) 3,085 3,380 – 6,465 2,786 3,710 – 6,496
Mortgage-backed securities (1) – 39 – 39 – 482 – 482Asset-backed securities
Non-CDO securities (3) – 526 2 528 – 1,333 2 1,335Corporate debt and other debt – 21,464 30 21,494 1 23,643 21 23,665Equities 39,795 2,561 1,261 43,617 38,309 1,925 1,219 41,453
57,161 77,573 1,337 136,071 57,801 87,433 1,300 146,534
InvestmentDebt issued or guaranteed by:
Canadian government (1)Federal 647 1,894 – 2,541 – 657 – 657Provincial and municipal – 3,233 – 3,233 – 2,898 – 2,898
U.S. state, municipal and agencies (1) 160 38,364 – 38,524 210 20,666 – 20,876Other OECD government – 7,345 – 7,345 – 4,251 – 4,251
Mortgage-backed securities (1) – 2,343 27 2,370 – 2,675 27 2,702Asset-backed securities
CDO – 7,414 – 7,414 – 7,300 – 7,300Non-CDO securities – 854 – 854 – 849 – 849
Corporate debt and other debt – 18,954 160 19,114 – 17,537 153 17,690Equities 38 152 335 525 42 127 294 463
845 80,553 522 81,920 252 56,960 474 57,686
Assets purchased under reverse repurchase agreements andsecurities borrowed – 264,394 – 264,394 – 246,068 – 246,068
Loans – 8,747 1,070 9,817 – 9,294 680 9,974Other
DerivativesInterest rate contracts 1 53,720 501 54,222 1 46,095 349 46,445Foreign exchange contracts – 39,246 57 39,303 – 40,768 48 40,816Credit derivatives – 463 – 463 – 169 – 169Other contracts 4,458 16,767 36 21,261 2,852 12,674 11 15,537Valuation adjustments – (1,112) 8 (1,104) – (712) 15 (697)
Total gross derivatives 4,459 109,084 602 114,145 2,853 98,994 423 102,270Netting adjustments (657) (657) (710) (710)
Total derivatives 113,488 101,560Other assets 1,154 2,207 53 3,414 1,119 1,960 77 3,156
$63,619 $564,161 $ 3,584 $ (657) $ 630,707 $62,025 $522,992 $ 2,954 $ (710) $ 587,261
Financial liabilitiesDeposits
Personal $ – $ 17,061 $ 139 $ $ 17,200 $ – $ 17,378 $ 156 $ $ 17,534Business and government – 107,855 – 107,855 – 111,540 – 111,540Bank – 18,015 – 18,015 – 3,032 – 3,032
OtherObligations related to securities sold short 12,484 16,801 – 29,285 20,512 14,557 – 35,069Obligations related to assets sold under repurchase agreements and
securities loaned – 255,922 – 255,922 – 218,612 – 218,612Derivatives
Interest rate contracts – 46,723 1,089 47,812 – 39,165 934 40,099Foreign exchange contracts – 38,210 35 38,245 – 40,183 27 40,210Credit derivatives – 531 – 531 – 282 – 282Other contracts 5,734 18,041 337 24,112 2,675 15,776 206 18,657Valuation adjustments – (84) (32) (116) – 12 (7) 5
Total gross derivatives 5,734 103,421 1,429 110,584 2,675 95,418 1,160 99,253Netting adjustments (657) (657) (710) (710)
Total derivatives 109,927 98,543Other liabilities 118 10 38 166 102 (1,280) 60 (1,118)
$18,336 $519,085 $ 1,606 $ (657) $ 538,370 $23,289 $459,257 $ 1,376 $ (710) $ 483,212
(1) As at October 31, 2020, residential and commercial mortgage-backed securities (MBS) included in all fair value levels of trading securities were $20,520 million and $nil(October 31, 2019 – $22,365 million and $nil), respectively, and in all fair value levels of Investment securities were $9,487 million and $2,137 million (October 31,2019 – $6,474 million and $2,046 million), respectively.
(2) OECD stands for Organisation for Economic Co-operation and Development.(3) CDO stands for collateralized debt obligations.
Fair values of our significant assets and liabilities measured on a recurring basis are determined and classified in the fair valuehierarchy table using the following valuation techniques and inputs.
Interest-bearing deposits with banksThe majority of our Interest-bearing deposits with banks are designated as FVTPL. These FVTPL deposits are composed of short-dated deposits placed with banks, and are included in Interest-bearing deposits with banks in the fair value hierarchy table. The
Consolidated Financial Statements Royal Bank of Canada: Annual Report 2020 151

Note 3 Fair value of financial instruments (continued)
fair values of these instruments are determined using the discounted cash flow method. The inputs to the valuation modelsinclude interest rate swap curves and credit spreads, where applicable. They are classified as Level 2 instruments in thehierarchy as the inputs are observable.
Government bonds (Canadian, U.S. and other OECD governments)Government bonds are included in Canadian government debt, U.S. state, municipal and agencies debt, Other OECD governmentdebt and Obligations related to securities sold short in the fair value hierarchy table. The fair values of government issued orguaranteed debt securities in active markets are determined by reference to recent transaction prices, broker quotes, or third-party vendor prices and are classified as Level 1 in the hierarchy. The fair values of securities that are not traded in activemarkets are based on either security prices, or valuation techniques using implied yields and risk spreads derived from prices ofactively traded and similar government securities. Securities with observable prices or rate inputs as compared to transactionprices, dealer quotes or vendor prices are classified as Level 2 in the hierarchy. Securities where inputs are unobservable areclassified as Level 3 in the hierarchy.
Corporate and U.S. municipal bondsThe fair values of corporate and U.S. municipal bonds, which are included in Corporate debt and other debt, U.S. state, municipaland agencies debt and Obligations related to securities sold short in the fair value hierarchy table, are determined using eitherrecently executed transaction prices, broker quotes, pricing services, or in certain instances, the discounted cash flow methodusing rate inputs such as benchmark yields (Canadian Dealer Offered Rate, LIBOR and other similar reference rates) and riskspreads of comparable securities. Securities with observable prices or rate inputs are classified as Level 2 in the hierarchy.Securities where inputs are unobservable are classified as Level 3 in the hierarchy.
Asset-backed securities and Mortgage-backed securitiesAsset-backed securities (ABS) and MBS are included in Asset-backed securities, Mortgage-backed securities, Canadiangovernment debt, U.S. state, municipal and agencies debt, and Obligations related to securities sold short in the fair valuehierarchy table. Inputs for valuation of ABS and MBS are, when available, traded prices, dealer or lead manager quotes, brokerquotes and vendor prices of the identical securities. When prices of the identical securities are not readily available, we useindustry standard models with inputs such as discount margins, yields, default, prepayment and loss severity rates that areimplied from transaction prices, dealer quotes or vendor prices of comparable instruments. Where security prices and inputs areobservable, ABS and MBS are classified as Level 2 in the hierarchy. Otherwise, they are classified as Level 3 in the hierarchy.
EquitiesEquities consist of listed and unlisted common shares, private equities, mutual funds and hedge funds with certain redemptionrestrictions and are included in equities and obligations for securities sold short. The fair values of common shares are based onquoted prices in active markets, where available, and are classified as Level 1 in the hierarchy. Where quoted prices in activemarkets are not readily available, fair value is determined based on quoted market prices for similar securities or throughvaluation techniques, such as multiples of earnings and the discounted cash flow method with forecasted cash flows anddiscount rate as inputs. Private equities are classified as Level 3 in the hierarchy as their inputs are not observable. Hedge fundsare valued using Net Asset Values (NAV). If we can redeem a hedge fund at NAV prior to the next quarter end, the fund isclassified as Level 2 in the hierarchy. Otherwise, it is classified as Level 3 in the hierarchy.
LoansLoans include base metal loans, corporate loans, banker acceptances and asset-backed financing loans. Fair values aredetermined based on market prices, if available, or discounted cash flow method using the following inputs: market interestrates, base metal commodity prices, market based spreads of assets with similar credit ratings and terms to maturity, LGD,expected default frequency implied from credit derivative prices, if available, and relevant pricing information such ascontractual rate, origination and maturity dates, redemption price, coupon payment frequency and day count convention. Loanswith market prices or observable inputs are classified as Level 2 in the hierarchy and loans with unobservable inputs that havesignificant impacts on the fair values are classified as Level 3 in the hierarchy.
DerivativesThe fair values of exchange-traded derivatives, such as interest rate and equity options and futures, are based on quoted marketprices and are typically classified as Level 1 in the hierarchy. OTC derivatives primarily consist of interest rate contracts, foreignexchange contracts and credit derivatives. The exchange-traded or OTC interest rate, foreign exchange and equity derivativesare included in Interest rate contracts, Foreign exchange contracts and Other contracts, respectively, in the fair value hierarchytable. The fair values of OTC derivatives are determined using valuation models when quoted market prices or third-partyconsensus pricing information are not available. The valuation models, such as discounted cash flow method or Black-Scholesoption model, incorporate observable or unobservable inputs for interest and foreign exchange rates, equity and commodityprices (including indices), credit spreads, corresponding market volatility levels, and other market-based pricing factors. Otheradjustments to fair value include bid-offer, CVA, FVA, OIS, parameter and model uncertainties, and unrealized gain or loss atinception of a transaction. A derivative instrument is classified as Level 2 in the hierarchy if observable market inputs areavailable or the unobservable inputs are not significant to the fair value. Otherwise, it is classified as Level 3 in the hierarchy.
152 Royal Bank of Canada: Annual Report 2020 Consolidated Financial Statements

Securities borrowed or purchased under resale agreements and securities loaned or sold under repurchase agreementsIn the fair value hierarchy table, these instruments are included in Assets purchased under reverse repurchase agreements andsecurities borrowed, and Obligations related to assets sold under repurchase agreements and securities loaned. The fair valuesof these contracts are determined using valuation techniques such as the discounted cash flow method using interest ratecurves as inputs. They are classified as Level 2 instruments in the hierarchy as the inputs are observable.
DepositsA majority of our deposits are measured at amortized cost but certain deposits are designated as FVTPL. These FVTPL depositsinclude deposits taken from clients, issuances of certificates of deposits and promissory notes, and interest rate and equitylinked notes. The fair values of these instruments are determined using the discounted cash flow method and derivative optionvaluation models. The inputs to the valuation models include benchmark yield curves, credit spreads, interest rates, equity andinterest rate volatility, dividends and correlation, where applicable. They are classified as Level 2 or 3 instruments in thehierarchy, depending on the significance of the unobservable credit spreads, volatility, dividend and correlation rates.
Quantitative information about fair value measurements using significant unobservable inputs (Level 3 Instruments)The following table presents fair values of our significant Level 3 financial instruments, valuation techniques used to determinetheir fair values, ranges and weighted averages of unobservable inputs.
As at October 31, 2020 (Millions of Canadian dollars, except for prices, percentages and ratios)
Fair value Range of input values (1), (2)
ProductsReporting line in the fair valuehierarchy table Assets Liabilities
Valuationtechniques
Significantunobservable
inputs (3) Low High
Weightedaverage/ Inputs
distribution
Corporate debt and relatedderivatives
Price-based Prices $ 1.33 $ 136.34 $ 94.23Corporate debt and other debt 33 Discounted cash flows Credit spread 1.75% 14.10% 7.93%Loans 1,070 Credit enhancement 11.82% 15.75% 13.13%Derivative related liabilities 25
Government debt andmunicipal bonds
Price-based Prices $ 64.62 $ 64.62 $ 64.62Mortgage-backed securities – Discounted cash flows Yields 4.21% 7.89% 5.88%Corporate debt and other debt 157
Private equities, hedge fundinvestments and relatedequity derivatives
Market comparable EV/EBITDA multiples 7.00X 15.38X 13.31XEquities 1,596 Price-based P/E multiples 9.40X 33.47X 19.10XDerivative related liabilities 10 Discounted cash flows EV/Rev multiples 1.61X 9.10X 2.04X
Liquidity discounts (4) 10.00% 40.00% 16.40%Discount rate 10.52% 10.52% 10.52%
NAV / prices (5) n.a. n.a. n.a.
Interest rate derivatives andinterest-rate-linkedstructured notes (6), (7)
Discounted cash flows Interest rates 1.20% 1.60% EvenDerivative related assets 540 Option pricing model CPI swap rates 1.46% 1.83% EvenDerivative related liabilities 1,103 IR-IR correlations 19.00% 67.00% Even
FX-IR correlations 29.00% 56.00% EvenFX-FX correlations 68.00% 68.00% Even
Equity derivatives andequity-linked structurednotes (6), (7)
Discounted cash flows Dividend yields 0.00% 11.38% LowerDerivative related assets 36 Option pricing model Equity (EQ)-EQ correlations 21.90% 97.00% MiddleDeposits 139 EQ-FX correlations (71.40)% 45.10% MiddleDerivative related liabilities 238 EQ volatilities 9.00% 176.00% Upper
Other (8)Asset-backed securities 2Derivative related assets 26Other assets 53Mortgage-backed securities 27U.S. state, municipal andagencies debt 44Derivative related liabilities 53Other liabilities 38
Total $ 3,584 $ 1,606
Consolidated Financial Statements Royal Bank of Canada: Annual Report 2020 153

Note 3 Fair value of financial instruments (continued)
As at October 31, 2019 (Millions of Canadian dollars, except for prices, percentages and ratios)
Fair value Range of input values (1), (2)
ProductsReporting line in the fair valuehierarchy table Assets Liabilities
Valuationtechniques
Significantunobservable
inputs (3) Low High
Weightedaverage/ Inputs
distribution
Corporate debt and relatedderivatives
Price-based Prices $ 20.00 $ 131.78 $ 110.30Corporate debt and other debt 24 Discounted cash flows Credit spread 1.02% 11.34% 6.18%Loans 680 Credit enhancement 11.82% 15.75% 13.13%Derivative related liabilities –
Government debt andmunicipal bonds
Price-based Prices $ 65.50 $ 100.00 $ 65.67Mortgage-backed securities 27 Discounted cash flows Yields 4.70% 6.63% 5.80%Corporate debt and other debt 150
Private equities, hedge fundinvestments and relatedequity derivatives
Market comparable EV/EBITDA multiples 4.00X 24.90X 10.23XEquities 1,513 Price-based P/E multiples 9.70X 29.90X 16.11XDerivative related liabilities 10 Discounted cash flows EV/Rev multiples 0.90X 5.93X 3.55X
Liquidity discounts (4) 10.00% 40.00% 17.64%Discount rate 10.00% 12.00% 10.45%
NAV / prices (5) n.a. n.a. n.a.
Interest rate derivatives andinterest-rate-linkedstructured notes (6), (7)
Discounted cash flows Interest rates 1.27% 2.16% EvenDerivative related assets 380 Option pricing model CPI swap rates 1.40% 2.00% EvenDerivative related liabilities 943 IR-IR correlations 19.00% 67.00% Even
FX-IR correlations 29.00% 56.00% EvenFX-FX correlations 68.00% 68.00% Even
Equity derivatives andequity-linked structurednotes (6), (7)
Discounted cash flows Dividend yields 0.10% 8.77% LowerDerivative related assets 11 Option pricing model Equity (EQ)-EQ correlations 34.00% 95.40% MiddleDeposits 156 EQ-FX correlations (71.40)% 30.50% MiddleDerivative related liabilities 180 EQ volatilities 4.00% 110.00% Upper
Other (8)Asset-backed securities 2Derivative related assets 32Other assets 77Mortgage-backed securities –U.S. state, municipal and agenciesdebt 58Derivative related liabilities 27Other liabilities 60
Total $ 2,954 $ 1,376
(1) The low and high input values represent the actual highest and lowest level inputs used to value a group of financial instruments in a particular product category. Theseinput ranges do not reflect the level of input uncertainty, but are affected by the different underlying instruments within the product category. The input ranges willtherefore vary from period to period based on the characteristics of the underlying instruments held at each balance sheet date. Where provided, the weighted averageof the input values is calculated based on the relative fair values of the instruments within the product category. The weighted averages for derivatives are not presentedin the table as they would not provide a comparable metric; instead, distribution of significant unobservable inputs within the range for each product category isindicated in the table.
(2) Price-based inputs are significant for certain debt securities and are based on external benchmarks, comparable proxy instruments or pre-quarter-end trade data. Forthese instruments, the price input is expressed in dollars for each $100 par value. For example, with an input price of $105, an instrument is valued at a premium over itspar value.
(3) The acronyms stand for the following: (i) Enterprise Value (EV); (ii) Earnings Before Interest, Taxes, Depreciation and Amortization (EBITDA); (iii) Price / Earnings (P/E);(iv) Revenue (Rev); (v) Consumer Price Index (CPI); (vi) Interest Rate (IR); (vii) Foreign Exchange (FX); and (viii) Equity (EQ).
(4) Fair value of securities with liquidity discount inputs totalled $286 million (October 31, 2019 – $255 million).(5) NAV of a hedge fund is total fair value of assets less liabilities divided by the number of fund units. Private equities are valued based on NAV or valuation techniques. The
range for NAV per unit or price per share has not been disclosed for the hedge funds or private equities due to the dispersion of prices given the diverse nature of theinvestments.
(6) The level of aggregation and diversity within each derivative instrument category may result in certain ranges of inputs being wide and inputs being unevenly distributedacross the range. In the table, we indicated whether the majority of the inputs are concentrated toward the upper, middle, or lower end of the range, or evenly distributedthroughout the range.
(7) The structured notes contain embedded equity or interest rate derivatives with unobservable inputs that are similar to those of the equity or interest rate derivatives.(8) Other primarily includes certain insignificant instruments such as auction rate securities, commodity derivatives, foreign exchange derivatives, contingent
considerations, bank-owned life insurance and retractable shares.n.a. not applicable
Sensitivity to unobservable inputs and interrelationships between unobservable inputsYield, credit spreads/discount marginsA financial instrument’s yield is the interest rate used to discount future cash flows in a valuation model. An increase in the yield,in isolation, would result in a decrease in a fair value measurement and vice versa. A credit spread/discount margin is thedifference between a debt instrument’s yield and a benchmark instrument’s yield. Benchmark instruments have high creditquality ratings, similar maturities and are often government bonds. The credit spread/discount margin therefore represents thediscount rate used to determine the present value of future cash flows of an asset to reflect the market return required foruncertainty in the estimated cash flows. The credit spread/discount margin for an instrument forms part of the yield used in adiscounted cash flow method.
Funding spreadFunding spreads are credit spreads specific to funding or deposit rates. A decrease in funding spreads, on its own, will increasethe fair value of our liabilities, and vice versa.
154 Royal Bank of Canada: Annual Report 2020 Consolidated Financial Statements

Default ratesA default rate is the rate at which borrowers fail to make scheduled loan payments. A decrease in the default rate will typicallyincrease the fair value of the loan, and vice versa. This effect will be significantly more pronounced for a non-governmentguaranteed loan than a government guaranteed loan.
Prepayment ratesA prepayment rate is the rate at which a loan will be repaid in advance of its expected amortization schedule. Prepaymentschange the future cash flows of a loan. An increase in the prepayment rate in isolation will result in an increase in fair value whenthe loan interest rate is lower than the current reinvestment rate, and a decrease in the prepayment rate in isolation will result ina decrease in fair value when the loan interest rate is lower than the current reinvestment rate. Prepayment rates are generallynegatively correlated with interest rates.
Recovery and loss severity ratesA recovery rate is an estimation of the amount that can be collected in a loan default scenario. The recovery rate is the recoveredamount divided by the loan balance due, expressed as a percentage. The inverse concept of recovery is loss severity. Lossseverity rate is an estimation of the loan amount not collected when a loan defaults. The loss severity rate is the loss amountdivided by the loan balance due, expressed as a percentage. Generally, an increase in the recovery rate or a decrease in the lossseverity rate will increase the loan fair value, and vice versa.
Volatility ratesVolatility measures the potential variability of future prices and is often measured as the standard deviation of price movements.Volatility is an input to option pricing models used to value derivatives and issued structured notes. Volatility is used in valuingequity, interest rate, commodity and foreign exchange options. A higher volatility rate means that the underlying price or ratemovements are more likely to occur. Higher volatility rates may increase or decrease an option’s fair value depending on theoption’s terms. The determination of volatility rates is dependent on various factors, including but not limited to, the underlying’smarket price, the strike price and maturity.
Dividend yieldsA dividend yield is the underlying equity’s expected dividends expressed as an annual percentage of its price. Dividend yield isused as an input for forward equity price and option models. Higher dividend yields will decrease the forward price, and viceversa. A higher dividend yield will increase or decrease an option’s value, depending on the option’s terms.
Correlation ratesCorrelation is the linear relationship between the movements in two different variables. Correlation is an input to the valuation ofderivative contracts and issued structured notes when an instrument’s payout is determined by correlated variables. Whenvariables are positively correlated, an increase in one variable will result in an increase in the other variable. When variables arenegatively correlated, an increase in one variable will result in a decrease in the other variable. The referenced variables can bewithin a single asset class or market (equity, interest rate, commodities, credit and foreign exchange) or between variables indifferent asset classes (equity to foreign exchange, or interest rate to foreign exchange). Changes in correlation will eitherincrease or decrease a financial instrument’s fair value depending on the terms of the instrument.
Interest ratesAn interest rate is the percentage amount charged on a principal or notional amount. Increasing interest rates will decrease thediscounted cash flow value of a financial instrument, and vice versa.
Consumer Price Index swap ratesA CPI swap rate is expressed as a percentage of an increase in the average price of a basket of consumer goods and services,such as transportation, food and medical care. An increase in the CPI swap rate will cause inflation swap payments to be larger,and vice versa.
EV/EBITDA multiples, P/E multiples, EV/Rev multiples, and liquidity discountsPrivate equity valuation inputs include EV/EBITDA multiples, P/E multiples and EV/Rev multiples. These are used to calculateeither enterprise value or share value of a company based on a multiple of earnings or revenue estimates. Higher multiplesequate to higher fair values for all multiple types, and vice versa. A liquidity discount may be applied when few or no transactionsexist to support the valuations.
Credit EnhancementCredit enhancement is an input to the valuation of securitized transactions and is the amount of loan loss protection for a seniortranche. Credit enhancement is expressed as a percentage of the transaction sizes. An increase in credit enhancement will causethe credit spread to decrease and the tranche fair value to increase, and vice versa.
Interrelationships between unobservable inputsUnobservable inputs, including the above discount margin, default rate, prepayment rate, and recovery and loss severity rates,may not be independent of each other. For example, the discount margin can be affected by a change in default rate, prepaymentrate, or recovery and loss severity rates. Discount margins will generally decrease when default rates decline or when recoveryrates increase.
Consolidated Financial Statements Royal Bank of Canada: Annual Report 2020 155

Note 3 Fair value of financial instruments (continued)
Changes in fair value measurement for instruments measured on a recurring basis and categorized in Level 3For the year ended October 31, 2020
(Millions of Canadian dollars)
Fair valueat beginning
of period
Gains(losses)
included inearnings
Gains(losses)
includedin OCI (1)
Purchases(issuances)
Settlement(sales) and
other (2)
Transfersinto
Level 3
Transfersout of
Level 3
Fair valueat end of
period
Gains(losses) included
in earnings forpositions still held
AssetsSecurities
TradingDebt issued or guaranteed by:
U.S. state, municipal and agencies $ 58 $ – $ 1 $ – $ (15) $ – $ – $ 44 $ –Asset-backed securities
Non-CDO securities 2 – – – – – – 2 –Corporate debt and other debt 21 (1) – 1 (3) 12 – 30 –Equities 1,219 (126) 10 231 (74) 3 (2) 1,261 (47)
1,300 (127) 11 232 (92) 15 (2) 1,337 (47)
InvestmentMortgage-backed securities 27 – – – – – – 27 n.a.Corporate debt and other debt 153 – 4 – 3 – – 160 n.a.Equities 294 – 37 8 (4) – – 335 n.a.
474 – 41 8 (1) – – 522 n.a.Loans 680 92 8 551 (706) 624 (179) 1,070 (15)Other
Net derivative balances (3)Interest rate contracts (585) (116) (2) (31) 4 35 107 (588) (57)Foreign exchange contracts 21 (7) (3) 23 – (6) (6) 22 (13)Other contracts (195) (76) (1) (174) 44 (88) 189 (301) (8)Valuation adjustments 22 – – – 18 – – 40 –
Other assets 77 (7) 2 – (19) – – 53 (7)
$ 1,794 $ (241) $ 56 $ 609 $ (752) $ 580 $ 109 $ 2,155 $ (147)
LiabilitiesDeposits
Personal $ (156) $ 52 $ (3) $ (296) $ 30 $ (113) $ 347 $ (139) $ 29Business and government – – – – – – – – –
OtherOther liabilities (60) 5 (1) 4 14 – – (38) 5
$ (216) $ 57 $ (4) $ (292) $ 44 $ (113) $ 347 $ (177) $ 34
For the year ended October 31, 2019
(Millions of Canadian dollars)
Fair valueat beginning
of period
Gains(losses)
includedin earnings
Gains(losses)
includedin OCI (1)
Purchases(issuances)
Settlement(sales) and
other (2)
Transfersinto
Level 3
Transfersout of
Level 3
Fair valueat end of
period
Gains(losses) included
in earnings forpositions still held
AssetsSecurities
TradingDebt issued or guaranteed by:
U.S. state, municipal and agencies $ 66 $ – $ 1 $ – $ (9) $ – $ – $ 58 $ –Asset-backed securities
Non-CDO securities 110 15 – – (123) – – 2 3Corporate debt and other debt 21 1 1 – (2) – – 21 1Equities 1,148 (76) 2 333 (226) 39 (1) 1,219 (20)
1,345 (60) 4 333 (360) 39 (1) 1,300 (16)
InvestmentMortgage-backed securities – – – 27 – – – 27 n.a.Corporate debt and other debt 192 (3) 24 – (60) – – 153 n.a.Equities 237 – 16 5 36 – – 294 n.a.
429 (3) 40 32 (24) – – 474 n.a.
Loans 551 40 2 830 (481) 55 (317) 680 19Other
Net derivative balances (3)Interest rate contracts (504) (79) – (197) 217 (7) (15) (585) (42)Foreign exchange contracts 21 12 – – (6) 4 (10) 21 32Other contracts (84) 131 2 (131) 18 (38) (93) (195) 115Valuation adjustments 1 – – – 21 – – 22 –
Other assets 65 28 – – (16) – – 77 27
$ 1,824 $ 69 $ 48 $ 867 $ (631) $ 53 $ (436) $ 1,794 $ 135
LiabilitiesDeposits
Personal $ (390) $ (38) $ – $ (102) $ 29 $ (214) $ 559 $ (156) $ –Business and government 5 – – – – – (5) – –
OtherOther liabilities (68) (16) (1) 1 24 – – (60) (12)
$ (453) $ (54) $ (1) $ (101) $ 53 $ (214) $ 554 $ (216) $ (12)
(1) These amounts include the foreign currency translation gains or losses arising on consolidation of foreign subsidiaries relating to the Level 3 instruments, whereapplicable. The unrealized gains on Investment securities recognized in OCI were $32 million for the year ended October 31, 2020 (October 31, 2019 – gains of $43 million)excluding the translation gains or losses arising on consolidation.
(2) Other includes amortization of premiums or discounts recognized in net income.(3) Net derivatives as at October 31, 2020 included derivative assets of $602 million (October 31, 2019 – $423 million) and derivative liabilities of $1,429 million (October 31,
2019 – $1,160 million).n.a. not applicable
156 Royal Bank of Canada: Annual Report 2020 Consolidated Financial Statements

Transfers between fair value hierarchy levels for instruments carried at fair value on a recurring basisTransfers between Level 1 and Level 2, and transfers into and out of Level 3 are assumed to occur at the end of the period. For anasset or a liability that transfers into Level 3 during the period, the entire change in fair value for the period is excluded from theGains (losses) included in earnings for positions still held column of the above reconciliation, whereas for transfers out of Level 3during the period, the entire change in fair value for the period is included in the same column of the above reconciliation.
Transfers between Level 1 and 2 are dependent on whether fair value is obtained on the basis of quoted market prices in activemarkets (Level 1).
During the year ended October 31, 2020, transfers out of Level 1 to Level 2 included Investment U.S. state, municipal andagencies debt of $1,200 million, Trading U.S. state, municipal and agencies debt of $1,125 million and Obligations related tosecurities sold short of $804 million. During the year ended October 31, 2019, transfers out of Level 1 to Level 2 included Othercontracts, consisting of derivative related assets and derivative related liabilities of $1,996 million and $621 million, respectivelyand Trading U.S. state, municipal and agencies debt of $1,250 million and Obligations related to securities sold short of $202million.
During the year ended October 31, 2020, transfers out of Level 2 to Level 1 included Investment U.S. state, municipal andagencies debt of $937 million. During the year ended October 31, 2019, there were no significant transfers out of Level 2 to Level 1.
Transfers between Level 2 and Level 3 are primarily due to either a change in the market observability for an input, or a change inan unobservable input’s significance to a financial instrument’s fair value.
During the year ended October 31, 2020, significant transfers out of Level 2 to Level 3 included:• $624 million of Loans, due to changes in the significance of unobservable inputs.• $69 million of OTC equity options in Other contracts comprised of $51 million of derivative related assets and
$120 million of derivative related liabilities, due to changes in the market observability of inputs.• $113 million of Personal deposits, due to changes in the significance of unobservable inputs.During the year ended October 31, 2019, significant transfers out of Level 2 to Level 3 included $214 million of Personal
deposits, due to changes in the significance of unobservable inputs.
During the year ended October 31, 2020, significant transfers out of Level 3 to Level 2 included:• $179 million of Loans, due to changes in significance of unobservable inputs.• $107 million of Interest rate contracts comprised of $211 million of derivative related assets and $318 million of derivative
related liabilities, due to changes in the market observability of inputs.• $109 million of OTC equity options in Other contracts comprised of $76 million of derivative related assets and
$185 million of derivative related liabilities, due to changes in the market observability of inputs.• $347 million of Personal deposits, due to changes in the significance of unobservable inputs.During the year ended October 31, 2019, significant transfers out of Level 3 to Level 2 included:• $317 million of Loans, due to changes in the significance of unobservable inputs.• $86 million of OTC equity options in Other contracts comprised of $459 million of derivative related assets and $373
million of derivative related liabilities, due to changes in the market observability of inputs.• $559 million of Personal deposits, due to changes in the significance of unobservable inputs.
Positive and negative fair value movements of Level 3 financial instruments from using reasonably possible alternativeassumptionsA financial instrument is classified as Level 3 in the fair value hierarchy if one or more of its unobservable inputs maysignificantly affect the measurement of its fair value. In preparing the financial statements, appropriate levels for theseunobservable input parameters are chosen so that they are consistent with prevailing market evidence or managementjudgment. Due to the unobservable nature of the prices or rates, there may be uncertainty about the valuation of these Level 3financial instruments.
Consolidated Financial Statements Royal Bank of Canada: Annual Report 2020 157

Note 3 Fair value of financial instruments (continued)
The following table summarizes the impacts to fair values of Level 3 financial instruments using reasonably possiblealternative assumptions. This sensitivity disclosure is intended to illustrate the potential impact of the relative uncertainty in thefair value of Level 3 financial instruments. In reporting the sensitivities below, we offset balances in instances where: (i) the movein valuation factors cause an offsetting positive and negative fair value movement, (ii) both offsetting instruments are in Level 3,and (iii) exposures are managed and reported on a net basis. With respect to overall sensitivity, it is unlikely in practice that allreasonably possible alternative assumptions would simultaneously be realized.
As at
October 31, 2020 October 31, 2019
(Millions of Canadian dollars)Level 3
fair value
Positive fair valuemovement from
using reasonablypossible
alternatives
Negative fair valuemovement from
using reasonablypossible
alternativesLevel 3
fair value
Positive fair valuemovement from
using reasonablypossible
alternatives
Negative fair valuemovement from
using reasonablypossible
alternatives
SecuritiesTrading
Debt issued or guaranteed by:U.S. state, municipal and
agencies $ 44 $ 1 $ (1) $ 58 $ 1 $ (1)Asset-backed securities 2 – – 2 – –Corporate debt and other debt 30 1 (1) 21 – –Equities 1,261 15 (15) 1,219 13 (14)
InvestmentMortgage-backed securities 27 3 (3) 27 1 (1)Corporate debt and other debt 160 18 (16) 153 15 (13)Equities 335 28 (28) 294 26 (27)
Loans 1,070 49 (49) 680 9 (12)Derivatives 602 2 (2) 423 6 (3)Other assets 53 – – 77 – –
$ 3,584 $ 117 $ (115) $ 2,954 $ 71 $ (71)
Deposits $ (139) $ 4 $ (4) $ (156) $ 4 $ (4)Derivatives (1,429) 13 (55) (1,160) 20 (17)Other
Other liabilities (38) – – (60) – –
$ (1,606) $ 17 $ (59) $ (1,376) $ 24 $ (21)
Sensitivity resultsAs at October 31, 2020, the effects of applying other reasonably possible alternative assumptions to the Level 3 asset positionswould be an increase of $117 million and a decrease of $115 million in fair value, of which $49 million and $47 million would berecorded in Other components of equity, respectively. The effects of applying these assumptions to the Level 3 liability positionswould result in a decrease of $17 million and an increase of $59 million in fair value.
Level 3 valuation inputs and approaches to developing reasonably possible alternative assumptionsThe following is a summary of the unobservable inputs used in the valuation of the Level 3 instruments and our approaches todeveloping reasonably possible alternative assumptions used to determine sensitivity.
Financial assets orliabilities
Sensitivity methodology
Asset-backed securities,corporate debt, governmentdebt, municipal bonds andloans
Sensitivities are determined based on adjusting, plus or minus one standard deviation, the bid-offer spreads or input prices if a sufficient number of prices is received, adjusting inputparameters such as credit spreads or using high and low vendor prices as reasonably possiblealternative assumptions.
Private equities, hedge fundinvestments and relatedequity derivatives
Sensitivity of direct private equity investments is determined by (i) adjusting the discount rateby 2% when the discounted cash flow method is used to determine fair value, (ii) adjusting theprice multiples based on the range of multiples of comparable companies when price-multiples-based models are used, or (iii) using an alternative valuation approach. The private equity fund,hedge fund and related equity derivative NAVs are provided by the fund managers, and as aresult, there are no other reasonably possible alternative assumptions for these investments.
Interest rate derivatives Sensitivities of interest rate and cross currency swaps are derived using plus or minus onestandard deviation of the inputs, and an amount representing model and parameter uncertainty,where applicable.
Equity derivatives Sensitivity of the Level 3 position is determined by shifting the unobservable model inputs byplus or minus one standard deviation of the pricing service market data including volatility,dividends or correlations, as applicable.
Bank funding and deposits Sensitivities of deposits are calculated by shifting the funding curve by plus or minus certainbasis points.
Structured notes Sensitivities for interest-rate-linked and equity-linked structured notes are derived by adjustinginputs by plus or minus one standard deviation, and for other deposits, by estimating areasonable move in the funding curve by plus or minus certain basis points.
158 Royal Bank of Canada: Annual Report 2020 Consolidated Financial Statements

Fair value for financial instruments that are carried at amortized cost and classified using the fair value hierarchyAs at October 31, 2020
Fair value alwaysapproximates
carrying value (1)
Fair value may not approximate carrying valueFair value measurements using Total
fair value(Millions of Canadian dollars) Level 1 Level 2 Level 3 TotalInterest-bearing deposits with banks $ 17,410 $ – $ – $ – $ – $ 17,410Amortized cost securities (2) – 502 58,125 – 58,627 58,627Assets purchased under reverse
repurchase agreements andsecurities borrowed 37,064 – 11,557 – 11,557 48,621
LoansRetail 66,151 – 392,093 4,640 396,733 462,884Wholesale 11,278 – 182,094 5,381 187,475 198,753
77,429 – 574,187 10,021 584,208 661,637
Other assets 56,484 – 450 131 581 57,065
188,387 502 644,319 10,152 654,973 843,360
DepositsPersonal 245,777 – 78,500 527 79,027 324,804Business and government 364,451 – 153,395 655 154,050 518,501Bank 19,070 – 7,439 9 7,448 26,518
629,298 – 239,334 1,191 240,525 869,823
Obligations related to assets soldunder repurchase agreements andsecurities loaned 18,309 – – – – 18,309
Other liabilities 56,200 – 1,004 8,515 9,519 65,719Subordinated debentures – – 10,012 59 10,071 10,071
$ 703,807 $ – $ 250,350 $ 9,765 $ 260,115 $ 963,922
As at October 31, 2019
Fair value alwaysapproximates
carrying value (1)
Fair value may not approximate carrying value
Fair value measurements using Totalfair value(Millions of Canadian dollars) Level 1 Level 2 Level 3 Total
Interest-bearing deposits with banks $ 16,062 $ – $ – $ – $ – $ 16,062Amortized cost securities (2) – 523 44,581 – 45,104 45,104Assets purchased under reverse
repurchase agreements andsecurities borrowed 48,784 – 12,110 – 12,110 60,894
LoansRetail 66,647 – 352,717 5,052 357,769 424,416Wholesale 6,596 – 173,274 4,775 178,049 184,645
73,243 – 525,991 9,827 535,818 609,061
Other assets 49,761 – 469 145 614 50,375
187,850 523 583,151 9,972 593,646 781,496
DepositsPersonal 195,583 – 81,179 591 81,770 277,353Business and government 296,166 – 155,646 724 156,370 452,536Bank 15,093 – 7,671 9 7,680 22,773
506,842 – 244,496 1,324 245,820 752,662
Obligations related to assets soldunder repurchase agreements andsecurities loaned 7,974 – – – – 7,974
Other liabilities 50,601 – 445 9,978 10,423 61,024Subordinated debentures 8 – 9,864 58 9,922 9,930
$ 565,425 $ – $ 254,805 $ 11,360 $ 266,165 $ 831,590
(1) Certain financial instruments have not been assigned to a level as the carrying amount always approximates their fair values due to their short-term nature (instrumentsthat are receivable or payable on demand, or with original maturity of three months or less) and insignificant credit risk.
(2) Included in Securities – Investment, net of applicable allowance on the Consolidated Balance Sheets.
Fair values of financial assets and liabilities carried at amortized cost and disclosed in the table above are determined using thefollowing valuation techniques and inputs.
Amortized cost securitiesFair values of government bonds, corporate bonds, and ABS are based on quoted prices. Fair values of certain Non-OECDgovernment bonds are based on vendor prices or the discounted cash flow method with yield curves of other countries’government bonds as inputs. For ABS, where market prices are not available, the fair value is determined using the discountedcash flow method. The inputs to the valuation model generally include market interest rates, spreads and yields derived fromcomparable securities, prepayment, and LGD.
Consolidated Financial Statements Royal Bank of Canada: Annual Report 2020 159

Note 3 Fair value of financial instruments (continued)
Assets purchased under reverse repurchase agreements and securities borrowed, and Obligations related to assets sold underrepurchase agreements and securities loanedValuation methods used for the long-term instruments are described in the Fair value of assets and liabilities measured on arecurring basis and classified using the fair value hierarchy section of this note. The carrying values of short-term instrumentsgenerally approximate their fair values.
Loans – RetailRetail loans include residential mortgages, personal and small business loans and credit cards. For residential mortgages, andpersonal and small business loans, we segregate the portfolio based on certain attributes such as product type, contractualinterest rate, term to maturity and credit scores, if applicable. Fair values of these loans are determined by the discounted cashflow method using applicable inputs such as prevailing interest rates, contractual and posted client rates, client discounts, creditspreads, prepayment rates and loan-to-value ratios. Fair values of credit card receivables are also calculated based on adiscounted cash flow method with portfolio yields, write-offs and monthly payment rates as inputs. The carrying values of short-term and variable rate loans generally approximate their fair values.
Loans – WholesaleWhere market prices are available, wholesale loans are valued based on market prices. Otherwise, fair value is determined bythe discounted cash flow method using the following inputs: market interest rates and market based spreads of assets withsimilar credit ratings and terms to maturity, LGD, expected default frequency implied from credit default swap prices, if available,and relevant pricing information such as contractual rate, origination and maturity dates, redemption price, coupon paymentfrequency and date convention.
DepositsDeposits are comprised of demand, notice, and term deposits which include senior deposit notes we have issued to provide uswith long-term funding. Fair values of term deposits are determined by one of several valuation techniques: (i) for term depositsand similar instruments, we segregate the portfolio based on term to maturity. Fair values of these instruments are determinedby the discounted cash flow method using inputs such as client rates for new sales of the corresponding terms; and (ii) for seniordeposit notes, we use actual traded prices, vendor prices or the discounted cash flow method using a market interest rate curveand our funding spreads as inputs. The carrying values of demand, notice, and short-term term deposits generally approximatetheir fair values.
Other assets and Other liabilitiesOther assets and Other liabilities include receivables and payables relating to certain commodities. Fair values of the commodityreceivables and payables are calculated by the discounted cash flow method using applicable inputs such as market interestrates, counterparties’ credit spreads, our funding spreads, commodity forward prices and spot prices.
Subordinated debenturesFair values of Subordinated debentures are based on market prices, dealer quotes or vendor prices when available. Where pricescannot be observed, fair value is determined using the discounted cash flow method, with applicable inputs such as marketinterest rates and credit spreads.
160 Royal Bank of Canada: Annual Report 2020 Consolidated Financial Statements

Note 4 Securities
Carrying value of securitiesAs at October 31, 2020
Term to maturity (1) With nospecific
maturity(Millions of Canadian dollars)
Within3 months
3 monthsto 1 year
1 year to5 years
5 years to10 years
Over10 years Total
Trading (2)
Debt issued or guaranteed by:Canadian government $ 2,301 $ 7,004 $ 6,054 $ 3,569 $ 8,419 $ – $ 27,347U.S. state, municipal and agencies 559 4,532 12,546 4,134 14,810 – 36,581Other OECD government 56 695 3,010 584 2,120 – 6,465
Mortgage-backed securities – – – – 39 – 39Asset-backed securities 3 164 82 181 98 – 528Corporate debt and other debt
Bankers’ acceptances 65 227 – – – – 292Certificates of deposit 2 63 35 7 4 – 111Other (3) 1,048 3,472 5,521 3,007 8,043 – 21,091
Equities – – – – – 43,617 43,617
4,034 16,157 27,248 11,482 33,533 43,617 136,071
Fair value through othercomprehensive income (2)
Debt issued or guaranteed by:Canadian government
FederalAmortized cost – 204 1,689 272 397 – 2,562Fair value – 204 1,690 269 378 – 2,541Yield (4) – 1.4% 1.4% 1.2% 1.4% – 1.4%
Provincial and municipalAmortized cost 5 908 629 7 1,688 – 3,237Fair value 5 911 630 8 1,679 – 3,233Yield (4) 4.5% 1.3% 2.7% 4.3% 2.6% – 2.2%
U.S. state, municipal and agenciesAmortized cost 1,772 9,736 8,777 2,227 16,011 – 38,523Fair value 1,775 9,739 8,779 2,237 15,994 – 38,524Yield (4) 0.1% 1.7% 1.1% 2.6% 2.2% – 1.7%
Other OECD governmentAmortized cost 274 2,288 4,773 1 – – 7,336Fair value 274 2,289 4,781 1 – – 7,345Yield (4) 1.7% 2.4% 1.8% 3.6% – – 2.0%
Mortgage-backed securitiesAmortized cost – – – 192 2,226 – 2,418Fair value – – – 189 2,181 – 2,370Yield (4) – – – 1.2% 1.2% – 1.2%
Asset-backed securitiesAmortized cost – – 10 4,294 4,059 – 8,363Fair value – – 10 4,247 4,011 – 8,268Yield (4) – – 1.4% 1.4% 1.4% – 1.4%
Corporate debt and other debtAmortized cost 2,670 5,796 10,425 92 58 – 19,041Fair value 2,670 5,801 10,466 106 71 – 19,114Yield (4) 0.9% 1.6% 1.5% 2.1% 2.4% – 1.5%
EquitiesCost – – – – – 276 276Fair value (5) – – – – – 525 525
Amortized cost 4,721 18,932 26,303 7,085 24,439 276 81,756Fair value 4,724 18,944 26,356 7,057 24,314 525 81,920
Amortized Cost (2)
Debt issued or guaranteed by:Canadian government 438 1,862 16,044 1,819 – – 20,163U.S. state, municipal and agencies 8 787 1,615 1,622 18,281 – 22,313Other OECD government 2,178 2,045 2,643 – – – 6,866
Asset-backed securities – 1 159 – – – 160Corporate debt and other debt 625 2,644 4,805 219 28 – 8,321
Amortized cost, net of allowance 3,249 7,339 25,266 3,660 18,309 – 57,823Fair value 3,252 7,392 25,663 3,798 18,522 – 58,627
Total carrying value of securities $ 12,007 $ 42,440 $ 78,870 $ 22,199 $ 76,156 $ 44,142 $ 275,814
Consolidated Financial Statements Royal Bank of Canada: Annual Report 2020 161

Note 4 Securities (continued)
As at October 31, 2019
Term to maturity (1) With nospecific
maturity(Millions of Canadian dollars)
Within3 months
3 monthsto 1 year
1 year to5 years
5 years to10 years
Over10 years Total
Trading (2)Debt issued or guaranteed by:
Canadian government $ 1,974 $ 11,265 $ 7,783 $ 1,778 $ 8,611 $ – $ 31,411U.S. state, municipal and agencies 771 7,122 8,601 9,537 15,661 – 41,692Other OECD government 538 1,418 2,211 1,466 863 – 6,496
Mortgage-backed securities – – – – 482 – 482Asset-backed securities 359 63 308 267 338 – 1,335Corporate debt and other debt
Bankers’ acceptances 433 – – – – – 433Certificates of deposit 586 383 75 20 6 – 1,070Other (3) 1,369 2,773 8,268 2,827 6,925 – 22,162
Equities – – – – – 41,453 41,453
6,030 23,024 27,246 15,895 32,886 41,453 146,534
Fair value through other comprehensiveincome (2)Debt issued or guaranteed by:
Canadian governmentFederal
Amortized cost – 5 596 – 54 – 655Fair value – 5 595 – 57 – 657Yield (4) – 1.1% 1.4% – 4.2% – 1.7%
Provincial and municipalAmortized cost – 4 954 13 1,907 – 2,878Fair value – 4 953 14 1,927 – 2,898Yield (4) – 4.8% 2.7% 4.5% 2.8% – 2.8%
U.S. state, municipal and agenciesAmortized cost 1,597 1,085 3,290 829 13,986 – 20,787Fair value 1,598 1,087 3,294 844 14,053 – 20,876Yield (4) 2.1% 1.8% 2.0% 2.9% 2.7% – 2.5%
Other OECD governmentAmortized cost 236 178 3,839 1 – – 4,254Fair value 236 178 3,836 1 – – 4,251Yield (4) 1.2% 2.1% 2.4% 3.8% – – 2.3%
Mortgage-backed securitiesAmortized cost – – – 206 2,503 – 2,709Fair value – – – 205 2,497 – 2,702Yield (4) – – – 3.0% 2.7% – 2.7%
Asset-backed securitiesAmortized cost 1 – 8 3,982 4,190 – 8,181Fair value – – 8 3,972 4,169 – 8,149Yield (4) – – 3.2% 3.2% 3.1% – 3.2%
Corporate debt and other debtAmortized cost 1,564 3,222 12,668 79 122 – 17,655Fair value 1,565 3,225 12,673 89 138 – 17,690Yield (4) 1.4% 1.9% 2.0% 2.0% 3.1% – 1.9%
EquitiesCost – – – – – 248 248Fair value (5) – – – – – 463 463
Amortized cost 3,398 4,494 21,355 5,110 22,762 248 57,367Fair value 3,399 4,499 21,359 5,125 22,841 463 57,686
Amortized Cost (2)Debt issued or guaranteed by:
Canadian government 682 1,978 9,831 1,515 – – 14,006U.S. state, municipal and agencies 297 478 1,680 2,018 12,190 – 16,663Other OECD government 2,252 1,431 1,634 – – – 5,317
Asset-backed securities – 9 616 – – – 625Corporate debt and other debt 400 1,853 5,717 145 58 – 8,173
Amortized cost, net of allowance 3,631 5,749 19,478 3,678 12,248 – 44,784Fair value 3,631 5,822 19,628 3,746 12,277 – 45,104
Total carrying value of securities $ 13,060 $ 33,272 $ 68,083 $ 24,698 $ 67,975 $ 41,916 $ 249,004
(1) Actual maturities may differ from contractual maturities shown above as borrowers may have the right to extend or prepay obligations with or without penalties.(2) Trading securities and FVOCI securities are recorded at fair value. Amortized cost securities, included in Investment securities, are recorded at amortized cost and
presented net of allowance for credit losses.(3) Primarily composed of corporate debt, supra-national debt, and commercial paper.(4) The weighted average yield is derived using the contractual interest rate and the carrying value at the end of the year for the respective securities.(5) Certain equity securities that are not held-for-trading purposes are designated as FVOCI. During the year ended October 31, 2020, we disposed of $2 million of equity
securities measured at FVOCI (October 31, 2019 – $129 million). The cumulative gain on the dates of disposals was $nil (October 31, 2019 – $1 million).
162 Royal Bank of Canada: Annual Report 2020 Consolidated Financial Statements

Unrealized gains and losses on securities at FVOCI (1), (2)
As at
October 31, 2020 October 31, 2019
(Millions of Canadian dollars)
Cost/Amortized
cost
Grossunrealized
gains
Grossunrealized
lossesFair
value
Cost/Amortized
cost
Grossunrealized
gains
Grossunrealized
lossesFair
value
Debt issued or guaranteed by:Canadian government
Federal (3) $ 2,562 $ 1 $ (22) $ 2,541 $ 655 $ 3 $ (1) $ 657Provincial and municipal 3,237 27 (31) 3,233 2,878 43 (23) 2,898
U.S. state, municipal and agencies (3) 38,523 323 (322) 38,524 20,787 215 (126) 20,876Other OECD government 7,336 11 (2) 7,345 4,254 2 (5) 4,251
Mortgage-backed securities (3) 2,418 5 (53) 2,370 2,709 1 (8) 2,702Asset-backed securities
CDO 7,504 – (90) 7,414 7,334 1 (35) 7,300Non-CDO securities 859 2 (7) 854 847 4 (2) 849
Corporate debt and other debt 19,041 76 (3) 19,114 17,655 45 (10) 17,690Equities 276 253 (4) 525 248 218 (3) 463
$ 81,756 $ 698 $ (534) $ 81,920 $ 57,367 $ 532 $ (213) $ 57,686
(1) Excludes $57,823 million of held-to-collect securities as at October 31, 2020 that are carried at amortized cost, net of allowance for credit losses (October 31, 2019 –$44,784 million).
(2) Gross unrealized gains and losses includes $8 million of allowance for credit losses on debt securities at FVOCI as at October 31, 2020 (October 31, 2019 – $(3) million)recognized in income and Other components of equity.
(3) The majority of the MBS are residential. Cost/Amortized cost, Gross unrealized gains, Gross unrealized losses and Fair value related to commercial MBS are$2,185 million, $nil, $48 million and $2,137 million, respectively as at October 31, 2020 (October 31, 2019 – $2,051 million, $1 million, $6 million and $2,046 million,respectively).
Allowance for credit losses on investment securitiesThe following tables reconcile the opening and closing allowance for debt securities at FVOCI and amortized cost by stage.Reconciling items include the following:• Transfers between stages, which are presumed to occur before any corresponding remeasurement of the allowance.• Purchases, which reflect the allowance related to assets newly recognized during the period, including those assets that
were derecognized following a modification of terms.• Sales and maturities, which reflect the allowance related to assets derecognized during the period without a credit loss
being incurred, including those assets that were derecognized following a modification of terms.• Changes in risk, parameters and exposures, which comprise the impact of changes in model inputs or assumptions, including
changes in forward-looking macroeconomic conditions; partial repayments; changes in the measurement following atransfer between stages; and unwinding of the time value discount due to the passage of time.
Allowance for credit losses – securities at FVOCI (1)
For the year ended
October 31, 2020 October 31, 2019
Performing Impaired Performing Impaired
(Millions of Canadian dollars) Stage 1 Stage 2 Stage 3 (2) Total Stage 1 Stage 2 Stage 3 (2) Total
Balance at beginning of period $ 4 $ – $ (7) $ (3) $ 4 $ 7 $ – $ 11Provision for credit losses
Transfers to stage 1 – – – – – – – –Transfers to stage 2 – – – – – – – –Transfers to stage 3 – – – – – – – –Purchases 18 – – 18 5 – – 5Sales and maturities (13) – – (13) (3) (7) – (10)Changes in risk, parameters and exposures 3 – 4 7 (2) 1 (8) (9)
Write-offs – – – – – – – –Exchange rate and other – – (1) (1) – (1) 1 –
Balance at end of period $ 12 $ – $ (4) $ 8 $ 4 $ – $ (7) $ (3)
(1) Expected credit losses on debt securities at FVOCI are not separately recognized on the balance sheet as the related securities are recorded at fair value. The cumulativeamount of credit losses recognized in income is presented in Other components of equity.
(2) Reflects changes in the allowance for purchased credit impaired securities.
Consolidated Financial Statements Royal Bank of Canada: Annual Report 2020 163

Note 4 Securities (continued)
Allowance for credit losses – securities at amortized costFor the year ended
October 31, 2020 October 31, 2019
Performing Impaired Performing Impaired
(Millions of Canadian dollars) Stage 1 Stage 2 Stage 3 Total Stage 1 Stage 2 Stage 3 Total
Balance at beginning of period $ 5 $ 19 $ – $ 24 $ 6 $ 32 $ – $ 38Provision for credit losses –
Transfers to stage 1 – – – – – – – –Transfers to stage 2 – – – – – – – –Transfers to stage 3 – – – – – – – –Purchases 9 – – 9 7 – – 7Sales and maturities (2) – – (2) (1) – – (1)Changes in risk, parameters and exposures (2) 1 – (1) (6) (15) – (21)
Write-offs – – – – – – – –Exchange rate and other – (1) – (1) (1) 2 – 1
Balance at end of period $ 10 $ 19 $ – $ 29 $ 5 $ 19 $ – $ 24
Credit risk exposure by internal risk ratingThe following table presents the fair value of debt securities at FVOCI and gross carrying amount of securities at amortized cost.Risk ratings are based on internal ratings used in the measurement of expected credit losses, as at the reporting date, as outlinedin the internal ratings maps in the Credit risk section of Management’s Discussion and Analysis.
As at
October 31, 2020 October 31, 2019
Performing Impaired Performing Impaired
(Millions of Canadian dollars) Stage 1 Stage 2 Stage 3 (1) Total Stage 1 Stage 2 Stage 3 (1) Total
Investment securitiesSecurities at FVOCIInvestment grade $ 80,719 $ 87 $ – $ 80,806 $ 56,671 $ 1 $ – $ 56,672Non-investment grade 431 1 – 432 400 1 – 401Impaired – – 157 157 – – 150 150
$ 81,150 $ 88 $ 157 $ 81,395 $ 57,071 $ 2 $ 150 $ 57,223Items not subject to impairment (2) 525 463
81,920 57,686
Securities at amortized costInvestment grade $ 56,885 $ – $ – $ 56,885 $ 43,681 $ 46 $ – $ 43,727Non-investment grade 647 320 – 967 695 386 – 1,081Impaired – – – – – – – –
$ 57,532 $ 320 $ – $ 57,852 $ 44,376 $ 432 $ – $ 44,808Allowance for credit losses 10 19 – 29 5 19 – 24
Amortized cost $ 57,522 $ 301 $ – $ 57,823 $ 44,371 $ 413 $ – $ 44,784
(1) Includes $157 million of purchased credit impaired securities (October 31, 2019 – $150 million).(2) Investment securities at FVOCI not subject to impairment represent equity securities designated as FVOCI.
164 Royal Bank of Canada: Annual Report 2020 Consolidated Financial Statements

Note 5 Loans and allowance for credit losses
Loans by geography and portfolio net of allowanceAs at October 31, 2020
(Millions of Canadian dollars) CanadaUnitedStates
OtherInternational Total
Allowance forloan losses (1)
Total netof allowance
Retail (2)
Residential mortgages $ 319,287 $ 20,331 $ 2,979 $ 342,597 $ (515) $ 342,082Personal 79,778 9,050 3,183 92,011 (1,185) 90,826Credit cards (3) 17,060 340 226 17,626 (1,211) 16,415Small business (4) 5,742 – – 5,742 (123) 5,619
Wholesale (2), (5) 126,348 64,375 17,932 208,655 (2,605) 206,050
Total loans $ 548,215 $ 94,096 $ 24,320 $ 666,631 $ (5,639) $ 660,992
Undrawn loan commitments – Retail 226,439 4,314 1,628 232,381 (176)Undrawn loan commitments – Wholesale 111,860 184,308 64,859 361,027 (187)
As at October 31, 2019
(Millions of Canadian dollars) CanadaUnitedStates
OtherInternational Total
Allowance forloan losses (1)
Total netof allowance
Retail (2)Residential mortgages $ 287,767 $ 17,012 $ 3,312 $ 308,091 $ (402) $ 307,689Personal 81,547 7,399 3,304 92,250 (762) 91,488Credit cards (3) 19,617 439 255 20,311 (791) 19,520Small business (4) 5,434 – – 5,434 (50) 5,384
Wholesale (2), (5) 124,312 53,782 17,776 195,870 (1,095) 194,775
Total loans $ 518,677 $ 78,632 $ 24,647 $ 621,956 $ (3,100) $ 618,856Undrawn loan commitments – Retail 208,336 5,063 801 214,200 (225)Undrawn loan commitments – Wholesale 101,017 176,022 54,982 332,021 (70)
(1) Excludes allowance for loans measured at FVOCI of $6 million (October 31, 2019 – $nil).(2) Geographic information is based on residence of the borrower.(3) The credit cards business is managed as a single portfolio and includes both consumer and business cards.(4) Includes small business exposure managed on a pooled basis.(5) Includes small business exposure managed on an individual client basis.
Loans maturity and rate sensitivity
As at October 31, 2020
Maturity term (1) Rate sensitivity
(Millions of Canadian dollars)Under
1 year (2)1 to 5
yearsOver 5years Total Floating Fixed Rate
Non-rate-sensitive Total
Retail $ 213,946 $ 218,342 $ 25,688 $ 457,976 $ 129,870 $ 322,122 $ 5,984 $ 457,976Wholesale 160,031 37,346 11,278 208,655 34,686 171,171 2,798 208,655
Total loans $ 373,977 $ 255,688 $ 36,966 $ 666,631 $ 164,556 $ 493,293 $ 8,782 $ 666,631Allowance for loan losses (5,639) (5,639)
Total loans net of allowance for loan losses $ 660,992 $ 660,992
As at October 31, 2019
Maturity term (1) Rate sensitivity
(Millions of Canadian dollars)Under
1 year (2)1 to 5years
Over 5years Total Floating Fixed Rate
Non-rate-sensitive Total
Retail $ 216,610 $ 187,721 $ 21,755 $ 426,086 $ 114,736 $ 304,448 $ 6,902 $ 426,086Wholesale 154,445 30,512 10,913 195,870 27,329 165,502 3,039 195,870
Total loans $ 371,055 $ 218,233 $ 32,668 $ 621,956 $ 142,065 $ 469,950 $ 9,941 $ 621,956Allowance for loan losses (3,100) (3,100)
Total loans net of allowance for loan losses $ 618,856 $ 618,856
(1) Generally, based on the earlier of contractual repricing or maturity date.(2) Includes variable rate loans that can be repriced at the clients’ discretion without penalty.
Consolidated Financial Statements Royal Bank of Canada: Annual Report 2020 165

Note 5 Loans and allowance for credit losses (continued)
Allowance for credit lossesFor the year ended
October 31, 2020 October 31, 2019
(Millions of Canadian dollars)
Balance atbeginningof period
Provisionfor credit
lossesNet
write-offs (1)
Exchangerate and
other
Balanceat end
of period
Balance atbeginningof period
Provisionfor credit
lossesNet
write-offs (1)
Exchangerate and
other
Balanceat end
of period
RetailResidential mortgages $ 402 $ 190 $ (34) $ (40) $ 518 $ 382 $ 68 $ (37) $ (11) $ 402Personal 935 801 (411) (16) 1,309 895 526 (474) (12) 935Credit cards 832 900 (484) (2) 1,246 760 590 (518) – 832Small business 61 117 (31) (7) 140 51 41 (28) (3) 61
Wholesale 1,165 2,140 (380) (130) 2,795 979 661 (397) (78) 1,165Customers’ liability under
acceptances 24 83 – – 107 21 5 – (2) 24
$ 3,419 $ 4,231 $ (1,340) $ (195) $6,115 $ 3,088 $ 1,891 $ (1,454) $ (106) $ 3,419
Presented as:Allowance for loan losses $ 3,100 $5,639 $ 2,912 $ 3,100Other liabilities – Provisions 295 363 154 295Customers’ liability under
acceptances 24 107 21 24Other components of equity – 6 1 –
(1) Loans written-off are generally subject to continued collection efforts for a period of time following write-off. The contractual amount outstanding on loans written-offduring the year ended October 31, 2020 that are no longer subject to enforcement activity was $193 million (October 31, 2019 – $179 million).
The following table reconciles the opening and closing allowance for each major product of loans and commitments asdetermined by our modelled, scenario-weighted allowance and the application of expert credit judgment as applicable.Reconciling items include the following:• Model changes, which generally comprise the impact of significant changes to the quantitative models used to estimate
expected credit losses and any staging impacts that may arise.• Transfers between stages, which are presumed to occur before any corresponding remeasurements of the allowance.• Originations, which reflect the allowance related to assets newly recognized during the period, including those assets that
were derecognized following a modification of terms.• Maturities, which reflect the allowance related to assets derecognized during the period without a credit loss being incurred,
including those assets that were derecognized following a modification of terms.• Changes in risk, parameters and exposures, which comprise the impact of changes in model inputs or assumptions, including
changes in forward-looking macroeconomic conditions; partial repayments and additional draws on existing facilities;changes in the measurement following a transfer between stages; and unwinding of the time value discount due to thepassage of time in stage 1 and stage 2.
166 Royal Bank of Canada: Annual Report 2020 Consolidated Financial Statements

Allowance for credit losses – Retail and wholesale loansFor the year ended
October 31, 2020 October 31, 2019
Performing Impaired Performing Impaired
(Millions of Canadian dollars) Stage 1 Stage 2 Stage 3 Total Stage 1 Stage 2 Stage 3 Total
Residential mortgagesBalance at beginning of period $ 146 $ 77 $ 179 $ 402 $ 142 $ 64 $ 176 $ 382Provision for credit losses
Transfers to stage 1 221 (186) (35) – 87 (66) (21) –Transfers to stage 2 (35) 42 (7) – (13) 16 (3) –Transfers to stage 3 (3) (33) 36 – (3) (31) 34 –Originations 76 – – 76 51 – – 51Maturities (16) (15) – (31) (14) (10) – (24)Changes in risk, parameters and
exposures (180) 291 34 145 (104) 104 41 41Write-offs – – (44) (44) – – (45) (45)Recoveries – – 10 10 – – 8 8Exchange rate and other (3) (16) (21) (40) – – (11) (11)
Balance at end of period $ 206 $ 160 $ 152 $ 518 $ 146 $ 77 $ 179 $ 402
PersonalBalance at beginning of period $ 272 $ 520 $ 143 $ 935 $ 242 $ 512 $ 141 $ 895Provision for credit losses
Model changes – – – – 23 (48) – (25)Transfers to stage 1 494 (487) (7) – 544 (537) (7) –Transfers to stage 2 (107) 109 (2) – (87) 88 (1) –Transfers to stage 3 (3) (64) 67 – (2) (142) 144 –Originations 118 – – 118 101 1 – 102Maturities (49) (97) – (146) (31) (112) – (143)Changes in risk, parameters and
exposures (245) 756 318 829 (517) 758 351 592Write-offs – – (545) (545) – – (600) (600)Recoveries – – 134 134 – – 126 126Exchange rate and other – (4) (12) (16) (1) – (11) (12)
Balance at end of period $ 480 $ 733 $ 96 $ 1,309 $ 272 $ 520 $ 143 $ 935
Credit cardsBalance at beginning of period $ 173 $ 659 $ – $ 832 $ 161 $ 599 $ – $ 760Provision for credit losses
Transfers to stage 1 470 (470) – – 452 (452) – –Transfers to stage 2 (98) 98 – – (81) 81 – –Transfers to stage 3 (2) (372) 374 – (2) (341) 343 –Originations 7 – – 7 5 – – 5Maturities (8) (29) – (37) (5) (27) – (32)Changes in risk, parameters and
exposures (177) 997 110 930 (358) 800 175 617Write-offs – – (617) (617) – – (655) (655)Recoveries – – 133 133 – – 137 137Exchange rate and other (1) (1) – (2) 1 (1) – –
Balance at end of period $ 364 $ 882 $ – $ 1,246 $ 173 $ 659 $ – $ 832
Small businessBalance at beginning of period $ 29 $ 10 $ 22 $ 61 $ 17 $ 16 $ 18 $ 51Provision for credit losses
Model changes – – – – 11 (7) – 4Transfers to stage 1 12 (12) – – 18 (18) – –Transfers to stage 2 (11) 11 – – (3) 3 – –Transfers to stage 3 – (2) 2 – – (9) 9 –Originations 20 – – 20 13 – – 13Maturities (7) (6) – (13) (5) (8) – (13)Changes in risk, parameters and
exposures 35 28 47 110 (22) 32 27 37Write-offs – – (38) (38) – – (36) (36)Recoveries – – 7 7 – – 8 8Exchange rate and other – – (7) (7) – 1 (4) (3)
Balance at end of period $ 78 $ 29 $ 33 $ 140 $ 29 $ 10 $ 22 $ 61
WholesaleBalance at beginning of period $ 281 $ 396 $ 488 $ 1,165 $ 274 $ 340 $ 365 $ 979Provision for credit losses
Transfers to stage 1 154 (149) (5) – 145 (133) (12) –Transfers to stage 2 (200) 221 (21) – (33) 36 (3) –Transfers to stage 3 (14) (116) 130 – (5) (57) 62 –Originations 860 – – 860 239 44 – 283Maturities (479) (301) – (780) (162) (165) – (327)Changes in risk, parameters and
exposures 410 1,091 559 2,060 (178) 331 552 705Write-offs – – (437) (437) – – (440) (440)Recoveries – – 57 57 – – 43 43Exchange rate and other (17) (10) (103) (130) 1 – (79) (78)
Balance at end of period $ 995 $ 1,132 $ 668 $ 2,795 $ 281 $ 396 $ 488 $ 1,165
Consolidated Financial Statements Royal Bank of Canada: Annual Report 2020 167

Note 5 Loans and allowance for credit losses (continued)
Key inputs and assumptionsThe measurement of expected credit losses is a complex calculation that involves a large number of interrelated inputs andassumptions and the allowance is not sensitive to any one single factor alone. The key drivers of changes in expected creditlosses include the following:
• Changes in the credit quality of the borrower or instrument, primarily reflected in changes in internal risk ratings;• Changes in forward-looking macroeconomic conditions, specifically the macroeconomic variables to which our models are
calibrated, which are those most closely correlated with credit losses in the relevant portfolio;• Changes in scenario design and the weights assigned to each scenario; and• Transfers between stages, which can be triggered by changes to any of the above inputs.
The COVID-19 pandemic significantly impacted our determination of allowance for credit losses and required the application ofheightened judgment. Measures to contain the COVID-19 pandemic have sharply curtailed economic activity in many countries,resulting in unprecedented declines in GDP and a substantial increase in unemployment starting in the spring of 2020. Significantfiscal and monetary policy stimulus, as well as bank-led deferral programs have generally supported lower defaults during fiscal2020. However, a resurgence of virus spread and re-imposition of containment measures to varying degrees in some regions,along with the tapering off of certain elements of fiscal support, has raised further uncertainty with regards to the timing andextent of recovery. As there is uncertainty as to how containment and support measures will evolve, our allowances have ahigher than usual degree of uncertainty and the inputs used are inherently subject to change, which may materially change ourestimate of Stage 1 and Stage 2 allowance for credit losses in future periods.
To address the uncertainties inherent in the current and future environment and to reflect all relevant risk factors not captured inour modelled results, we applied expert credit judgment in determining significant increases in credit risk since origination andour weighted allowance for credit losses. In light of the significant uncertainty, the impact of expert credit judgment on ourallowances increased as compared to the previous year. We applied quantitative and qualitative adjustments for the impacts ofthe unprecedented macroeconomic scenarios arising from the COVID-19 pandemic, the temporary effects of the bank andgovernment led payment support programs which may not completely mitigate future losses, and the impacts to particularlyvulnerable sectors affected by the COVID-19 pandemic.
Internal risk ratingsInternal risk ratings are assigned according to the risk management framework outlined under the headings “Wholesale creditrisk” and “Retail credit risk” of the Credit risk section of Management’s Discussion and Analysis. Changes in internal risk ratingsare primarily reflected in the PD parameters, which are estimated based on our historical loss experience at the relevant risksegment or risk rating level, adjusted for forward-looking information.
Forward looking macroeconomic variablesThe PD, LGD and EAD inputs used to estimate stage 1 and stage 2 credit loss allowances are modelled based on themacroeconomic variables (or changes in macroeconomic variables) that are most closely correlated with credit losses in therelevant portfolio. Each macroeconomic scenario used in our expected credit loss calculation includes a projection of allrelevant macroeconomic variables used in our models for a five year horizon, reverting to long-run averages generally within the2 to 5 year period. Depending on their usage in the models, macroeconomic variables are projected at a country, province/stateor more granular level. These include one or more of the variables described below, which differ by portfolio and region.
Our allowance for credit losses reflects our economic outlook as at October 31, 2020. Subsequent changes to this forecast andrelated estimates will be reflected in our allowance for credit losses in future periods.
Our base scenario reflects a continuation of the recovery that has been underway since the sharp drop in economic activityin calendar Q2. The recovery is expected to be gradual with conditions returning to pre-shock levels for Canadian and U.S. GDPand unemployment towards the latter part of our forecast horizon.
Downside scenarios, including two additional and more severe downside scenarios designed for the energy and real estatesectors, reflect the possibility of a double-dip recession, with conditions deteriorating from Q4 2020 levels for up to two years,followed by a recovery for the remainder of the period. These scenarios assume a monetary policy response that returns theeconomy to a long-run, sustainable growth rate within the forecast period.
The upside scenario reflects stronger economic growth than the base scenario for the first two years, without furthermonetary policy responses, followed by a return to a long-run sustainable growth rate within the forecast period.
168 Royal Bank of Canada: Annual Report 2020 Consolidated Financial Statements

The following provides additional detail about our forecasts for certain key macroeconomic variables used in the models toestimate ACL on performing loans, commitments and acceptances:
• Unemployment – Quarterly average Canadian and U.S. unemployment rates both peaked at 13.0% in calendar Q2 2020. Incalendar Q4 2020, unemployment rates are expected to decline to 8.7% in Canada and 7.5% in the U.S. We expectunemployment to remain elevated in 2021, but gradually improve over the forecast horizon.
2
4
6
8
10
12
14
Range of alternative scenarios (October 31, 2020)
Q4-2019
Q1-2020
Q2-2020
Q3-2020
Q4-2020
Q1-2021
Q2-2021
Q3-2021
Q4-2021
Q1-2022
Q2-2022
Q3-2022
Q4-2022
Q1-2023
Q2-2023
Q3-2023
Q4-2023
Q1-2024
Q2-2024
Q3-2024
Q4-2024
Q1-2025
Q2-2025
Q3-2025
Base case (July 31, 2020)
Base case (October 31, 2020)
Base case (October 31, 2019)
%
Canada Unemployment Rate (1)
(1) Represents the average quarterly unemployment level over the calendar quarters presented.
0
2
4
6
8
10
12
14
Range of alternative scenarios (October 31, 2020)
Base case (July 31, 2020)
Base case (October 31, 2020)
Base case (October 31, 2019)
%
U.S. Unemployment Rate (1)
(1) Represents the average quarterly unemployment level over the calendar quarters presented.
Q4-2019
Q1-2020
Q2-2020
Q3-2020
Q4-2020
Q1-2021
Q2-2021
Q3-2021
Q4-2021
Q1-2022
Q2-2022
Q3-2022
Q4-2022
Q1-2023
Q2-2023
Q3-2023
Q4-2023
Q1-2024
Q2-2024
Q3-2024
Q4-2024
Q1-2025
Q2-2025
Q3-2025
• Gross Domestic Product (GDP) – Canadian and U.S. GDP experienced historical troughs in calendar Q2 2020. We expectGDP in calendar Q4 2020 to be 4.7% below Q4 2019 levels in Canada and 2.4% below such levels in the U.S., returning topre-shock forecast levels in calendar 2024 with continuous improvement over the forecast horizon.
1.7
1.8
1.9
2.0
2.1
2.2
2.3
2.4
Range of alternative scenarios (October 31, 2020) Base case (October 31, 2020)
Base case (July 31, 2020) Base case (October 31, 2019)
Trillions of Canadian dollars
Canada Real GDP (1)
(1) Represents the seasonally adjusted annual rate indexed to 2012 Canadian dollar over the calendar quarters presented.
Q4-2019
Q1-2020
Q2-2020
Q3-2020
Q4-2020
Q1-2021
Q2-2021
Q3-2021
Q4-2021
Q1-2022
Q2-2022
Q3-2022
Q4-2022
Q1-2023
Q2-2023
Q3-2023
Q4-2023
Q1-2024
Q2-2024
Q3-2024
Q4-2024
Q1-2025
Q2-2025
Q3-2025
15.0
16.0
17.0
18.0
19.0
20.0
21.0
22.0
Range of alternative scenarios (October 31, 2020) Base case (October 31, 2020)
Base case (July 31, 2020) Base case (October 31, 2019)
Trillions of U.S. dollars
U.S. Real GDP (1)
(1) Represents the seasonally adjusted annual rate indexed to 2012 U.S. dollars over the calendar quarters presented.
Q4-2019
Q1-2020
Q2-2020
Q3-2020
Q4-2020
Q1-2021
Q2-2021
Q3-2021
Q4-2021
Q1-2022
Q2-2022
Q3-2022
Q4-2022
Q1-2023
Q2-2023
Q3-2023
Q4-2023
Q1-2024
Q2-2024
Q3-2024
Q4-2024
Q1-2025
Q2-2025
Q3-2025
• Oil price (West Texas Intermediate in US$) – In our base forecast, we expect oil prices to recover from trough prices in April2020 to an average price of $43 per barrel over the next 12 months and $48 per barrel in the following 2 to 5 years. Therange of average prices in our alternative downside and upside scenarios is $23 to $49 per barrel for the next 12 monthsand $35 to $50 per barrel for the following 2 to 5 years. As at October 31, 2019, our base forecast included an average priceof $59 per barrel for the next 12 months and $68 per barrel for the following 2 to 5 years.
• Canadian housing price index – In our base forecast, we expect housing prices to grow by 0.6% over the next 12 months,with a compound annual growth rate of 4.5% for the following 2 to 5 years. The range of annual housing price growth(contraction) in our alternative downside and upside scenarios is (29.6)% to 6.1% over the next 12 months and 2.9% to 11.1%for the following 2 to 5 years. As at October 31, 2019, our base forecast included housing price growth of 4.5% for the next 12months and 4.7% for the following 2 to 5 years.
The primary variables driving credit losses in our retail portfolios are Canadian unemployment rates, Canadian GDP andCanadian housing price index. The Canadian overnight interest rate also impacts our retail portfolios. Our wholesale portfoliosare affected by all of the variables discussed above; however, the specific variables differ by sector. Other variables also impactour wholesale portfolios including, but not limited to, the Canadian and U.S. 10 year BBB corporate and 10 year government bondyields, the TSX and S&P 500 indices, natural gas prices (Henry Hub) and the commercial real estate price index.
Increases in the following macroeconomic variables will generally correlate with higher expected credit losses: Canadianand U.S. unemployment rates, Canadian overnight interest rates, Canadian and U.S. 10 year BBB corporate bond and governmentbond yields.
Increases in the following macroeconomic variables will generally correlate with lower expected credit losses: Canadianhousing price index, Canadian and U.S. GDP, TSX index, S&P 500 index, oil prices, natural gas prices, and commercial real estateprice index.
Consolidated Financial Statements Royal Bank of Canada: Annual Report 2020 169

Note 5 Loans and allowance for credit losses (continued)
Scenario design and weightingsOur estimation of expected credit losses in Stage 1 and Stage 2 considers five distinct future macroeconomic scenarios.Scenarios are designed to capture a wide range of possible outcomes and are weighted according to our expectation of therelative likelihood of the range of outcomes that each scenario represents at the reporting date. We then weight each scenario totake into account historical frequency, current trends, and forward-looking conditions which will change over time. The base casescenario is based on forecasts of the expected rate, value or yield for each of the macroeconomic variables identified above. Theupside and downside scenarios are set by adjusting our base projections to construct reasonably possible scenarios andweightings that are more optimistic and pessimistic, respectively, than the base case. As described above, two additionaldownside scenarios capture the non-linear nature of potential credit losses across our portfolios.
The impact of each of our five scenarios varies across our portfolios given the portfolios have different sensitivities tomovements in each macroeconomic variable. As described above, all scenarios are designed to include the impact of the COVID-19 pandemic as at October 31, 2020, reflective of current market conditions. In determining our IFRS 9 allowance for credit losses,we reassessed our scenario weights to more heavily weight the base case scenario relative to October 31, 2019. Since the onset ofthe global spread of the COVID-19 pandemic in the spring of 2020, we have reflected continued uncertainty and downside risk of aprolonged recovery by shifting additional weighting to our pessimistic scenarios. The possibility of a more prolonged recoveryperiod, including the re-imposition of containment measures to varying degrees in some regions taken by the government havebeen reflected in our scenario design and weights.
The impact of weighting these multiple scenarios increased our ACL on performing loans, relative to our base scenario, by$606 million at October 31, 2020 (October 31, 2019 – $376 million).
Transfers between stagesTransfers between stage 1 and stage 2 are based on the assessment of significant increases in credit risk relative to initialrecognition, as described in Note 2. The impact of moving from 12 months expected credit losses to lifetime expected creditlosses, or vice versa, varies by product, is dependent on the expected remaining life at the date of the transfer and reflects thesharp drop in economic activity followed by a gradual recovery. Stage transfers may result in significant fluctuations in expectedcredit losses.
The following table illustrates the impact of staging on our ACL by comparing our allowance if all performing loans were instage 1 to the actual ACL recorded on these assets.
As at
October 31, 2020 October 31, 2019
ACL – All performingloans in Stage 1
Impact ofstaging
Stage 1 and 2ACL
ACL – All performingloans in Stage 1
Impact ofstaging
Stage 1 and 2ACL
Performing loans (1) $ 4,028 $ 1,031 $ 5,059 $ 1,737 $ 826 $ 2,563
(1) Represents loans and commitments in stage 1 and stage 2.
170 Royal Bank of Canada: Annual Report 2020 Consolidated Financial Statements

Credit risk exposure by internal risk ratingThe following table presents the gross carrying amount of loans measured at amortized cost, and the full contractual amount ofundrawn loan commitments subject to the impairment requirements of IFRS 9. Risk ratings are based on internal ratings used inthe measurement of expected credit losses as at the reporting date, as outlined in the internal ratings maps for Wholesale andRetail facilities in the Credit risk section of Management’s Discussion and Analysis.
As at
October 31, 2020 October 31, 2019
(Millions of Canadian dollars) Stage 1 Stage 2 Stage 3 (1) Total Stage 1 Stage 2 Stage 3 (1) Total
RetailLoans outstanding – Residential
mortgagesLow risk $ 270,396 $ 2,848 $ – $ 273,244 $ 238,377 $ 6,764 $ – $ 245,141Medium risk 15,230 3,307 – 18,537 14,033 1,347 – 15,380High risk 4,346 1,467 – 5,813 2,843 2,722 – 5,565Not rated (2) 43,176 936 – 44,112 40,030 726 – 40,756Impaired – – 638 638 – – 732 732
333,148 8,558 638 342,344 295,283 11,559 732 307,574
Items not subject to impairment (3) 253 517
Total 342,597 308,091
Loans outstanding – PersonalLow risk $ 71,245 $ 1,084 $ – $ 72,329 $ 71,619 $ 1,944 $ – $ 73,563Medium risk 3,974 5,415 – 9,389 5,254 3,011 – 8,265High risk 817 1,416 – 2,233 843 1,874 – 2,717Not rated (2) 7,704 144 – 7,848 7,293 105 – 7,398Impaired – – 212 212 – – 307 307
Total 83,740 8,059 212 92,011 85,009 6,934 307 92,250
Loans outstanding – Credit cardsLow risk $ 11,824 $ 63 $ – $ 11,887 $ 13,840 $ 103 $ – $ 13,943Medium risk 1,596 2,360 – 3,956 2,250 1,827 – 4,077High risk 132 1,105 – 1,237 137 1,432 – 1,569Not rated (2) 490 56 – 546 677 45 – 722
Total 14,042 3,584 – 17,626 16,904 3,407 – 20,311
Loans outstanding – Small businessLow risk $ 2,034 $ 172 $ – $ 2,206 $ 2,200 $ 107 $ – $ 2,307Medium risk 1,976 1,143 – 3,119 2,163 563 – 2,726High risk 126 192 – 318 138 196 – 334Not rated (2) 9 – – 9 10 – – 10Impaired – – 90 90 – – 57 57
Total 4,145 1,507 90 5,742 4,511 866 57 5,434
Undrawn loan commitments – RetailLow risk $ 214,176 $ 887 $ – $ 215,063 $ 196,743 $ 1,894 $ – $ 198,637Medium risk 10,402 291 – 10,693 8,251 246 – 8,497High risk 1,141 129 – 1,270 851 208 – 1,059Not rated (2) 5,238 117 – 5,355 5,861 146 – 6,007
Total 230,957 1,424 – 232,381 211,706 2,494 – 214,200
Wholesale – Loans outstandingInvestment grade $ 50,998 $ 328 $ – $ 51,326 $ 47,133 $ 97 $ – $ 47,230Non-investment grade 112,434 26,575 – 139,009 119,778 11,940 – 131,718Not rated (2) 7,093 432 – 7,525 5,862 320 – 6,182Impaired – – 2,235 2,235 – – 1,829 1,829
170,525 27,335 2,235 200,095 172,773 12,357 1,829 186,959
Items not subject to impairment (3) 8,560 8,911
Total 208,655 195,870
Undrawn loan commitments –Wholesale
Investment grade $ 242,244 $ 1,022 $ – $ 243,266 $ 222,819 $ 18 $ – $ 222,837Non-investment grade 92,262 21,581 – 113,843 96,191 9,007 – 105,198Not rated (2) 3,918 – – 3,918 3,986 – – 3,986
Total 338,424 22,603 – 361,027 322,996 9,025 – 332,021
(1) As at October 31, 2020, 90% of credit-impaired loans were either fully or partially collateralized (October 31, 2019 – 86%). For details on the types of collateral held againstcredit-impaired assets and our policies on collateral, refer to the Credit risk mitigation section of Management’s Discussion and Analysis.
(2) In certain cases where an internal risk rating is not assigned, we use other approved credit risk assessments or rating methodologies, policies and tools to manage ourcredit risk.
(3) Items not subject to impairment are loans held at FVTPL.
Consolidated Financial Statements Royal Bank of Canada: Annual Report 2020 171

Note 5 Loans and allowance for credit losses (continued)
Loans past due but not impaired (1)
As at
October 31, 2020 October 31, 2019
(Millions of Canadian dollars) 1 to 29 days 30 to 89 days90 days
and greater Total 1 to 29 days 30 to 89 days90 days
and greater Total
Retail $ 3,346 $ 1,013 $ 129 $ 4,488 $ 3,173 $ 1,369 $ 186 $ 4,728Wholesale 2,129 574 13 2,716 1,543 460 3 2,006
$ 5,475 $ 1,587 $ 142 $ 7,204 $ 4,716 $ 1,829 $ 189 $ 6,734
(1) Loans in our payment deferral programs established to help clients manage through the challenges of the COVID-19 pandemic have been re-aged to current and are notaged further during the deferral period. Subsequent to the payment deferral period, loans will commence re-aging from current. Amounts presented may include loanspast due as a result of administrative processes, such as mortgage loans on which payments are restrained pending payout due to sale or refinancing. Past due loansarising from administrative processes are not representative of the borrowers’ ability to meet their payment obligations.
Loan modificationsWe have established relief programs to help clients manage through challenges of the COVID-19 pandemic through paymentdeferrals, interest rate reductions, covenant waivers, and refinancing or credit restructuring. In some cases, the original terms ofthe associated loans were renegotiated or otherwise modified, resulting in changes to the contractual terms of the loans thataffect the contractual cash flows. For the year ended October 31, 2020, the amortized cost of the loans whose contractual termswere modified while in Stage 2 or Stage 3 at the quarter ended before the modification was $8,437 million, resulting in no materialmodification losses. The gross carrying amount of loans transferred to Stage 1 whose contractual terms were previously modifiedwhile in Stage 2 or Stage 3 was not material for the year ended October 31, 2020.
Note 6 Derecognition of financial assets
We enter into transactions in which we transfer financial assets such as loans or securities to structured entities or other thirdparties. The majority of assets transferred under repurchase agreements, securities lending agreements, and in our Canadianresidential mortgage securitization transactions do not qualify for derecognition as we continue to be exposed to substantiallyall of the risks and rewards of the transferred assets, such as prepayment, credit, price, interest rate and foreign exchange risks.
Transferred financial assets derecognizedGovernment relief programsTo support our clients through unprecedented times due to the COVID-19 pandemic, we are participating in government reliefprograms in Canada and in the U.S.
Under the Canadian Emergency Business Account program, we have provided interest-free loans to existing eligible smallbusiness clients funded by the Export Development Bank of Canada (EDC). As we do not retain substantially all of the risks andrewards of the financial assets, and all cash flows are passed through to the EDC, these loans are not recognized on ourConsolidated Balance Sheets.
Transferred financial assets not derecognizedSecuritization of Canadian residential mortgage loansWe periodically securitize insured Canadian residential mortgage loans through the creation of MBS pools under the NationalHousing Act MBS (NHA MBS) program. All loans securitized under the NHA MBS program are required to be insured by theCanadian Mortgage and Housing Corporation (CMHC) or a third-party insurer. We require the borrower to pay for mortgageinsurance when the loan amount is greater than 80% of the original appraised value of the property (loan-to-value (LTV) ratio).For residential mortgage loans securitized under this program with LTV ratios less than 80%, we are required to insure themortgages at our own expense. Under the NHA MBS program, we are responsible for making all payments due on our issued MBS,regardless of whether we collect the necessary funds from the mortgagor or the insurer. When a borrower defaults on amortgage, we submit a claim to the insurer if the amount recovered from the collection or foreclosure process is lower than thesum of the principal balance, accrued interest and collection costs on the outstanding loan. The insurance claim process ismanaged by the insurance provider in accordance with the insurer’s policies and covers the entire unpaid loan balance plusgenerally up to 12 months of interest, selling costs and other eligible expenses. If an insurance claim is denied, a loss isrecognized in Provision for credit losses in our Consolidated Statements of Income. The amount recorded as a loss is notsignificant to our Consolidated Financial Statements and no significant losses were incurred due to legal action arising frommortgage defaults during 2020 and 2019.
We sell the NHA MBS pools primarily to a government-sponsored structured entity under the Canada Mortgage Bond (CMB)program. The entity periodically issues CMBs, which are guaranteed by the government, and sells them to third-party investors.Proceeds of the CMB issuances are used by the entity to purchase the NHA MBS pools from eligible NHA MBS issuers whoparticipate in the issuance of a particular CMB series. Our continuing involvement includes servicing the underlying residentialmortgage loans we have securitized, either ourselves or through a third-party servicer. We also act as counterparty in interestrate swap agreements where we pay the entity the interest due to CMB investors and receive the interest on the underlying MBSand reinvested assets. As part of the swaps, we are also required to maintain a principal reinvestment account for principalpayments received on the underlying mortgage loans to meet the repayment obligation upon maturity of the CMB. We reinvestthe collected principal payments in permitted investments as outlined in the swap agreements.
We have determined that certain of the NHA MBS program loans transferred to the entity do not qualify for derecognition aswe have not transferred substantially all of the risks and rewards of ownership. As a result, these transferred MBS continue to beclassified as residential mortgage loans and recognized on our Consolidated Balance Sheets. The cash received for thesetransferred MBS is treated as a secured borrowing and a corresponding liability is recorded in Deposits – Business andgovernment on our Consolidated Balance Sheets.
172 Royal Bank of Canada: Annual Report 2020 Consolidated Financial Statements

Securities sold under repurchase agreements and securities loanedWe also enter into transactions such as repurchase agreements and securities lending agreements where we transfer assetsunder agreements to repurchase them at a future date and retain substantially all of the risks and rewards associated with theassets. These transferred assets remain on our Consolidated Balance Sheets and are accounted for as collateralized borrowingtransactions.
The following table provides information on the carrying amount and fair value of the transferred assets that did not qualify forderecognition, and their associated liabilities.
As at
October 31, 2020 October 31, 2019
(Millions of Canadian dollars)
Canadianresidential
mortgageloans (1), (2)
Securitiessold under
repurchaseagreements (3)
Securitiesloaned (3) Total
Canadianresidential
mortgageloans (1), (2)
Securitiessold under
repurchaseagreements (3)
Securitiesloaned (3) Total
Carrying amount of transferredassets that do not qualify forderecognition $ 35,001 $ 267,361 $ 6,870 $309,232 $ 32,794 $ 220,250 $ 6,336 $ 259,380
Carrying amount of associatedliabilities 34,805 267,361 6,870 309,036 32,615 220,250 6,336 259,201
Fair value of transferred assets $ 35,293 $ 267,361 $ 6,870 $309,524 $ 32,757 $ 220,250 $ 6,336 $ 259,343Fair value of associated liabilities 35,957 267,361 6,870 310,188 33,143 220,250 6,336 259,729
Fair value of net position $ (664) $ – $ – $ (664) $ (386) $ – $ – $ (386)
(1) Includes Canadian residential mortgage loans transferred primarily to Canada Housing Trust at the initial securitization and other permitted investments used forfunding requirements after the initial securitization.
(2) CMB investors have legal recourse only to the transferred assets, and do not have recourse to our general assets.(3) Does not include over-collateralization of assets pledged.
Note 7 Structured entities
In the normal course of business, we engage in a variety of financial transactions with structured entities to support ourfinancing and investing needs as well as those of our customers. A structured entity is an entity in which voting or similar rightsare not the dominant factor in deciding control. Structured entities are generally created to achieve a narrow and well definedobjective with restrictions around their ongoing activities. We consolidate a structured entity when we control the entity inaccordance with our accounting policy as described in Note 2. In other cases, we may sponsor or have an interest in such anentity but may not consolidate it.
Consolidated structured entitiesWe consolidate the following structured entities, whose assets and liabilities are recorded on our Consolidated Balance Sheets.Third-party investors in these structured entities generally have recourse only to the assets of the related entity and do not haverecourse to our general assets unless we breach our contractual obligations to those entities. In the ordinary course of business,the assets of each consolidated structured entity can generally only be used to settle the obligations of that entity.
RBC-administered multi-seller conduitsWe generally do not maintain ownership in the multi-seller conduits that we administer and generally do not have rights to, orcontrol of, their assets. However, we issue asset-backed commercial paper (ABCP) through a multi-seller conduit that does nothave a first loss investor with substantive power to direct the significant operating activities of the conduit. This conduit isconsolidated because we have exposure to variability of returns from performance in the multi-seller arrangements throughproviding transaction-specific and program-wide liquidity, credit and loan facilities to the conduit and have decision-makingpower over the relevant activities. As of October 31, 2020, $1.0 billion of financial assets held by the conduit was included in Loans(October 31, 2019 – $1.2 billion) and $0.6 billion of ABCP issued by the conduit was included in Deposits (October 31, 2019 – $0.7billion) on our Consolidated Balance Sheets.
Credit card securitization vehicleWe securitize a portion of our credit card receivables through a structured entity on a revolving basis. The entity purchases co-ownership interests in a pool of credit card receivables and issues senior and subordinated term notes collateralized by that co-ownership interest in the underlying pool of credit card receivables. Investors who purchase the term notes have recourse onlyto that co-ownership interest in the underlying pool of credit card receivables.
We continue to service the credit card receivables and perform an administrative role for the entity. We also retain risk inthe underlying pool of credit card receivables through our retained interest in the transferred assets, the cash reserve balancewe fund from time to time, and also through certain subordinated notes which we retain. Additionally, we may own some seniornotes as investments or for market-making activities, we provide subordinated loans to the entity to pay upfront expenses, andwe act as counterparty to interest rate and cross currency swap agreements which hedge the entity’s interest rate and currencyrisk exposure.
We consolidate the structured entity because we have decision-making power over the timing and size of future issuancesand other relevant activities which were predetermined by us at inception. We also obtain significant funding benefits and areexposed to variability from the performance of the underlying credit card receivables through our retained interest. As atOctober 31, 2020, $5.8 billion of notes issued by our credit card securitization vehicle were included in Deposits on ourConsolidated Balance Sheets (October 31, 2019 – $7.1 billion).
Consolidated Financial Statements Royal Bank of Canada: Annual Report 2020 173

Note 7 Structured entities (continued)
Collateralized commercial paper vehicleWe established a funding vehicle that provides loans to us and finances those loans by issuing commercial paper to third-partyinvestors. The structured entity’s commercial paper carries an equivalent credit rating to RBC because we are obligated toadvance funds to the entity in the event there are insufficient funds from other sources to settle maturing commercial paper. Wepledge collateral to secure the loans and are exposed to the market and credit risks of the pledged securities.
We consolidate the structured entity because we have decision-making power over the relevant activities, are the soleborrower from the structure, and are exposed to a majority of the residual ownership risks through the credit support provided.As at October 31, 2020, $12.2 billion of commercial paper issued by the vehicle was included in Deposits on our ConsolidatedBalance Sheets (October 31, 2019 – $16.2 billion).
Covered bondsWe periodically transfer mortgages to RBC Covered Bond Guarantor Limited Partnership (the Guarantor LP) to support fundingactivities and asset coverage requirements under our covered bonds program. The Guarantor LP was created to guarantee interestand principal payments under the covered bond program. The covered bonds guaranteed by the Guarantor LP are direct, unsecuredand unconditional obligations of RBC; therefore, investors have a claim against the Bank which will continue if the covered bondsare not paid by the Bank and the mortgage assets in the Guarantor LP are insufficient to satisfy the obligations owing on the coveredbonds. We act as general partner, limited partner, swap counterparty, lender and liquidity provider to the Guarantor LP, servicer forthe underlying mortgages as well as the registered issuer of the covered bonds. During the second quarter, OSFI temporarilyincreased the limits on covered bond programs and the Bank of Canada temporarily expanded the eligible collateral for its termrepo facility to include banks’ own covered bonds to provide further liquidity due to the COVID-19 pandemic.
We consolidate the Guarantor LP as we have the decision-making power over the relevant activities through our role asgeneral partner and are exposed to variability from the performance of the underlying mortgages. As at October 31, 2020, thetotal amount of mortgages transferred and outstanding was $105.8 billion (October 31, 2019 – $53.9 billion) providing furtherliquidity capacity for the covered bond program and $40 billion of covered bonds were recorded as Deposits on our ConsolidatedBalance Sheets (October 31, 2019 – $39.8 billion).
Municipal bond TOB structuresWe sell taxable and tax-exempt municipal bonds into Tender Option Bond (TOB) structures, which consist of a bond that is creditenhanced by us and purchased by a TOB trust. The TOB trust finances the purchase from us by issuing floating-rate certificates toshort-term investors and a residual certificate that is purchased by us. We are the remarketing agent for the floating-ratecertificates and provide a liquidity facility to the short-term investors which requires us to purchase any certificates tendered butnot successfully remarketed. We credit enhance the bond purchased by the TOB trust with a letter of credit under which we arerequired to extend funding if there are any losses on the underlying bonds. We earn interest on the residual certificate andreceive market-based fees for acting as remarketing agent and providing the liquidity facility and letter of credit.
We consolidate the TOB trust when we are the holder of the residual certificate as we have decision-making power over therelevant activities, including the selection of the underlying municipal bonds and the ability to terminate the structure, and areexposed to variability from the performance of the underlying municipal bonds. As at October 31, 2020, $7.8 billion of municipal bondswere included in Investment securities related to consolidated TOB structures (October 31, 2019 – $8.3 billion) and a corresponding$8.2 billion of floating-rate certificates were included in Deposits on our Consolidated Balance Sheets (October 31, 2019 – $8.7 billion).
RBC managed investment fundsWe are sponsors and investment managers of mutual and pooled funds, which give us the ability to direct the investment decisionsof the funds. We consolidate those mutual and pooled funds in which our interests, which include direct investment in seed capitalplus management or performance fees, indicate that we are acting as a principal. As at October 31, 2020, $516 million of Tradingsecurities held in the consolidated funds (October 31, 2019 – $465 million) and $293 million of Other liabilities representing the fundunits held by third parties (October 31, 2019 – $95 million) were recorded on our Consolidated Balance Sheets.
Unconsolidated structured entitiesWe have interests in certain structured entities that we do not consolidate but have recorded assets and liabilities on ourConsolidated Balance Sheets related to our transactions and involvement with these entities.
The following table presents the assets and liabilities recorded on our Consolidated Balance Sheets and our maximumexposure to loss related to our interests in unconsolidated structured entities. It also presents the size of each class ofunconsolidated structured entity, as measured by the total assets of the entities in which we have an interest.
As at October 31, 2020
(Millions of Canadian dollars)Multi-sellerconduits (1)
Structuredfinance
Non-RBCmanaged
investmentfunds
Third-partysecuritization
vehicles Other Total
On-balance sheet assetsSecurities $ 138 $ – $ 2,297 $ – $ 422 $ 2,857Loans – 2,670 – 5,628 931 9,229Derivatives 60 – – – 84 144Other assets – 46 – – 261 307
$ 198 $ 2,716 $ 2,297 $ 5,628 $ 1,698 $ 12,537
On-balance sheet liabilitiesDerivatives $ 38 $ – $ – $ – $ – $ 38Other liabilities – – – – – –
$ 38 $ – $ – $ – $ – $ 38
Maximum exposure to loss (2) $ 42,863 $ 6,522 $ 2,557 $ 10,389 $ 2,108 $ 64,439
Total assets of unconsolidated structured entities $ 41,964 $18,200 $462,947 $ 87,631 $286,200 $ 896,942
174 Royal Bank of Canada: Annual Report 2020 Consolidated Financial Statements

As at October 31, 2019
(Millions of Canadian dollars)Multi-sellerconduits (1)
Structuredfinance
Non-RBCmanaged
investmentfunds
Third-partysecuritization
vehicles Other Total
On-balance sheet assetsSecurities $ 75 $ – $ 1,865 $ – $ 503 $ 2,443Loans – 2,718 – 6,392 1,517 10,627Derivatives 97 – – – 83 180Other assets – 60 – – 244 304
$ 172 $ 2,778 $ 1,865 $ 6,392 $ 2,347 $ 13,554
On-balance sheet liabilitiesDerivatives $ 20 $ – $ – $ – $ – $ 20Other liabilities 30 – – – – 30
$ 50 $ – $ – $ – $ – $ 50
Maximum exposure to loss (2) $ 38,032 $ 6,446 $ 2,123 $ 10,756 $ 2,667 $ 60,024
Total assets of unconsolidated structured entities $ 37,192 $ 17,571 $ 412,046 $ 84,282 $ 293,423 $ 844,514
(1) Total assets of unconsolidated structured entities represent the maximum assets that may have to be purchased by the conduits under purchase commitmentsoutstanding. Of the purchase commitments outstanding, the conduits have purchased financial assets totalling $23.4 billion as at October 31, 2020 (October 31, 2019 –$23.6 billion).
(2) The maximum exposure to loss resulting from our interests in these entities consists mostly of investments, loans, fair value of derivatives, liquidity and creditenhancement facilities. The maximum exposure to loss of the multi-seller conduits is higher than the on-balance sheet assets primarily because of the notional amountsof the backstop liquidity and credit enhancement facilities. Refer to Note 24.
Below is a description of our involvement with each significant class of unconsolidated structured entity.
Multi-seller conduitsWe administer multi-seller ABCP conduit programs. Multi-seller conduits primarily purchase financial assets from clients andfinance those purchases by issuing ABCP.
In certain multi-seller conduit arrangements, we do not maintain any ownership of the multi-seller conduits that weadminister and have no rights to, or control of, its assets. As the administrative agent, we earn a residual fee for providingservices such as coordinating funding activities, transaction structuring, documentation, execution and monitoring. The ABCPissued by each multi-seller conduit is in the conduit’s own name with recourse to the financial assets owned by the multi-sellerconduit, and is non-recourse to us except through our participation in liquidity and/or credit enhancement facilities.
We provide transaction-specific and program-wide liquidity facilities to the multi-seller conduits. In addition, we provideprogram-wide credit enhancement to the multi-seller conduits which obligate us to purchase assets or advance funds in theevent the multi-seller conduit does not otherwise have funds from other sources, such as from the liquidity facilities, to settlematuring ABCP. In some cases, we or another third party may provide transaction-specific credit enhancement which can takevarious forms. We receive market-based fees for providing these liquidity and credit facilities.
For certain transactions, we act as counterparty to various hedging contracts to facilitate our clients’ securitization of fixedrate and/or foreign currency denominated assets through the conduits. These may take the form of forward contracts, interestrate swaps or cross currency swaps. These derivatives expose us to foreign exchange and interest rate risks that are centrallymanaged by our foreign exchange trading and swap desks, respectively, and credit risk on the underlying assets that is mitigatedby the credit enhancement described below.
Each transaction is structured with transaction-specific first loss protection provided by the third-party seller. This enhancementcan take various forms, including but not limited to overcollateralization, excess spread, subordinated classes of financial assets,guarantees or letters of credit. The amount of this enhancement varies but is generally designed to cover a multiple of historicallosses.
An unrelated third party (expected loss investor) absorbs losses, up to a maximum contractual amount, that may occur inthe future on the assets in the multi-seller conduits before the multi-seller conduits’ debt holders and us. In return for assumingthis multi-seller conduit first-loss position, each multi-seller conduit pays the expected loss investor a return commensurate withits risk position. The expected loss investor has substantive power to direct the majority of the activities which significantlyimpact the conduit’s economic performance, including initial selection and approval of the asset purchase commitments andliquidity facilities, approval of renewal and amendment of these transactions and facilities, sale or transfer of assets, ongoingmonitoring of asset performance, mitigation of losses, and management of the ABCP liabilities.
We do not consolidate these multi-seller conduits as we do not control the conduit as noted above.
Structured financeWe purchased U.S. ARS from certain trusts (U.S. ARS Trusts) which fund their long-term investments in student loans by issuing short-term senior and subordinated notes. We do not consolidate these U.S. ARS Trusts as we do not have decision-making power over theinvesting and financing activities of the Trusts, which are the activities that most significantly affect the performance of the Trusts.
Additionally, we participate in certain municipal bond TOB structures that we do not consolidate. These structures are similar tothose consolidated municipal bond TOB structures described above; however, the residual certificates are held by third parties. Weprovide liquidity facilities for the benefit of floating-rate certificate holders which may be drawn if certificates are tendered but notable to be remarketed. For a portion of these trusts, we also provide a letter of credit for the underlying bonds held in the trust. We donot have decision-making power over the relevant activities of the structures; therefore, we do not consolidate these structures.
We provide senior warehouse financing to structured entities that are established by third parties to acquire loans for thepurposes of issuing a term collateralized loan obligation (CLO) transaction. Subordinated financing is provided during thewarehouse phase by one or more third-party equity investors. We act as the arranger and placement agent for the term CLOtransaction. Proceeds from the sale of the term CLO are used to repay our senior warehouse financing, at which point we have nofurther involvement with the transaction. We do not consolidate these CLO structures as we do not have decision-making powerover the relevant activities of the entity, which include the initial selection and subsequent management of the underlying debtportfolio.
Consolidated Financial Statements Royal Bank of Canada: Annual Report 2020 175

Note 7 Structured entities (continued)
We provide senior financing to unaffiliated structured entities that are established by third parties to acquire loans. Thesefacilities tend to be longer in term than the CLO warehouse facilities and benefit from credit enhancement generally designed tocover a multiple of historical losses. We do not consolidate these structures as we do not have decision making power over therelevant activities of the entity, which include the initial selection and subsequent management of the underlying debt portfolio.
Non-RBC managed investment fundsWe enter into fee-based equity derivative transactions with third parties including mutual funds, unit investment trusts and otherinvestment funds. These transactions provide their investors with the desired exposure to a reference fund, and we economicallyhedge our exposure to these derivatives by investing in those reference funds. We also act as custodian or administrator forseveral funds. We do not consolidate those reference funds that are managed by third parties as we do not have power to directtheir investing activities.
We provide liquidity facilities to certain third-party investment funds. The funds issue unsecured variable-rate preferredshares and invest in portfolios of tax-exempt municipal bonds. Undrawn liquidity commitments expose us to the liquidity risk ofthe preferred shares and drawn commitments expose us to the credit risk of the underlying municipal bonds. We do notconsolidate these third-party managed funds as we do not have power to direct their investing activities.
Third-party securitization vehiclesWe hold interests in securitization vehicles that provide funding to certain third parties on whose behalf the entities were created. Theactivities of these entities are limited to the purchase and sale of specified financial assets from the sponsor. We, as well as otherfinancial institutions, are obligated to provide funding up to our maximum commitment level and are exposed to credit losses on theunderlying assets after various credit enhancements. Enhancements can take various forms, including but not limited toovercollateralization, excess spread, subordinated classes of financial assets, guarantees or letters of credit. The amount of thisenhancement varies but is generally designed to cover a multiple of historical losses. We do not consolidate these entities as we donot have decision-making power over the relevant activities, including the entities’ investing and financing activities.
OtherOther unconsolidated structured entities include managed investment funds, credit investment products and tax credit funds.
We are sponsors and investment managers of mutual and pooled funds, which gives us the ability to direct the investmentdecisions of the funds. We do not consolidate those mutual and pooled funds if we exercise our decision-making power as anagent on behalf of other unit holders.
We use structured entities to generally transform credit derivatives into cash instruments, to distribute credit risk and tocreate customized credit products to meet investors’ specific requirements. We enter into derivative contracts, including creditderivatives, to purchase protection from these entities (credit protection) and convert various risk factors such as yield, currencyor credit risk of underlying assets to meet the needs of the investors. We act as sole arranger and swap provider for certainentities and, in some cases, fulfill other administrative functions for the entities. We do not consolidate these credit investmentproduct entities as we do not have decision-making power over the relevant activities, which include selection of the collateraland reference portfolio, and are not exposed to a majority of the benefits or risks of the entities.
We created certain funds to pass through tax credits received from underlying low-income housing, historic rehabilitationreal estate projects to third parties, new market tax credits or renewable energy tax credits to third parties (tax credit funds). Weare sponsors of the tax credit funds as a result of our responsibility to manage the funds, arrange the financing, and perform theadministrative duties of these tax credit funds. We do not consolidate the tax credit funds as the third-party investors in thesefunds have the decision-making power to select the underlying investments and are exposed to the majority of the residualownership and tax risks of the funds.
We also purchase passive interests in renewable energy tax credit entities created and controlled by third parties. We do notconsolidate these third-party funds as we do not have decision-making power over the relevant activities and our investmentsare managed as part of larger portfolios which are held for trading purposes.
Other interests in unconsolidated structured entitiesIn the normal course of business, we buy and sell passive interests in certain third-party structured entities, including mutualfunds, exchange traded funds, and government-sponsored ABS vehicles. Our investments in these entities are managed as part oflarger portfolios which are held for trading, liquidity or hedging purposes. We did not create or sponsor these entities and do nothave any decision-making power over their ongoing activities. Our maximum exposure to loss is limited to our on-balance sheetinvestments in these entities, which are not included in the table above. As at October 31, 2020 and 2019, our investments in theseentities were included in Trading and Investment securities on our Consolidated Balance Sheets. Refer to Note 3 and Note 4 forfurther details on our Trading and Investment securities.
Sponsored entitiesWe are a sponsor of certain structured entities in which we have interests but do not consolidate. In determining whether we area sponsor of a structured entity, we consider both qualitative and quantitative factors, including the purpose and nature of theentity, our initial and continuing involvement and whether we hold subordinated interests in the entity. We are considered to bethe sponsor of certain credit investment products, tax credit entities, RBC managed mutual funds and a commercial mortgagesecuritization vehicle. During the year ended October 31, 2020, we transferred commercial mortgages with a carrying amount of$469 million (October 31, 2019 – $696 million) to a sponsored securitization vehicle in which we did not have any interests as atthe end of the reporting period.
Financial support provided to structured entitiesDuring the years ended October 31, 2020 and 2019, we have not provided any financial or non-financial support to anyconsolidated or unconsolidated structured entities when we were not contractually obligated to do so. Furthermore, we have nointention to provide such support in the future.
176 Royal Bank of Canada: Annual Report 2020 Consolidated Financial Statements

Note 8 Derivative financial instruments and hedging activities
Derivative instruments are categorized as either financial or non-financial derivatives. Financial derivatives are financial contractswhose value is derived from an underlying interest rate, foreign exchange rate, credit risk, and equity or equity index. Non-financialderivatives are contracts whose value is derived from a precious metal, commodity instrument or index. The notional amount ofderivatives represents the contract amount used as a reference point to calculate payments. Notional amounts are generally notexchanged by counterparties, and do not reflect our EAD.
Financial derivativesForwards and futuresForward contracts are non-standardized agreements that are transacted between counterparties in the OTC market, whereasfutures are standardized contracts with respect to amounts and settlement dates, and are traded on regular futures exchanges.Examples of forwards and futures are described below.
Interest rate forwards (forward rate agreements) and futures are contractual obligations to buy or sell an interest-ratesensitive financial instrument on a predetermined future date at a specified price.
Foreign exchange forwards and futures are contractual obligations to exchange one currency for another at a specified pricefor settlement at a predetermined future date.
Equity forwards and futures are contractual obligations to buy or sell at a fixed value (the specified price) of an equity index,a basket of stocks or a single stock at a predetermined future date.
SwapsSwaps are OTC contracts in which two counterparties exchange a series of cash flows based on agreed upon rates applied to anotional amount. Examples of swap agreements are described below.
Interest rate swaps are agreements where two counterparties exchange a series of payments based on different interestrates applied to a notional amount in a single currency. Certain interest rate swaps are transacted and settled through clearinghouses which act as central counterparties. Cross currency swaps involve the exchange of fixed payments in one currency for thereceipt of fixed payments in another currency. Cross currency interest rate swaps involve the exchange of both interest andnotional amounts in two different currencies.
Equity swaps are contracts in which one counterparty agrees to pay or receive from the other cash flows based on changesin the value of an equity index, a basket of stocks or a single stock.
OptionsOptions are contractual agreements under which the seller (writer) grants the purchaser the right, but not the obligation, either to buy(call option) or sell (put option) a security, exchange rate, interest rate, or other financial instrument or commodity at a specifiedprice, at or by a predetermined future date. The seller (writer) of an option can also settle the contract by paying the cash settlementvalue of the purchaser’s right. The seller (writer) receives a premium from the purchaser for this right. The various option agreementsthat we enter into include but are not limited to interest rate options, foreign currency options, equity options and index options.
Credit derivativesCredit derivatives are OTC contracts that transfer credit risk related to an underlying financial instrument (referenced asset)from one counterparty to another. Credit derivatives include credit default swaps, credit default baskets and total return swaps.
Credit default swaps provide protection against the decline in the value of the referenced asset as a result of specified creditevents such as default or bankruptcy. They are similar in structure to an option, whereby the purchaser pays a premium to theseller of the credit default swap in return for payment contingent on a credit event affecting the referenced asset.
Credit default baskets are similar to credit default swaps except that the underlying referenced financial instrument is agroup of assets instead of a single asset.
Total return swaps are contracts where one counterparty agrees to pay or receive from the other cash amounts based onchanges in the value of a referenced asset or group of assets, including any returns such as interest earned on these assets, inexchange for amounts that are based on prevailing market funding rates.
Other derivative productsOther contracts are stable value and equity derivative contracts.
Non-financial derivativesOther contracts also include non-financial derivative products such as precious metal and commodity derivative contracts inboth the OTC and exchange markets.
Derivatives issued for trading purposesMost of our derivative transactions relate to client-driven sales and trading activities, and associated market risk hedging. Salesactivities include the structuring and marketing of derivative products to clients, enabling them to modify or reduce risks. Tradinginvolves market-making, positioning and arbitrage activities. Market-making involves quoting bid and offer prices to other marketparticipants with the intention of generating revenue based on spread and volume. Positioning involves the active management ofderivative transactions with the expectation of profiting from favourable movements in prices, rates, or indices. Arbitrage activitiesinvolve identifying and profiting from price differentials between markets and product types. Any realized and unrealized gains or losseson derivatives used for trading purposes are recognized immediately in Non-interest income – Trading revenue.
Derivatives issued for other-than-trading purposesWe also use derivatives for purposes other than trading, primarily for hedging, in conjunction with the management of interest rate,credit, equity and foreign exchange risk related to our funding, lending, investment activities and asset/liability management.
Interest rate swaps are used to manage our exposure to interest rate risk by modifying the repricing or maturitycharacteristics of existing and/or forecasted assets and liabilities, including funding and investment activities. Purchased optionsare used to hedge redeemable deposits and other options embedded in consumer products. We manage our exposure to foreigncurrency risk with cross currency swaps and foreign exchange forward contracts. We predominantly use credit derivatives tomanage our credit exposures. We mitigate industry sector concentrations and single-name exposures related to our creditportfolio by purchasing credit derivatives to transfer credit risk to third parties.
Consolidated Financial Statements Royal Bank of Canada: Annual Report 2020 177

Note 8 Derivative financial instruments and hedging activities (continued)
Certain derivatives and cash instruments are specifically designated and qualify for hedge accounting. From time to time, wealso enter into derivative transactions to economically hedge certain exposures that do not otherwise qualify for hedgeaccounting, or where hedge accounting is not considered economically feasible to implement. In such circumstances, changes infair value are reflected in Other income in Non-interest income.
Notional amount of derivatives by term to maturity (absolute amounts) (1)
As at October 31, 2020
Term to maturity
(Millions of Canadian dollars)Within1 year
1 through5 years
Over5 years Total Trading
Other thanTrading
Over-the-counter contractsInterest rate contracts
Forward rate agreements $ 2,782,447 $ 427,464 $ 340 $ 3,210,251 $ 3,172,950 $ 37,301Swaps 3,409,078 5,990,160 3,755,593 13,154,831 12,685,595 469,236Options purchased 282,837 407,782 185,667 876,286 876,153 133Options written 303,347 410,237 198,222 911,806 911,806 –
Foreign exchange contractsForward contracts 1,691,079 32,474 1,788 1,725,341 1,707,082 18,259Cross currency swaps 80,186 56,563 64,540 201,289 194,773 6,516Cross currency interest rate swaps 412,053 1,117,048 633,023 2,162,124 2,112,625 49,499Options purchased 46,719 13,963 3,349 64,031 64,031 –Options written 50,099 13,407 3,410 66,916 66,916 –
Credit derivatives (2) 1,309 39,877 7,577 48,763 48,244 519Other contracts (3) 177,220 94,378 20,126 291,724 282,321 9,403
Exchange-traded contractsInterest rate contracts
Futures – long positions 164,925 112,363 113 277,401 277,401 –Futures – short positions 205,927 167,350 233 373,510 373,510 –Options purchased 74,494 14,188 – 88,682 88,682 –Options written 58,116 10,391 – 68,507 68,507 –
Foreign exchange contractsFutures – long positions 75 – – 75 75 –Futures – short positions – – – – – –
Other contracts 179,681 30,768 240 210,689 210,689 –
$ 9,919,592 $ 8,938,413 $ 4,874,221 $23,732,226 $23,141,360 $ 590,866
As at October 31, 2019
Term to maturity
(Millions of Canadian dollars)Within1 year
1 through5 years
Over5 years Total Trading
Other thanTrading
Over-the-counter contractsInterest rate contracts
Forward rate agreements $ 2,014,752 $ 179,624 $ 387 $ 2,194,763 $ 2,186,862 $ 7,901Swaps 3,294,746 5,026,410 3,331,025 11,652,181 11,180,497 471,684Options purchased 83,247 462,599 174,042 719,888 719,888 –Options written 77,601 464,906 182,690 725,197 725,197 –
Foreign exchange contractsForward contracts 1,715,266 30,523 985 1,746,774 1,724,606 22,168Cross currency swaps 79,264 50,416 55,166 184,846 177,622 7,224Cross currency interest rate swaps 469,910 894,250 425,301 1,789,461 1,743,465 45,996Options purchased 54,756 14,409 3,061 72,226 72,226 –Options written 54,985 14,969 3,383 73,337 73,337 –
Credit derivatives (2) 2,693 14,724 3,437 20,854 20,341 513Other contracts (3) 201,489 90,436 18,463 310,388 303,893 6,495
Exchange-traded contractsInterest rate contracts
Futures – long positions 107,054 118,805 187 226,046 226,046 –Futures – short positions 363,947 120,247 46 484,240 484,240 –Options purchased 56,657 36,985 – 93,642 93,642 –Options written 59,840 16,395 – 76,235 76,235 –
Foreign exchange contractsFutures – long positions 28 – – 28 28 –Futures – short positions – – – – – –
Other contracts 214,725 44,245 – 258,970 258,970 –
$ 8,850,960 $ 7,579,943 $ 4,198,173 $ 20,629,076 $ 20,067,095 $ 561,981
(1) The derivative notional amounts are determined using the standardized approach for measuring counterparty credit risk (SA-CCR) in accordance with the CapitalAdequacy Requirements (CAR).
(2) Credit derivatives with a notional value of $0.5 billion (October 31, 2019 – $0.5 billion) are economic hedges. Trading credit derivatives comprise protection purchased of$26.3 billion (October 31, 2019 – $12.6 billion) and protection sold of $21.9 billion (October 31, 2019 – $7.7 billion).
(3) Other contracts exclude loan-related commitment derivatives of $1.9 billion (October 31, 2019 - $7.7 billion), which are not classified as derivatives under CAR guidelines.
178 Royal Bank of Canada: Annual Report 2020 Consolidated Financial Statements

Fair value of derivative instruments (1)
As at
October 31, 2020 October 31, 2019
(Millions of Canadian dollars) Positive Negative Positive Negative
Held or issued for trading purposesInterest rate contracts
Forward rate agreements $ 33 $ 33 $ 30 $ 31Swaps 44,732 37,453 39,669 32,570Options purchased 7,498 – 5,898 –Options written – 8,916 – 6,756
52,263 46,402 45,597 39,357
Foreign exchange contractsForward contracts 10,765 10,190 11,263 11,755Cross currency swaps (2) 5,117 5,080 5,022 4,412Cross currency interest rate swaps (2) 19,880 21,826 22,076 21,999Options purchased 1,292 – 1,242 –Options written – 910 – 898
37,054 38,006 39,603 39,064
Credit derivatives 463 526 169 279Other contracts 21,156 23,985 15,356 18,517
110,936 108,919 100,725 97,217
Held or issued for other-than-trading purposesInterest rate contracts
Swaps 1,959 1,410 848 742
1,959 1,410 848 742
Foreign exchange contractsForward contracts 76 85 116 118Cross currency swaps 89 22 193 527Cross currency interest rate swaps 2,084 132 904 501
2,249 239 1,213 1,146
Credit derivatives – 5 – 3Other contracts 105 126 181 140
4,313 1,780 2,242 2,031
Total gross fair values before: 115,249 110,699 102,967 99,248Valuation adjustments determined on a pooled basis (1,104) (115) (697) 5Impact of netting agreements that qualify for balance sheet offset (657) (657) (710) (710)
$113,488 $109,927 $ 101,560 $ 98,543
(1) The fair value reflects the impact of the election to characterize the daily variation margin as settlement of the related derivative fair values as permitted by certaincentral counterparties.
(2) Amounts have been revised from those previously presented.
Fair value of derivative instruments by term to maturity (1)
As at
October 31, 2020 October 31, 2019
(Millions of Canadian dollars)Less than
1 year1 through
5 yearsOver
5 years TotalLess than
1 year1 through
5 yearsOver
5 years Total
Derivative assets $27,072 33,755 52,661 $ 113,488 $ 25,342 28,568 47,650 $ 101,560Derivative liabilities 26,507 32,885 50,535 109,927 25,495 26,503 46,545 98,543
(1) The fair value reflects the impact of the election to characterize the daily variation margin as settlement of the related derivative fair values permitted by certain centralcounterparties.
Interest rate benchmark reform (1)
We use interest rate contracts in fair value hedges and cash flow hedges to manage our exposure to interest rate risk of ourexisting and/or forecast assets and liabilities. We also use foreign denominated deposit liabilities in net investment hedges tomanage the foreign exchange risk arising from our investments in foreign operations. The hedging instruments designated tomanage these risks reference IBOR in multiple jurisdictions and will be affected by the Reform as the markets transition toalternative risk free or nearly risk-free rates by the end of 2021 or beyond.
Consolidated Financial Statements Royal Bank of Canada: Annual Report 2020 179

Note 8 Derivative financial instruments and hedging activities (continued)
The following table presents the notional or principal amount of our hedging instruments which reference IBOR that willexpire after 2021 and will be affected by the Reform. We continue to monitor the progress to assess which IBORs are impacted bythe Reform. The notional or principal amounts of our hedging instruments also approximates the extent of the risk exposure wemanage through hedging relationships:
As at
October 31, 2020 November 1, 2019
(Millions of Canadian dollars)Notional/Principal
amountsNotional/Principal
amounts
Interest rate contractsUSD LIBOR $ 40,676 $ 26,709GBP LIBOR 591 618
Non-derivative instrumentsUSD LIBOR 2,362 888GBP LIBOR 691 682
$ 44,320 $ 28,897
(1) Excludes interest rate contracts and non-derivative instruments which reference rates in multi-rate jurisdictions, including the Canadian Dollar Offered Rate (CDOR),EURO Interbank Offered Rate and Australian Bank Bill Swap Rate (BBSW).
Derivative-related credit riskCredit risk from derivative transactions is generated by the potential for the counterparty to default on its contractualobligations when one or more transactions have a positive market value to us. Therefore, derivative-related credit risk isrepresented by the positive fair value of the instrument and is normally a small fraction of the contract’s notional amount.
We subject our derivative transactions to the same credit approval, limit and monitoring standards that we use for managingother transactions that create credit exposure. This includes evaluating the creditworthiness of counterparties, and managingthe size, diversification and maturity structure of the portfolio. Credit utilization for all products is compared with establishedlimits on a continual basis and is subject to a standard exception reporting process. We use a single internal rating system for allcredit risk exposure, as outlined in the internal ratings maps in the Credit risk section of Management’s Discussion and Analysis.
Offsetting is a technique that can reduce credit exposure from derivatives and is generally facilitated through the use ofmaster netting agreements and achieved when specific criteria are met in accordance with our accounting policy in Note 2. Amaster netting agreement provides for a single net settlement of all financial instruments covered by the agreement in the eventof default. However, credit risk is reduced only to the extent that our financial obligations to the same counterparty can be set offagainst obligations of the counterparty to us. We maximize the use of master netting agreements to reduce derivative-relatedcredit exposure. Our overall exposure to credit risk that is reduced through master netting agreements may change substantiallyfollowing the reporting date as the exposure is affected by each transaction subject to the agreement as well as by changes inunderlying market rates. Measurement of our credit exposure arising out of derivative transactions is reduced to reflect theeffects of netting in cases where the enforceability of that netting is supported by appropriate legal analysis as documented inour trading credit risk policies.
The use of collateral is another significant credit mitigation technique for managing derivative-related counterparty creditrisk. Mark-to-market provisions in our agreements with some counterparties, typically in the form of a Credit Support Annex,provide us with the right to request that the counterparty pay down or collateralize the current market value of its derivativespositions when the value exceeds a specified threshold amount.
Replacement cost and credit equivalent amounts are determined in accordance with OSFI’s non-modelled regulatory SA-CCRunder the CAR guidelines. The replacement cost represents the total fair value of all outstanding contracts in a gain position afterfactoring in the master netting agreements and applicable margins, scaled by a regulatory factor. The credit equivalent amountis defined as the replacement cost plus an additional amount for potential future credit exposure also scaled by a regulatoryfactor. The risk-weighted equivalent is determined by applying appropriate risk-weights to the credit equivalent amount,including those risk weights reflective of model approval under the internal ratings based approach.
180 Royal Bank of Canada: Annual Report 2020 Consolidated Financial Statements

Derivative-related credit risk (1)
As at
October 31, 2020 October 31, 2019
(Millions of Canadian dollars)Replacement
cost
Creditequivalent
amountRisk-weightedequivalent (2)
Replacementcost
Creditequivalent
amountRisk-weightedequivalent (2)
Over-the-counter contractsInterest rate contracts
Forward rate agreements $ 30 $ 191 $ 79 $ 18 $ 73 $ 19Swaps 7,112 17,324 7,359 6,487 15,911 6,229Options purchased 142 392 285 149 547 326Options written 4 307 136 – 256 113
Foreign exchange contractsForward contracts 2,796 17,641 4,537 2,333 15,822 3,899Swaps 2,392 15,349 3,997 3,047 15,678 4,001Options purchased 465 923 292 404 908 285Options written 1 155 59 4 213 67
Credit derivatives 429 1,839 81 156 613 40Other contracts 3,577 16,455 7,719 1,972 10,766 4,853
Exchange-traded contracts 3,137 8,842 177 5,439 19,630 393
$ 20,085 $ 79,418 $ 24,721 $ 20,009 $ 80,417 $ 20,225
(1) The amounts presented are net of master netting agreements in accordance with CAR guidelines.(2) The risk-weighted balances are calculated in accordance with CAR guidelines and exclude CVA of $18 billion (October 31, 2019 – $13 billion).
Replacement cost of derivative instruments by risk rating and by counterparty typeAs at October 31, 2020
Risk rating (1) Counterparty type (2)
(Millions of Canadian dollars) AAA, AA A BBB BB or lower Total BanksOECD
governments Other TotalGross positive replacement cost $ 30,097 $ 44,736 $ 18,392 $ 22,024 $ 115,249 $ 49,146 $ 22,109 $ 43,994 $ 115,249Impact of master netting agreements and
applicable margins 27,110 40,359 14,238 13,457 95,164 48,291 21,534 25,339 95,164
Replacement cost (after netting agreements) $ 2,987 $ 4,377 $ 4,154 $ 8,567 $ 20,085 $ 855 $ 575 $ 18,655 $ 20,085
As at October 31, 2019Risk rating (1) Counterparty type (2)
(Millions of Canadian dollars) AAA, AA A BBB BB or lower Total BanksOECD
governments Other Total
Gross positive replacement cost $ 27,126 $ 38,812 $ 20,620 $ 16,409 $ 102,967 $ 48,509 $ 18,126 $ 36,332 $ 102,967Impact of master netting agreements and
applicable margins 23,146 35,088 16,719 8,005 82,958 47,376 17,705 17,877 82,958
Replacement cost (after netting agreements) $ 3,980 $ 3,724 $ 3,901 $ 8,404 $ 20,009 $ 1,133 $ 421 $ 18,455 $ 20,009
(1) Our internal risk ratings of AAA, AA, A and BBB represent investment grade ratings and ratings of BB or lower represent non-investment grade ratings, as outlined in theinternal ratings maps in the Credit risk section of Management’s Discussion and Analysis.
(2) Counterparty type is defined in accordance with CAR guidelines.
Derivatives in hedging relationshipsWe apply hedge accounting to minimize volatility in earnings and capital caused by changes in interest rates or foreign exchangerates. Interest rate and currency fluctuations will either cause assets and liabilities to appreciate or depreciate in market valueor cause variability in forecasted cash flows. When a hedging relationship is effective, gains, losses, revenue and expenses of thehedging instrument will offset the gains, losses, revenue and expenses of the hedged item.
Derivatives used in hedging relationships are recorded in Other Assets – Derivatives or Other Liabilities – Derivatives on theBalance Sheet. Foreign currency-denominated liabilities used in net investment hedging relationships are recorded in Deposits –Business and Government and Subordinated debentures on the Balance Sheet. Gains and losses relating to hedgingineffectiveness is recorded in Non-Interest income and amounts reclassified from hedge reserves in OCI to income is recorded inNet-interest income for cash flow hedges and Non-interest income for net Investment hedges.
We assess and measure the effectiveness of a hedging relationship based on the change in the fair value or cash flows of thederivative hedging instrument relative to the change in the fair value or cash flows of the hedged item attributable to the hedgedrisk. When cash instruments are designated as hedges of foreign exchange risks, only changes in their value due to foreignexchange risk are included in the assessment and measurement of hedge effectiveness.Potential sources of ineffectiveness can be attributed to differences between hedging instruments and hedged items:
• Mismatches in the terms of hedged items and hedging instruments, for example the frequency and timing of wheninterest rates are reset and frequency of payment.
• Difference in the discounting factors between the hedged item and the hedging instrument, taking into consideration thedifferent reset frequency of the hedged item and hedging instrument.
• Hedging derivatives with a non-zero fair value at inception date of the hedging relationship, resulting in mismatch interms with the hedged item.
Consolidated Financial Statements Royal Bank of Canada: Annual Report 2020 181

Note 8 Derivative financial instruments and hedging activities (continued)
Below is a description of our risk management strategy for each risk exposure that we decide to hedge:
Interest rate riskWe use interest rate contracts to manage our exposure to interest rate risk by modifying the repricing characteristics of existingand/or forecasted assets and liabilities, including funding and investment activities. The swaps are designated in either a fairvalue hedge or a cash flow hedge and predominately reference IBORs across multiple jurisdictions. Certain swaps will beaffected by the Reform as the market transitions to alternative risk free or nearly risk free rates by the end of 2021 or beyond.
For fair value hedges, we use interest rate contracts to manage the fair value movements of our fixed-rate instruments dueto changes in benchmark interest. The interest rate swaps are entered into on a one-to-one basis to manage the benchmarkinterest rate risk, and its terms are critically matched to the specified fixed rate instruments.
We also use interest rate swaps in fair value hedges to manage interest rate risk from residential mortgage assets andfunding liabilities. Our exposure from this portfolio changes with the origination of new loans, repayments of existing loans, andsale of securitized mortgages. Accordingly, we have adopted dynamic hedging for that portfolio, in which the hedge relationshipis rebalanced on a more frequent basis, such as on a bi-weekly or on a monthly basis.
For cash flow hedges, we use interest rate swaps to manage the exposure to cash flow variability of our variable rateinstruments as a result of changes in benchmark interest rates. The variable rate instruments and forecast transactions whichreference certain IBORs will be affected by the Reform. Whilst some of the interest rate derivatives are entered into on a one-to-one basis to manage a specific exposure, other interest rate derivatives may be entered into for managing interest rate risks of aportfolio of assets and liabilities.
Foreign exchange riskWe manage our exposure to foreign currency risk with cross currency swaps in a cash flow hedge, and foreign exchange forwardcontracts in a net investment hedge. Certain cash instruments may also be designated in a net investment hedge, whereapplicable.
For cash flow hedges, we use cross currency swaps and forward contracts to manage the cash flow variability arising fromfluctuations in foreign exchange rates on our issued foreign denominated fixed rate liabilities and highly probable forecastedtransactions. The maturity profile and repayment terms of these swaps are matched to those of our foreign denominatedexposures to limit our cash flow volatility from changes in foreign exchange rates.
For net investment hedges, we use a combination of foreign exchange forwards and cash instruments, such as foreigndenominated deposit liabilities, some of which reference IBORs that will be affected by the Reform, to manage our foreignexchange risk arising from our investments in foreign operations. Our most significant exposures include U.S. dollar, Britishpound and Euro. When hedging net investments in foreign operations using foreign exchange forwards, only the undiscountedspot element of the foreign exchange forward is designated as the hedging instrument. Accordingly, changes in the fair value ofthe hedging instrument as a result of changes in forward rates and the effects of discounting are not included in the hedgingeffectiveness assessment. Foreign operations are only hedged to the extent of the liability or notional amount of the derivative;we generally do not expect to incur significant ineffectiveness on hedges of net investments in foreign operations.
Equity price riskWe use total return swaps in cash flow hedges to mitigate the cash flow variability of the expected payment associated with ourcash settled share-based compensation plan for certain key employees by exchanging interest payments for indexed RBC shareprice change and dividend returns.
Credit riskWe predominantly use credit derivatives to economically hedge our credit exposures. We mitigate industry sector concentrationsand single-name exposures related to our credit portfolio by purchasing credit derivatives to transfer credit risk to third parties.
Derivative instruments designated in hedging relationshipsThe following table presents the fair values of the derivative instruments and the principal amounts of the non-derivativeliabilities, categorized by their hedging relationships, as well as derivatives that are not designated in hedging relationships.
Derivatives and non-derivative instruments (1)
As at
October 31, 2020 October 31, 2019
Designated as hedging instrumentsin hedging relationships
Designated as hedging instrumentsin hedging relationships
(Millions of Canadian dollars) Fair value Cash flowNet
investment
Not designatedin a hedgingrelationship Fair value Cash flow
Netinvestment
Not designatedin a hedgingrelationship
AssetsDerivative instruments $ 102 $ 1 $ 19 $ 113,366 $ 146 $ 77 $ 52 $ 101,285
LiabilitiesDerivative instruments 298 30 58 109,541 187 526 70 97,760Non-derivative instruments – – 28,702 n.a. – – 27,688 n.a.
(1) The fair value reflects the impact of the election to characterize the daily variation margin as settlement of the related derivative fair values as permitted by certaincentral counterparties.
n.a. not applicable
182 Royal Bank of Canada: Annual Report 2020 Consolidated Financial Statements

The following tables provide the maturity analysis of the notional amounts and the weighted average rates of the hedginginstruments and their carrying amounts by types of hedging relationships:
Fair value hedgesAs at October 31, 2020
Notional amounts Carrying amount (1)
(Millions of Canadian dollars, except average rates)Within1 year
1 through5 years
Over5 years Total Assets Liabilities
Interest rate riskInterest rate contracts
Hedge of fixed rate assets $ 14,410 $ 28,182 $ 6,709 $ 49,301 $ 1 $ 298Hedge of fixed rate liabilities 21,207 38,704 6,415 66,326 101 –
Weighted average fixed interest rateHedge of fixed rate assets 1.5% 1.0% 2.0% 1.3%Hedge of fixed rate liabilities 1.7% 1.4% 1.8% 1.6%
As at October 31, 2019Notional amounts Carrying amount (1)
(Millions of Canadian dollars, except average rates)Within1 year
1 through5 years
Over5 years Total Assets Liabilities
Interest rate riskInterest rate contracts
Hedge of fixed rate assets $ 4,625 $ 20,439 $ 3,909 $ 28,973 $ 2 $ 187Hedge of fixed rate liabilities 16,003 48,361 9,065 73,429 144 –
Weighted average fixed interest rateHedge of fixed rate assets 1.9% 2.2% 2.7% 2.2%Hedge of fixed rate liabilities 1.7% 1.8% 1.8% 1.7%
(1) The carrying value reflects the impact of the election to characterize the daily variation margin as settlement of the related derivative fair values as permitted by certaincentral counterparties.
Cash flow hedgesAs at October 31, 2020
Notional amounts Carrying amount (1)
(Millions of Canadian dollars, except average rates)Within1 year
1 through5 years
Over5 years Total Assets Liabilities
Interest rate riskInterest rate contracts
Hedge of variable rate assets $ 15,309 $ 10,663 $ 1,762 $ 27,734 $ – $ –Hedge of variable rate liabilities 5,616 61,697 5,384 72,697 – –
Weighted average fixed interest rateHedge of variable rate assets 0.6% 1.4% 1.8% 1.0%Hedge of variable rate liabilities 1.9% 1.5% 1.4% 1.5%
Foreign exchange riskCross currency swaps $ 700 $ 160 $ – $ 860 $ 1 $ 2
Weighted average CAD-JPY exchange rate 0.01 – – 0.01Weighted average CAD-EUR exchange rate – 1.52 – 1.52Weighted average USD-EUR exchange rate – – – –
As at October 31, 2019Notional amounts Carrying amount (1)
(Millions of Canadian dollars, except average rates)Within1 year
1 through5 years
Over5 years Total Assets Liabilities
Interest rate riskInterest rate contracts
Hedge of variable rate assets $ 17,327 $ 11,729 $ 1,696 $ 30,752 $ – $ –Hedge of variable rate liabilities 200 54,610 4,803 59,613 – –
Weighted average fixed interest rateHedge of variable rate assets 2.1% 2.0% 2.6% 2.1%Hedge of variable rate liabilities 2.6% 1.9% 2.4% 2.0%
Foreign exchange riskCross currency swaps $ 2,937 $ 63 $ 88 $ 3,088 $ 2 $ 526
Weighted average CAD-JPY exchange rate – – – –Weighted average CAD-EUR exchange rate – 1.48 1.55 1.52Weighted average USD-EUR exchange rate 1.33 – – 1.33
(1) The carrying value reflects the impact of the election to characterize the daily variation margin as settlement of the related derivative fair values as permitted by certaincentral counterparties.
Consolidated Financial Statements Royal Bank of Canada: Annual Report 2020 183

Note 8 Derivative financial instruments and hedging activities (continued)
Net investment hedgesAs at October 31, 2020
Notional/Principal Carrying amount
(Millions of Canadian dollars, except average rates)Within1 year
1 through5 years
Over5 years Total Assets Liabilities
Foreign exchange riskForeign currency liabilities $ 7,722 $ 18,706 $ 2,274 $ 28,702 n.a. $ 29,175
Weighted average CAD-USD exchange rate 1.29 1.31 1.31 1.30Weighted average CAD-EUR exchange rate – 1.51 1.50 1.51Weighted average CAD-GBP exchange rate 1.73 1.65 – 1.69
Forward contracts $ 7,869 $ – $ – $ 7,869 $ 19 $ 58Weighted average CAD-USD exchange rate 1.33 – – 1.33Weighted average CAD-EUR exchange rate 1.56 – – 1.56Weighted average CAD-GBP exchange rate 1.71 – – 1.71
As at October 31, 2019Notional/Principal Carrying amount
(Millions of Canadian dollars, except average rates)Within1 year
1 through5 years
Over5 years Total Assets Liabilities
Foreign exchange riskForeign currency liabilities $ 8,701 $ 14,843 $ 4,144 $ 27,688 n.a. $ 27,859
Weighted average CAD-USD exchange rate 1.31 1.29 1.31 1.30Weighted average CAD-EUR exchange rate – – 1.51 1.51Weighted average CAD-GBP exchange rate – 1.69 – 1.69
Forward contracts $ 5,355 $ – $ – $ 5,355 $ 52 $ 70Weighted average CAD-USD exchange rate 1.33 – – 1.33Weighted average CAD-EUR exchange rate 1.47 – – 1.47Weighted average CAD-GBP exchange rate 1.67 – – 1.67
n.a. not applicable
The following tables present the details of the hedged items categorized by their hedging relationships:
Fair value hedges – assets and liabilities designated as hedged itemsAs at and for the year ended October 31, 2020
Carrying amount
Accumulated amount of fairvalue adjustments on the
hedged item included in thecarrying amount
(Millions of Canadian dollars) Assets Liabilities Assets Liabilities Balance sheet items:
Changes in fairvalues used for
calculating hedgeineffectiveness
Interest rate riskFixed rate assets (1)
$49,272 $ – $ 1,058 $ –
Securities – Investment, net ofapplicable allowance; Loans – Retail;
Loans – Wholesale $ 879Fixed rate liabilities (1)
– 68,130 – 1,817Deposits – Business and government;
Subordinated debentures (1,142)
As at and for the year ended October 31, 2019
Carrying amount
Accumulated amount of fairvalue adjustments on the
hedged item included in thecarrying amount
(Millions of Canadian dollars) Assets Liabilities Assets Liabilities Balance sheet items:
Changes in fairvalues used for
calculating hedgeineffectiveness
Interest rate riskFixed rate assets (1)
$ 29,985 $ – $ 569 $ –Securities – Investment, net of
applicable allowance; Loans – Retail $ 1,028Fixed rate liabilities (1)
– 74,099 – 693Deposits – Business and government;
Subordinated debentures (2,045)
(1) As at October 31, 2020, the accumulated amount of fair value hedge adjustments remaining in the Balance Sheet for hedged items that have ceased to be adjusted forhedging gains and losses is a gain of $32 million for fixed-rate assets and a loss of $94 million for fixed-rate liabilities (October 31, 2019 – loss of $53 million and $170million, respectively).
184 Royal Bank of Canada: Annual Report 2020 Consolidated Financial Statements

Cash flow and net investment hedges – assets and liabilities designated as hedged itemsAs at and for the year ended October 31, 2020
Balance sheet items:
Changes in fairvalues used for
calculating hedgeineffectiveness
Cash flow hedge/foreigncurrency translation reserve
(Millions of Canadian dollars) Continuing hedgesDiscontinued
hedges
Cash flow hedgesInterest rate risk
Variable rate assets Securities – Investment, net ofapplicable allowance; Loans – Retail $ (484) $ 294 $ 285
Variable rate liabilities Deposits – Business and government;Deposits – Personal 1,839 (1,540) (523)
Foreign exchange riskFixed rate assets Securities – Investment, net of
applicable allowance; Loans – Retail 2 6 –Fixed rate liabilities Deposits – Business and government (164) – –
Net investment hedgesForeign exchange risk
Foreign subsidiaries n.a. 535 (6,363) (421)
As at and for the year ended October 31, 2019
Balance sheet items:
Changes in fairvalues used for
calculating hedgeineffectiveness
Cash flow hedge/foreigncurrency translation reserve
(Millions of Canadian dollars) Continuing hedgesDiscontinued
hedges
Cash flow hedgesInterest rate risk
Variable rate assets Securities – Investment, net ofapplicable allowance; Loans – Retail $ (608) $ 163 $ 84
Variable rate liabilities Deposits – Business and government;Deposits – Personal 1,274 (372) 70
Foreign exchange riskFixed rate assets Securities – Investment, net of
applicable allowance; Loans – Retail (5) (1) –Fixed rate liabilities Deposits – Business and government 125 9 –
Net investment hedgesForeign exchange risk
Foreign subsidiaries n.a. (7) (5,407) (871)
n.a. not applicable
Effectiveness of designated hedging relationshipsFor the year ended October 31, 2020
(Millions of Canadian dollars)
Change in fair valueof hedginginstrument
Hedgeineffectiveness
recognized inincome (1)
Changes in the value ofthe hedging instrument
recognized in OCI
Amount reclassifiedfrom hedge reserves
to income
Fair value hedgesInterest rate risk
Interest rate contracts – fixed rate assets $ (931) $ (52) $ – $ –Interest rate contracts – fixed rate liabilities 1,157 15 – –
Cash flow hedgesInterest rate risk
Interest rate contracts – variable rate assets 501 16 532 200Interest rate contracts – variable rate liabilities (1,803) 1 (2,127) (367)
Foreign exchange riskCross currency swap – fixed rate assets (2) – 3 (5)Cross currency swap – fixed rate liabilities 164 – 113 122
Net investment hedgesForeign exchange risk
Foreign currency liabilities (405) 5 (410) –Forward contracts (124) 1 (125) (28)
Consolidated Financial Statements Royal Bank of Canada: Annual Report 2020 185

Note 8 Derivative financial instruments and hedging activities (continued)
For the year ended October 31, 2019
(Millions of Canadian dollars)
Change in fair valueof hedginginstrument
Hedgeineffectiveness
recognized inincome (1)
Changes in the value ofthe hedging instrument
recognized in OCI
Amount reclassifiedfrom hedge reserves
to income
Fair value hedgesInterest rate risk
Interest rate contracts – fixed rate assets $ (1,060) $ (32) $ – $ –Interest rate contracts – fixed rate liabilities 2,032 (13) – –
Cash flow hedgesInterest rate risk
Interest rate contracts – variable rate assets 605 8 582 (25)Interest rate contracts – variable rate liabilities (1,261) (5) (1,265) 220
Foreign exchange riskCross currency swap – fixed rate assets 5 – 8 5Cross currency swap – fixed rate liabilities (125) – (193) (106)
Net investment hedgesForeign exchange risk
Foreign currency liabilities (50) – (50) –Forward contracts 57 – 57 (2)
(1) Hedge ineffectiveness recognized in income included losses of $94 million that are excluded from the assessment of hedge effectiveness and are offset by economichedges (October 31, 2019 – $70 million).
Reconciliation of components of equityThe following table provides a reconciliation by risk category of each component of equity and an analysis of othercomprehensive income relating to hedge accounting:
For the year ended October 31, 2020 For the year ended October 31, 2019
(Millions of Canadian dollars)Cash flow hedge
reserveForeign currency
translation reserveCash flow hedge
reserveForeign currency
translation reserveBalance at the beginning of the year $ (6) $ 4,221 $ 688 $ 4,147Cash flow hedgesEffective portion of changes in fair value:
Interest rate risk (1,595) (683)Foreign exchange risk 115 (185)Equity price risk (77) 108
Net amount reclassified to profit or loss:Ongoing hedges:
Interest rate risk 277 24Foreign exchange risk (119) 104Equity price risk 53 (93)
De-designated hedges:Interest rate risk (110) (219)Foreign exchange risk – –
Net gain on hedge of net investment inforeign operationsForeign exchange denominated debt (410) (50)Forward foreign exchange contracts (125) 57Foreign currency translation differences
for foreign operations 813 66Reclassification of losses (gains) on
foreign currency translation to income (21) 2Reclassification of losses (gains) on net
investment hedging activities to income 28 2Tax on movements on reserves during the
period 383 126 250 (3)
Balance at the end of the year $ (1,079) $ 4,632 $ (6) $ 4,221
186 Royal Bank of Canada: Annual Report 2020 Consolidated Financial Statements

Note 9 Premises and equipment
For the year ended October 31, 2020
Owned by the Bank (1), (2) Right-of-use lease assets
(Millions of Canadian dollars) Land BuildingsComputer
equipment
Furniture,fixtures
and otherequipment
Leaseholdimprovements
Work inprocess Buildings Equipment Total
CostBalance at beginning of period $153 $ 1,395 $ 2,062 $ 1,557 $ 3,001 $ 432 $ 4,956 $ 363 $13,919Additions – 26 82 42 14 623 281 115 1,183Transfers from work in process – 9 279 93 449 (830) – – –Disposals (1) (4) (157) (42) (124) (2) (58) (57) (445)Foreign exchange translation 1 4 7 4 10 (2) 38 1 63Other (1) (14) (51) 30 33 (18) (46) (1) (68)
Balance at end of period $152 $ 1,416 $ 2,222 $ 1,684 $ 3,383 $ 203 $ 5,171 $ 421 $14,652
Accumulated depreciationBalance at beginning of period $ – $ 703 $ 1,553 $ 1,137 $ 2,074 $ – $ – $ 205 $ 5,672Depreciation – 47 267 109 224 – 600 86 1,333Disposals – (3) (155) (39) (112) – (12) (16) (337)Foreign exchange translation – 1 4 3 3 – (2) – 9Other – 6 (17) 55 (1) – (2) – 41
Balance at end of period $ – $ 754 $ 1,652 $ 1,265 $ 2,188 $ – $ 584 $ 275 $ 6,718
Net carrying amount at end ofperiod $152 $ 662 $ 570 $ 419 $ 1,195 $ 203 $ 4,587 $ 146 $ 7,934
For the year ended October 31, 2019
(Millions of Canadian dollars) Land BuildingsComputer
equipment
Furniture,fixtures
and otherequipment
Leaseholdimprovements
Work inprocess Total
CostBalance at beginning of period $153 $ 1,399 $ 2,123 $ 1,373 $ 2,726 $ 264 $8,038Additions (1) – – 195 129 81 591 996Transfers from work in process – 4 84 82 262 (432) –Disposals – (10) (68) (29) (65) – (172)Foreign exchange translation – – 3 (1) 2 – 4Other – 2 (12) 3 (5) 9 (3)
Balance at end of period $153 $ 1,395 $ 2,325 $ 1,557 $ 3,001 $ 432 $8,863
Accumulated depreciationBalance at beginning of period $ – $ 669 $ 1,556 $ 1,051 $ 1,930 $ – $5,206Depreciation – 45 273 113 196 – 627Disposals – (8) (61) (26) (56) – (151)Foreign exchange translation – – 1 – 1 – 2Other – (3) (11) (1) 3 – (12)
Balance at end of period $ – $ 703 $ 1,758 $ 1,137 $ 2,074 $ – $5,672
Net carrying amount at end of period $153 $ 692 $ 567 $ 420 $ 927 $ 432 $3,191
(1) As at October 31, 2020, we had total contractual commitments of $94 million to purchase premises and equipment (October 31, 2019 – $338 million).(2) These amounts reflect certain transition adjustments made upon adoption of IFRS 16. Refer to Note 2 for further details.
Lease payments (IFRS 16)Total lease payments for the year ended October 31, 2020 were $1,338 million, of which $654 million or 49% relates to variablepayments and $684 million or 51% relates to fixed payments.
Total variable lease payments not included in the measurement of lease liabilities were $635 million for the year endedOctober 31, 2020.
Consolidated Financial Statements Royal Bank of Canada: Annual Report 2020 187

Note 9 Premises and equipment (continued)
Lease commitments (IAS 17)Operating lease commitmentsThe minimum future lease payments under non-cancellable operating leases under IAS 17 were as follows:
As at October 31, 2019
(Millions of Canadian dollars)
Land andbuildings Equipment
Future minimum lease paymentsNo later than one year $ 721 $ 88Later than one year and no later than five years 2,251 101Later than five years 3,039 –
6,011 189Less: Future minimum sublease payments to be received (25) –
Net future minimum lease payments $ 5,986 $ 189
Note 10 Goodwill and other intangible assets
Goodwill
For the year ended October 31, 2020
(Millions ofCanadian dollars)
CanadianBanking
CaribbeanBanking
CanadianWealth
ManagementGlobal Asset
Management
U.S. WealthManagement
(includingCity National)
InternationalWealth
Management Insurance
Investor &TreasuryServices
CapitalMarkets Total
Balance at beginning ofperiod $ 2,555 $ 1,727 $ 579 $ 1,985 $ 2,943 $ 120 $ 112 $ 148 $1,067 $11,236
Acquisitions 2 – 6 – 1 – – – – 9Dispositions – (16) – – – – – – – (16)Currency translations – 8 2 16 34 1 – 1 11 73Balance at end of period $ 2,557 $ 1,719 $ 587 $ 2,001 $ 2,978 $ 121 $ 112 $ 149 $1,078 $11,302
For the year ended October 31, 2019
(Millions ofCanadian dollars)
CanadianBanking
CaribbeanBanking
CanadianWealth
ManagementGlobal Asset
Management
U.S. WealthManagement
(includingCity National)
InternationalWealth
Management Insurance
Investor &TreasuryServices
CapitalMarkets Total
Balance at beginning ofperiod $ 2,528 $ 1,729 $ 579 $ 1,986 $ 2,870 $ 118 $ 112 $ 148 $ 1,067 $ 11,137
Acquisitions 27 – – – 71 – – – – 98Dispositions – – – (20) – – – – – (20)Currency translations – (2) – 19 2 2 – – – 21
Balance at end of period $ 2,555 $ 1,727 $ 579 $ 1,985 $ 2,943 $ 120 $ 112 $ 148 $ 1,067 $ 11,236
We perform our annual impairment test by comparing the carrying amount of each CGU to its recoverable amount. Therecoverable amount of a CGU is represented by its value in use, except in circumstances where the carrying amount of a CGUexceeds its value in use. In such cases, the greater of the CGU’s fair value less costs of disposal and its value in use is therecoverable amount. Our annual impairment test is performed as at August 1.
The environment is rapidly evolving and as a result, our economic outlook has a higher than usual degree of uncertainty,which may, in future periods, materially change the expected future cash flows of our CGUs and result in an impairment charge.Actual experience may differ materially from current expectations, including in relation to the duration and severity of theeconomic contraction and the ultimate timing and extent of a future recovery.
In our 2020 and 2019 annual impairment tests, the recoverable amounts of our Caribbean Banking and International WealthManagement CGUs were based on their fair value less costs of disposal. The recoverable amounts of all other CGUs tested werebased on their value in use.
Value in useWe calculate value in use using a five-year discounted cash flow method. Future cash flows are based on financial plans agreedby management, estimated based on forecast results, business initiatives, capital required to support future cash flows andreturns to shareholders. Key drivers of future cash flows include net interest margins and average interest-earning assets. Thevalues assigned to these drivers over the forecast period are based on past experience, external and internal economicforecasts, and management’s expectations of the impact of economic conditions on our financial results. Beyond the initial cashflow projection period, cash flows are assumed to increase at a constant rate using a nominal long-term growth rate (terminalgrowth rate), with the exception of our U.S. Wealth Management (including City National) CGU where we applied a mid-termgrowth rate consistent with our growth expectations for this business, reverting to the terminal growth rate after 10 years.Terminal growth rates are based on the current market assessment of gross domestic product and inflation for the countrieswithin which the CGU operates. The discount rates used to determine the present value of each CGU’s projected future cashflows are based on the bank-wide cost of capital, adjusted for the risks to which each CGU is exposed. CGU-specific risks include:country risk, business/operational risk, geographic risk (including political risk, devaluation risk, and government regulation),currency risk, and price risk (including product pricing risk and inflation).
188 Royal Bank of Canada: Annual Report 2020 Consolidated Financial Statements

As a result of the economic disruptions triggered by COVID-19, the recoverable amounts of certain CGUs, including CapitalMarkets and U.S. Wealth Management (including City National), which are more sensitive to economic uncertainties, includinginterest rate movements, have declined, but continue to exceed carrying amounts despite impacts from the COVID-19 pandemic.
The estimation of value in use involves significant judgment in the determination of inputs to the discounted cash flow modeland is most sensitive to changes in future cash flows, discount rates and terminal growth rates applied to cash flows beyond theforecast period. The sensitivity of the value in use to key inputs and assumptions used was tested by recalculating therecoverable amount using reasonably possible changes to those parameters. The post-tax discount rates were increased by 1%,terminal growth rates were decreased by 1%, and future cash flows were reduced by 10%. As at August 1, 2020, no reasonablypossible change in an individual key input or assumption, as described, would result in a CGU’s carrying amount exceeding itsrecoverable amount based on value in use.
The terminal growth rates and pre-tax discount rates used in our discounted cash flow models are summarized below.
As at
August 1, 2020 August 1, 2019
Discountrate (1)
Terminalgrowth
rateDiscount
rate (1)
Terminalgrowth
rateGroup of cash generating unitsCanadian Banking 9.5% 3.0% 10.2% 3.0%Caribbean Banking 11.4 3.7 11.9 4.2Canadian Wealth Management 10.4 3.0 11.2 3.0Global Asset Management 10.5 3.0 11.1 3.0U.S. Wealth Management (including City National) 10.7 3.0 11.2 3.0International Wealth Management (2) n.m. n.m. n.m. n.m.Insurance 10.2 3.0 11.0 3.0Investor & Treasury Services 10.2 3.0 10.9 3.0Capital Markets 12.0 3.0 11.8 3.0
(1) Pre-tax discount rates are determined implicitly based on post-tax discount rates.(2) The recoverable amount for our International Wealth Management CGU is determined using a multiples-based approach.n.m. not meaningful
Fair value less costs of disposal – Caribbean BankingFor our Caribbean Banking CGU, we calculated fair value less costs of disposal using a discounted cash flow method thatprojects future cash flows over a 5-year period. We also considered reasonably possible alternative scenarios, including marketcomparable transactions, which yielded valuations ranging from an immaterial surplus to an immaterial deficit. Cash flows arebased on management forecasts, adjusted to approximate the considerations of a prospective third-party buyer. Cash flowsbeyond the initial 5-year period are assumed to increase at a constant rate using a nominal long-term growth rate. Future cashflows, terminal growth rates, and discount rates are based on the same factors noted above. This fair value measurement iscategorized as level 3 in the fair value hierarchy as certain significant inputs are not observable. We use significant judgment todetermine inputs to the discounted cash flow model which are most sensitive to changes in future cash flows, discount rates andterminal growth rates applied to cash flows beyond the forecast period. The sensitivity of the fair value less costs of disposal tokey inputs and assumptions was tested by recalculating the recoverable amount using reasonably possible change to thoseparameters.
As a result of the economic disruptions triggered by COVID-19, the recoverable amount of our Caribbean Banking CGU hasdeclined. As at August 1, 2020, the recoverable amount of our Caribbean Banking CGU, based on fair value less costs of disposal,approximates its carrying amount (August 1, 2019 – the fair value less costs of disposal was 126% of its carrying amount). Indetermining the recoverable amount, forecast future cash flows were discounted using a pre-tax rate of 11.4% (August 1, 2019 -11.9%), reflecting a lower interest rate environment, and the terminal growth rate used was 3.7% (August 1, 2019 - 4.2%), reflectinguncertainty due to the pandemic. A 50 bps change in the discount rate would increase and decrease the recoverable amount by$335 million and $288 million, respectively. A 50 bps change in the terminal growth rate would increase and decrease therecoverable amount by $266 million and $228 million, respectively. A reduction in the forecasted cash flows of 10% per annumwould reduce the recoverable amount by $392 million. Changes in these assumptions have been applied holding other individualfactors constant. However, changes in one factor may be magnified or offset by related changes in other assumptions as impactsto the recoverable amount are highly interdependent and changes in assumptions may not have a linear effect on therecoverable amount of the CGU. In aggregate, the range of reasonably possible outcomes would not materially affect therecoverable amount of the CGU.
Fair value less costs of disposal – International Wealth ManagementFor our International Wealth Management CGU, we calculated fair value less costs of disposal using a multiples-based approach.Each business within the CGU was valued using either a Price-to-assets-under-administration (P/AUA) or Price-to-revenue (P/Rev)multiple, as appropriate, to reflect the considerations of a prospective third-party buyer. In 2020, we applied a P/AUA multiple of2.25% to AUA as at August 1 (August 1, 2019 – 2.25%) and a P/Rev multiple of 2.5x (August 1, 2019 – 2.5x) to revenue for the 12months preceding the testing date. These multiples represent our best estimate from a range of reasonably possible inputsbased on precedent transactions for comparable businesses. This fair value measurement is categorized as level 3 in the fairvalue hierarchy as certain significant inputs are not observable.
The estimation of fair value less costs of disposal involves significant judgment in the determination of the appropriatevaluation approach and inputs and is most sensitive to changes in the P/AUA and P/Rev multiples. The sensitivity of the fair valueless costs of disposal to key inputs was tested by reducing each multiple to the low end of the range of reasonably possibleinputs considered. As at August 1, 2020, no reasonably possible change in an individual key input or assumption, as described,would result in the CGU’s carrying amount exceeding its recoverable amount based on fair value less costs of disposal.
Consolidated Financial Statements Royal Bank of Canada: Annual Report 2020 189

Note 10 Goodwill and other intangible assets (continued)
Other intangible assets
For the year ended October 31, 2020
(Millions of Canadian dollars)
Internallygenerated
softwareOther
software
Coredeposit
intangibles
Customerlist and
relationshipsIn process
software TotalGross carrying amountBalance at beginning of period $ 6,941 $ 1,684 $ 1,567 $ 1,773 $ 1,240 $ 13,205Additions 54 47 – 143 1,157 1,401Acquisitions through business combinations – 6 – 10 – 16Transfers 936 193 – – (1,129) –Dispositions (149) (13) – – (4) (166)Impairment losses (116) (4) – – (10) (130)Currency translations 20 7 19 13 8 67Other changes (10) (19) – (23) (21) (73)
Balance at end of period $ 7,676 $ 1,901 $ 1,586 $ 1,916 $ 1,241 $ 14,320
Accumulated amortizationBalance at beginning of period $ (5,256) $ (1,357) $ (627) $ (1,291) $ – $ (8,531)Amortization charge for the year (855) (144) (160) (114) – (1,273)Dispositions 147 12 – – – 159Impairment losses 88 – – – – 88Currency translations (14) (6) (6) (9) – (35)Other changes 6 (5) – 23 – 24
Balance at end of period $ (5,884) $ (1,500) $ (793) $ (1,391) $ – $ (9,568)
Net balance at end of period $ 1,792 $ 401 $ 793 $ 525 $ 1,241 $ 4,752
For the year ended October 31, 2019
(Millions of Canadian dollars)
Internallygenerated
softwareOther
software
Coredeposit
intangibles
Customerlist and
relationshipsIn process
software TotalGross carrying amountBalance at beginning of period $ 5,984 $ 1,582 $ 1,750 $ 1,768 $ 1,146 $ 12,230Additions 42 49 – – 1,184 1,275Acquisitions through business combinations – 16 – 6 – 22Transfers 1,009 42 – – (1,051) –Dispositions – (1) – – – (1)Impairment losses (94) (6) – – (42) (142)Currency translations – 1 1 7 (2) 7Other changes – 1 (184) (8) 5 (186)
Balance at end of period $ 6,941 $ 1,684 $ 1,567 $ 1,773 $ 1,240 $ 13,205
Accumulated amortizationBalance at beginning of period $ (4,501) $ (1,226) $ (654) $ (1,162) $ – $ (7,543)Amortization charge for the year (793) (121) (159) (124) – (1,197)Dispositions – – – – – –Impairment losses 30 2 – – – 32Currency translations (1) (1) 1 (6) – (7)Other changes 9 (11) 185 1 – 184
Balance at end of period $ (5,256) $ (1,357) $ (627) $ (1,291) $ – $ (8,531)
Net balance at end of period $ 1,685 $ 327 $ 940 $ 482 $ 1,240 $ 4,674
Note 11 Significant dispositions
Wealth ManagementOn October 30, 2019, we completed the sale of our private debt Global Asset Management business in the United Kingdom to DyalCapital Partners. As a result of the transaction, we recorded a pre-tax gain of $142 million in Non-interest income – Other ($134million after-tax). The assets, liabilities and equity that were included in the disposal group are not significant.
Note 12 Joint ventures and associated companies
The following table summarizes the carrying value of our interests in joint ventures and associated companies accounted forunder the equity method as well as our share of the income of those entities.
Joint ventures Associated companies
As at and for the year ended
(Millions of Canadian dollars)
October 31
2020October 31
2019October 31
2020October 31
2019Carrying amount $ 193 $ 178 $ 459 $ 474Share of:
Net income $ 87 $ 107 $ (10) $ (31)
190 Royal Bank of Canada: Annual Report 2020 Consolidated Financial Statements

We do not have any joint ventures or associated companies that are individually material to our financial results.During the year ended October 31, 2020, we recognized impairment losses of $4 million with respect to our interests in joint
ventures and associated companies (October 31, 2019 – impairment losses of $2 million).Certain of our subsidiaries, joint ventures and associates are subject to regulatory requirements of the jurisdictions in which they
operate. When these subsidiaries, joint ventures and associates are subject to such requirements, they may be restricted fromtransferring to us our share of their assets in the form of cash dividends, loans or advances. As at October 31, 2020, restricted netassets of these subsidiaries, joint ventures and associates were $37.7 billion (October 31, 2019 – $34.9 billion).
Note 13 Other assets
As at
(Millions of Canadian dollars)
October 31
2020October 31
2019Accounts receivable and prepaids $ 4,600 $ 4,569Accrued interest receivable 2,362 2,866Cash collateral 18,119 15,629Commodity trading receivables 4,104 4,232Deferred income tax asset 2,579 1,989Employee benefit assets 143 147Insurance-related assets
Collateral loans 801 926Policy loans 97 95Reinsurance assets 949 748Other 93 78
Investments in joint ventures and associates 652 652Margin deposits 9,816 5,688Precious metals 2,371 416Receivable from brokers, dealers and clients 2,077 2,511Taxes receivable 5,487 5,553Other 4,671 2,974
$ 58,921 $ 49,073
Note 14 Deposits
As at
October 31, 2020 October 31, 2019
(Millions of Canadian dollars) Demand (1) Notice (2) Term (3) Total Demand (1) Notice (2) Term (3) TotalPersonal $ 182,745 $ 61,761 $ 98,546 $ 343,052 $ 143,958 $ 49,806 $ 100,968 $ 294,732Business and government 315,472 16,585 292,254 624,311 253,113 13,867 298,502 565,482Bank 12,502 956 31,064 44,522 8,363 920 16,508 25,791
$ 510,719 $ 79,302 $421,864 $1,011,885 $ 405,434 $ 64,593 $ 415,978 $ 886,005Non-interest-bearing (4)
Canada $ 123,402 $ 7,390 $ 368 $ 131,160 $ 93,163 $ 5,692 $ 137 $ 98,992United States 43,831 – – 43,831 34,632 – – 34,632Europe (5) 654 – – 654 760 – – 760Other International 7,372 – – 7,372 5,225 5 – 5,230
Interest-bearing (4)Canada 287,046 19,036 310,492 616,574 228,386 15,306 333,118 576,810United States 7,190 52,046 57,037 116,273 4,704 39,626 41,776 86,106Europe (5) 33,810 830 37,250 71,890 33,073 825 30,090 63,988Other International 7,414 – 16,717 24,131 5,491 3,139 10,857 19,487
$ 510,719 $ 79,302 $421,864 $1,011,885 $ 405,434 $ 64,593 $ 415,978 $ 886,005
(1) Demand deposits are deposits for which we do not have the right to require notice of withdrawal, which include both savings and chequing accounts.(2) Notice deposits are deposits for which we can legally require notice of withdrawal. These deposits are primarily savings accounts.(3) Term deposits are deposits payable on a fixed date, and include term deposits, guaranteed investment certificates and similar instruments.(4) The geographical splits of the deposits are based on the point of origin of the deposits and where the revenue is recognized. As at October 31, 2020, deposits
denominated in U.S. dollars, British pounds, Euro and other foreign currencies were $347 billion, $32 billion, $47 billion and $33 billion, respectively (October 31, 2019 –$321 billion, $23 billion, $45 billion and $31 billion, respectively).
(5) Europe includes the United Kingdom, Luxembourg, the Channel Islands, France and Italy.
Contractual maturities of term depositsAs at
(Millions of Canadian dollars)
October 31
2020October 31
2019Within 1 year:
less than 3 months $ 121,144 $ 94,5853 to 6 months 62,892 62,8146 to 12 months 78,676 92,507
1 to 2 years 32,950 50,0552 to 3 years 42,201 31,8523 to 4 years 26,749 31,3734 to 5 years 24,651 21,130Over 5 years 32,601 31,662
$ 421,864 $ 415,978Aggregate amount of term deposits in denominations of one hundred thousand dollars or more $ 388,000 $ 379,000
Consolidated Financial Statements Royal Bank of Canada: Annual Report 2020 191

Note 14 Deposits (continued)
Average deposit balances and average rates of interestFor the year ended
October 31, 2020 October 31, 2019
(Millions of Canadian dollars, except for percentage amounts)
Averagebalances
Averagerates
Averagebalances
Averagerates
Canada $ 725,021 1.02% $ 650,555 1.60%United States 144,011 0.46 129,903 1.17Europe 73,317 0.76 63,333 1.15Other International 28,283 0.68 26,290 1.20
$ 970,632 0.90% $ 870,081 1.49%
Note 15 Insurance
Risk managementInsurance risk is the risk of fluctuations in the timing, frequency or severity of insured events, relative to our expectations at the timeof underwriting. We do not have a high degree of concentration risk due to our geographic diversity and business mix. Concentrationrisk is not a major concern for the life and health insurance business as it does not have a material level of region-specificcharacteristics. Reinsurance is also used for a majority of our businesses to lower our risk profile and limit the liability on a singleclaim. We manage underwriting and pricing risk through the use of underwriting guidelines which detail the class, nature and type ofbusiness that may be accepted, pricing policies by product line and centralized control of policy wordings. The risk that claims arehandled or paid inappropriately is mitigated by using a range of information technology (IT) system controls and manual processesconducted by experienced staff. These, together with a range of detailed policies and procedures, ensure that all claims are handledin a timely, appropriate and accurate manner.
ReinsuranceIn the ordinary course of business, our insurance operations reinsure risks to other insurance and reinsurance companies in order tolower our risk profile, limit loss exposure to large risks, and provide additional capacity for future growth. These ceding reinsurancearrangements do not relieve our insurance subsidiaries from our direct obligations to the insured parties. We evaluate the financialcondition of the reinsurers and monitor our concentrations of credit risks to minimize our exposure to losses from reinsurerinsolvency. Reinsurance amounts (ceded premiums) included in Non-interest income are shown in the table below.
Net premiums and claimsFor the year ended
(Millions of Canadian dollars)
October 31
2020October 31
2019Gross premiums $ 4,515 $ 4,209Premiums ceded to reinsurers (249) (225)Net premiums $ 4,266 $ 3,984Gross claims and benefits (1) $ 3,700 $ 3,990Reinsurers’ share of claims and benefits (316) (241)Net claims $ 3,384 $ 3,749(1) Includes the change in fair value of investments backing our policyholder liabilities, which are largely offset in revenue.
Insurance claims and policy benefit liabilitiesAll actuarial assumptions are set in conjunction with Canadian Institute of Actuaries Standards of Practice and OSFIrequirements. The assumptions that have the greatest effect on the measurement of insurance liabilities, the processes used todetermine them and the assumptions used as at October 31, 2020 are as follows:
Mortality and morbidity – Mortality estimates are based on standard industry insured mortality tables, adjusted whereappropriate to reflect our own experience. Morbidity assumptions are made with respect to the rates of claim incidence andclaim termination for health insurance policies and are based on a combination of industry and our own experience.
Future investment yield – Assumptions are based on the current yield rate, a reinvestment assumption and an allowance forfuture credit losses for each line of business, and are developed using interest rate scenario testing, including prescribedscenarios for determination of minimum liabilities as set out in the actuarial standards.
Policyholder behaviour – Under certain policies, the policyholder has a contractual right to change benefits and premiums, aswell as convert policies to permanent forms of insurance. All policyholders have the right to terminate their policies throughlapse. Lapses represent the termination of policies due to non-payment of premiums. Lapse assumptions are primarily based onour recent experience adjusted for emerging industry experience where applicable.
192 Royal Bank of Canada: Annual Report 2020 Consolidated Financial Statements

Significant insurance assumptionsAs at
October 31
2020October 31
2019
Life InsuranceCanadian Insurance
Mortality rates (1) 0.11% 0.12%Morbidity rates (2) 1.81 1.82Future reinvestment yield (3) 3.82 3.69Lapse rates (4) 0.50 0.50
International InsuranceMortality rates (1) 0.66 0.57Future reinvestment yield (3) 3.05 3.06
(1) Average annual death rate for the largest portfolio of insured policies.(2) Average net termination rate for the individual and group disability insurance portfolio.(3) Ultimate reinvestment rate of the insurance operations.(4) Ultimate policy termination rate (lapse rate) for the largest permanent life insurance portfolio that relies on higher termination rate to maintain its profitability (lapse-
supported policies).
Insurance claims and policy benefit liabilitiesThe following table summarizes our gross and reinsurers’ share of insurance liabilities at the end of the year.
As at
October 31, 2020 October 31, 2019
(Millions of Canadian dollars) Gross Ceded Net Gross Ceded NetLife insurance policyholder liabilities
Life, health and annuity $ 12,089 $ 752 $ 11,337 $ 11,339 $ 601 $ 10,738Investment contracts (1) 34 – 34 38 – 38
$ 12,123 $ 752 $ 11,371 $ 11,377 $ 601 $ 10,776
Non-life insurance policyholder liabilitiesUnearned premium provision (1) $ 7 $ – $ 7 $ 29 $ – $ 29Unpaid claims provision 126 31 95 62 2 60
$ 133 $ 31 $ 102 $ 91 $ 2 $ 89
$ 12,256 $ 783 $ 11,473 $ 11,468 $ 603 $ 10,865
(1) Insurance liabilities for investment contracts and unearned premium provision are reported in Other liabilities on the Consolidated Balance Sheets.
Reconciliation of life insurance policyholder liabilitiesFor the year ended
October 31, 2020 October 31, 2019
(Millions of Canadian dollars) Gross Ceded Net Gross Ceded NetBalances at beginning of period $ 11,377 $ 601 $ 10,776 $ 10,024 $ 493 $ 9,531New and in-force policies (1) 735 141 594 1,479 103 1,376Changes in assumption and methodology 15 10 5 (122) 5 (127)Net change in investment contracts (4) – (4) (4) – (4)
Balances at end of period $ 12,123 $ 752 $ 11,371 $ 11,377 $ 601 $ 10,776
(1) Includes the change in fair value of investments backing our policyholder liabilities.
The net increase in life insurance claims and policy benefit liabilities over the prior year was attributable to business growth andmarket movements on assets backing life and health liabilities, partially offset by asset and liability matching activities. Duringthe year, we reviewed all key actuarial methods and assumptions which are used in determining the policy benefit liabilitiesresulting in a $5 million net increase to insurance liabilities comprised of: (i) a decrease of $74 million for revised actuarialreserves on interest rate risk; (ii) a decrease of $75 million due to reinsurance contract renegotiations; (iii) an increase of $137million arising from insurance risk related assumption updates largely due to mortality, morbidity, and expense assumptions;and (iv) an increase of $17 million due to valuation system and data changes.
Consolidated Financial Statements Royal Bank of Canada: Annual Report 2020 193

Note 15 Insurance (continued)
Sensitivity analysisThe following table presents the sensitivity of the level of insurance policyholder liabilities disclosed in this note to reasonablypossible changes in the actuarial assumptions used to calculate them. The percentage change in each variable is applied to arange of existing actuarial modelling assumptions to derive the possible impact on net income. The analyses are performedwhere a single assumption is changed while holding other assumptions constant, which is unlikely to occur in practice.
Net income impactfor the year ended
(Millions of Canadian dollars, except for percentage amounts)Change in
variable
October 31
2020October 31
2019Increase in market interest rates (1) 1% $ 5 $ (7)Decrease in market interest rates (1) 1 (11) 4Increase in equity market values (2) 10 8 1Decrease in equity market values (2) 10 (22) (3)Increase in maintenance expenses (3) 5 (37) (33)Life Insurance (3)
Adverse change in annuitant mortality rates 2 (278) (205)Adverse change in assurance mortality rates 2 (70) (60)Adverse change in morbidity rates 5 (219) (205)Adverse change in lapse rates 10 (252) (247)
(1) Sensitivities for market interest rates include the expected current period earnings impact of a 100 basis points shift in the yield curve by increasing the currentreinvestment rates while holding the assumed ultimate rates constant. The sensitivity consists of both the impact on assumed reinvestment rates in the actuarialliabilities and any changes in fair value of assets and liabilities from the yield curve shift.
(2) Sensitivities to changes in equity market values are composed of the expected current period earnings impact from differences in the changes in fair value of the equityasset holdings and the partially offsetting impact on the actuarial liabilities.
(3) Sensitivities to changes in maintenance expenses and life insurance actuarial assumptions include the expected current period earnings impact from recognition ofincreased liabilities due to an adverse change in the given assumption over the lifetime of all in-force policies.
Note 16 Segregated funds
We offer certain individual variable insurance contracts that allow policyholders to invest in segregated funds. The investmentreturns on these funds are passed directly to the policyholders. Amounts invested are at the policyholders’ risk, except where thepolicyholders have selected options providing maturity and death benefit guarantees. A liability for the guarantees is recorded inInsurance claims and policy benefit liabilities.
Segregated funds net assets are recorded at fair value. All of our segregated funds net assets are categorized as Level 1 inthe fair value hierarchy. The fair value of the segregated funds liabilities is equal to the fair value of the segregated funds netassets. Segregated funds net assets and segregated funds liabilities are presented on separate lines on the ConsolidatedBalance Sheets. The following tables present the composition of net assets and the changes in net assets for the year.
Segregated funds net assetsAs at
(Millions of Canadian dollars)
October 31
2020October 31
2019Cash $ 35 $ 31Investment in mutual funds 1,886 1,631Other assets (liabilities) net 1 1
$ 1,922 $ 1,663
Changes in net assetsFor the year ended
(Millions of Canadian dollars)
October 31
2020October 31
2019Net assets at beginning of period $ 1,663 $ 1,368Additions (deductions):
Deposits from policyholders 724 557Net realized and unrealized gains (losses) 12 124Interest and dividends 49 39Payment to policyholders (479) (386)Management and administrative fees (47) (39)
Net assets at end of period $ 1,922 $ 1,663
194 Royal Bank of Canada: Annual Report 2020 Consolidated Financial Statements

Note 17 Employee benefits – Pension and other post-employment benefits
Plan characteristicsWe sponsor a number of programs that provide pension and post-employment benefits to eligible employees. The majority ofbeneficiaries of the pension plans are located in Canada and other beneficiaries of the pension plans are primarily located in theU.K. and the Caribbean. The pension arrangements including investment, plan benefits and funding decisions are governed bylocal pension committees or trustees, who are legally segregated from the Bank, or management. Significant plan changesrequire the approval of the Board of Directors.
Our defined benefit pension plans provide pension benefits based on years of service, contributions and average earningsat retirement. Our primary defined benefit pension plans are closed to new members. New employees are generally eligible tojoin defined contribution pension plans. The specific features of these plans vary by location. We also provide supplementalnon-registered (non-qualified) pension plans for certain executives and senior management that are typically unfunded orpartially funded.
Our defined contribution pension plans provide pension benefits based on accumulated employee and Bank contributions.The Bank contributions are based on a percentage of an employee’s annual earnings and a portion of the Bank contribution maybe dependent on the amount being contributed by the employee and their years of service.
Our primary other post-employment benefit plans provide health, dental, disability and life insurance coverage and cover anumber of current and retired employees who are mainly located in Canada. These plans are unfunded unless required bylegislation.
We measure our benefit obligations and pension assets as at October 31 each year. All plans are valued using the projectedunit-credit method. We fund our registered defined benefit pension plans in accordance with actuarially determined amountsrequired to satisfy employee benefit obligations under current pension regulations. For our principal pension plan, the mostrecent funding actuarial valuation was completed on January 1, 2020, and the next valuation will be completed on January 1, 2021.
For the year ended October 31, 2020, total contributions to our pension plans (defined benefit and defined contributionplans) and other post-employment benefit plans were $1,024 million and $63 million (October 31, 2019 – $551 million and$72 million), respectively. For 2021, total contributions to our pension plans and other post-employment benefit plans areexpected to be $455 million and $82 million, respectively.
RisksBy their design, the defined benefit pension and other post-employment benefit plans expose the Bank to various risks such asinvestment performance, reductions in discount rates used to value the obligations, increased longevity of plan members, futureinflation levels impacting future salary increases as well as future increases in healthcare costs. These risks will reduce over timedue to the membership closure of our primary defined benefit pension plans and migration to defined contribution pension plans.
The following table presents the financial position related to all of our material pension and other post-employment benefit plansworldwide, including executive retirement arrangements.
As at
October 31, 2020 October 31, 2019
(Millions of Canadian dollars)
Defined benefitpension plans
Other post-employment
benefit plansDefined benefit
pension plans
Other post-employment
benefit plansCanada
Fair value of plan assets $ 15,044 $ – $ 13,679 $ 1Present value of defined benefit obligation 15,408 1,863 14,428 1,722
Net surplus (deficit) $ (364) $ (1,863) $ (749) $ (1,721)
InternationalFair value of plan assets $ 980 $ – $ 1,106 $ –Present value of defined benefit obligation 943 90 1,089 98
Net surplus (deficit) $ 37 $ (90) $ 17 $ (98)
TotalFair value of plan assets $ 16,024 $ – $ 14,785 $ 1Present value of defined benefit obligation 16,351 1,953 15,517 1,820
Total net surplus (deficit) $ (327) $ (1,953) $ (732) $ (1,819)
Effect of asset ceiling (1) – (1) –
Total net surplus (deficit), net of effect of asset ceiling $ (328) $ (1,953) $ (733) $ (1,819)
Amounts recognized in our Consolidated Balance SheetsEmployee benefit assets $ 143 $ – $ 147 $ –Employee benefit liabilities (471) (1,953) (880) (1,819)
Total net surplus (deficit), net of effect of asset ceiling $ (328) $ (1,953) $ (733) $ (1,819)
Consolidated Financial Statements Royal Bank of Canada: Annual Report 2020 195

Note 17 Employee benefits – Pension and other post-employment benefits (continued)
The following table presents an analysis of the movement in the financial position related to all of our material pension and otherpost-employment benefit plans worldwide, including executive retirement arrangements.
As at or for the year ended
October 31, 2020 October 31, 2019
(Millions of Canadian dollars)
Defined benefitpension plans (1)
Other post-employment
benefit plansDefined benefit
pension plans (1)
Other post-employment
benefit plansFair value of plan assets at beginning of period $ 14,785 $ 1 $ 13,564 $ 1
Interest income 447 – 532 –Remeasurements
Return on plan assets (excluding interest income) 793 – 910 –Change in foreign currency exchange rate 17 – 9 –Contributions – Employer 798 63 339 72Contributions – Plan participant 48 19 48 18Payments (623) (83) (601) (90)Payments – amount paid in respect of settlements (223) – – –Other (18) – (16) –
Fair value of plan assets at end of period $ 16,024 $ – $ 14,785 $ 1
Benefit obligation at beginning of period $ 15,517 $ 1,820 $ 13,218 $ 1,622Current service costs 367 46 297 39Past service costs – (12) 1 –Gains and losses on settlements (5) – – –Interest expense 462 59 510 65Remeasurements
Actuarial losses (gains) from demographicassumptions – (5) (4) (7)
Actuarial losses (gains) from financial assumptions 791 68 1,977 196Actuarial losses (gains) from experience adjustments 2 38 59 (23)
Change in foreign currency exchange rate 15 3 12 –Contributions – Plan participant 48 19 48 18Payments (623) (83) (601) (90)Payments – amount paid in respect of settlements (223) – – –
Benefit obligation at end of period $ 16,351 $ 1,953 $ 15,517 $ 1,820
Unfunded obligation $ 30 $ 1,792 $ 29 $ 1,671Wholly or partly funded obligation 16,321 161 15,488 149
Total benefit obligation $ 16,351 $ 1,953 $ 15,517 $ 1,820
(1) For pension plans with funding deficits, the benefit obligations and fair value of plan assets as at October 31, 2020 were $15,054 million and $14,583 million, respectively(October 31, 2019 – $14,329 million and $13,449 million, respectively).
Pension and other post-employment benefit expenseThe following table presents the composition of our pension and other post-employment benefit expense related to our materialpension and other post-employment benefit plans worldwide.
For the year ended
Pension plansOther post-employment
benefit plans
(Millions of Canadian dollars)
October 31
2020October 31
2019October 31
2020October 31
2019Current service costs $ 367 $ 297 $ 46 $ 39Past service costs – 1 (12) –Gains and losses on settlements (5) – – –Net interest expense (income) 15 (22) 59 65Remeasurements of other long term benefits – – 13 13Administrative expense 18 16 – –
Defined benefit pension expense $ 395 $ 292 $ 106 $ 117Defined contribution pension expense 226 212 – –
$ 621 $ 504 $ 106 $ 117
Service costs for the year ended October 31, 2020 totalled $363 million (October 31, 2019 – $293 million) for pension plans inCanada and $4 million (October 31, 2019 – $5 million) for International plans. Net interest expense (income) for the year endedOctober 31, 2020 totalled $14 million (October 31, 2019 – $(21) million) for pension plans in Canada and $1 million (October 31, 2019– $(1) million) for International plans.
196 Royal Bank of Canada: Annual Report 2020 Consolidated Financial Statements

Pension and other post-employment benefit remeasurementsThe following table presents the composition of our remeasurements recorded in OCI related to our material pension and otherpost-employment benefit plans worldwide.
For the year ended
Defined benefit pensionplans
Other post-employmentbenefit plans
(Millions of Canadian dollars)
October 31
2020October 31
2019October 31
2020October 31
2019Actuarial (gains) losses:
A Changes in demographic assumptions $ – $ (4) $ (14) $ (11)Changes in financial assumptions 791 1,977 62 186Experience adjustments 2 59 40 (22)
Return on plan assets (excluding interest based on discount rate) (793) (910) – –
$ – $ 1,122 $ 88 $ 153
Remeasurements recorded in OCI for the year ended October 31, 2020 were gains of $7 million (October 31, 2019 – losses of $1,102million) for pension plans in Canada and losses of $7 million (October 31, 2019 – losses of $20 million) for International plans.
Investment policy and strategiesDefined benefit pension plan assets are invested prudently in order to meet our longer-term pension obligations. The pensionplans’ investment strategy is to hold a diversified mix of investments by asset class and geographic location in order to reduceinvestment-specific risk to the funded status while maximizing the expected returns to meet pension obligations. Investment ofthe plan’s assets follows an asset/liability framework as investment is conducted with careful consideration of the pensionobligation’s sensitivity to interest rates and credit spreads which are key risk factors impacting the obligation’s value. Factorstaken into consideration in developing our asset mix include but are not limited to the following:
• the nature of the underlying benefit obligations, including the duration and term profile of the liabilities;• the member demographics, including expectations for normal retirements, terminations, and deaths;• the financial position of the pension plans;• the diversification benefits obtained by the inclusion of multiple asset classes; and• expected asset returns, including asset and liability correlations, along with liquidity requirements of the plan.
To implement our asset mix policy, we may invest in debt securities, equity securities, and alternative investments. Our holdingsin certain investments, including common shares, debt securities rated lower than BBB and residential and commercialmortgages, cannot exceed a defined percentage of the market value of our defined benefit pension plan assets. We may usederivative instruments as either a synthetic investment to more efficiently replicate the performance of an underlying security, oras a hedge against financial risks within the plan. To manage our credit risk exposure, where derivative instruments are notcentrally cleared, counterparties are required to meet minimum credit ratings and enter into collateral agreements.
Our defined benefit pension plan assets are primarily comprised of debt and equity securities and alternative investments.Our equity securities generally have unadjusted quoted market prices in an active market (Level 1) and our debt securitiesgenerally have quoted market prices for similar assets in an active market (Level 2). Alternative investments and other includescash, hedge funds, and private fund investments including infrastructure, real estate leases, private equity and debt. In the caseof private fund investments, no quoted market prices are usually available (Level 2 or Level 3). These fund assets are eithervalued by an independent valuator or priced using observable market inputs.
During the year ended October 31, 2020, the management of defined benefit pension investments focused on increasedallocation to risk reducing investments and strategies, maintaining diversification, while striving to improve expected investmentreturn. Over time, an increasing allocation to debt securities and a debt security overlay program are being used to reduce asset/liability duration mismatch and hence variability of the plan’s funded status due to interest rate movement. Longer maturity debtsecurities, given their price sensitivity to movements in interest rates, are considered to be a good economic hedge to riskassociated with the plan’s liabilities, which are discounted using predominantly long maturity bond interest rates as inputs.
Asset allocation of defined benefit pension plans (1)
As at
October 31, 2020 October 31, 2019
(Millions of Canadian dollars, except percentages) Fair value
Percentageof total
plan assets
Quotedin active
market (2) Fair value
Percentageof total
plan assets
Quotedin active
market (2)
Equity securitiesDomestic $ 1,493 9% 100% $ 1,544 10% 100%Foreign 3,859 24 100 3,215 22 98
Debt securitiesDomestic government bonds 3,259 20 – 3,014 21 –Foreign government bonds 81 1 – 396 3 –Corporate and other bonds 3,701 23 – 3,458 23 –
Alternative investments and other 3,631 23 13 3,158 21 13
$ 16,024 100% 36% $ 14,785 100% 35%
(1) The asset allocation is based on the underlying investments held directly and indirectly through the funds as this is how we manage our investment policy and strategies.(2) If our assessment of whether or not an asset was quoted in an active market was based on direct investments, 38% of our total plan assets would be classified as quoted
in an active market (October 31, 2019 – 36%).
Consolidated Financial Statements Royal Bank of Canada: Annual Report 2020 197

Note 17 Employee benefits – Pension and other post-employment benefits (continued)
The allocation of equity securities in our pension plans in Canada is 34% (October 31, 2019 – 33%) and that of our Internationalplans is 20% (October 31, 2019 – 16%). The allocation of debt securities in our pension plans in Canada is 44% (October 31, 2019 –47%) and that of our International plans is 42% (October 31, 2019 – 44%). The allocation of alternative investments and other inour pension plans in Canada is 22% (October 31, 2019 – 20%) and that of our International plans is 38% (October 31, 2019 – 40%).
As at October 31, 2020, the plan assets include 1 million (October 31, 2019 – 1 million) of our common shares with a fair valueof $96 million (October 31, 2019 – $104 million) and $32 million (October 31, 2019 – $57 million) of our debt securities. For the yearended October 31, 2020, dividends received on our common shares held in the plan assets were $4 million (October 31, 2019 – $4million).
Maturity profileThe following table presents the maturity profile of our defined benefit pension plan obligation.
(Millions of Canadian dollars, except participants and years)
As at October 31, 2020
Canada International TotalNumber of plan participants 68,128 5,456 73,584Actual benefit payments 2020 $ 571 $ 275 $ 846Benefits expected to be paid 2021 640 33 673Benefits expected to be paid 2022 659 35 694Benefits expected to be paid 2023 679 35 714Benefits expected to be paid 2024 699 36 735Benefits expected to be paid 2025 717 37 754Benefits expected to be paid 2026-2030 3,821 186 4,007Weighted average duration of defined benefit payments 16.1 years 21.4 years 16.4 years
Significant assumptionsOur methodologies to determine significant assumptions used in calculating the defined benefit pension and other post-employment benefit expense are as follows:
Discount rateFor the Canadian pension and other post-employment benefit plans, all future expected benefit payments at each measurementdate are discounted at spot rates from a derived Canadian AA corporate bond yield curve. The derived curve is based on actualshort and mid-maturity corporate AA rates and extrapolated longer term rates. The extrapolated corporate AA rates are derivedfrom observed corporate A, corporate AA and provincial AA yields. For the International pension and other post-employmentbenefit plans, all future expected benefit payments at each measurement date are discounted at spot rates from a local AAcorporate bond yield curve. Spot rates beyond 30 years are set to equal the 30-year spot rate. The discount rate is the equivalentsingle rate that produces the same discounted value as that determined using the entire discount curve. This valuationmethodology does not rely on assumptions regarding reinvestment returns.
Rate of increase in future compensationThe assumptions for increases in future compensation are developed separately for each plan, where relevant. Each assumptionis set based on the price inflation assumption and compensation policies in each market, as well as relevant local statutory andplan-specific requirements.
Healthcare cost trend ratesHealthcare cost calculations are based on both short and long term trend assumptions established using the plan’s recentexperience as well as market expectations.
Weighted average assumptions to determine benefit obligationAs at
Defined benefit pensionplans
Other post-employmentbenefit plans
October 31
2020October 31
2019October 31
2020October 31
2019
Discount rate 2.7% 3.0% 3.0% 3.3%Rate of increase in future compensation 3.3% 3.3% n.a. n.a.Healthcare cost trend rates (1)
– Medical n.a. n.a. 3.5% 3.5%– Dental n.a. n.a. 3.1% 3.1%
(1) For our other post-employment benefit plans, the assumed trend rates used to measure the expected benefit costs of the defined benefit obligations are also theultimate trend rates.
n.a. not applicable
198 Royal Bank of Canada: Annual Report 2020 Consolidated Financial Statements

Mortality assumptionsMortality assumptions are significant in measuring our obligations under the defined benefit pension plans. These assumptionshave been set based on country specific statistics. Future longevity improvements have been considered and included whereappropriate. The following table summarizes the mortality assumptions used for material plans.
As at
October 31, 2020 October 31, 2019
Life expectancy at 65 for a member currently at Life expectancy at 65 for a member currently atAge 65 Age 45 Age 65 Age 45
(In years) Male Female Male Female Male Female Male Female
CountryCanada 23.8 24.1 24.7 25.1 23.7 24.1 24.7 25.0United Kingdom 23.5 25.3 25.2 27.1 23.5 25.2 25.1 27.0
Sensitivity analysisAssumptions adopted can have a significant effect on the value of the obligations for defined benefit pension and other post-employment benefit plans and are based on historical experience and market inputs. The increase (decrease) in obligation in thefollowing table has been determined for key assumptions assuming all other assumptions are held constant. In practice, this isunlikely to occur, as changes in some of the assumptions may be correlated. The following table presents the sensitivity analysisof key assumptions for 2020.
Increase (decrease)in obligation
(Millions of Canadian dollars)
Defined benefitpension plans
Other post-employmentbenefit plans
Discount rateImpact of 100 bps increase in discount rate $ (2,364) $ (260)Impact of 100 bps decrease in discount rate 3,052 332
Rate of increase in future compensationImpact of 50 bps increase in rate of increase in future compensation 63 –Impact of 50 bps decrease in rate of increase in future compensation (67) –
Mortality rateImpact of an increase in longevity by one additional year 466 39
Healthcare cost trend rateImpact of 100 bps increase in healthcare cost trend rate n.a. 75Impact of 100 bps decrease in healthcare cost trend rate n.a. (63)
n.a. not applicable
Note 18 Other liabilities
As at
(Millions of Canadian dollars)
October 31
2020October 31
2019
Accounts payable and accrued expenses $ 1,500 $ 1,598Accrued interest payable 2,855 3,496Cash collateral 19,433 16,195Commodity liabilities 8,354 8,487Deferred income 2,945 2,563Deferred income taxes 52 82Dividends payable 1,611 1,567Employee benefit liabilities 2,424 2,699Insurance related liabilities 341 387Lease liabilities 5,357 49Negotiable instruments 1,676 1,671Payable to brokers, dealers and clients 5,108 3,241Payroll and related compensation 7,476 7,416Precious metals certificates 623 431Provisions 618 581Taxes payable 2,209 2,202Other 7,249 5,472
$ 69,831 $ 58,137
Consolidated Financial Statements Royal Bank of Canada: Annual Report 2020 199

Note 19 Subordinated debentures
The debentures are unsecured obligations and are subordinated in right of payment to the claims of depositors and certain othercreditors. The amounts presented below are net of our own holdings in these debentures, and include the impact of fair valuehedges used for managing interest rate risk.
(Millions of Canadian dollars, except percentage and foreign currency)
Interestrate
Denominatedin foreign currency
(millions)
As at
MaturityEarliest par valueredemption date
October 31
2020October 31
2019July 15, 2022 5.38% US$150 $ 205 $ 206June 8, 2023 9.30% 110 110December 6, 2024 (1) December 6, 2019 2.99% – 1,999June 4, 2025 (2), (3) June 4, 2020 2.48% – 997January 20, 2026 (2) January 20, 2021 3.31% (4) 1,501 1,483January 27, 2026 (2) 4.65% US$1,500 2,148 2,023September 29, 2026 (2) September 29, 2021 3.45% (5) 1,017 1,009November 1, 2027 November 1, 2022 4.75% TT$300 59 59July 25, 2029 (2) July 25, 2024 2.74% (6) 1,559 1,486December 23, 2029 (2) December 23, 2024 2.88% (7) 1,578 –June 30, 2030 (2) June 30, 2025 2.09% (8) 1,247 –October 1, 2083 Any interest payment date (9) 224 224June 29, 2085 Any interest payment date (10) US$174 231 229
$ 9,879 $ 9,825Deferred financing costs (12) (10)
$ 9,867 $ 9,815
The terms and conditions of the debentures are as follows:(1) On December 6, 2019, we redeemed all $2,000 million of our outstanding 2.99% subordinated debentures due on December 6, 2024 for 100% of their principal amount plus
interest accrued to, but excluding, the redemption date.(2) The notes include non-viability contingency capital (NVCC) provisions, necessary for the notes to qualify as Tier 2 regulatory capital under Basel III. NVCC provisions
require the conversion of the instrument into a variable number of common shares in the event that OSFI deems the Bank non-viable or a federal or provincialgovernment in Canada publicly announces that the Bank has accepted or agreed to accept a capital injection. In such an event, each note is convertible into commonshares pursuant to an automatic conversion formula with a multiplier of 1.5 and a conversion price based on the greater of: (i) a floor price of $5.00 and (ii) the currentmarket price of our common shares based on the volume weighted average trading price of our common shares on the Toronto Stock Exchange. The number of sharesissued is determined by dividing the par value of the note (including accrued and unpaid interest on such note) by the conversion price and then times the multiplier.
(3) On June 4, 2020, we redeemed all $1,000 million of our outstanding NVCC 2.48% subordinated debentures due on June 4, 2025 for 100% of their principal amount plusaccrued interest to, but excluding, the redemption date.
(4) Interest at stated interest rate until earliest par value redemption date, and thereafter at a rate of 2.35% above the 3-month CDOR.(5) Interest at stated interest rate until earliest par value redemption date, and thereafter at a rate of 1.12% above the 3-month CDOR.(6) Interest at stated interest rate until earliest par value redemption date, and thereafter at a rate of 0.98% above the 3-month CDOR.(7) Interest at stated interest rate until earliest par value redemption date, and thereafter at a rate of 0.89% above the 3-month CDOR.(8) Interest at stated interest rate until earliest par value redemption date, and thereafter at a rate of 1.31% above the 3-month CDOR.(9) Interest at a rate of 40 basis points above the 30-day Bankers’ Acceptance rate.(10) Interest at a rate of 25 basis points above the U.S. dollar 3-month London Interbank Mean Rate (LIMEAN). In the event of a reduction of the annual dividend we declare on
our common shares, the interest payable on the debentures is reduced pro rata to the dividend reduction and the interest reduction is payable with the proceeds fromthe sale of newly issued common shares.
All redemptions, cancellations and exchanges of subordinated debentures are subject to the consent and approval of OSFI,except for the debentures maturing July 15, 2022.
Maturity scheduleThe aggregate maturities of subordinated debentures, based on the maturity dates under the terms of issue, are as follows:
As at
(Millions of Canadian dollars)October 31
2020Within 1 year $ –1 to 5 years 3155 to 10 years 9,109Thereafter 455
$ 9,879
Note 20 Equity
Share capitalAuthorized share capitalPreferred – An unlimited number of First Preferred Shares and Second Preferred Shares without nominal or par value, issuable inseries; the aggregate consideration for which all the First Preferred Shares and all the Second Preferred Shares that may beissued may not exceed $20 billion and $5 billion, respectively.
Common – An unlimited number of shares without nominal or par value may be issued.
200 Royal Bank of Canada: Annual Report 2020 Consolidated Financial Statements

Outstanding share capitalThe following table details our common and preferred shares and other equity instruments outstanding.
As at and for the year ended
October 31, 2020 October 31, 2019
(Millions of Canadian dollars, except the numberof shares and as otherwise noted)
Number ofshares
(thousands) Amount
Dividendsdeclared
per share
Number ofshares
(thousands) Amount
Dividendsdeclared
per shareCommon shares issuedBalance at beginning of period 1,430,678 $ 17,645 1,439,029 $ 17,635
Issued in connection with share-basedcompensation plans (1) 1,043 80 1,900 136
Purchased for cancellation (2) (7,860) (97) (10,251) (126)Balance at end of period 1,423,861 $ 17,628 $ 4.29 1,430,678 $ 17,645 $ 4.07Treasury – common sharesBalance at beginning of period (582) $ (58) (235) $ (18)
Purchases (58,775) (4,739) (54,263) (5,380)Sales 57,969 4,668 53,916 5,340
Balance at end of period (1,388) $ (129) (582) $ (58)Common shares outstanding 1,422,473 $ 17,499 1,430,096 $ 17,587Preferred shares and other equity
instruments issuedFirst preferred (3)
Non-cumulative, fixed rateSeries W (4) – $ – $ 1.05 12,000 $ 300 $ 1.23Series AA (4) – – 0.95 12,000 300 1.11Series AC (4) – – 0.98 8,000 200 1.15Series AE (4) – – 0.96 10,000 250 1.13Series AF (4) – – 0.95 8,000 200 1.11Series AG (4) – – 0.96 10,000 250 1.13Series BH 6,000 150 1.23 6,000 150 1.23Series BI 6,000 150 1.23 6,000 150 1.23Series BJ 6,000 150 1.31 6,000 150 1.31
Non-cumulative, 5-Year Rate ResetSeries AZ 20,000 500 0.93 20,000 500 0.96Series BB 20,000 500 0.91 20,000 500 0.96Series BD 24,000 600 0.85 24,000 600 0.90Series BF 12,000 300 0.90 12,000 300 0.90Series BK 29,000 725 1.38 29,000 725 1.38Series BM 30,000 750 1.38 30,000 750 1.38Series BO 14,000 350 1.20 14,000 350 1.27
Non-cumulative, fixed rate/floating rateSeries C-2 (5) 15 23 US$ 67.50 20 31 US$ 67.50
Other equity instrumentsLimited recourse capital notes (LRCNs) (6)
Series 1 (7) 1,750 1,750 4.50% – – –168,765 $ 5,948 227,020 $ 5,706
Treasury – preferred shares and otherequity instruments
Balance at beginning of period (8) 34 $ 1 114 $ 3Purchases (5,319) (114) (8,021) (184)Sales 5,283 110 7,941 182
Balance at end of period (8) (2) $ (3) 34 $ 1Preferred shares and other equity
instruments outstanding 168,763 $ 5,945 227,054 $ 5,707
(1) Includes fair value adjustments to stock options of $9 million (October 31, 2019 – $29 million).(2) During the year ended October 31, 2020, we purchased common shares for cancellation at an average cost of $103.62 per share with a book value of $12.34 per share.
During the year ended October 31, 2019, we purchased common shares for cancellation at an average cost of $100.41 per share with a book value of $12.29 per share.(3) First Preferred Shares were issued at $25 per share with the exception of Non-Cumulative Fixed Rate/Floating Rate First Preferred Shares Series C-2 (Series C-2) which
were issued at US$1,000 per share (equivalent to US$25 per depositary share).(4) On October 1, 2020, we redeemed all 12 million issued and outstanding Non-Cumulative First Preferred Shares Series W, all 12 million issued and outstanding
Non-Cumulative First Preferred Shares Series AA, all 8 million issued and outstanding Non-Cumulative First Preferred Shares Series AC, all 10 million issued andoutstanding Non-Cumulative First Preferred Shares Series AE, all 8 million issued and outstanding Non-Cumulative First Preferred Shares Series AF, and all 10 millionissued and outstanding Non-Cumulative First Preferred Shares Series AG, for cash at a redemption price of $25 per share.
(5) On December 17, 2019, we purchased for cash 200 thousand depositary shares, each representing a one-fortieth interest in a share of Series C-2, for aggregate totalconsideration, including accrued dividends, of US$6 million. The purchased depositary and underlying Series C-2 were subsequently cancelled.
(6) Each series of LRCNs (LRCN Series) were issued at a $1,000 per note. The number of shares represent the number of notes issued and the dividends declared per sharerepresent the annual interest rate percentage applicable to the notes issued as at the reporting date.
(7) On July 28, 2020, we issued $1,750 million of LRCN Series 1 with recourse limited to assets held by a third party trustee in a consolidated trust. The trust assets in respect ofLRCN Series 1 consist of $1,750 million of our Non-Cumulative 5-Year Rate Reset First Preferred Shares Series BQ (Series BQ) issued concurrently with LRCN Series 1 at aprice of $1,000 per Series BQ.
(8) Positive amounts represent a short position in treasury instruments.
Consolidated Financial Statements Royal Bank of Canada: Annual Report 2020 201

Note 20 Equity (continued)
Significant terms and conditions of preferred shares and other equity instruments
As at October 31, 2020Current
annual yield Premium
Currentdividend
per share (1)
Earliestredemption
date (2) Issue dateRedemptionprice (2), (3)
Preferred sharesFirst preferred
Non-cumulative, fixed rateSeries BH (4) 4.90% $ .306250 November 24, 2020 June 5, 2015 $ 26.00Series BI (4) 4.90% .306250 November 24, 2020 July 22, 2015 26.00Series BJ (4) 5.25% .328125 February 24, 2021 October 2, 2015 26.00
Non-cumulative, 5-YearRate Reset (5)Series AZ (4) 3.70% 2.21% .231250 May 24, 2019 January 30, 2014 25.00Series BB (4) 3.65% 2.26% .228125 August 24, 2019 June 3, 2014 25.00Series BD (4) 3.20% 2.74% .200000 May 24, 2020 January 30, 2015 25.00Series BF (4) 3.60% 2.62% .225000 November 24, 2020 March 13, 2015 25.00Series BK (4) 5.50% 4.53% .343750 May 24, 2021 December 16, 2015 25.00Series BM (4) 5.50% 4.80% .343750 August 24, 2021 March 7, 2016 25.00Series BO (4) 4.80% 2.38% .300000 February 24, 2024 November 2, 2018 25.00
Non-cumulative, fixed rate/floating rateSeries C-2 (6) 6.75% 4.052% US$16.875000 November 7, 2023 November 2, 2015 US$1,000.00
Other equity instrumentsLimited recourse capital notes (7)
Series 1 (8) 4.50% 4.137% n.a. October 24, 2025 July 28, 2020 $1,000.00
(1) Non-cumulative preferential dividends of each Series are payable quarterly, as and when declared by the Board of Directors, on or about the 24th day (7th day forSeries C-2) of February, May, August and November.
(2) Subject to the consent of OSFI and the requirements of the Bank Act (Canada), we may, on or after the dates specified above, redeem First Preferred Shares. In the caseof Series AZ, BB, BD, BF, BK, BM, and BO, these may be redeemed for cash at a price per share of $25 if redeemed on the earliest redemption date and on the same dateevery fifth year thereafter. In the case of BH, BI and BJ, these may be redeemed for cash at a price per share of $26 if redeemed during the 12 months commencing on theearliest redemption date and decreasing by $0.25 each 12-month period thereafter to a price per share of $25 if redeemed four years from the earliest redemption date orthereafter. Series C-2 may be redeemed at a price of US$1,000 on the earliest redemption date and any dividend payment date thereafter.
(3) Subject to the consent of OSFI and the requirements of the Bank Act (Canada), we may purchase the First Preferred Shares of each Series for cancellation at the lowestprice or prices at which, in the opinion of the Board of Directors, such shares are obtainable.
(4) The preferred shares include NVCC provisions, necessary for the shares to qualify as Tier 1 regulatory capital under Basel III. NVCC provisions require the conversion ofthe instrument into a variable number of common shares in the event that OSFI deems the Bank non-viable or a federal or provincial government in Canada publiclyannounces that the Bank has accepted or agreed to accept a capital injection. In such an event, each preferred share is convertible into common shares pursuant to anautomatic conversion formula with a multiplier of 1 and with a conversion price based on the greater of: (i) a floor price of $5 and (ii) the current market price of ourcommon shares based on the volume weighted average trading price of our common shares on the Toronto Stock Exchange. The number of shares issued is determinedby dividing the preferred share value ($25 plus declared and unpaid dividends) by the conversion price.
(5) The dividend rate will reset on the earliest redemption date and every fifth year thereafter at a rate equal to the 5-year Government of Canada bond yield plus thepremium indicated. The holders have the option to convert their shares into Non-Cumulative floating rate First Preferred Shares subject to certain conditions on theearliest redemption date and every fifth year thereafter at a rate equal to the three-month Government of Canada Treasury Bill rate plus the premium indicated.
(6) The dividend rate will change on the earliest redemption date at a rate equal to the 3-month LIBOR plus the premium indicated. Series C-2 do not qualify as Tier 1regulatory capital.
(7) The current annual yield on each LRCN Series represents the annual interest rate applicable to the notes issued as at the reporting date. The payments of interest andprincipal in cash on the LRCN Series are made at our discretion, and non-payment of interest and principal in cash does not constitute an event of default. In the event of(i) non-payment of interest on any interest payment date, (ii) non-payment of the redemption price in case of a redemption of a LRCN Series, (iii) non-payment ofprincipal at the maturity of a LRCN Series, or (iv) an event of default on a LRCN Series, holders of such LRCN Series will have recourse only to the assets (Trust Assets)held by a third party trustee in a consolidated trust in respect of such LRCN Series and each such noteholder will be entitled to receive its pro rata share of the TrustAssets. In such an event, the delivery of the Trust Assets for each LRCN Series will represent the full and complete extinguishment of our obligations under the relatedLRCN Series. The LRCNs include NVCC provisions, necessary for the shares to qualify as Tier 1 regulatory capital under Basel III. NVCC provisions require the conversionof the instrument into a variable number of common shares in the event that OSFI deems the Bank non-viable or a federal or provincial government in Canada publiclyannounces that the Bank has accepted or agreed to accept a capital injection. In such an event, each note is automatically redeemed and the redemption price will besatisfied by the delivery of Trust Assets, which will consist of common shares pursuant to an automatic conversion of the series of preferred shares that were issuedconcurrently with the related LRCN Series. Each series of preferred shares include an automatic conversion formula with a conversion price based on the greater of: (i) afloor price of $5 and (ii) the current market price of our common shares based on the volume weighted average trading price of our common shares on the Toronto StockExchange. The number of common shares issued in respect of each series of preferred shares will be determined by dividing the preferred share value ($1,000 plusdeclared and unpaid dividends) by the conversion price. The number of common shares delivered to each noteholder will be based on such noteholder’s pro rata interestin the Trust Assets. Subject to the consent of OSFI, we may purchase LRCNs for cancellation at such price or prices and upon such terms and conditions as we in ourabsolute discretion may determine, subject to any applicable law restricting the purchase of notes.
(8) LRCN Series 1 bear interest at a fixed rate of 4.5% per annum until November 24, 2025, and thereafter at a rate per annum, reset every fifth year, equal to the 5-YearGovernment of Canada Yield plus 4.137% until maturity on November 24, 2080. The interest is paid semi-annually on or about the 24th day of November and May. LRCNSeries 1 is redeemable during the period from October 24 to and including November 24, commencing in 2025 and every fifth year thereafter to the extent we redeemSeries BQ pursuant to their terms and subject to the consent of OSFI and requirements of the Bank Act (Canada).
n.a. not applicable
Restrictions on the payment of dividendsWe are prohibited by the Bank Act (Canada) from declaring any dividends on our preferred or common shares when we are, orwould be placed as a result of the declaration, in contravention of the capital adequacy and liquidity regulations or anyregulatory directives issued under the Act. We may not pay dividends on our common shares at any time unless all dividends towhich preferred shareholders are then entitled have been declared and paid or set apart for payment.
Currently, these limitations do not restrict the payment of dividends on our preferred or common shares.
Dividend reinvestment planOur dividend reinvestment plan (DRIP) provides common and preferred shareholders with a means to receive additionalcommon shares rather than cash dividends. The plan is only open to shareholders residing in Canada or the United States. Therequirements of our DRIP are satisfied through either open market share purchases or shares issued from treasury. During 2020and 2019, the requirements of our DRIP were satisfied through open market share purchases.
202 Royal Bank of Canada: Annual Report 2020 Consolidated Financial Statements

Shares available for future issuancesAs at October 31, 2020, 42.9 million common shares are available for future issue relating to our DRIP and potential exercise ofstock options and awards outstanding. In addition, we may issue up to 38.9 million common shares from treasury under the RBCUmbrella Savings and Securities Purchase Plan that was approved by shareholders on February 26, 2009.
Note 21 Share-based compensation
Stock option plansWe have stock option plans for certain key employees. Under the plans, options are periodically granted to purchase commonshares. The exercise price for the majority of the grants is determined as the higher of the volume-weighted average of thetrading prices per board lot (100 shares) of our common shares on the Toronto Stock Exchange (i) on the day preceding the dayof grant; and (ii) the five consecutive trading days immediately preceding the day of grant. The exercise price for the remaininggrants is the closing market share price of our common shares on the New York Stock Exchange on the date of grant. All optionsvest over a four-year period, and are exercisable for a period not exceeding 10 years from the grant date.
The compensation expense recorded for the year ended October 31, 2020, in respect of the stock option plans was $7 million(October 31, 2019 – $6 million). The compensation expense related to non-vested options was $2 million at October 31, 2020(October 31, 2019 – $3 million), to be recognized over the weighted average period of 1.9 years (October 31, 2019 – 1.8 years).
Analysis of the movement in the number and weighted average exercise price of options is set out below:
A summary of our stock option activity and related informationFor the year ended
October 31, 2020 October 31, 2019
(Canadian dollars per share except share amounts)
Number ofoptions
(thousands)
Weightedaverage
exercise price (1)
Number ofoptions
(thousands)
Weightedaverage
exercise price (1)
Outstanding at beginning of period 6,950 $ 79.88 7,770 $ 71.40Granted 1,089 103.64 1,090 96.55Exercised (2), (3) (1,044) 65.39 (1,900) 55.05Forfeited in the period (22) 50.28 (10) 54.99
Outstanding at end of period 6,973 $ 86.02 6,950 $ 79.88
Exercisable at end of period 3,314 $ 71.77 2,980 $ 64.24
(1) The weighted average exercise prices reflect the conversion of foreign currency-denominated options at the exchange rates as of October 31, 2020 and October 31, 2019.For foreign currency-denominated options exercised during the year, the weighted average exercise prices are translated using exchange rates as at the settlement date.
(2) Cash received for options exercised during the year was $68 million (October 31, 2019 – $105 million) and the weighted average share price at the date of exercise was$100.20 (October 31, 2019 – $103.15).
(3) New shares were issued for all stock options exercised in 2020 and 2019.
Options outstanding as at October 31, 2020 by range of exercise price
Options outstanding Options exercisable
(Canadian dollars per share exceptshare amounts and years)
Numberoutstanding(thousands)
Weightedaverage
exercise price (1)
Weightedaverage
remainingcontractuallife (years)
Numberexercisable(thousands)
Weightedaverage
exercise price (1)
$36.89 – $69.17 1,112 $ 55.07 2.16 1,112 $ 55.07$73.14 – $74.39 880 74.30 4.98 880 74.30$76.51 – $78.59 653 77.85 4.19 653 77.85$90.23 – $96.55 2,477 93.01 6.68 669 90.23$102.33 – $104.70 1,851 103.71 8.17 – –
6,973 $ 86.02 5.90 3,314 $ 71.77
(1) The weighted average exercise prices reflect the conversion of foreign currency-denominated options at the exchange rate as of October 31, 2020.
The weighted average fair value of options granted during the year ended October 31, 2020 was estimated at $6.08 (October 31,2019 – $5.61). This was determined by applying the Black-Scholes model on the date of grant, taking into account the specificterms and conditions under which the options are granted, such as the vesting period and expected share price volatilityestimated by considering the historic average share price volatility over a historical period corresponding to the expected optionlife. The following assumptions were used to determine the fair value of options granted:
Weighted average assumptionsFor the year ended
(Canadian dollars per share except percentages and years)October 31
2020October 31
2019Share price at grant date $ 104.80 $ 94.09Risk-free interest rate 1.64% 2.01%Expected dividend yield 3.90% 3.77%Expected share price volatility 13% 12%Expected life of option 6 Years 6 Years
Consolidated Financial Statements Royal Bank of Canada: Annual Report 2020 203

Note 21 Share-based compensation (continued)
Employee savings and share ownership plansWe offer many employees an opportunity to own our common shares through savings and share ownership plans. Under theseplans, the employees can generally contribute between 1% and 10% of their annual salary or benefit base for commission-basedemployees. For each contribution between 1% and 6%, we will match 50% of the employee contributions in our common shares.For the RBC Dominion Securities Savings Plan, our maximum annual contribution is $4,500 per employee. For the RBC U.K. ShareIncentive Plan, our maximum annual contribution is £1,500 per employee. For the year ended October 31, 2020, we contributed$116 million (October 31, 2019 – $112 million), under the terms of these plans, towards the purchase of our common shares. As atOctober 31, 2020, an aggregate of 36 million common shares were held under these plans (October 31, 2019 – 35 million commonshares).
Deferred share and other plansWe offer deferred share unit plans to executives, certain key employees and non-employee directors of the Bank. Under theseplans, participants may choose to receive all or a percentage of their annual variable short-term incentive bonus, commission, ordirectors’ fee in the form of deferred share units (DSUs). The participants must elect to participate in the plan prior to thebeginning of the year. DSUs earn dividend equivalents in the form of additional DSUs at the same rate as dividends on commonshares. The participant is not allowed to convert the DSUs until retirement or termination of employment/directorship. The cashvalue of the DSUs is equivalent to the market value of common shares when conversion takes place.
We also offer unit awards for certain key employees within Capital Markets. The bonus is invested as RBC share units and aspecified percentage vests on a specified number of anniversary dates each year. Each vested amount is paid in cash and isbased on the original number of share units granted plus accumulated dividends, valued using the average closing price of RBCcommon shares during the five trading days immediately preceding the vesting date.
We offer performance deferred share award plans to certain key employees, all of which vest at the end of three years. Uponvesting, the award is paid in cash and is based on the original number of RBC share units granted plus accumulated dividendsvalued using the average closing price of RBC common shares during the five trading days immediately preceding the vestingdate. A portion of the award under certain plans may be increased or decreased up to 25%, depending on our total shareholderreturn compared to a defined peer group of global financial institutions.
We maintain non-qualified deferred compensation plans for certain key employees in the United States. These plans alloweligible employees to defer a portion of their annual income and a variety of productivity and recruitment bonuses and allocatethe deferrals among specified fund choices, including a RBC Share Accounted fund that tracks the value of our common shares.
The following table presents the units granted under the deferred share and other plans for the year.
Units granted under deferred share and other plansFor the year ended
October 31, 2020 October 31, 2019
(Units and per unit amounts)
Unitsgranted
(thousands)
Weightedaverage
fair valueper unit
Unitsgranted
(thousands)
Weightedaverage
fair valueper unit
Deferred share unit plans 503 $ 98.91 495 $ 99.69Capital Markets compensation plan unit awards 4,796 92.06 3,423 105.12Performance deferred share award plans 2,409 104.14 2,471 96.39Deferred compensation plans 92 103.49 116 94.06Other share-based plans 759 100.55 1,210 96.28
8,559 $ 96.74 7,715 $ 100.42
Our liabilities for the awards granted under the deferred share and other plans are measured at fair value, determined based onthe quoted market price of our common shares and specified fund choices as applicable. Annually, our obligation is increased byadditional units earned by plan participants, and is reduced by forfeitures, cancellations, and the settlement of vested units. Inaddition, our obligation is impacted by fluctuations in the market price of our common shares and specified fund units. Forperformance deferred share award plans, the estimated outcome of meeting the performance conditions also impacts ourobligation.
The following tables present the units that have been earned by the participants, our obligations for these earned unitsunder the deferred share and other plans, and the related compensation expenses (recoveries) recognized for the year.
Obligations under deferred share and other plansAs at
October 31, 2020 October 31, 2019
(Millions of Canadian dollars except units)Units
(thousands)Carryingamount
Units(thousands)
Carryingamount
Deferred share unit plans 5,221 $ 486 5,288 $ 562Capital Markets compensation plan unit awards 9,560 874 8,820 937Performance deferred share award plans 5,860 550 5,621 597Deferred compensation plans (1) 2,685 250 3,072 326Other share-based plans 1,828 167 1,787 185
25,154 $ 2,327 24,588 $ 2,607
(1) Excludes obligations not determined based on the quoted market price of our common shares.
204 Royal Bank of Canada: Annual Report 2020 Consolidated Financial Statements

Compensation expenses recognized under deferred share and other plansFor the year ended
(Millions of Canadian dollars)October 31
2020October 31
2019Deferred share unit plans $ (48) $ 77Capital Markets compensation plan unit awards 115 274Performance deferred share award plans 190 294Deferred compensation plans 137 250Other share-based plans 60 106
$ 454 $ 1,001
Note 22 Income taxes
Components of tax expenseFor the year ended
(Millions of Canadian dollars)October 31
2020October 31
2019Income taxes (recoveries) in Consolidated Statements of IncomeCurrent tax
Tax expense for current year $ 3,673 $ 3,256Adjustments for prior years (106) (26)Recoveries arising from previously unrecognized tax loss, tax credit or temporary difference
of a prior period (25) (31)
3,542 3,199
Deferred taxOrigination and reversal of temporary difference (655) (114)Effects of changes in tax rates 6 29Adjustments for prior years 98 (57)Recoveries arising from previously unrecognized tax loss, tax credit or temporary difference of a prior
period, net (39) (14)
(590) (156)
2,952 3,043
Income taxes (recoveries) in Consolidated Statements of Comprehensive Income and Changesin EquityOther comprehensive income
Net unrealized gains (losses) on debt securities and loans at fair value through other comprehensiveincome 43 51
Provision for credit losses recognized in income 3 –Reclassification of net losses (gains) on debt securities and loans at fair value through other
comprehensive income to income (56) (60)Unrealized foreign currency translation gains (losses) 5 2Net foreign currency translation gains (losses) from hedging activities (138) 2Reclassification of losses (gains) on net investment hedging activities to income 7 1Net gains (losses) on derivatives designated as cash flow hedges (410) (200)Reclassification of losses (gains) on derivatives designated as cash flow hedges to income 27 (50)Remeasurements of employee benefit plans (20) (333)Net fair value change due to credit risk on financial liabilities designated at fair value through profit
or loss (93) 18Net gains (losses) on equity securities designated at fair value through other comprehensive income 6 5
Share-based compensation awards 7 (9)
Distributions on other equity instruments and issuance costs (12) –
(631) (573)
Total income taxes $ 2,321 $ 2,470
Consolidated Financial Statements Royal Bank of Canada: Annual Report 2020 205
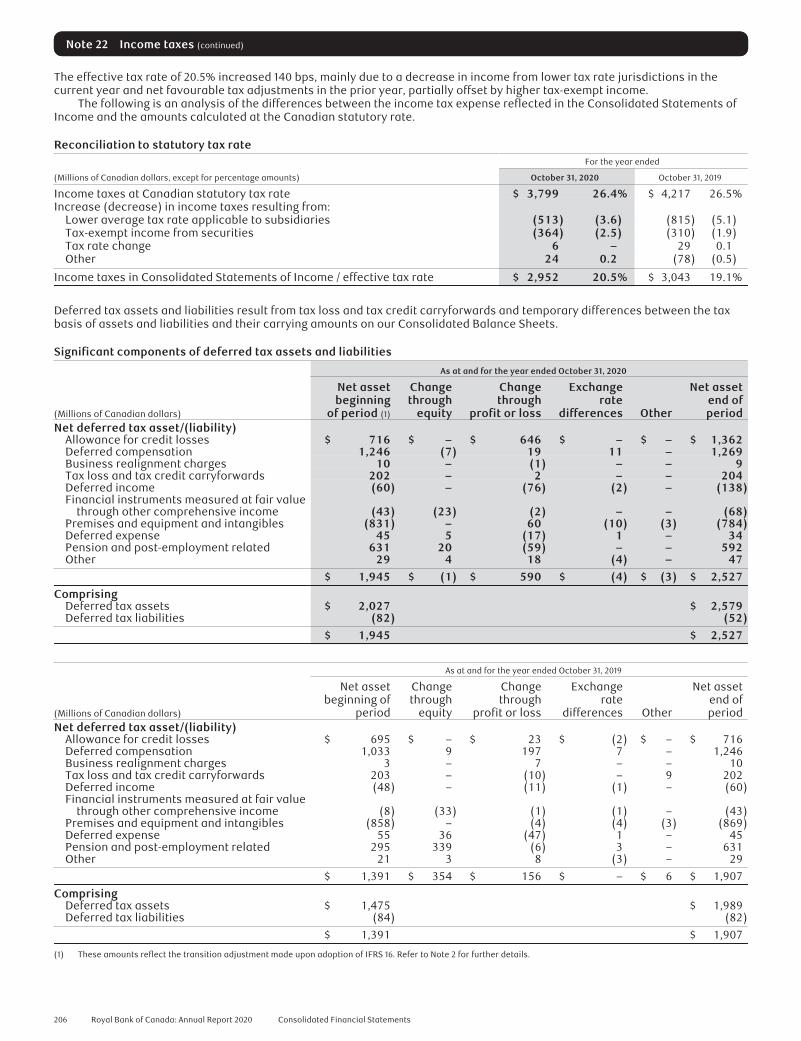
Note 22 Income taxes (continued)
The effective tax rate of 20.5% increased 140 bps, mainly due to a decrease in income from lower tax rate jurisdictions in thecurrent year and net favourable tax adjustments in the prior year, partially offset by higher tax-exempt income.
The following is an analysis of the differences between the income tax expense reflected in the Consolidated Statements ofIncome and the amounts calculated at the Canadian statutory rate.
Reconciliation to statutory tax rateFor the year ended
(Millions of Canadian dollars, except for percentage amounts) October 31, 2020 October 31, 2019
Income taxes at Canadian statutory tax rate $ 3,799 26.4% $ 4,217 26.5%Increase (decrease) in income taxes resulting from:
Lower average tax rate applicable to subsidiaries (513) (3.6) (815) (5.1)Tax-exempt income from securities (364) (2.5) (310) (1.9)Tax rate change 6 – 29 0.1Other 24 0.2 (78) (0.5)
Income taxes in Consolidated Statements of Income / effective tax rate $ 2,952 20.5% $ 3,043 19.1%
Deferred tax assets and liabilities result from tax loss and tax credit carryforwards and temporary differences between the taxbasis of assets and liabilities and their carrying amounts on our Consolidated Balance Sheets.
Significant components of deferred tax assets and liabilities
As at and for the year ended October 31, 2020
(Millions of Canadian dollars)
Net assetbeginning
of period (1)
Changethrough
equity
Changethrough
profit or loss
Exchangerate
differences Other
Net assetend ofperiod
Net deferred tax asset/(liability)Allowance for credit losses $ 716 $ – $ 646 $ – $ – $ 1,362Deferred compensation 1,246 (7) 19 11 – 1,269Business realignment charges 10 – (1) – – 9Tax loss and tax credit carryforwards 202 – 2 – – 204Deferred income (60) – (76) (2) – (138)Financial instruments measured at fair value
through other comprehensive income (43) (23) (2) – – (68)Premises and equipment and intangibles (831) – 60 (10) (3) (784)Deferred expense 45 5 (17) 1 – 34Pension and post-employment related 631 20 (59) – – 592Other 29 4 18 (4) – 47
$ 1,945 $ (1) $ 590 $ (4) $ (3) $ 2,527Comprising
Deferred tax assets $ 2,027 $ 2,579Deferred tax liabilities (82) (52)
$ 1,945 $ 2,527
As at and for the year ended October 31, 2019
(Millions of Canadian dollars)
Net assetbeginning of
period
Changethrough
equity
Changethrough
profit or loss
Exchangerate
differences Other
Net assetend ofperiod
Net deferred tax asset/(liability)Allowance for credit losses $ 695 $ – $ 23 $ (2) $ – $ 716Deferred compensation 1,033 9 197 7 – 1,246Business realignment charges 3 – 7 – – 10Tax loss and tax credit carryforwards 203 – (10) – 9 202Deferred income (48) – (11) (1) – (60)Financial instruments measured at fair value
through other comprehensive income (8) (33) (1) (1) – (43)Premises and equipment and intangibles (858) – (4) (4) (3) (869)Deferred expense 55 36 (47) 1 – 45Pension and post-employment related 295 339 (6) 3 – 631Other 21 3 8 (3) – 29
$ 1,391 $ 354 $ 156 $ – $ 6 $ 1,907
ComprisingDeferred tax assets $ 1,475 $ 1,989Deferred tax liabilities (84) (82)
$ 1,391 $ 1,907
(1) These amounts reflect the transition adjustment made upon adoption of IFRS 16. Refer to Note 2 for further details.
206 Royal Bank of Canada: Annual Report 2020 Consolidated Financial Statements

The tax loss and tax credit carryforwards amount of deferred tax assets primarily relates to losses and tax credits in our Canadian,U.S., and Caribbean operations. Deferred tax assets of $204 million were recognized at October 31, 2020 (October 31, 2019 – $202million) in respect of tax losses and tax credits incurred in current or preceding years for which recognition is dependent on theprojection of future taxable profits. Management’s forecasts support the assumption that it is probable that the results of futureoperations will generate sufficient taxable income to utilize the deferred tax assets. The forecasts rely on continued liquidity andcapital support to our business operations, including tax planning strategies implemented in relation to such support.
As at October 31, 2020, unused tax losses and tax credits of $389 million and $305 million (October 31, 2019 – $413 million and$365 million) available to be offset against potential tax adjustments or future taxable income were not recognized as deferredtax assets. This amount includes unused tax losses of $nil which expire within one year (October 31, 2019 – $1 million), $10 millionwhich expire in two to four years (October 31, 2019 – $7 million) and $379 million which expire after four years (October 31, 2019 –$405 million). There are no tax credits that will expire in one year (October 31, 2019 – $nil), $143 million that will expire in two tofour years (October 31, 2019 – $60 million) and $162 million that will expire after four years (October 31, 2019 – $305 million).
The amount of temporary differences associated with investments in subsidiaries, branches and associates and interests injoint ventures for which deferred tax liabilities have not been recognized in the parent bank is $21.7 billion as at October 31, 2020(October 31, 2019 – $17.9 billion).
Tax examinations and assessmentsDuring the year, we received proposal letters (the Proposals) from the Canada Revenue Agency (CRA), in respect of the 2015taxation year, which suggest that Royal Bank of Canada owes additional taxes of approximately $337 million as they denied thedeductibility of certain dividends. The Proposals are consistent with the reassessments received for taxation years 2012 to 2014of approximately $756 million of additional income taxes and the reassessments received for taxation years 2009 to 2011 ofapproximately $434 million of additional income taxes and interest in respect of the same matter. These amounts represent themaximum additional taxes owing for those years.
Legislative amendments introduced in the 2015 Canadian Federal Budget resulted in disallowed deduction of dividends fromtransactions with Taxable Canadian Corporations including those hedged with Tax Indifferent Investors, namely pension fundsand non-resident entities with prospective application effective May 1, 2017. The dividends to which the Proposals andreassessments relate include both dividends in transactions similar to those which are the target of the 2015 legislativeamendments and dividends which are unrelated to the legislative amendments.
It is possible that the CRA will reassess us for significant additional income tax for subsequent years on the same basis. In allcases, we are confident that our tax filing position was appropriate and intend to defend ourselves vigorously.
Note 23 Earnings per share
For the year ended
(Millions of Canadian dollars, except share and per share amounts)
October 31
2020October 31
2019Basic earnings per share
Net income $ 11,437 $ 12,871Dividends on preferred shares and distributions on other equity instruments (268) (269)Net income attributable to non-controlling interests (5) (11)
Net income available to common shareholders 11,164 12,591
Weighted average number of common shares (in thousands) 1,423,915 1,434,779Basic earnings per share (in dollars) $ 7.84 $ 8.78
Diluted earnings per shareNet income available to common shareholders $ 11,164 $ 12,591Dilutive impact of exchangeable shares 13 15
Net income available to common shareholders including dilutive impact of exchangeableshares 11,177 12,606
Weighted average number of common shares (in thousands) 1,423,915 1,434,779Stock options (1) 1,054 2,011Issuable under other share-based compensation plans 755 742Exchangeable shares (2) 3,046 3,150
Average number of diluted common shares (in thousands) 1,428,770 1,440,682Diluted earnings per share (in dollars) $ 7.82 $ 8.75
(1) The dilutive effect of stock options was calculated using the treasury stock method. When the exercise price of options outstanding is greater than the average marketprice of our common shares, the options are excluded from the calculation of diluted earnings per share. For the year ended October 31, 2020, an average of 2,809,041outstanding options with an average exercise price of $100.88 were excluded from the calculation of diluted earnings per share. For the year ended October 31, 2019, anaverage of 767,225 outstanding options with an average exercise price of $102.33 were excluded from the calculation of diluted earnings per share.
(2) Includes exchangeable preferred shares.
Consolidated Financial Statements Royal Bank of Canada: Annual Report 2020 207

Note 24 Guarantees, commitments, pledged assets and contingencies
Guarantees and commitmentsWe use guarantees and other off-balance sheet credit instruments to meet the financing needs of our clients.
The table below summarizes our maximum exposure to credit losses related to our guarantees and commitments providedto third parties. The maximum exposure to credit risk relating to a guarantee is the maximum risk of loss if there was a totaldefault by the guaranteed parties, without consideration of possible recoveries under recourse provisions, insurance policies orfrom collateral held or pledged. The maximum exposure to credit risk relating to a commitment to extend credit is the full amountof the commitment. In both cases, the maximum risk exposure is significantly greater than the amount recognized as a liability inour Consolidated Balance Sheets.
Maximum exposureto credit losses
As at
(Millions of Canadian dollars)
October 31
2020October 31
2019Financial guarantees
Financial standby letters of credit $ 17,141 $ 16,608Commitments to extend credit
Backstop liquidity facilities 40,212 36,305Credit enhancements 2,664 1,692Documentary and commercial letters of credit 286 268Other commitments to extend credit 239,077 225,911
Other credit-related commitmentsSecurities lending indemnifications 77,953 91,625Performance guarantees 7,040 7,061Sponsored member guarantees 1,302 –Other 1,030 787
Our credit review process, our policy for requiring collateral security, and the types of collateral security held are generally thesame for guarantees and commitments as for loans. Our clients generally have the right to request settlement of, or draw on, ourguarantees and commitments within one year. However, certain guarantees can only be drawn if specified conditions are met.These conditions, along with collateral requirements, are described below. We believe that it is highly unlikely that all orsubstantially all of the guarantees and commitments will be drawn or settled within one year, and contracts may expire withoutbeing drawn or settled.
Financial guaranteesFinancial standby letters of creditFinancial standby letters of credit represent irrevocable assurances that we will make payments in the event that a client cannotmeet its payment obligations to the third party. For certain guarantees, the guaranteed party can request payment from us eventhough the client has not defaulted on its obligations. The term of these guarantees generally have a term of five to seven years.
Our policy for requiring collateral security with respect to these instruments and the types of collateral security held isgenerally the same as for loans. When collateral security is taken, it is determined on an account-by-account basis according tothe risk of the borrower and the specifics of the transaction. Collateral security may include cash, securities and other assetspledged.
Commitments to extend creditBackstop liquidity facilitiesBackstop liquidity facilities are provided to ABCP conduit programs administered by us and third parties as an alternative sourceof financing in the event that such programs are unable to access commercial paper markets, or in limited circumstances, whenpredetermined performance measures of the financial assets owned by these programs are not met. The average remaining termof these liquidity facilities is approximately four years.
The terms of the backstop liquidity facilities do not require us to advance money to these programs in the event ofbankruptcy or insolvency and generally do not require us to purchase non-performing or defaulted assets.
Credit enhancementsWe provide partial credit enhancement to multi-seller ABCP programs administered by us to protect commercial paper investorsin the event that the collections on the underlying assets together with the transaction-specific credit enhancements or theliquidity facilities prove to be insufficient to pay for maturing commercial paper. Each of the asset pools is structured to achievea high investment-grade credit profile through credit enhancements from us and other third parties related to each transaction.The average remaining term of these credit facilities is approximately three years.
Documentary and commercial letters of creditDocumentary and commercial letters of credit, which are written undertakings by us on behalf of a client authorizing a third partyto draw drafts on us up to a stipulated amount under specific terms and conditions, where some are collateralized based on theunderlying agreement with the client and others are collateralized by cash deposits or other assets of the third party which mayinclude the underlying shipment of goods to which they relate.
Other commitments to extend creditCommitments to extend credit represent unused portions of authorizations to extend credit in the form of loans, reverserepurchase agreements, bankers’ acceptances or letters of credit where we do not have the ability to unilaterally withdraw thecredit extended to the borrower.
208 Royal Bank of Canada: Annual Report 2020 Consolidated Financial Statements

Other credit-related commitmentsSecurities lending indemnificationsIn securities lending transactions, we act as an agent for the owner of a security, who agrees to lend the security to a borrowerfor a fee, under the terms of a pre-arranged contract. The borrower must fully collateralize the security loaned at all times. Aspart of this custodial business, an indemnification may be provided to securities lending customers to ensure that the fair valueof securities loaned will be returned in the event that the borrower fails to return the borrowed securities and the collateral heldis insufficient to cover the fair value of those securities. These indemnifications normally terminate without being drawn upon.The term of these indemnifications varies, as the securities loaned are recallable on demand. Collateral held for our securitieslending transactions typically includes cash, securities that are issued or guaranteed by the Canadian government, U.S.government or other OECD countries or high quality debt or equity instruments.
Performance guaranteesPerformance guarantees represent irrevocable assurances that we will make payments to third-party beneficiaries in the eventthat a client fails to perform under a specified non-financial contractual obligation. Such obligations typically include works andservice contracts, performance bonds, and warranties related to international trade. The term of these guarantees can range upto three to seven years.
Our policy for requiring collateral security with respect to these instruments and the types of collateral security held isgenerally the same as for loans. When collateral security is taken, it is determined on an account-by-account basis according tothe risk of the borrower and the specifics of the transaction. Collateral security may include cash, securities and other assetspledged.
Sponsored member guaranteesFor certain overnight repurchase and reverse repurchase transactions, we act as a sponsoring member to eligible clients to cleartransactions through the Fixed Income Clearing Corporation (FICC). We also provide a guarantee to FICC for the prompt and fullpayment and performance of our sponsored member clients’ respective obligations under the FICC rules. The guarantees arefully collateralized by cash and securities issued or guaranteed by the U.S. government.
IndemnificationsIn the normal course of our operations, we provide indemnifications which are often standard contractual terms tocounterparties in transactions such as purchase and sale contracts, fiduciary, agency, licensing, custodial and serviceagreements, clearing system arrangements, participation as a member of exchanges, director/officer contracts and leasingtransactions. These indemnification agreements may require us to compensate the counterparties for costs incurred as a resultof changes in laws and regulations (including tax legislation) or as a result of litigation claims or statutory sanctions that may besuffered by the counterparty as a consequence of the transaction. The terms of these indemnification agreements vary based onthe contract. The nature of the indemnification agreements prevents us from making a reasonable estimate of the maximumpotential amount we could be required to pay to counterparties. Historically, we have not made any significant payments undersuch indemnifications.
Uncommitted amountsUncommitted amounts represent undrawn credit facilities for which we have the ability to unilaterally withdraw the creditextended to the borrower at any time. These include both retail and commercial commitments. As at October 31, 2020, the totalbalance of uncommitted amounts was $317 billion (October 31, 2019 – $287 billion).
Other commitmentsWe invest in private companies, directly or through third-party investment funds, including Small Business InvestmentCompanies, real estate funds and Low Income Housing Tax Credit funds. These funds are generally structured as closed-endlimited partnerships wherein we hold a limited partner interest. For the year ended October 31, 2020, we have unfundedcommitments of $882 million (October 31, 2019 – $684 million) representing the aggregate amount of cash we are obligated tocontribute as capital to these partnerships under the terms of the relevant contracts.
Pledged assets and collateralIn the ordinary course of business, we pledge assets and enter into collateral agreements with terms and conditions that areusual and customary to our regular lending, borrowing and trading activities recorded on our Consolidated Balance Sheets. Thefollowing are examples of our general terms and conditions on pledged assets and collateral:
• The risks and rewards of the pledged assets reside with the pledgor.• The pledged asset is returned to the pledgor when the necessary conditions have been satisfied.• The right of the pledgee to sell or re-pledge the asset is dependent on the specific agreement under which the collateral
is pledged.• If there is no default, the pledgee must return the comparable asset to the pledgor upon satisfaction of the obligation.
We are also required to provide intraday pledges to the Bank of Canada when we use the Large Value Transfer System (LVTS),which is a real-time electronic wire transfer system that continuously processes all Canadian dollar large-value or time-criticalpayments throughout the day. The pledged assets earmarked for LVTS activities are normally released back to us at the end ofthe settlement cycle each day. Therefore, the pledged assets amount is not included in the table below. For the year endedOctober 31, 2020, we had on average $3.4 billion of assets pledged intraday to the Bank of Canada on a daily basis (October 31,2019 – $4.9 billion). There are infrequent occasions where we are required to take an overnight advance from the Bank of Canadato cover a settlement requirement, in which case an equivalent value of the pledged assets would be used to secure the advance.There were no overnight advances taken on October 31, 2020 and October 31, 2019.
Consolidated Financial Statements Royal Bank of Canada: Annual Report 2020 209

Note 24 Guarantees, commitments, pledged assets and contingencies (continued)
Assets pledged against liabilities and collateral assets held or re-pledged
As at
(Millions of Canadian dollars)
October 31
2020October 31
2019Sources of pledged assets and collateralBank assets
Loans $ 99,302 $ 80,542Securities 59,479 55,544Other assets 27,934 21,316
186,715 157,402
Client assets (1)
Collateral received and available for sale or re-pledging 438,686 448,338Less: not sold or re-pledged (37,879) (49,325)
400,807 399,013
$ 587,522 $ 556,415
Uses of pledged assets and collateralSecurities borrowing and lending $ 127,852 $ 146,590Obligations related to securities sold short 36,647 34,686Obligations related to securities lent or sold under repurchase agreements 252,425 229,905Securitization 45,440 47,254Covered bonds 62,131 42,103Derivative transactions 35,044 26,448Foreign governments and central banks 6,456 5,963Clearing systems, payment systems and depositories 6,380 4,804Other 15,147 18,662
$ 587,522 $ 556,415
(1) Primarily relates to Obligations related to securities lent or sold under repurchase agreements, Securities lent and Derivative transactions.
Note 25 Legal and regulatory matters
We are a large global institution that is subject to many different complex legal and regulatory requirements that continue toevolve. We are and have been subject to a variety of legal proceedings, including civil claims and lawsuits, regulatoryexaminations, investigations, audits and requests for information by various governmental regulatory agencies and lawenforcement authorities in various jurisdictions. Some of these matters may involve novel legal theories and interpretations andmay be advanced under criminal as well as civil statutes, and some proceedings could result in the imposition of civil, regulatoryenforcement or criminal penalties. We review the status of all proceedings on an ongoing basis and will exercise judgment inresolving them in such manner as we believe to be in our best interest. This is an area of significant judgment and uncertaintyand the extent of our financial and other exposure to these proceedings after taking into account current accruals could bematerial to our results of operations in any particular period. The following is a description of our significant legal proceedings.
London interbank offered rate (LIBOR) regulatory investigations and litigationRoyal Bank of Canada and other U.S. dollar panel banks have been named as defendants in private lawsuits filed in the U.S. withrespect to the setting of U.S. dollar LIBOR including a number of class action lawsuits which have been consolidated before theU.S. District Court for the Southern District of New York. The complaints in those private lawsuits assert claims against us andother panel banks under various U.S. laws, including U.S. antitrust laws, the U.S. Commodity Exchange Act, and state law.
In addition to the LIBOR actions, in January 2019, a number of financial institutions, including Royal Bank of Canada and RBCCapital Markets LLC, were named in a purported class action in New York alleging violations of the U.S. antitrust laws andcommon law principles of unjust enrichment in the setting of LIBOR after the Intercontinental Exchange took over administrationof the benchmark interest rate from the British Bankers’ Association in 2014.
On March 26, 2020, Royal Bank of Canada and RBC Capital Markets LLC were dismissed from the purported class action inNew York alleging violations of the U.S. antitrust laws and common law principles of unjust enrichment in the setting of LIBORafter the Intercontinental Exchange took over administration of the benchmark interest rate from the British Bankers’Association in 2014. On April 24, 2020, the plaintiffs filed a notice of appeal. Based on the facts currently known, it is not possibleat this time for us to predict the ultimate outcome of these proceedings or the timing of their resolution.
Royal Bank of Canada Trust Company (Bahamas) Limited proceedingsOn April 13, 2015, a French investigating judge notified Royal Bank of Canada Trust Company (Bahamas) Limited (RBC Bahamas)of the issuance of an ordonnance de renvoi referring RBC Bahamas and other unrelated persons to the French tribunalcorrectionnel to face the charge of complicity in estate tax fraud relating to actions taken relating to a trust for which RBCBahamas serves as trustee. RBC Bahamas believes that its actions did not violate French law and contested the charge in theFrench court. On January 12, 2017, the French court acquitted all parties including RBC Bahamas and on June 29, 2018, the Frenchappellate court affirmed the acquittals. The acquittals were appealed and the hearing took place on November 25, 2020. Thecourt’s decision is expected to be issued in January 2021.
On October 28, 2016, Royal Bank of Canada was granted an exemption by the U.S. Department of Labor that allows RoyalBank of Canada and its current and future affiliates to continue to qualify for the Qualified Professional Asset Manager (QPAM)exemption under the Employee Retirement Income Security Act despite any potential conviction of RBC Bahamas in the Frenchproceeding for a temporary one year period from the date of conviction. On November 3, 2020, the Solicitor of Labor of the U.S.
210 Royal Bank of Canada: Annual Report 2020 Consolidated Financial Statements

Department of Labor issued an opinion stating that a conviction under non-U.S. law is not a disqualifying event for purposes ofthe QPAM exemption. Based on that opinion, any conviction in a French court would not trigger disqualification of Royal Bank ofCanada and its current and future affiliates under the QPAM exemption.
RBC Bahamas continues to review the trustee’s and the trust’s legal obligations, including liabilities and potential liabilitiesunder applicable tax and other laws. Based on the facts currently known, it is not possible at this time to predict the ultimateoutcome of these matters; however, we believe that the ultimate resolution will not have a material effect on our consolidatedfinancial position, although it may be material to our results of operations in the period it occurs.
Interchange fees litigationSince 2011, seven proposed class actions have been commenced in Canada: Bancroft-Snell v. Visa Canada Corporation, et al.,9085-4886 Quebec Inc. v. Visa Canada Corporation, et al., Coburn and Watson’s Metropolitan Home v. Bank of America Corporation,et al. (Watson), Macaronies Hair Club and Laser Centre Inc. v. BofA Canada Bank, et al., 1023926 Alberta Ltd. v. Bank of AmericaCorporation, et al., The Crown & Hand Pub Ltd. v. Bank of America Corporation, et al., and Hello Baby Equipment Inc. v. BofA CanadaBank, et al. The defendants in each action are VISA Canada Corporation (Visa), MasterCard International Incorporated (MasterCard),Royal Bank of Canada and other financial institutions. The plaintiff class members are Canadian merchants who accept Visa and/orMasterCard branded credit cards for payment. The actions allege, among other things, that from March 2001 to the present, Visa andMasterCard conspired with their issuing banks and acquirers to set default interchange rates and merchant discount fees and thatcertain rules (Honour All Cards and No Surcharge) have the effect of increasing the merchant discount fees. The actions includeclaims of civil conspiracy, breach of the Competition Act (the Act) interference with economic relations and unjust enrichment. Theclaims seek unspecified general and punitive damages. In Watson, a decision to partially certify the action as a class proceeding wasreleased on March 27, 2014, and was appealed. On August 19, 2015, the British Columbia Court of Appeal struck the plaintiff classrepresentative’s cause of action under section 45 of the Act and reinstated the plaintiff class representative’s cause of action in civilconspiracy by unlawful means, among other rulings. In October 2016, the trial court in Watson denied a motion by the plaintiff torevive the stricken section 45 Competition Act claim, and also denied the plaintiff’s motion to add new causes of action. The SupremeCourt of Canada declined the B.C. class action plaintiffs’ request to appeal the decision striking the plaintiffs’ cause of action undersection 45 of the Competition Act. In October 2020, the parties agreed to adjourn the Watson trial.
In 9085-4886 Quebec Inc. v. Visa Canada Corporation, et al., the Quebec-court dismissed the Competition Act claims byQuebec merchants for post-2010 damages and certified a class action as to the remaining claims. The merchants appealed andon July 25, 2019, the Quebec Court of Appeal allowed the appeal to also authorize the merchants to proceed under section 45 ofthe Competition Act for claims after March 12, 2010 and for claims under section 49 of the Competition Act.
Foreign exchange mattersVarious regulators are conducting inquiries regarding potential violations of antitrust law by a number of banks, including RoyalBank of Canada, regarding foreign exchange trading.
Beginning in 2015, putative class actions were brought against Royal Bank of Canada and/or RBC Capital Markets, LLC in theUnited States and Canada. These actions were each brought against multiple foreign exchange dealers and allege, among otherthings, collusive behaviour in global foreign exchange trading. In August 2018, the U.S. District Court entered a final orderapproving RBC Capital Markets’ pending settlement with class plaintiffs. In November 2018, certain institutional plaintiffs whohad previously opted-out of participating in the settlement filed their own lawsuit in US District Court. In May 2020, the USDistrict Court dismissed Royal Bank of Canada from the November 2018 lawsuit brought by certain institutional plaintiffs who hadpreviously opted-out of participating in the August 2018 settlement with class plaintiffs. The Canadian class actions and one otherU.S. action that is purportedly brought on behalf of different classes of plaintiffs remain pending.
In its discretion Royal Bank of Canada may choose to resolve claims, litigations, or similar matters at any time. Based on thefacts currently known, it is not possible at this time to predict the ultimate outcome of the Foreign Exchange Matters or thetiming of their ultimate resolution.
Other mattersWe are a defendant in a number of other actions alleging that certain of our practices and actions were improper. The lawsuitsinvolve a variety of complex issues and the timing of their resolution is varied and uncertain. Management believes that we willultimately be successful in resolving these lawsuits, to the extent that we are able to assess them, without material financialimpact to the Bank. This is, however, an area of significant judgment and the potential liability resulting from these lawsuitscould be material to our results of operations in any particular period.
Various other legal proceedings are pending that challenge certain of our other practices or actions. While this is an area ofsignificant judgment and some matters are currently inestimable, we consider that the aggregate liability, to the extent that weare able to assess it, resulting from these other proceedings will not be material to our consolidated financial position or resultsof operations.
Note 26 Related party transactions
Related partiesRelated parties include associated companies, post-employment benefit plans for the benefit of our employees, key managementpersonnel (KMP), the Board of Directors (Directors), close family members of KMP and Directors, and entities which are, directlyor indirectly, controlled by, jointly controlled by or significantly influenced by KMP, Directors or their close family members.
Key management personnel and DirectorsKMP are defined as those persons having authority and responsibility for planning, directing and controlling our activities,directly or indirectly. They include the senior members of our organization called the Group Executive (GE). The GE is comprisedof the President and Chief Executive Officer and individuals that report directly to him, including the Chief Administrative Officer,Chief Financial Officer, Chief Human Resources Officer, Chief Risk Officer, and Group Heads for RBC Ventures & CorporateDevelopment, Wealth Management, Insurance and Investor & Treasury Services, Capital Markets, Technology & Operations, andPersonal & Commercial Banking. The Directors do not plan, direct, or control the activities of the entity; they oversee themanagement of the business and provide stewardship.
Consolidated Financial Statements Royal Bank of Canada: Annual Report 2020 211

Note 26 Related party transactions (continued)
Compensation of Key management personnel and DirectorsFor the year ended
(Millions of Canadian dollars)
October 31
2020 (1)
October 31
2019Salaries and other short-term employee benefits (2) $ 21 $ 26Post-employment benefits (3) 2 2Share-based payments 32 44
$ 55 $ 72
(1) During the year ended October 31, 2020, certain executives who were members of the Bank’s Group Executive as at October 31, 2019, left the Bank and therefore, were nolonger part of KMP. Compensation for the year ended October 31, 2020, attributable to the former executives, including benefits and share-based payments relating toawards granted in prior years was $27 million.
(2) Includes the portion of the annual variable short-term incentive bonus that certain executives elected to receive in the form of DSUs. Refer to Note 21 for further details.Directors receive retainers but do not receive salaries and other short-term employee benefits.
(3) Directors do not receive post-employment benefits.
Stock options, stock awards and shares held by Key management personnel, Directors and their close family membersAs at
October 31, 2020 (1) October 31, 2019
(Millions of Canadian dollars, except number of units)
No. ofunits held Value
No. ofunits held Value
Stock options (2) 1,912,482 $ 15 2,372,714 $ 51Other non-option stock based awards (2) 869,756 81 1,481,096 157RBC common and preferred shares 206,652 19 463,362 49
2,988,890 $ 115 4,317,172 $ 257
(1) During the year ended October 31, 2020, certain executives who were members of the Bank’s Group Executive as at October 31, 2019, left the Bank and therefore, were nolonger part of KMP. Total shareholdings and options held upon their departure was 1,600,184 units, with a value of $91 million.
(2) Directors do not receive stock options or any other non-option stock based awards.
Transactions, arrangements and agreements involving Key management personnel, Directors and their close familymembersIn the normal course of business, we provide certain banking services to KMP, Directors, and their close family members. Thesetransactions were made on substantially the same terms, including interest rates and security, as for comparable transactionswith persons of a similar standing and did not involve more than the normal risk of repayment or present other unfavourablefeatures.
As at October 31, 2020, total loans to KMP, Directors and their close family members were $6 million (October 31, 2019 –$8 million). We have no stage 3 allowance or provision for credit losses relating to these loans as at and for the years endedOctober 31, 2020 and October 31, 2019. No guarantees, pledges or commitments have been given to KMP, Directors or their closefamily members.
Joint ventures and associatesIn the normal course of business, we provide certain banking and financial services to our joint ventures and associates,including loans, interest and non-interest bearing deposits. These transactions meet the definition of related party transactionsand were made on substantially the same terms as for comparable transactions with third parties.
As at October 31, 2020, loans to joint ventures and associates were $215 million (October 31, 2019 – $222 million) and depositsfrom joint ventures and associates were $15 million (October 31, 2019 – $180 million). We have no stage 3 allowance or provisionfor credit losses relating to loans to joint ventures and associates as at and for the years ended October 31, 2020 and October 31,2019. $1 million of guarantees have been given to joint ventures and associates for the year ended October 31, 2020 (October 31,2019 – $1 million).
Other transactions, arrangements or agreements involving joint ventures and associatesAs at or for the year
ended
(Millions of Canadian dollars)
October 31
2020October 31
2019Commitments and other contingencies $ 589 $ 430Other fees received for services rendered 43 47Other fees paid for services received 117 128
Note 27 Results by business segment
Composition of business segmentsFor management purposes, based on the products and services offered, we are organized into five business segments:Personal & Commercial Banking, Wealth Management, Insurance, Investor & Treasury Services and Capital Markets.
Personal & Commercial Banking provides a broad suite of financial products and services to individuals and businesses for theirday-to-day banking, investing and financing needs through two businesses: Canadian Banking and Caribbean & U.S. Banking. InCanada, we provide a broad suite of financial products and services through our large branch network, automated teller
212 Royal Bank of Canada: Annual Report 2020 Consolidated Financial Statements

machines, and mobile sales network. In the Caribbean and the U.S., we offer a broad range of financial products and services intargeted markets. Non-interest income in Personal & Commercial Banking mainly comprises Service charges, Mutual fundrevenue and Card service revenue.
Wealth Management serves high net worth and ultra-high net worth individual and institutional clients with a comprehensivesuite of advice-based solutions and strategies to help them achieve their financial goals through our line of businesses inCanada, the U.S., the U.K., Europe and Asia, including Canadian Wealth Management, U.S. Wealth Management (including CityNational), Global Asset Management, and International Wealth Management. Non-interest income in Wealth Management mainlycomprises Investment management and custodial fees, Mutual fund revenue and Securities brokerage commissions.
Insurance has operations in Canada and globally, operating under two business lines: Canadian Insurance andInternational Insurance, providing a wide range of life, health, home, auto, travel, wealth, annuities and reinsurance advice andsolutions as well as creditor and business insurance services to individual, business and group clients. In Canada, we offer ourproducts and services through our proprietary distribution channels, comprised of the field sales force, advice centers andonline, as well as through independent insurance advisors and affinity relationships. Outside Canada, we operate in reinsuranceand retrocession markets globally offering life, disability and longevity reinsurance products. Non-interest income in Insurancecomprises Insurance premiums, investment and fee income.
Investor & Treasury Services is a provider of asset, cash management, transaction banking, and treasury services to institutionalclients worldwide. We also provide Canadian dollar cash management, correspondent banking and trade finance for financialinstitutions globally and short-term funding and liquidity management for the bank. Non-interest income in Investor & TreasuryServices mainly comprises Investment management and custodial fees.
Capital Markets provides expertise in banking, finance and capital markets to corporations, institutional investors, assetmanagers, governments and central banks around the world in our two main business lines: Corporate and Investment Bankingand Global Markets. In North America, we offer a full suite of products and services which include corporate and investmentbanking, equity and debt origination and distribution, as well as sales and trading. Outside North America, we have a selectpresence in the U.K. & Europe, Australia, Asia & other markets. In the U.K. & Europe, we offer a diversified set of capabilities inour key sectors of expertise such as energy, mining and infrastructure, industrial, consumer, healthcare, technology and financialservices. Non-interest income in Capital Markets mainly includes Trading revenue, Underwriting and other advisory fees andCredit fees.
All other enterprise level activities that are not allocated to these five business segments, such as enterprise funding,securitizations, net charges associated with unattributed capital, and consolidation adjustments, including the elimination of theTaxable equivalent basis (Teb) gross-up amounts, are included in Corporate Support. Teb adjustments gross up income fromcertain tax-advantaged sources from Canadian taxable corporate dividends and U.S. tax credit investments recorded in CapitalMarkets to their effective tax equivalent value with the corresponding offset recorded in the provision for income taxes.Management believes that these Teb adjustments are necessary for Capital Markets to reflect how it is managed and enhancesthe comparability of revenue across our taxable and tax-advantaged sources. Our use of Teb adjustments may not becomparable to similarly adjusted amounts at other financial institutions. The Teb adjustment for the year ended October 31, 2020was $513 million (October 31, 2019 – $450 million).
Geographic segmentsFor geographic reporting, our segments are grouped into Canada, United States and Other International. Transactions areprimarily recorded in the location that best reflects the risk due to negative changes in economic conditions and prospects forgrowth due to positive economic changes. This location frequently corresponds with the location of the legal entity throughwhich the business is conducted and the location of our clients. Transactions are recorded in the local currency and are subjectto foreign exchange rate fluctuations with respect to the movement in the Canadian dollar.
Management reporting frameworkOur management reporting framework is intended to measure the performance of each business segment as if it were a stand-alone business and reflects the way that the business segment is managed. This approach is intended to ensure that ourbusiness segments’ results include all applicable revenue and expenses associated with the conduct of their business anddepicts how management views those results. We regularly monitor these segment results for the purpose of making decisionsabout resource allocation and performance assessment. These items do not impact our consolidated results.
The expenses in each business segment may include costs or services directly incurred or provided on their behalf at theenterprise level. For other costs not directly attributable to one of our business segments, we use a management reportingframework that uses assumptions and methodologies for allocating overhead costs and indirect expenses to our businesssegments and that assists in the attribution of capital and the transfer pricing of funds to our business segments in a manner thatconsistently measures and aligns the economic costs with the underlying benefits and risks of that specific business segment.Activities and business conducted between our business segments are generally at market rates. All other enterprise levelactivities that are not allocated to our five business segments are reported under Corporate Support.
Our assumptions and methodologies used in our management reporting framework are periodically reviewed by us toensure that they remain valid. The capital attribution methodologies involve a number of assumptions that are revisedperiodically.
Consolidated Financial Statements Royal Bank of Canada: Annual Report 2020 213

Note 27 Results by business segment (continued)
For the year ended October 31, 2020
(Millions of Canadian dollars)
Personal &Commercial
BankingWealth
Management Insurance
Investor &TreasuryServices
CapitalMarkets (1)
CorporateSupport (1) Total Canada
UnitedStates
OtherInternational
Net interest income (2) $ 12,568 $ 2,860 $ – $ 329 $ 5,135 $ (57) $ 20,835 $ 14,185 $ 4,959 $ 1,691Non-interest income 5,163 9,360 5,361 1,982 4,749 (269) 26,346 13,510 6,775 6,061
Total revenue 17,731 12,220 5,361 2,311 9,884 (326) 47,181 27,695 11,734 7,752Provision for credit losses 2,891 214 – 6 1,239 1 4,351 2,881 949 521Insurance policyholder
benefits, claims andacquisition expense – – 3,683 – – – 3,683 1,993 – 1,690
Non-interest expense 7,946 9,212 592 1,589 5,362 57 24,758 12,513 8,380 3,865
Net income (loss) beforeincome taxes 6,894 2,794 1,086 716 3,283 (384) 14,389 10,308 2,405 1,676
Income taxes (recoveries) 1,807 639 255 180 507 (436) 2,952 2,516 209 227
Net income $ 5,087 $ 2,155 $ 831 $ 536 $ 2,776 $ 52 $ 11,437 $ 7,792 $ 2,196 $ 1,449
Non-interest expenseincludes:Depreciation and
amortization $ 929 $ 879 $ 58 $ 217 $ 517 $ 6 $ 2,606 $ 1,587 $ 725 $ 294Impairment of other
intangibles – 1 – 7 6 28 42 40 1 1
Total assets $ 509,679 $ 129,706 $ 21,253 $ 230,695 $ 688,054 $ 45,161 $ 1,624,548 $ 911,932 $ 431,473 $ 281,143
Total assets include:Additions to premises
and equipment andintangibles $ 722 $ 704 $ 46 $ 101 $ 452 $ 559 $ 2,584 $ 1,454 $ 706 $ 424
Total liabilities $ 509,682 $ 129,673 $ 21,311 $ 230,618 $ 688,314 $ (41,817) $ 1,537,781 $ 825,034 $ 431,570 $ 281,177
For the year ended October 31, 2019
(Millions of Canadian dollars)
Personal &Commercial
BankingWealth
Management Insurance
Investor &TreasuryServices
CapitalMarkets (1)
CorporateSupport (1) Total Canada
UnitedStates
OtherInternational
Net interest income (2) $ 12,653 $ 2,993 $ – $ (44) $ 4,043 $ 104 $ 19,749 $ 14,375 $ 4,058 $ 1,316Non-interest income 5,212 9,150 5,710 2,389 4,245 (453) 26,253 14,037 6,411 5,805
Total revenue 17,865 12,143 5,710 2,345 8,288 (349) 46,002 28,412 10,469 7,121Provision for credit losses 1,448 117 – – 299 – 1,864 1,512 282 70Insurance policyholder
benefits, claims andacquisition expense – – 4,085 – – – 4,085 2,800 – 1,285
Non-interest expense 7,768 8,813 606 1,725 5,096 131 24,139 12,175 7,994 3,970
Net income (loss) beforeincome taxes 8,649 3,213 1,019 620 2,893 (480) 15,914 11,925 2,193 1,796
Income taxes (recoveries) 2,247 663 213 145 227 (452) 3,043 2,748 133 162
Net income $ 6,402 $ 2,550 $ 806 $ 475 $ 2,666 $ (28) $ 12,871 $ 9,177 $ 2,060 $ 1,634
Non-interest expenseincludes:Depreciation and
amortization $ 632 $ 593 $ 48 $ 143 $ 408 $ – $ 1,824 $ 1,176 $ 486 $ 162Impairment of other
intangibles – – – 44 2 64 110 20 54 36
Total assets $ 481,720 $ 106,579 $ 19,012 $ 144,406 $ 634,313 $ 42,905 $ 1,428,935 $ 753,142 $ 399,792 $ 276,001
Total assets include:Additions to premises
and equipment andintangibles $ 408 $ 565 $ 44 $ 142 $ 491 $ 621 $ 2,271 $ 1,326 $ 669 $ 276
Total liabilities $ 481,745 $ 106,770 $ 19,038 $ 144,378 $ 634,126 $ (40,747) $ 1,345,310 $ 669,543 $ 399,800 $ 275,967
(1) Taxable equivalent basis.(2) Interest revenue is reported net of interest expense as we rely primarily on net interest income as a performance measure.
Note 28 Nature and extent of risks arising from financial instruments
We are exposed to credit, market and liquidity and funding risks as a result of holding financial instruments. Our riskmeasurement and objectives, policies and methodologies for managing these risks are disclosed in the shaded text along withthose tables specifically marked with an asterisk (*) in the Credit risk section of Management’s Discussion and Analysis. Theseshaded text and tables are an integral part of these Consolidated Financial Statements.
Concentrations of credit risk exist if a number of our counterparties are engaged in similar activities, are located in the samegeographic region or have comparable economic characteristics such that their ability to meet contractual obligations would besimilarly affected by changes in economic, political or other conditions.
214 Royal Bank of Canada: Annual Report 2020 Consolidated Financial Statements

Concentrations of credit risk indicate the relative sensitivity of our performance to developments affecting a particularindustry or geographic location. The amounts of credit exposure associated with certain of our on- and off-balance sheetfinancial instruments are summarized in the following tables.
As at October 31, 2020
(Millions of Canadian dollars,except percentage amounts) Canada %
UnitedStates % Europe %
OtherInternational % Total
On-balance sheet assets otherthan derivatives (1) $ 688,945 69% $ 200,521 20% $ 68,058 7% $ 40,736 4% $ 998,260
Derivatives before masternetting agreements (2), (3) 22,761 20% 28,074 24% 56,229 49% 8,185 7% 115,249
$ 711,706 64% $ 228,595 21% $ 124,287 11% $ 48,921 4% $ 1,113,509
Off-balance sheet creditinstruments (4)
Committed and uncommitted (5) $ 394,732 66% $ 162,589 27% $ 34,892 6% $ 6,535 1% $ 598,748Other 62,329 60% 12,697 12% 27,232 26% 2,208 2% 104,466
$ 457,061 65% $ 175,286 25% $ 62,124 9% $ 8,743 1% $ 703,214
(Millions of Canadian dollars,except percentage amounts)
As at October 31, 2019
Canada %UnitedStates % Europe %
OtherInternational % Total
On-balance sheet assets otherthan derivatives (1) $ 646,567 69% $ 189,240 20% $ 60,554 6% $ 50,642 5% $ 947,003
Derivatives before masternetting agreements (2), (3) 19,544 19% 23,250 23% 53,752 52% 6,421 6% 102,967
$ 666,111 64% $ 212,490 20% $ 114,306 11% $ 57,063 5% $ 1,049,970
Off-balance sheet creditinstruments (4)
Committed and uncommitted (5) $ 367,907 67% $ 148,326 27% $ 29,462 5% $ 5,774 1% $ 551,469Other 67,410 58% 15,246 13% 31,934 28% 1,491 1% 116,081
$ 435,317 65% $ 163,572 25% $ 61,396 9% $ 7,265 1% $ 667,550
(1) Includes assets purchased under reverse repurchase agreements and securities borrowed, loans and customers’ liability under acceptances. The largest concentrationsin Canada are Ontario at 56% (October 31, 2019 – 56%), the Prairies at 16% (October 31, 2019 – 16%), British Columbia and the territories at 14% (October 31, 2019 – 14%)and Quebec at 10% (October 31, 2019 – 10%). No industry accounts for more than 25% (October 31, 2019 – 35%) of total on-balance sheet credit instruments. Theclassification of our sectors aligns with our view of credit risk by industry.
(2) A further breakdown of our derivative exposures by risk rating and counterparty type is provided in Note 8.(3) Excludes valuation adjustments determined on a pooled basis.(4) Balances presented are contractual amounts representing our maximum exposure to credit risk.(5) Represents our maximum exposure to credit risk. Retail and wholesale commitments respectively comprise 46% and 54% of our total commitments (October 31, 2019 –
43% and 57%). The largest concentrations in the wholesale portfolio relate to Financial services at 15% (October 31, 2019 – 13%), Utilities at 12% (October 31, 2019 – 11%),Real estate & related at 10% (October 31, 2019 – 9%), Other services at 8% (October 31, 2019 – 7%), and Oil & gas at 7% (October 31, 2019 – 7%). The classification of oursectors aligns with our view of credit risk by industry.
Note 29 Capital management
Regulatory capital and capital ratiosOSFI formally establishes risk-based capital and leverage targets for deposit-taking institutions in Canada. We are required tocalculate our capital ratios using the Basel III framework. Under Basel III, regulatory capital includes Common Equity Tier 1(CET1), Tier 1 and Tier 2 capital. CET1 capital mainly consists of common shares, retained earnings and other components ofequity. Regulatory adjustments under Basel III include deductions of goodwill and other intangibles, certain deferred tax assets,defined benefit pension fund assets, investments in banking, financial and insurance entities, and the shortfall of provisions toexpected losses. Tier 1 capital comprises predominantly CET1 and Additional Tier 1 items including non-cumulative preferredshares and LRCNs that meet certain criteria. Tier 2 capital includes subordinated debentures that meet certain criteria, certainloan loss allowances and non-controlling interests in subsidiaries Tier 2 instruments. Total capital is the sum of Tier 1 and Tier 2capital.
Regulatory capital ratios are calculated by dividing CET1, Tier 1 and Total capital by risk-weighted assets. The leverage ratiois calculated by dividing Tier 1 capital by an exposure measure. The exposure measure consists of total assets (excluding itemsdeducted from Tier 1 capital) and certain off-balance sheet items converted into credit exposure equivalents. Adjustments arealso made to derivatives and secured financing transactions to reflect credit and other risks.
Consolidated Financial Statements Royal Bank of Canada: Annual Report 2020 215

Note 29 Capital management (continued)
During 2020 and 2019, we complied with all capital and leverage requirements, including the domestic stability buffer, imposed byOSFI.
As at
(Millions of Canadian dollars, except percentage amounts and as otherwise noted)October 31
2020October 31
2019Capital (1)
CET1 capital $ 68,082 $ 62,184Tier 1 capital 74,005 67,861Total capital 84,928 77,888
Risk-weighted Assets (RWA) used in calculation of capital ratios (1)
Credit risk $ 448,821 $ 417,835Market risk 27,374 28,917Operational risk 70,047 66,104
Total RWA $ 546,242 $ 512,856
Capital ratios and Leverage ratio (1)
CET1 ratio 12.5% 12.1%Tier 1 capital ratio 13.5% 13.2%Total capital ratio 15.5% 15.2%Leverage ratio 4.8% 4.3%Leverage ratio exposure (billions) $ 1,552.9 $ 1,570.5
(1) Capital, RWA, and capital ratios are calculated using OSFI’s Capital Adequacy Requirements (CAR) guideline and the Leverage ratio is calculated using OSFI’s LeverageRequirements (LR) guideline as updated in accordance with the regulatory guidance issued in fiscal 2020 by OSFI in response to the COVID-19 pandemic. Both the CARguideline and LR guideline are based on the Basel III framework.
Note 30 Offsetting financial assets and financial liabilities
Offsetting within our Consolidated Balance Sheets may be achieved where financial assets and liabilities are subject to masternetting arrangements that provide the currently enforceable right of offset and where there is an intention to settle on a netbasis, or realize the assets and settle the liabilities simultaneously. For derivative contracts and repurchase and reverserepurchase arrangements, this is generally achieved when there is a market mechanism for settlement (e.g., central counterpartyexchange or clearing house) which provides daily net settlement of cash flows arising from these contracts. Margin receivablesand margin payables are generally offset as they settle simultaneously through a market settlement mechanism.
Amounts that do not qualify for offsetting include master netting arrangements that only permit outstanding transactionswith the same counterparty to be offset in an event of default or occurrence of other predetermined events. Such master nettingarrangements include the International Swaps and Derivatives Association Master Agreement or certain derivative exchange orclearing counterparty agreements for derivative contracts, global master repurchase agreement and global master securitieslending agreements for repurchase, reverse repurchase and other similar secured lending and borrowing arrangements.
The amount of financial collateral received or pledged subject to master netting arrangements or similar agreements but donot qualify for offsetting refers to the collateral received or pledged to cover the net exposure between counterparties byenabling the collateral to be realized in an event of default or the occurrence of other predetermined events. Certain amounts ofcollateral are restricted from being sold or re-pledged unless there is an event of default or the occurrence of otherpredetermined events.
The following tables provide the amount of financial instruments that have been offset on the Consolidated Balance Sheetsand the amounts that do not qualify for offsetting but are subject to enforceable master netting arrangements or similaragreements. The amounts presented are not intended to represent our actual exposure to credit risk.
Financial assets subject to offsetting, enforceable master netting arrangements or similar agreementsAs at October 31, 2020
Amounts subject to offsetting and enforceable netting arrangementsAmounts subject to master
netting arrangements orsimilar agreements but do
not qualify for offsetting onthe balance sheet (1)
(Millions of Canadian dollars)
Gross amountsof financial
assets beforebalance sheet
offsetting
Amounts offinancial
liabilitiesoffset on the
balance sheet
Net amount offinancial assets
presented on thebalance sheet
Impact ofmasternetting
agreements
Financialcollateral
received (2) Net amount
Amounts notsubject to
enforceablenetting
arrangements
Total amountrecognized
on thebalance sheet
Assets purchased under reverserepurchase agreements andsecurities borrowed $ 347,327 $ 35,783 $ 311,544 $ 36 $ 310,128 $ 1,380 $ 1,471 $ 313,015
Derivative assets (3) 99,535 657 98,878 69,300 18,627 10,951 14,610 113,488Other financial assets 445 192 253 2 50 201 – 253
$ 447,307 $ 36,632 $ 410,675 $ 69,338 $ 328,805 $ 12,532 $ 16,081 $ 426,756
216 Royal Bank of Canada: Annual Report 2020 Consolidated Financial Statements

As at October 31, 2019Amounts subject to offsetting and enforceable netting arrangements
Amounts subject to masternetting arrangements or
similar agreements but donot qualify for offsetting on
the balance sheet (1)
(Millions of Canadian dollars)
Gross amountsof financial
assets beforebalance sheet
offsetting
Amounts offinancialliabilities
offset on thebalance sheet
Net amount offinancial assets
presented on thebalance sheet
Impact ofmasternetting
agreements
Financialcollateral
received (2) Net amount
Amounts notsubject to
enforceablenetting
arrangements
Total amountrecognized
on thebalance sheet
Assets purchased under reverserepurchase agreements andsecurities borrowed $ 374,617 $ 69,420 $ 305,197 $ 527 $ 303,539 $ 1,131 $ 1,764 $ 306,961
Derivative assets (3) 88,996 710 88,286 62,524 15,458 10,304 13,274 101,560Other financial assets 994 281 713 1 89 623 – 713
$ 464,607 $ 70,411 $ 394,196 $ 63,052 $ 319,086 $ 12,058 $ 15,038 $ 409,234
(1) Financial collateral is reflected at fair value. The amount of financial instruments and financial collateral disclosed is limited to the net balance sheet exposure, and anyover-collateralization is excluded from the table.
(2) Includes cash collateral of $15.2 billion (October 31, 2019 – $11.6 billion) and non-cash collateral of $313.6 billion (October 31, 2019 – $307.5 billion).(3) Includes cash margin of $4.9 billion (October 31, 2019 – $3.6 billion) which offset against the derivative balance on the balance sheet.
Financial liabilities subject to offsetting, enforceable master netting arrangements or similar agreementsAs at October 31, 2020
Amounts subject to offsetting and enforceable netting arrangementsAmounts subject to master
netting arrangements orsimilar agreements but do
not qualify for offsetting onthe balance sheet (1)
(Millions of Canadian dollars)
Gross amountsof financial
liabilities beforebalance sheet
offsetting
Amounts offinancial
assetsoffset on the
balance sheet
Net amount offinancial liabilities
presented on thebalance sheet
Impact ofmasternetting
agreements
Financialcollateral
pledged (2) Net amount
Amounts notsubject to
enforceablenetting
arrangements
Total amountrecognized
on thebalance sheet
Obligations related to assets soldunder repurchase agreementsand securities loaned $ 309,130 $ 35,783 $ 273,347 $ 36 $ 272,871 $ 440 $ 884 $ 274,231
Derivative liabilities (3) 96,138 657 95,481 69,300 16,232 9,949 14,446 109,927Other financial liabilities 358 192 166 2 – 164 – 166
$ 405,626 $ 36,632 $ 368,994 $ 69,338 $ 289,103 $ 10,553 $ 15,330 $ 384,324
As at October 31, 2019Amounts subject to offsetting and enforceable netting arrangements
Amounts subject to masternetting arrangements or
similar agreements but donot qualify for offsetting on
the balance sheet (1)
(Millions of Canadian dollars)
Gross amountsof financial
liabilities beforebalance sheet
offsetting
Amounts offinancial
assetsoffset on the
balance sheet
Net amount offinancial liabilities
presented on thebalance sheet
Impact ofmasternetting
agreements
Financialcollateral
pledged (2) Net amount
Amounts notsubject to
enforceablenetting
arrangements
Total amountrecognized
on thebalance sheet
Obligations related to assets soldunder repurchase agreementsand securities loaned $ 294,758 $ 69,420 $ 225,338 $ 527 $ 224,506 $ 305 $ 1,248 $ 226,586
Derivative liabilities (3) 84,624 710 83,914 62,524 13,540 7,850 14,629 98,543Other financial liabilities 492 281 211 1 – 210 – 211
$ 379,874 $ 70,411 $ 309,463 $ 63,052 $ 238,046 $ 8,365 $ 15,877 $ 325,340
(1) Financial collateral is reflected at fair value. The amount of financial instruments and financial collateral disclosed is limited to the net balance sheet exposure, and anyover-collateralization is excluded from the table.
(2) Includes cash collateral of $13.5 billion (October 31, 2019 – $11.5 billion) and non-cash collateral of $275.6 billion (October 31, 2019 – $226.5 billion).(3) Includes cash margin of $2 billion (October 31, 2019 – $1.3 billion) which offset against the derivative balance on the balance sheet.
Consolidated Financial Statements Royal Bank of Canada: Annual Report 2020 217

Note 31 Recovery and settlement of on-balance sheet assets and liabilities
The table below presents an analysis of assets and liabilities recorded on our Consolidated Balance Sheets by amounts to berecovered or settled within one year and after one year, as at the balance sheet date, based on contractual maturities andcertain other assumptions outlined in the footnotes below. As warranted, we manage the liquidity risk of various products basedon historical behavioural patterns that are often not aligned with contractual maturities. Amounts to be recovered or settledwithin one year, as presented below, may not be reflective of our long-term view of the liquidity profile of certain balance sheetcategories.
(Millions of Canadian dollars)
As at
October 31, 2020 October 31, 2019
Within oneyear
After oneyear Total
Within oneyear
After oneyear Total
AssetsCash and due from banks (1) $ 117,375 $ 1,513 $ 118,888 $ 24,822 $ 1,488 $ 26,310Interest-bearing deposits with
banks 39,013 – 39,013 38,345 – 38,345Securities
Trading (2) 126,309 9,762 136,071 137,772 8,762 146,534Investment, net of applicable
allowance 34,728 105,015 139,743 17,283 85,187 102,470Assets purchased under reverse
repurchase agreements andsecurities borrowed 313,013 2 313,015 306,828 133 306,961
LoansRetail 97,223 360,753 457,976 108,382 317,704 426,086Wholesale 51,296 157,359 208,655 48,737 147,133 195,870Allowance for loan losses (5,639) (3,100)
Segregated fund net assets – 1,922 1,922 – 1,663 1,663Other
Customers’ liability underacceptances 18,507 – 18,507 18,062 – 18,062
Derivatives (2) 110,217 3,271 113,488 99,792 1,768 101,560Premises and equipment – 7,934 7,934 – 3,191 3,191Goodwill – 11,302 11,302 – 11,236 11,236Other intangibles – 4,752 4,752 – 4,674 4,674Other assets 46,953 11,968 58,921 38,775 10,298 49,073
$ 954,634 $ 675,553 $ 1,624,548 $ 838,798 $ 593,237 $ 1,428,935
LiabilitiesDeposits (3) $ 852,734 $ 159,151 $ 1,011,885 $ 719,933 $ 166,072 $ 886,005Segregated fund net liabilities – 1,922 1,922 – 1,663 1,663Other
Acceptances 18,618 – 18,618 18,091 – 18,091Obligations related to securities
sold short 26,754 2,531 29,285 32,668 2,401 35,069Obligations related to assets sold
under repurchase agreementsand securities loaned 269,260 4,971 274,231 226,582 4 226,586
Derivatives (2) 108,407 1,520 109,927 97,415 1,128 98,543Insurance claims and policy
benefit liabilities 1,798 10,417 12,215 1,726 9,675 11,401Other liabilities 48,844 20,987 69,831 41,612 16,525 58,137
Subordinated debentures – 9,867 9,867 1,999 7,816 9,815
$ 1,326,415 $ 211,366 $ 1,537,781 $ 1,140,026 $ 205,284 $ 1,345,310
(1) Cash and due from banks are assumed to be recovered within one year, except for cash balances not available for use by the Bank.(2) Trading securities classified as FVTPL and trading derivatives are presented as within one year as this best represents in most instances the short-term nature of our
trading activities. Non-trading derivatives are presented according to the recovery or settlement of the hedging transaction.(3) Demand deposits of $511 billion (October 31, 2019 – $405 billion) are presented as within one year due to their being repayable on demand or at short notice on a
contractual basis. In practice, these deposits relate to a broad range of individuals and customer-types which form a stable base for our operations and liquidity needs.
218 Royal Bank of Canada: Annual Report 2020 Consolidated Financial Statements

Note 32 Parent company information
The following table presents information regarding the legal entity of Royal Bank of Canada with its subsidiaries presented on anequity accounted basis.
Condensed Balance SheetsAs at
(Millions of Canadian dollars)
October 31
2020October 31
2019
AssetsCash and due from banks $ 109,397 $ 14,264Interest-bearing deposits with banks 21,603 22,279Securities 146,524 118,716Investments in bank subsidiaries and associated corporations (1) 41,029 37,234Investments in other subsidiaries and associated corporations 76,358 73,785Assets purchased under reverse repurchase agreements and securities borrowed 134,037 123,755Loans, net of allowance for loan losses 554,173 526,078Other assets 171,622 152,422
$ 1,254,743 $ 1,068,533
Liabilities and shareholders’ equityDeposits $ 782,637 $ 681,509Net balances due to bank subsidiaries (1) 42,157 2,678Net balances due to other subsidiaries 36,421 36,594Other liabilities 297,261 254,678
1,158,476 975,459
Subordinated debentures 9,603 9,551Shareholders’ equity 86,664 83,523
$ 1,254,743 $ 1,068,533
(1) Bank refers primarily to regulated deposit-taking institutions and securities firms.
Condensed Statements of Income and Comprehensive IncomeFor the year ended
(Millions of Canadian dollars)
October 31
2020October 31
2019
Interest and dividend income (1) $ 23,596 $ 27,630Interest expense 9,548 14,966
Net interest income 14,048 12,664Non-interest income (2) 4,792 5,569
Total revenue 18,840 18,233
Provision for credit losses 3,888 1,730Non-interest expense 9,580 9,212
Income before income taxes 5,372 7,291Income taxes 1,139 1,568
Net income before equity in undistributed income of subsidiaries 4,233 5,723Equity in undistributed income of subsidiaries 7,199 7,137
Net income $ 11,432 $ 12,860
Other comprehensive income (loss), net of taxes (1,137) (1,441)
Total comprehensive income $ 10,295 $ 11,419
(1) Includes dividend income from investments in subsidiaries and associated corporations of $27 million (October 31, 2019 – $27 million).(2) Includes a nominal share of profit (loss) from associated corporations (October 31, 2019 – nominal).
Consolidated Financial Statements Royal Bank of Canada: Annual Report 2020 219

Note 32 Parent company information (continued)
Condensed Statements of Cash FlowsFor the year ended
(Millions of Canadian dollars)
October 31
2020October 31
2019
Cash flows from operating activitiesNet income $ 11,432 $ 12,860Adjustments to determine net cash from operating activities:
Change in undistributed earnings of subsidiaries (7,199) (7,137)Change in deposits, net of securitizations 101,128 39,238Change in loans, net of securitizations (30,833) (31,744)Change in trading securities 404 2,350Change in obligations related to assets sold under repurchase agreements and
securities loaned 26,716 12,449Change in assets purchased under reverse repurchase agreements and securities borrowed (10,282) (15,814)Change in obligations related to securities sold short (3,032) 797Other operating activities, net 685 (8,149)
Net cash from (used in) operating activities 89,019 4,850
Cash flows from investing activitiesChange in interest-bearing deposits with banks 676 (2,018)Proceeds from sales and maturities of investment securities 74,849 37,963Purchases of investment securities (101,551) (39,461)Net acquisitions of premises and equipment and other intangibles (1,243) (1,266)Change in cash invested in subsidiaries 1,484 332Change in net funding provided to subsidiaries 39,306 4,616
Net cash from (used in) investing activities 13,521 166
Cash flows from financing activitiesIssuance of subordinated debentures 2,750 1,500Repayment of subordinated debentures (3,000) (1,100)Issue of common shares, net of issuance costs 70 105Common shares purchased for cancellation (814) (1,030)Issue of preferred shares and other equity instruments, net of issuance costs 1,745 350Redemption of preferred shares and other equity instruments (1,508) (950)Dividends paid on shares and distributions paid on other equity instruments (6,333) (6,025)Repayment of lease liabilities (317)
Net cash from (used in) financing activities (7,407) (7,150)
Net change in cash and due from banks 95,133 (2,134)Cash and due from banks at beginning of year 14,264 16,398
Cash and due from banks at end of year $ 109,397 $ 14,264
Supplemental disclosure of cash flow informationAmount of interest paid $ 10,335 $ 14,574Amount of interest received 22,340 25,883Amount of dividends received 1,977 1,694Amount of income taxes paid 917 1,789
Note 33 Subsequent events
On November 2, 2020, we issued $1,250 million of LRCN Series 2, at a price per note of $1,000, with recourse limited to assets heldby a third party trustee in a consolidated trust. The trust assets in respect of LRCN Series 2 consist of $1,250 million of our Non-Cumulative 5-Year Rate Reset First Preferred Shares Series BR (Series BR) issued concurrently with LRCN Series 2 at a price of$1,000 per Series BR. LRCN Series 2 bear interest at a fixed rate of 4% per annum until February 24, 2026, and thereafter at a rateper annum, reset every fifth year, equal to the 5-Year Government of Canada Yield plus 3.617% until maturity on February 24, 2081.
220 Royal Bank of Canada: Annual Report 2020 Consolidated Financial Statements

Ten-year statistical review
Condensed Balance Sheets(Millions of Canadian dollars) (1) 2020 2019 2018 2017 2016 2015 2014 2013 2012 2011AssetsCash and due from banks $ 118,888 $ 26,310 $ 30,209 $ 28,407 $ 14,929 $ 12,452 $ 17,421 $ 15,550 $ 12,428 $ 12,428Interest-bearing deposits with banks 39,013 38,345 36,471 32,662 27,851 22,690 8,399 9,039 10,246 6,460Securities, net of applicable allowance (2) 275,814 249,004 222,866 218,379 236,093 215,508 199,148 182,710 161,602 167,022Assets purchased under reverse repurchase
agreements and securities borrowed 313,015 306,961 294,602 220,977 186,302 174,723 135,580 117,517 112,257 84,947Loans, net of allowance 660,992 618,856 576,818 542,617 521,604 472,223 435,229 408,850 378,241 347,530Other 216,826 189,459 173,768 169,811 193,479 176,612 144,773 126,079 149,180 175,446
Total assets $1,624,548 $1,428,935 $1,334,734 $1,212,853 $1,180,258 $1,074,208 $ 940,550 $ 859,745 $ 823,954 $ 793,833
LiabilitiesDeposits (3) $1,011,885 $ 886,005 $ 836,197 $ 789,036 $ 757,589 $ 697,227 $ 614,100 $ 563,079 $ 512,244 $ 479,102Other (3) 516,029 449,490 409,451 340,124 341,295 305,675 264,088 239,763 259,174 263,625Subordinated debentures 9,867 9,815 9,131 9,265 9,762 7,362 7,859 7,443 7,615 8,749Trust capital securities – – – – – – – – – 894
Total liabilities $1,537,781 $1,345,310 $1,254,779 $1,138,425 $1,108,646 $1,010,264 $ 886,047 $ 810,285 $ 779,033 $ 752,370
Equity attributable to shareholders 86,664 83,523 79,861 73,829 71,017 62,146 52,690 47,665 43,160 39,702
Non-controlling interest 103 102 94 599 595 1,798 1,813 1,795 1,761 1,761
Total equity 86,767 83,625 79,955 74,428 71,612 63,944 54,503 49,460 44,921 41,463
Total liabilities and equity $1,624,548 $1,428,935 $1,334,734 $1,212,853 $1,180,258 $1,074,208 $ 940,550 $ 859,745 $ 823,954 $ 793,833
Condensed Income Statements(Millions of Canadian dollars) (1) 2020 2019 2018 2017 2016 2015 2014 2013 2012 2011Net interest income (3) $ 20,835 $ 19,749 $ 17,952 $ 16,926 $ 16,531 $ 14,771 $ 14,116 $ 13,249 $ 12,439 $ 11,357Non-interest income (3), (4) 26,346 26,253 24,624 23,743 22,264 20,932 19,992 17,433 16,708 16,281Total revenue (4) 47,181 46,002 42,576 40,669 38,795 35,703 34,108 30,682 29,147 27,638Provision for credit losses (5) 4,351 1,864 1,307 1,150 1,546 1,097 1,164 1,237 1,299 1,133Insurance policyholder benefits, claims and
acquisition expense 3,683 4,085 2,676 3,053 3,424 2,963 3,573 2,784 3,621 3,358Non-interest expense (4) 24,758 24,139 22,833 21,794 20,526 19,020 17,661 16,214 14,641 14,167Net income from continuing operations 11,437 12,871 12,431 11,469 10,458 10,026 9,004 8,342 7,558 6,970Net loss from discontinued operations – – – – – – – – (51) (526)Net income $ 11,437 $ 12,871 $ 12,431 $ 11,469 $ 10,458 $ 10,026 $ 9,004 $ 8,342 $ 7,507 $ 6,444
Other Statistics – reported(Millions of Canadian dollars, exceptpercentages and per share amounts) (1) 2020 2019 2018 2017 2016 2015 2014 2013 2012 2011PROFITABILITY MEASURES (6)
Earnings per shares – basic $ 7.84 $ 8.78 $ 8.39 $ 7.59 $ 6.80 $ 6.75 $ 6.03 $ 5.53 $ 4.96 $ 4.25– diluted $ 7.82 $ 8.75 $ 8.36 $ 7.56 $ 6.78 $ 6.73 $ 6.00 $ 5.49 $ 4.91 $ 4.19
Return on common equity (7), (8) 14.2% 16.8% 17.6% 17.0% 16.3% 18.6% 19.0% 19.7% 19.6% 18.7%Return on risk-weighted assets (9) 2.10% 2.52% 2.55% 2.49% 2.34% 2.45% 2.52% 2.67% 2.70% 2.44%Efficiency ratio (4) 52.5% 52.5% 53.6% 53.6% 52.9% 53.3% 51.8% 52.8% 50.2% 51.3%
KEY RATIOSPCL on impaired loans as a % of average
net loans and acceptances (10) 0.24% 0.27% 0.20% 0.21% 0.28% 0.24% 0.27% 0.31% 0.35% 0.33%Net interest margin
(average earning assets, net) (3), (7) 1.55% 1.61% 1.64% 1.69% 1.70% 1.71% 1.86% 1.88% 1.97% 1.86%SHARE INFORMATION
Common shares outstanding (000s)– end of period 1,422,473 1,430,096 1,438,794 1,452,535 1,484,235 1,443,955 1,443,125 1,441,722 1,445,846 1,438,522
Dividends declared per common share $ 4.29 $ 4.07 $ 3.77 $ 3.48 $ 3.24 $ 3.08 $ 2.84 $ 2.53 $ 2.28 $ 2.08Dividend yield (11) 4.7% 4.1% 3.7% 3.8% 4.3% 4.1% 3.8% 4.0% 4.5% 3.9%Dividend payout ratio 55% 46% 45% 46% 48% 46% 47% 46% 46% 45%Book value per share $ 56.75 $ 54.41 $ 51.12 $ 46.41 $ 43.32 $ 39.51 $ 33.69 $ 29.87 $ 26.52 $ 24.25Common share price (RY on TSX) (12) $ 93.16 $ 106.24 $ 95.92 $ 100.87 $ 83.80 $ 74.77 $ 80.01 $ 70.02 $ 56.94 $ 48.62Market capitalization (TSX) (12) 132,518 151,933 138,009 146,554 124,476 107,925 115,393 100,903 82,296 69,934Market price to book value 1.64 1.95 1.88 2.17 1.93 1.89 2.38 2.34 2.15 2.00
CAPITAL MEASURES – CONSOLIDATED (13)Common Equity Tier 1 capital ratio 12.5% 12.1% 11.5% 10.9% 10.8% 10.6% 9.9% 9.6% n.a. n.a.Tier 1 capital ratio 13.5% 13.2% 12.8% 12.3% 12.3% 12.2% 11.4% 11.7% 13.1% n.a.Total capital ratio 15.5% 15.2% 14.6% 14.2% 14.4% 14.0% 13.4% 14.0% 15.1% n.a.Leverage ratio 4.8% 4.3% 4.4% 4.4% 4.4% 4.3% n.a. n.a. n.a. n.a.
(1) Effective November 1, 2019, we adopted IFRS 16 Leases. Results from periods prior to November 1, 2019 are reported in accordance with IAS 17 Leases in this 2020Annual Report. Effective November 1, 2018, we adopted IFRS 15 Revenue from Contracts with Customers. Results from periods prior to November 1, 2018 are reportedin accordance with IAS 18 Revenue in this 2020 Annual Report. Effective November 1, 2017, we adopted IFRS 9 Financial Instruments (IFRS 9). Results from periodsprior to November 1, 2017 are reported in accordance with IAS 39 Financial Instruments: Recognition and Measurement (IAS 39) in this 2020 Annual Report.
(2) Securities are comprised of trading and investment securities. Under IFRS 9, investment securities represent debt and equity securities at FVOCI and debt securities atamortized cost, net of the applicable allowance. Under IAS 39, investment securities represented available-for-sale securities and held-to-maturity securities.
(3) Commencing Q4 2019, the interest component and the accrued interest payable recorded on certain deposits carried at FVTPL previously presented in tradingrevenue and deposits, respectively are presented in net interest income and other liabilities respectively. As at November 1, 2016, comparative amounts have beenreclassified to conform with this presentation.
(4) Effective Q4 2017, service fees and other costs incurred in association with certain commissions and fees earned are presented on a gross basis in non-interestexpense. As at November 1, 2014, comparative amounts have been reclassified to conform with this presentation.
(5) Under IFRS 9, PCL relates primarily to loans, acceptances, and commitments, and also applies to all financial assets except for those classified or designated asFVTPL and equity securities designated as FVOCI. Prior to the adoption of IFRS 9, PCL related only to loans, acceptances, and commitments. PCL on loans,acceptances, and commitments is comprised of PCL on impaired loans (Stage 3 PCL under IFRS 9 and PCL on impaired loans under IAS 39) and PCL on performingloans (Stage 1 and Stage 2 PCL under IFRS 9 and PCL on loans not yet identified as impaired under IAS 39).
(6) Ratios for 2011-2012 represent continuing operations.(7) Average amounts are calculated using methods intended to approximate the average of the daily balances for the period. This includes Average common equity
used in the calculation of ROE. For further details, refer to the Key performance and non-GAAP measures section of the MD&A.(8) These measures may not have a standardized meaning under generally accepted accounting principles (GAAP) and may not be comparable to similar measures
disclosed by other financial institutions. For further details, refer to the Key performance and non-GAAP measures section of the MD&A.(9) Return on risk-weighted assets (RWA) for fiscal 2011 is based on RWA reported under Canadian Generally Accepted Accounting Policies (CGAAP) and Income reported
under IFRS.(10) PCL on impaired loans represents Stage 3 PCL under IFRS 9 and PCL on impaired loans under IAS 39. Stage 3 PCL under IFRS 9 is comprised of lifetime credit losses
of credit-impaired loans, acceptances and commitments.(11) Defined as dividends per common share divided by the average of the high and low share price in the relevant period.(12) Based on TSX closing market price at period-end.(13) Effective 2013, we calculated the capital and leverage ratios using the Basel III framework unless otherwise stated. 2011-2012 capital and leverage ratios were
calculated using the Basel II framework. Capital and leverage ratios for 2011 were determined under CGAAP and Basel II framework.n.a. not applicable
Ten-year statistical review Royal Bank of Canada: Annual Report 2020 221

Glossary
AcceptancesA bill of exchange or negotiable instrumentdrawn by the borrower for payment atmaturity and accepted by a bank. Theacceptance constitutes a guarantee ofpayment by the bank and can be traded in themoney market. The bank earns a “stampingfee” for providing this guarantee.
Allowance for credit losses (ACL)The amount deemed adequate bymanagement to absorb expected credit lossesas at the balance sheet date. The allowance isestablished for all financial assets subject toimpairment assessment, including certainloans, debt securities, customers’ liabilityunder acceptances, financial guarantees, andundrawn loan commitments. The allowance ischanged by the amount of provision for creditlosses recorded, which is charged to income,and decreased by the amount of write-offs netof recoveries in the period.
Asset-backed securities (ABS)Securities created through the securitizationof a pool of assets, for example auto loans orcredit card loans.
Assets under administration (AUA)Assets administered by us, which arebeneficially owned by clients, as at October 31,unless otherwise noted. Services provided inrespect of assets under administration are ofan administrative nature, includingsafekeeping, collecting investment income,settling purchase and sale transactions, andrecord keeping.
Assets under management (AUM)Assets managed by us, which are beneficiallyowned by clients, as at October 31, unlessotherwise noted. Services provided in respectof assets under management include theselection of investments and the provision ofinvestment advice. We have assets undermanagement that are also administered by usand included in assets under administration.
Attributed capitalAttributed capital is based on the Basel IIIregulatory capital requirements and economiccapital.
Auction rate securities (ARS)Debt securities whose interest rates areregularly reset through an auction process.
Average earning assets, netAverage earning assets include interest-bearing deposits with other banks, securities,net of applicable allowance, assets purchasedunder reverse repurchase agreements andsecurities borrowed, loans, net of allowance,cash collateral and margin deposits. Insuranceassets, and all other assets not specified areexcluded. The averages are based on the dailybalances for the period.
Basis point (bp)One one-hundredth of a percentage point(.01%).
CollateralAssets pledged as security for a loan or otherobligation. Collateral can take many forms,such as cash, highly rated securities, property,inventory, equipment and receivables.
Collateralized debt obligation (CDO)Securities with multiple tranches that areissued by structured entities andcollateralized by debt obligations includingbonds and loans. Each tranche offers a varying
degree of risk and return so as to meetinvestor demand.
Commercial mortgage-backed securities(CMBS)Securities created through the securitizationof commercial mortgages.
Commitments to extend creditUnutilized amount of credit facilities availableto clients either in the form of loans, bankers’acceptances and other on-balance sheetfinancing, or through off-balance sheetproducts such as guarantees and letters ofcredit.
Common Equity Tier 1 (CET1) capitalA regulatory Basel III capital measurecomprised mainly of common shareholders’equity less regulatory deductions andadjustments for goodwill and intangibles,defined benefit pension fund assets, shortfallin allowances and other specified items.
Common Equity Tier 1 capital ratioA risk-based capital measure calculated asCET1 capital divided by risk-weighted assets.
Covered bondsFull recourse on-balance sheet obligationsissued by banks and credit institutions thatare fully collateralized by assets over whichinvestors enjoy a priority claim in the event ofan issuer’s insolvency.
Credit default swaps (CDS)A derivative contract that provides thepurchaser with a one-time payment should thereferenced entity/entities default (or a similartriggering event occur).
DerivativeA contract between two parties, whichrequires little or no initial investment andwhere payments between the parties aredependent upon the movements in price of anunderlying instrument, index or financial rate.Examples of derivatives include swaps,options, forward rate agreements and futures.The notional amount of the derivative is thecontract amount used as a reference point tocalculate the payments to be exchangedbetween the two parties, and the notionalamount itself is generally not exchanged bythe parties.
Dividend payout ratioCommon dividends as a percentage of netincome available to common shareholders.
Earnings per share (EPS), basicCalculated as net income available to commonshareholders divided by the average numberof shares outstanding.
Earnings per share (EPS), dilutedCalculated as net income available to commonshareholders divided by the average numberof shares outstanding adjusted for the dilutiveeffects of stock options and other convertiblesecurities.
Expected credit lossesThe difference between the contractual cashflows due to us in accordance with therelevant contractual terms and the cash flowsthat we expect to receive, discounted to thebalance sheet date.
Fair valueFair value of a financial instrument is the pricethat would be received to sell an asset or paidto transfer a liability in an orderly transactionbetween market participants at themeasurement date.
Funding Valuation AdjustmentFunding valuation adjustments are calculatedto incorporate cost and benefit of funding inthe valuation of uncollateralized and under-collateralized OTC derivatives. Futureexpected cash flows of these derivatives arediscounted to reflect the cost and benefit offunding the derivatives by using a fundingcurve, implied volatilities and correlations asinputs.
Guarantees and standby letters of creditThese primarily represent irrevocableassurances that a bank will make payments inthe event that its client cannot meet itsfinancial obligations to third parties. Certainother guarantees, such as bid andperformance bonds, represent non-financialundertakings.
HedgeA risk management technique used to mitigateexposure from market, interest rate or foreigncurrency exchange risk arising from normalbanking operations. The elimination orreduction of such exposure is accomplished byestablishing offsetting positions. For example,assets denominated in foreign currencies canbe offset with liabilities in the same currenciesor through the use of foreign exchangehedging instruments such as futures, optionsor foreign exchange contracts.
Hedge fundsA type of investment fund, marketed toaccredited high net worth investors, that issubject to limited regulation and restrictionson its investments compared to retail mutualfunds, and that often utilize aggressivestrategies such as selling short, leverage,program trading, swaps, arbitrage andderivatives.
High-quality liquid assets (HQLA)Assets are considered to be HQLA if they canbe easily and immediately converted into cashat little or no loss of value during a time ofstress.
Impaired loansLoans are classified as impaired when therehas been a deterioration of credit quality tothe extent that management no longer hasreasonable assurance of timely collection ofthe full amount of principal and interest inaccordance with the contractual terms of theloan agreement. Credit card balances are notclassified as impaired as they are directlywritten off after payments are 180 days pastdue.
International Financial Reporting Standards(IFRS)IFRS are principles-based standards,interpretations and the framework adopted bythe International Accounting Standards Board.
Leverage RatioA Basel III regulatory measure, the ratiodivides Tier 1 capital by the sum of total assetsplus specified off-balance sheet items.
Liquidity Coverage Ratio (LCR)The Liquidity Coverage Ratio is a Basel IIImetric that measures the sufficiency of HQLAavailable to meet net short-term financialobligations over a thirty day period in an acutestress scenario.
222 Royal Bank of Canada: Annual Report 2020 Glossary

Loan-to-value (LTV) ratioCalculated based on the total facility amountfor the residential mortgage and RBCHomeline Plan® product divided by the valueof the related residential property.
Master netting agreementAn agreement between us and a counterpartydesigned to reduce the credit risk of multiplederivative transactions through the creation ofa legal right of offset of exposure in the eventof a default.
Net interest incomeThe difference between what is earned onassets such as loans and securities and whatis paid on liabilities such as deposits andsubordinated debentures.
Net interest margin (on average earningassets, net)Calculated as net interest income divided byaverage earning assets, net.
Normal course issuer bid (NCIB)A program for the repurchase of our ownshares for cancellation through a stockexchange that is subject to the various rules ofthe relevant stock exchange and securitiescommission.
Notional amountThe contract amount used as a reference pointto calculate payments for derivatives.
Off-balance sheet financial instrumentsA variety of arrangements offered to clients,which include credit derivatives, written putoptions, backstop liquidity facilities, stablevalue products, financial standby letters ofcredit, performance guarantees, creditenhancements, mortgage loans sold withrecourse, commitments to extend credit,securities lending, documentary andcommercial letters of credit, note issuancesand revolving underwriting facilities, securitieslending indemnifications and indemnifications.
Office of the Superintendent of FinancialInstitutions Canada (OSFI)The primary regulator of federally charteredfinancial institutions and federallyadministered pension plans in Canada. OSFI’smission is to safeguard policyholders,depositors and pension plan members fromundue loss.
Operating leverageThe difference between our revenue growthrate and non-interest expense growth rate.
OptionsA contract or a provision of a contract thatgives one party (the option holder) the right,but not the obligation, to perform a specifiedtransaction with another party (the optionissuer or option writer) according to specifiedterms.
Provision for credit losses (PCL)The amount charged to income necessary tobring the allowance for credit losses to a leveldetermined appropriate by management. This
includes provisions on performing andimpaired financial assets.
RBC Homeline Plan® productsThis is comprised of residential mortgages andsecured personal loans whereby the borrowerpledges real estate as collateral.
Repurchase agreementsThese involve the sale of securities for cashand the simultaneous repurchase of thesecurities for value at a later date. Thesetransactions normally do not constituteeconomic sales and therefore are treated ascollateralized financing transactions.
Return on common equity (ROE)Net income available to commonshareholders, expressed as a percentage ofaverage common equity.
Reverse repurchase agreementsThese involve the purchase of securities forcash and the simultaneous sale of thesecurities for value at a later date. Thesetransactions normally do not constituteeconomic sales and therefore are treated ascollateralized financing transactions.
Risk-weighted assets (RWA)Assets adjusted by a regulatory risk-weightfactor to reflect the riskiness of on andoff-balance sheet exposures. Certain assetsare not risk-weighted, but deducted fromcapital. The calculation is defined byguidelines issued by OSFI. For more details,refer to the Capital management section.
Securities lendingTransactions in which the owner of a securityagrees to lend it under the terms of aprearranged contract to a borrower for a fee.The borrower must collateralize the securityloan at all times. An intermediary such as abank often acts as agent for the owner of thesecurity. There are two types of securitieslending arrangements: lending with andwithout credit or market risk indemnification.In securities lending without indemnification,the bank bears no risk of loss. For transactionsin which the bank provides an indemnification,it bears the risk of loss if the borrower defaultsand the value of the collateral declinesconcurrently.
Securities sold shortA transaction in which the seller sellssecurities and then borrows the securities inorder to deliver them to the purchaser uponsettlement. At a later date, the seller buysidentical securities in the market to replacethe borrowed securities.
SecuritizationThe process by which various financial assetsare packaged into newly issued securitiesbacked by these assets.
Standardized ApproachRisk weights prescribed by OSFI are used tocalculate risk-weighted assets for the creditrisk exposures. Credit assessments by OSFI-recognized external credit rating agencies ofS&P, Moody’s, Fitch and DBRS are used to risk-
weight our Sovereign and Bank exposuresbased on the standards and guidelines issuedby OSFI. For our Business and Retailexposures, we use the standard risk weightsprescribed by OSFI.
Structured entitiesA structured entity is an entity in which votingor similar rights are not the dominant factor indeciding who controls the entity, such as whenthe activities that significantly affect theentity’s returns are directed by means ofcontractual arrangements. Structured entitiesoften have restricted activities, narrow andwell defined objectives, insufficient equity tofinance their activities, and financing in theform of multiple contractually-linkedinstruments.
Taxable equivalent basis (teb)Income from certain specified tax advantagedsources (eligible Canadian taxable corporatedividends) is increased to a level that wouldmake it comparable to income from taxablesources. There is an offsetting adjustment inthe tax provision, thereby generating the sameafter-tax net income.
Tier 1 capitalTier 1 capital comprises predominantly of CET1capital, with additional Tier 1 items such aspreferred shares, limited recourse capitalnotes and non-controlling interests insubsidiaries Tier 1 instruments.
Tier 2 capitalTier 2 capital consists mainly of subordinateddebentures that meet certain criteria, certainloan loss allowances and non-controllinginterests in subsidiaries’ Tier 2 instruments.
Total capital and total capital ratioTotal capital is defined as the total of Tier 1and Tier 2 capital. The total capital ratio iscalculated by dividing total capital by risk-weighted assets.
TrancheA security class created whereby the risks andreturns associated with a pool of assets arepackaged into several classes of securitiesoffering different risk and return profiles fromthose of the underlying asset pool. Tranchesare typically rated by ratings agencies, andreflect both the credit quality of underlyingcollateral as well as the level of protectionbased on the tranches’ relative subordination.
Unattributed capitalUnattributed capital represents commonequity in excess of common equity attributedto our business segments and is reported inthe Corporate Support segment.
Value-at-Risk (VaR)A generally accepted risk-measurementconcept that uses statistical models based onhistorical information to estimate within agiven level of confidence the maximum loss inmarket value we would experience in ourtrading portfolio from an adverse one-daymovement in market rates and prices.
Glossary Royal Bank of Canada: Annual Report 2020 223

Principal subsidiaries
(Millions of Canadian dollars) As at October 31, 2020
Principal subsidiaries (1) Principal office address (2)
Carrying value ofvoting shares owned
by the Bank (3)
Royal Bank Holding Inc. Toronto, Ontario, Canada $ 67,517RBC Direct Investing Inc. Toronto, Ontario, CanadaRBC Insurance Holdings Inc. Mississauga, Ontario, Canada
RBC Life Insurance Company Mississauga, Ontario, CanadaR.B.C. Holdings (Bahamas) Limited Nassau, New Providence, Bahamas
RBC Caribbean Investments Limited George Town, Grand Cayman, Cayman IslandsRoyal Bank of Canada Insurance
Company Ltd. St. Michael, BarbadosInvestment Holdings (Cayman) Limited George Town, Grand Cayman, Cayman Islands
RBC (Barbados) Funding Ltd. St. Michael, BarbadosCapital Funding Alberta Limited Calgary, Alberta, Canada
RBC Global Asset Management Inc. Toronto, Ontario, CanadaRBC Investor Services Trust Toronto, Ontario, CanadaRBC Investor Services Bank S.A. Esch-sur-Alzette, LuxembourgRBC (Barbados) Trading Bank Corporation St. James, Barbados
RBC US Group Holdings LLC (2) Toronto, Ontario, Canada 24,062RBC USA Holdco Corporation (2) New York, New York, U.S.
RBC Capital Markets, LLC (2) New York, New York, U.S.City National Bank Los Angeles, California, U.S.
RBC Dominion Securities Limited Toronto, Ontario, Canada 11,126RBC Dominion Securities Inc. Toronto, Ontario, Canada
RBC Europe Limited London, England 2,738
Royal Bank Mortgage Corporation Toronto, Ontario, Canada 1,398
The Royal Trust Company Montreal, Quebec, Canada 954
RBC Holdings (Channel Islands) Limited Jersey, Channel Islands 912Royal Bank of Canada (Channel Islands) Limited Guernsey, Channel Islands
Royal Trust Corporation of Canada Toronto, Ontario, Canada 337
(1) The Bank directly or indirectly controls each subsidiary.(2) Each subsidiary is incorporated or organized under the laws of the state or country in which the principal office is situated, except for RBC US Group Holdings LLC and
RBC USA Holdco Corporation which are incorporated under the laws of the State of Delaware, U.S. and RBC Capital Markets, LLC, which is organized under the laws of theState of Minnesota, U.S.
(3) The carrying value of voting shares is stated as the Bank’s equity in such investments.
224 Royal Bank of Canada: Annual Report 2020 Principal subsidiaries

Shareholder Information
Corporate headquartersStreet address:Royal Bank of Canada200 Bay StreetToronto, Ontario M5J 2J5CanadaTel: 1-888-212-5533
Mailing address:P.O. Box 1Royal Bank PlazaToronto, Ontario M5J 2J5Canadawebsite: rbc.com
Transfer Agent and RegistrarMain Agent:Computershare Trust Companyof Canada1500 Robert-Bourassa Blvd.Suite 700Montreal, Quebec H3A 3S8CanadaTel: 1-866-586-7635 (Canada andthe U.S.) or 514-982-7555(International)Fax: 514-982-7580website: computershare.com/rbc
Co-Transfer Agent (U.S.):Computershare TrustCompany, N.A.250 Royall StreetCanton, Massachusetts 02021U.S.A.
Co-Transfer Agent (U.K.):Computershare InvestorServices PLCSecurities Services – RegistrarsP.O. Box 82, The Pavilions,Bridgwater Road,Bristol BS99 6ZZU.K.
Stock exchange listings(Symbol: RY)
Common shares are listed on:Canada – Toronto StockExchange (TSX)U.S. – New York Stock Exchange(NYSE)Switzerland – Swiss Exchange(SIX)
Preferred shares AZ, BB, BD, BF,BH, BI, BJ, BK, BM and BO arelisted on the TSX. The relateddepository shares of the seriesC-2 preferred shares are listedon the NYSE.
Valuation day priceFor Canadian income taxpurposes, Royal Bank ofCanada’s common stock wasquoted at $29.52 per share onthe Valuation Day (December 22,1971). This is equivalent to $7.38per share after adjusting for thetwo-for-one stock split of March1981 and the two-for-one stocksplit of February 1990. Theone-for-one stock dividends inOctober 2000 and April 2006 didnot affect the Valuation Dayamount for our common shares.
Shareholder contactsFor dividend information,change in share registration oraddress, lost stockcertificates, tax forms,estate transfers or dividendreinvestment, please contact:Computershare Trust Companyof Canada100 University Avenue, 8th FloorToronto, Ontario M5J 2Y1Canada
Tel: 1-866-586-7635 (Canada andthe U.S.) or 514-982-7555(International)Fax: 1-888-453-0330 (Canada andthe U.S.) or 416-263-9394(International)email: [email protected]
Financial analysts, portfoliomanagers, institutionalinvestorsFor financial informationinquiries, please contact:Investor RelationsRoyal Bank of Canada200 Bay StreetSouth TowerToronto, Ontario M5J 2J5CanadaTel: 416-955-7802or visit our website atrbc.com/investorrelations
Direct deposit serviceShareholders in Canada and theU.S. may have their commonshare dividends depositeddirectly to their bank accountby electronic funds transfer. Toarrange for this service, pleasecontact our Transfer Agent andRegistrar, Computershare TrustCompany of Canada.
Eligible dividend designationFor purposes of the Income TaxAct (Canada) and anycorresponding provincial andterritorial tax legislation, alldividends (and deemeddividends) paid by RBC toCanadian residents on both itscommon and preferred shares,are designated as “eligibledividends”, unless statedotherwise.
Common share repurchasesWe are engaged in a NormalCourse Issuer Bid (NCIB) whichallows us to repurchase forcancellation, up to 20 millioncommon shares during theperiod spanning from March 2,2020 to March 1, 2021, when thebid expires, or such earlier dateas we may complete thepurchases pursuant to ourNotice of Intention filed with theToronto Stock Exchange.
We determine the amount andtiming of the purchases underthe NCIB, subject to priorconsultation with the Office ofthe Superintendent of FinancialInstitutions Canada. For furtherdetails, refer to the Capitalmanagement section.
A copy of our Notice of Intentionto file a NCIB may be obtained,without charge, by contactingour Corporate Secretary at ourToronto mailing address.
2021 Quarterly earningsrelease datesFirst quarter February 24Second quarter May 27Third quarter August 25Fourth quarter December 1
2021 Annual MeetingThe Annual Meeting of CommonShareholders will be held onThursday, April 8, 2021
Dividend dates for 2021Subject to approval by the Board of Directors
Recorddates
Paymentdates
Common and preferred sharesseries AZ, BB, BD, BF, BH, BI, BJ,BK, BM and BO
January 26April 22July 26October 26
February 24May 21August 24November 24
Preferred shares series C-2(US$)
January 26April 27July 27October 26
February 5May 7August 6November 5
GovernanceSummaries of the significant ways in which corporate governancepractices followed by RBC differ from corporate governancepractices required to be followed by U.S. domestic companiesunder the NYSE listing standards are available on our website atrbc.com/governance.
Information contained in or otherwise accessible through the websites mentioned in this report to shareholders does not form a part of this report. All referencesto websites are inactive textual references and are for your information only.
Trademarks used in this report include the LION & GLOBE Symbol, ROYAL BANK OF CANADA, RBC, RBC CAPITAL MARKETS, RBC CAPITAL TRUST, RBC FUTURELAUNCH, RBC GLOBAL ASSET MANAGEMENT, RBC INSURANCE, RBC HOMELINE PLAN, RBC REWARDS, RBC WEALTH MANAGEMENT, MYADVISOR, NOMI FIND & SAVE,INVESTEASE, BOREALIS AI, AIDEN, ADVISOR’S VIRTUAL ASSISTANT (AVA), MYADVISOR, OWNR, NOMI, NOMI INSIGHTS, RBC INSIGHT EDGE and RESPECT AI which aretrademarks of Royal Bank of Canada used by Royal Bank of Canada and/or by its subsidiaries under license. All other trademarks mentioned in this report whichare not the property of Royal Bank of Canada, are owned by their respective holders.
Shareholder information Royal Bank of Canada: Annual Report 2020 225

81104 (12/2020)


