Reinvestigating the Reciprocal Relationship between Democracy and Income Inequality
Carl Henrik Knutsen*
University of Oslo
Abstract: Few social science relationships have spawned as much interest -‐ or as many elaborate theoretical models and arguments -‐ as that between democracy and income inequality. However, the empirical literature has generally employed statistical models based on problematic assumptions, and has produced quite mixed results. Hence, this paper makes an important empirical contribution by applying models that, for instance, account for endogeneity biases and control for country-‐specific effects. Despite being correlated, there is very little evidence of any effect of income inequality on level of democracy once employing appropriate model specifications. Furthermore, there is no robust evidence that inequality systematically affects either democratization prospects or democratic stability. In contrast, there is evidence that democracy reduces income inequality when inequality is proxied by share of income going to wages. However, also this effect is sensitive to the choice of inequality measure. Democracy does, for instance, not reduce inequalities in disposable household incomes. JEL classification: D02; D63; O10; P00 Keywords: Democracy; Income Inequality; Democratization; Democratic stability; Wage income; Redistribution The author would like to thank Sirianne Dahlum, Abel Escriba Folch, Christian Houle, Kalle Moene, Gerardo Munck, Andrea Presbitero, Asmund Rygh, Svend-Erik Skaaning, Tore Wig, Simone Wegmann and anonymous reviewers, as well as participants at the “Democracy and Democratization in Comparative Perspective Workshop” at Aarhus University, the “Constitutions, Cultures, Practices Workshop” at the University of Oslo, and the 2nd Annual EPSA Conference in Berlin, for very helpful comments and suggestions. A special thanks to Lars Petter Berg and Selemon Negash for excellent research assistance.
* Address: Department of Political Science, University of Oslo, Eilert Sundts hus, Moltke Moes vei 31, 0851 Oslo, Norway. (Phone: +47 228 54244. Email: [email protected]).
REVIEW OF ECONOMICS AND INSTITUTIONS, Vol. 6, Issue 2 - Summer-Fall 2015, Article 1
1 Introduction
Does democracy reduce income inequality? Or, does income inequalityaffect the prospects for democratization or democratic survival? The empir-ical analysis in this paper revisits these important questions. It contributesto the literature by accounting for the possible two-way causal relationshipbetween regime type and income inequality, but also by acknowledging thatcountry- and time-specific factors, sample selection biases, and choice ofregime and inequality measures may influence results.
Few social science relationships have generated as much interest as thatbetween democracy and income inequality, resulting in numerous theoreti-cal accounts. Several scholars have, quite convincingly, argued that democ-racy thrives in more egalitarian contexts. However, influential contribu-tions have also highlighted mechanisms through which high income in-equality could spur democratization (e.g., Acemoglu and Robinson 2006).Similarly, an extensive literature explains how democracy may reduce in-come inequality. But, models producing this implication may rely on toosimplistic assumptions regarding political processes in democracies (e.g.,Ansell and Samuels 2010), and technological and other structural factorscould matter far more for inequality than political factors (Mulligan et al.2004). These ambiguities are reflected in the empirical literature, where dif-ferent contributions find diverging results both for the effect of income in-equality on democracy and of democracy on inequality.
The lack of any robust aggregate relationship between inequality anddemocracy might stem from the relationship being highly contingent onother factors, such as opposition groups’ capabilities in overcoming collec-tive action problems or economic openness (see, e.g., Haggard and Kauf-man 2012; Freeman and Quinn 2012). Nevertheless, previous studies – of-ten relying on small samples or improperly specified models – may simplyhave arrived at the wrong conclusions on whether income inequality hasany net effect on level of democracy (or vice versa). Few empirical studieshave systematically taken endogeneity into account (but, see Rubinson andQuinlan 1977; Bollen and Jackman 1985; Burkhart 1997, 2007), despite plau-sible theoretical arguments for a two-way causal relationship. Furthermore,most studies have included only small subsets of the world’s countries andused cross-sectional data or time series for a handful years (but, see Houle2009; Teorell 2010; Timmons 2010; Acemoglu et al. 2013). This could leadto estimates with low reliability and to sample-selection biases affecting re-sults.
This paper reinvestigates the relationship(-s) between income inequalityand democracy by employing models that adjust for the above-mentionedissues. Hence, it makes an empirical contribution to a field already rich inelaborate theoretical models. Section 2 briefly reviews arguments and re-sults from the literature. Section 3 presents the data material and discusses
Knutsen: Reinvestigating the Reciprocal Relationship between Democracy and Income Inequality
salient methodological issues. Section 4 first presents empirical models that– like in most of the literature – assume one-way causal relationships. There-after, it reports more proper models accounting for endogeneity. There is norobust effect of income inequality, neither on democracy level, democratiza-tion probability nor democratic stability. In contrast, democracy seeminglyreduces income inequality when the latter is proxied the share of incomegoing to wages (see also Rodrik 1999). But, it does, for example, not re-duce inequalities in disposable household incomes. There are some (non-robust) indications that one-party dictatorships pursue more progressiveredistributive policies than democracies.
2 Arguments and results from the literature
2.1 Income inequality affects democracy
At least since de Tocqueville, one prominent notion has been that “ex-treme disparities reduce the sense of community and legitimacy upon whichdemocracy is supposed to rest” (Bollen and Jackman 1985, 440). In otherwords, high income inequality generates unfavorable conditions for democ-racy. Lipset (1959), for example, argues that democracy is less tenable insocieties with high levels of social conflict, which in turn is generated byhigh inequality. A high concentration of economic resources may also un-dermine democracy, or at least the “quality of democracy” (Diamond andMorlino 2005), through increasing the concentration of political resources –for example in terms of influence over legislators, the judiciary, and the me-dia (see, e.g., Dahl 1989; Grossman and Helpman 2001; Przeworski 2010).
Political-economic models also suggest that income inequality affectsregime type: Under democracy, the relatively poor median voter deter-mines policy, preferring higher tax rates and more redistribution than richvoters (Meltzer and Richard 1981). In right-wing dictatorships, in contrast,the rich control government, inducing lower taxes and less redistribution.Hence, different social groups have clear preference-rankings over regimetypes, and income inequality may crucially affect the willingness (and thecapabilities) of actors to fight for their favored regime. Despite these com-mon assumptions, different political-economic models produce conflictingimplications on exactly how inequality affects democratization prospects:
Boix (2003), for example, proposes a non-linear relationship, drawing ona model where there is asymmetric information on whether the rich eliteis actually capable of suppressing the poor. Yet, lower inequality most of-ten induces higher probability of democratization in Boix’ model; the richhave less to lose from the poor determining tax rates in egalitarian societies.Rich elites therefore more easily agree to demands for democracy, withoutrisking a fight, when inequality is low. In contrast, Acemoglu and Robin-
http://www.rei.unipg.it/rei/article/view/173 3
REVIEW OF ECONOMICS AND INSTITUTIONS, Vol. 6, Issue 2 - Summer-Fall 2015, Article 1
son’s (2000) model implies that higher inequality increases democratizationchances. In unequal societies the poor have (particularly) much to gainfrom democratization, and the rich are unable to credibly commit to futureredistribution under dictatorship. In a later study, Acemoglu and Robin-son (2006) propose that the combination of lower demand for democracyand the higher willingness by elites to supply democracy in egalitarian soci-eties – and the opposite in inegalitarian societies – generate a hump-shapedrelationship between inequality and democratization probability. Yet, theabove-discussed models all rely on potentially problematic assumptions,for instance that non-elite actors are able to solve collective action problemswhen challenging existing regimes (Kuran 1989; Houle 2009; Haggard andKaufman 2012), or by failing to distinguish distinct elite groups with verydifferent interests (Ansell and Samuels 2010). Thus, it remains unclear inwhat direction we would expect income inequality to affect democratiza-tion chances (and level of democracy), and how strong we should expect apotential link to be.
The evidence on the relationship between income inequality and democ-racy is then also mixed. Bollen and Jackman (1985, 1995) find no robust rela-tionship, whereas Muller (1988, 1995), using alternative specifications, findsthat high inequality reduces democratization probability. Boix (2003) andBoix and Stokes (2003) also report that low inequality induces democratiza-tion, using Gini coefficients on income inequality and the “Family Farms”measure from Vanhanen (1997). However, Ansell and Samuels (2010) findthat whereas lower land inequality indeed enhances democratization prosp-ects (see also Ziblatt 2008), lower income inequality may have the opposite ef-fect. Yet, even the estimated impact of income inequality, more specifically,may depend on choice of measure; Przeworski et al. (2000) find that low in-come inequality induces democratization – but only when using wage andcapital shares of income as proxies. Other recent contributions argue thatthe links between income inequality and democracy only operate under cer-tain conditions – for example, in countries that are strongly integrated in theglobal economy and financial system (e.g., Freeman and Quinn 2012) – thusexplaining the non-robust net relationship. Regarding democratic survival,Przeworski et al. (2000) and Houle (2009) report that high income inequalitydestabilizes democracies, although other studies fail to identify a clear re-lationship between high inequality and democratic reversals (Teorell 2010).Still, most these studies have in common is that they do not account prop-erly for inequality perhaps being endogenous to regime type, and this mayaffect the reported results.
2.2 Democracy affects income inequality
To illustrate the above point, Houle – who proposes a democracy-stabiliz-ing effect of low inequality – notes that “most stable democracies that are
Knutsen: Reinvestigating the Reciprocal Relationship between Democracy and Income Inequality
poor turn out to be very equal. Some examples include India, Costa Rica,Uruguay, Jamaica, Mauritius, Papua New Guinea, and Mongolia” (Houle2009, 595). But, consider one of Houle’s examples, Mauritius. This Africanisland-state was quite inegalitarian at decolonization. Mauritian society wasagrarian, with the most important export product being sugar produced onlarge plantations. The plantation owners – the “Grande Blanches” of Euro-pean origin – constituted only 1-2 percent of the population, but accountedfor much of national income. Democracy seems to have introduced pres-sures for redistribution, however: From 1965 to 1987 Mauritus’ Gini coeffi-cient was reduced from 0.50 to 0.37, likely affected by redistributive policespromoted by the regime (Brautigam 1997, 58). Various democratic Mau-ritian governments expanded schooling opportunities and health-care ac-cess, and introduced progressive taxes. Furthermore, the regime spent taxrevenue from sugar production on building up an effective textile sector,where poor women constituted a majority of workers. Hence, the proposi-tion that democracy is stabilized by low inequality is, at best, only part ofthe Mauritian story.
Interestingly this interpretation of Mauritian history – emphasizing thatdemocracy reduced inequality – is congruent with contributions to the the-oretical literature on how inequality affects democracy. The main reason whyinequality matters for democratization in the models of Boix and Acemogluand Robinson is that both elites and non-elites consider democracy a vehiclefor progressive redistribution. Acemoglu et al. (2013) finds that democracyincreases the share of income going to taxes (but, see also Aidt and Jensen2013), which might, in turn, be used for progressive redistribution. Theauthors also replicate the result that democracy increases (secondary level)education spending, which likely has progressive consequences (see alsoSaint-Paul and Verdier 1993; Lake and Baum 2001). Further, Lindert (2005)reports that the expansion of democratic participation rights induced highersocial welfare spending and widened access to education in 19th centuryEurope, thus contributing to reduced inequality.
However, democratization processes of later decades have not been char-acterized by gradual expansion of participation rights in previously oli-garchic regimes, but rather by transitions from various regimes withoutcompetitive elections towards democracies with formal participation rightsfor all citizens (Miller 2014). The predicted effects on inequality from suchtransitions are not as clear cut, and depend, for instance, on the type ofdictatorship prior to democratization. Single-party regimes with winningcoalitions drawn from the working classes might produce more extensiveredistribution than democracies (e.g., Boix 2003; Acemoglu and Robinson2006). Indeed, the survey in Gradstein and Milanovic (2004) indicates thatthere may be a more pronounced effect of franchise expansion than of otherdemocratiza-tion-related processes on inequality. The considerations abovecould contribute to explain why Mulligan et al. (2004), employing data from
http://www.rei.unipg.it/rei/article/view/173 5
REVIEW OF ECONOMICS AND INSTITUTIONS, Vol. 6, Issue 2 - Summer-Fall 2015, Article 1
1960–1990, find no robust effect of democracy on a range of redistributivepolicies (see also, e.g., Cheibub 1998).
More generally, democratic politics does not necessarily follow the “dis-tributional-game” pattern of the models by Boix and Acemoglu and Robin-son, but is often more complex with multiple issue dimensions and class-cutting alliances (e.g., Bollen and Jackman 1985; Ansell and Samuels 2010).Further – as detailed in a large political science literature on democracy indeveloping country contexts (e.g., Chabal and Daloz 1999), and recentlyhighlighted by Acemoglu et al. (2013) and Albertus and Menaldo (2014) –a de jure democracy may be congruent with de facto concentration of powerin the elites’ hands, leading to “captured democracy” with little redistribu-tion.1 Finally, autocracies may not behave as in standard political economicmodel either; autocracies differ in terms of their institutional make-up andother characteristics, and several autocratic regimes have strong reasons topursue redistributive policies to remain in power (Bueno de Mesquita etal. 2003; Gandhi 2008; Magaloni 2006; Haggard and Kaufman 2008; Knut-sen and Rasmussen 2014). Taking such factors into account may alter theexpected redistributive effect of democracy.
Despite an uncertain effect on progressive transfers, democracy may affectinequality through other channels. For instance, democracy may reducepre-tax income inequality through increasing wages for workers and reduc-ing the income-share going to capital owners. Rodrik (1999) and Przeworskiet al. (2000) find that democracy enhances wages partly because of higherproductivity, but also because of higher income-shares for labor (but, seeAcemoglu et al. 2013, Appendix A). One reason could be that democraciesmore strongly protect freedom of association (Møller and Skaaning 2013),leaving employees with better opportunities to organize and bargain forhigher wages than under dictatorship (see Deyo 1998).
A number of empirical studies have found that democracy generatesmore egalitarian income distributions (e.g., Muller 1988; Li et al. 1998;Chong 2004). However, other studies indicate the relationship is inverselyU-shaped, and several early studies find no robust effect (see Sirowy andInkeles 1990; Gradstein and Milanovic 2004). Also the recent and meth-odologically solid study by Timmons (2010) finds no robust effect of democ-racy on income inequality. Yet, as for studies of how inequality affect regimetype, most studies on how regime type affect inequality have failed to prop-erly account for endogeneity biases, country- and time-fixed effects, andpotential sample selection biases. These are all addressed below when em-pirically reinvestigating how democracy affects income inequality, and vice
1 Interestingly, Acemoglu et al. (2013) also suggest that democracy may increase in-come inequality through promoting structural transformations to the economy (notablyfrom agriculture to manufacturing), and through reducing barriers to entry for new en-trepreneurs. This may, in turn, lead to larger market-induced inequalities in gross in-come, with a new group of citizens making a very good living under democracy.
Knutsen: Reinvestigating the Reciprocal Relationship between Democracy and Income Inequality
versa.
3 Data and methodology
Section 3.1 presents the data material and operationalizations, centeringon the income inequality and regime type measures. Thereafter, Section3.2 discusses salient challenges to studying the causal relationship betweendemocracy and income inequality, focusing on reciprocal causality and re-lated endogeneity biases, but also discussing sample selection issues.
3.1 Measurement and data sources
Most existing inequality indices lack extensive time series and manyonly cover a subset of countries globally. This is problematic, as lacking cov-erage reduces the precision of estimates and may induce sample-selectionbiases. For instance, despite the strenuous efforts underlying the World In-come Inequality Database (WIID), its Gini coefficients are measured infre-quently with irregular time intervals for most countries. Moreover, the dataare heterogeneous regarding “the definition of income and income recipi-ent, ... the proportion of the population covered, and the nature of the datacollection procedure, which makes international comparisons exceedinglydifficult” (Gradstein and Milanovic 2004, 521). Such variation in measure-ment methodology has consequences for the ranking of, and distance be-tween, countries (Lambert 2001).
However, one inequality proxy with fairly extensive coverage is the shareof total income allocated to wages, or “wage share” (WS). WS is constructedfrom INDSTAT2 data (UNIDO 2011) on manufacturing-sector incomes. Thedata cover 163 countries, with maximum time series from 1963–2008. Alow WS is, in practice, often related to high income inequality; in most so-cieties the relatively poor are wage-earners, and the few very rich draw in-come from rents to capital, land or other non-wage sources of income (Ro-gowski 2009). WS is perhaps particularly suitable for testing the relation-ships posited in the political-economic models discussed above that cen-ter on elite–citizenry income disparities and related group preferences overregimes:
“when the major conflict is between the rich and the poor,one variable that captures inter-group inequality is the share oflabor income in GDP. The reasoning here is that, whereas thepoorer segments of society obtain most of their income from la-bor, capital income (and sometimes land income) accrues largelyto a smaller elite. Therefore, a high labor share corresponds to alow level of inter-group inequality when conflict is between richand poor” (Acemoglu and Robinson 2006, 59).
There are, however, legitimate criticisms of WS as a measure of inequal-
http://www.rei.unipg.it/rei/article/view/173 7
REVIEW OF ECONOMICS AND INSTITUTIONS, Vol. 6, Issue 2 - Summer-Fall 2015, Article 1
ity (Timmons 2010), and the analysis below therefore also tests other in-equality measures. First, WS relates to how gross income is distributed (be-tween capital and labor) before taxation and government transfers. Sincesuch policies may be endogenous to regime type, models using WS maygenerate biased results if inequality is conceptualized in disposable-incometerms. Furthermore, WS only uses manufacturing-sector data, and does notconsider distribution of tertiary sector income. WS also leaves out incomedistribution among landowners, peasants and agricultural workers, whichmay relate to democratization prospects (Ansell and Samuels 2010; Ziblatt2008). Finally, WS does not separate between payments to, for instance,manual laborers and CEOs (Timmons 2010); a high score could reflect highsalaries for the latter.
Hence, using more conventional Gini coefficients have some benefits.Gini coefficients are based on calculations of the cumulative income (orconsumption) of citizens (or households) – ranked according to personalincome – as shares of national income (see Lambert 2001). However, there isfar more missing for most Gini measures – even in the extensive World In-come Inequality Database (WIID) (UNU-WIDER 2008) gathering data fromnumerous sources, notably including the Deininger and Squire dataset –than for WS. Second, the comparability of Gini estimates between differ-ent surveys is often questionable. WIID includes Gini coefficients measur-ing the distribution of income and of consumption and includes both gross-and disposable income estimates. Third, the survey-based data – sometimesfrom specific regions within a country – may be associated with unsystem-atic and systematic measurement errors.
Various solutions have been implemented to deal with the above prob-lems. Gerry and Mickiewicz (2008), for instance, employ rules for selectingonly comparable, high-quality Gini estimates from WIID, when investigat-ing the determinants of income inequality in 24 post-communist countries.They, e.g., first exclude consumption-based Ginis and data not stemmingfrom representative samples, before employing rules on preferred defini-tions, sources, and methodologies. Below, I run robustness tests on Ginicoefficients extracted from WIID2c using a resembling, although not as de-tailed, approach: First, observations are kept only if the income sharing unitis a household, family or tax unit. Second, observations are kept only if theincome definition relates to net/disposable income. Third, only equivalence-scale adjusted observations are kept. 1982 Gini observations remain, butmany are from identical country-years; in such instances, the country-yearscore is the average of the remaining Ginis. Another approach to obtainingcomparable Gini estimates is pursued by Galbraith and Kum (2005), whoestimate Gini coefficients from a regression on Deininger and Squire highquality Gini coefficients with measures of manufacturing pay inequality,manufacturing employment to population, and dummies for Deininger andSquire data sources as independent variables. Below, also this Gini measure
Knutsen: Reinvestigating the Reciprocal Relationship between Democracy and Income Inequality
is used for robustness testing, and so is the Gini measure from the WorldDevelopment Indicators (WDI).
However, in addition to models using WS, the below discussion cen-ters on tests using Gini coefficients from the Standardized World IncomeInequality Database (SWIID; Solt 2009) Version 3.1. Solt draws on the vari-ous, but not directly comparable, Gini coefficients in the WIID, and employsa more complex missing-data algorithm to standardize the information. TheLuxembourg Income Study is chosen as basis for the standardization, dueto its high quality and comparability of estimates across countries. Solt thenfollows a careful procedure that allows maximizing coverage and precisionof estimates, while still ensuring comparability (see Solt 2014). Importantly,Solt constructs separate estimates for market- and disposable household in-come inequality.
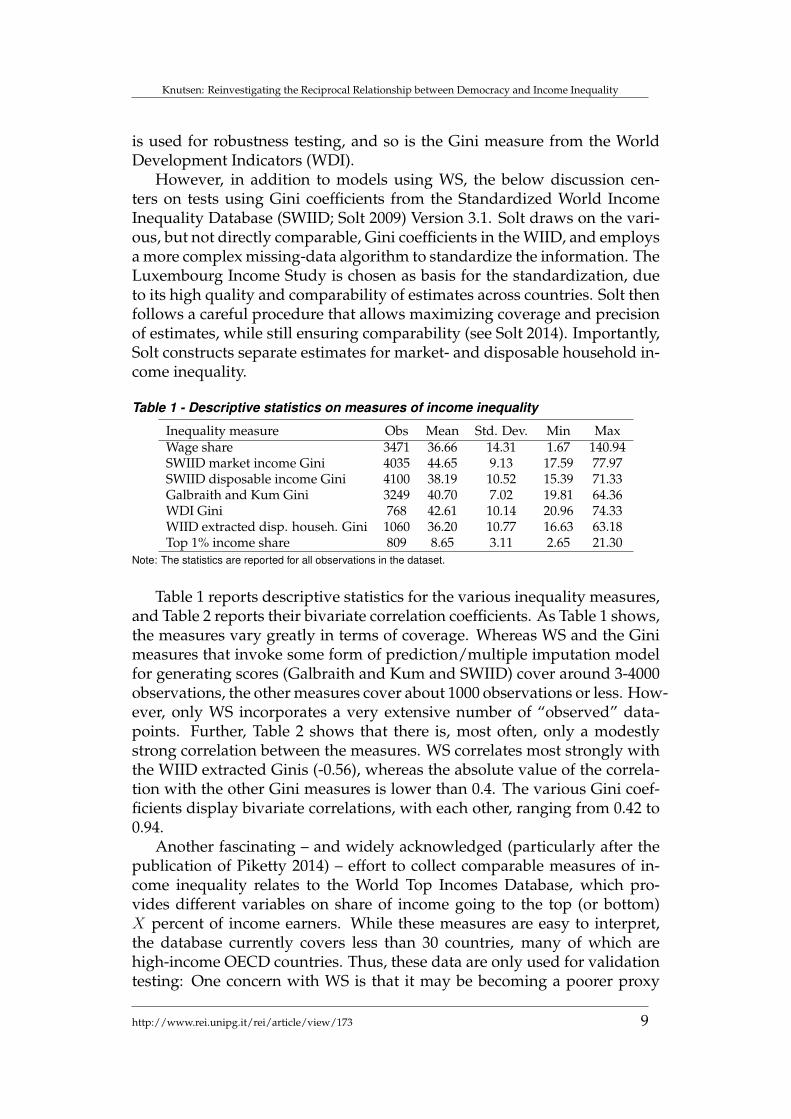
Table 1 - Descriptive statistics on measures of income inequality
Note: The statistics are reported for all observations in the dataset.
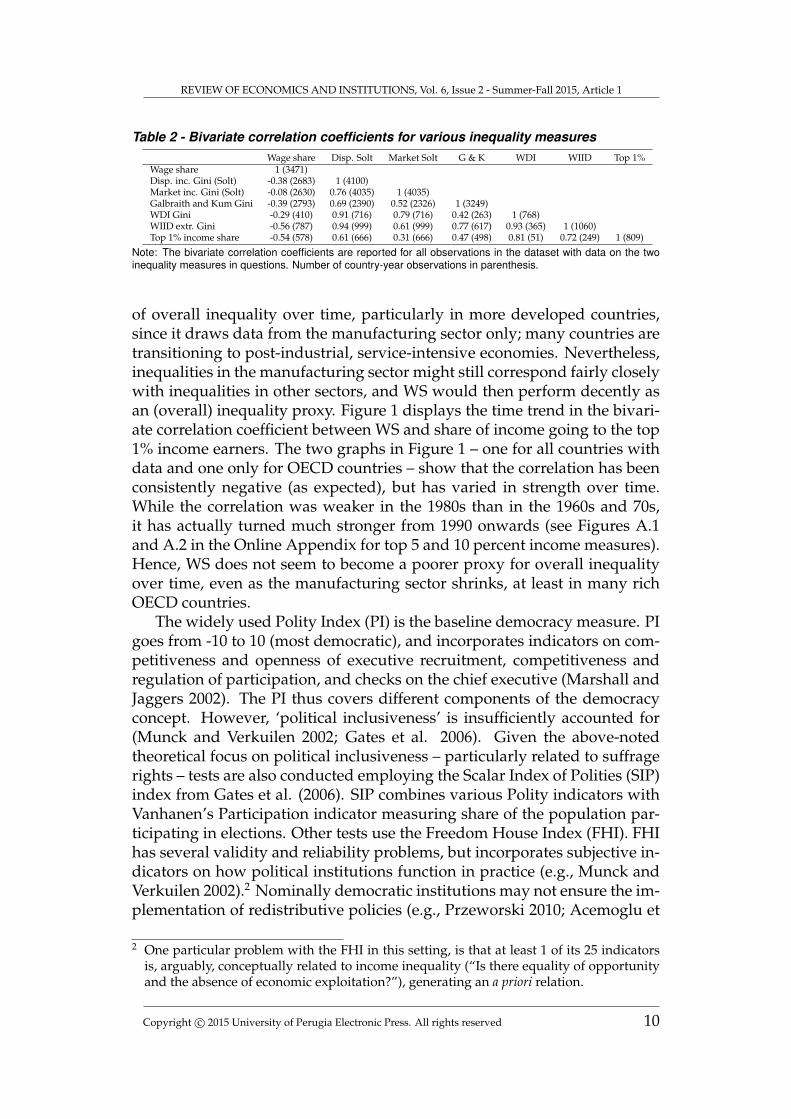
Table 1 reports descriptive statistics for the various inequality measures,and Table 2 reports their bivariate correlation coefficients. As Table 1 shows,the measures vary greatly in terms of coverage. Whereas WS and the Ginimeasures that invoke some form of prediction/multiple imputation modelfor generating scores (Galbraith and Kum and SWIID) cover around 3-4000observations, the other measures cover about 1000 observations or less. How-ever, only WS incorporates a very extensive number of “observed” data-points. Further, Table 2 shows that there is, most often, only a modestlystrong correlation between the measures. WS correlates most strongly withthe WIID extracted Ginis (-0.56), whereas the absolute value of the correla-tion with the other Gini measures is lower than 0.4. The various Gini coef-ficients display bivariate correlations, with each other, ranging from 0.42 to0.94.
Another fascinating – and widely acknowledged (particularly after thepublication of Piketty 2014) – effort to collect comparable measures of in-come inequality relates to the World Top Incomes Database, which pro-vides different variables on share of income going to the top (or bottom)X percent of income earners. While these measures are easy to interpret,the database currently covers less than 30 countries, many of which arehigh-income OECD countries. Thus, these data are only used for validationtesting: One concern with WS is that it may be becoming a poorer proxy
http://www.rei.unipg.it/rei/article/view/173 9
REVIEW OF ECONOMICS AND INSTITUTIONS, Vol. 6, Issue 2 - Summer-Fall 2015, Article 1
Table 2 - Bivariate correlation coefficients for various inequality measuresWage share Disp. Solt Market Solt G & K WDI WIID Top 1%
Note: The bivariate correlation coefficients are reported for all observations in the dataset with data on the twoinequality measures in questions. Number of country-year observations in parenthesis.
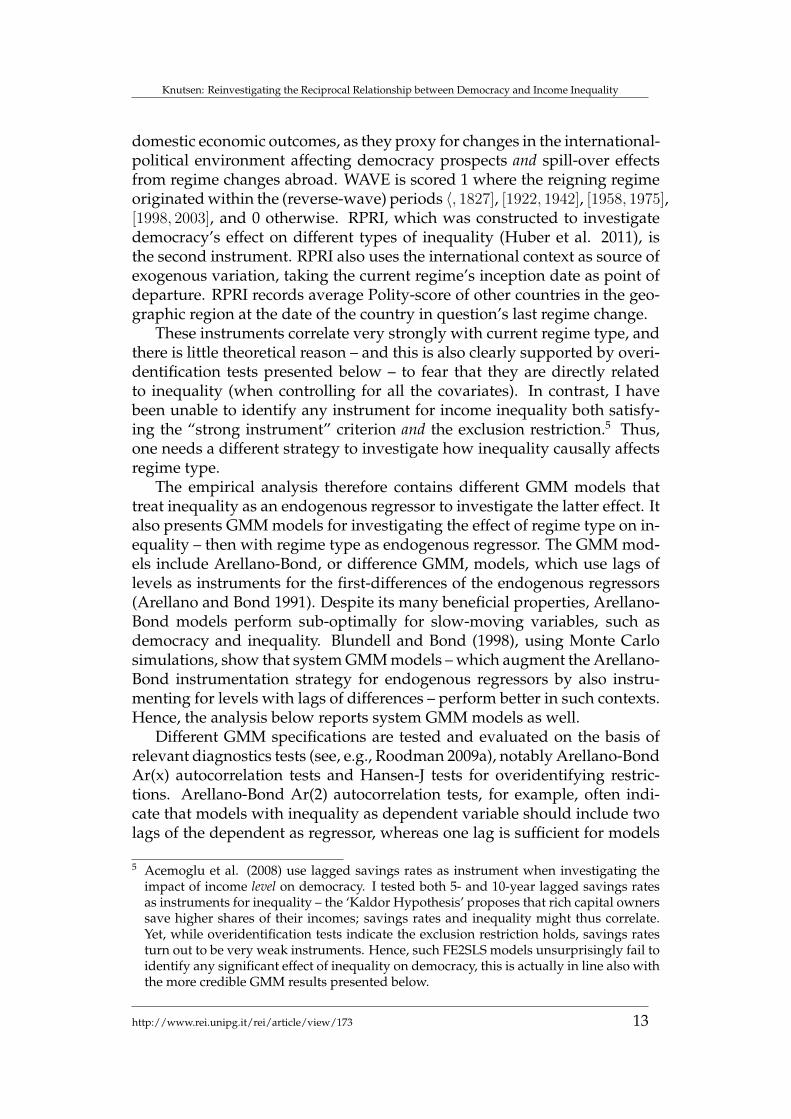
of overall inequality over time, particularly in more developed countries,since it draws data from the manufacturing sector only; many countries aretransitioning to post-industrial, service-intensive economies. Nevertheless,inequalities in the manufacturing sector might still correspond fairly closelywith inequalities in other sectors, and WS would then perform decently asan (overall) inequality proxy. Figure 1 displays the time trend in the bivari-ate correlation coefficient between WS and share of income going to the top1% income earners. The two graphs in Figure 1 – one for all countries withdata and one only for OECD countries – show that the correlation has beenconsistently negative (as expected), but has varied in strength over time.While the correlation was weaker in the 1980s than in the 1960s and 70s,it has actually turned much stronger from 1990 onwards (see Figures A.1and A.2 in the Online Appendix for top 5 and 10 percent income measures).Hence, WS does not seem to become a poorer proxy for overall inequalityover time, even as the manufacturing sector shrinks, at least in many richOECD countries.
The widely used Polity Index (PI) is the baseline democracy measure. PIgoes from -10 to 10 (most democratic), and incorporates indicators on com-petitiveness and openness of executive recruitment, competitiveness andregulation of participation, and checks on the chief executive (Marshall andJaggers 2002). The PI thus covers different components of the democracyconcept. However, ‘political inclusiveness’ is insufficiently accounted for(Munck and Verkuilen 2002; Gates et al. 2006). Given the above-notedtheoretical focus on political inclusiveness – particularly related to suffragerights – tests are also conducted employing the Scalar Index of Polities (SIP)index from Gates et al. (2006). SIP combines various Polity indicators withVanhanen’s Participation indicator measuring share of the population par-ticipating in elections. Other tests use the Freedom House Index (FHI). FHIhas several validity and reliability problems, but incorporates subjective in-dicators on how political institutions function in practice (e.g., Munck andVerkuilen 2002).2 Nominally democratic institutions may not ensure the im-plementation of redistributive policies (e.g., Przeworski 2010; Acemoglu et
2 One particular problem with the FHI in this setting, is that at least 1 of its 25 indicatorsis, arguably, conceptually related to income inequality (“Is there equality of opportunityand the absence of economic exploitation?”), generating an a priori relation.
Knutsen: Reinvestigating the Reciprocal Relationship between Democracy and Income Inequality
Figure 1 - Bivariate correlation coefficients, by year, between share of income goingto wage earners in manufacturing sector (WS) and share of total income going to top1% income earners.
-.8
-.6
-.4
-.2
0C
orre
latio
n co
effic
ient
(r)
1960 1970 1980 1990 2000 2010Year
Correlation coefficient, by year, for Wage share and Top 1% income share; all countries with data
-.8
-.6
-.4
-.2
0C
orre
latio
n co
effic
ient
(r)
1960 1970 1980 1990 2000 2010Year
Correlation coefficient, by year, for Wage share and Top 1% income share; OECD countries
Notes: The top graph displays correlation coefficients from all countries with data (minimum 6, maximum 18 forparticular years) and the bottom graph for OECD countries with data (minimum 5, maximum 11).
al. 2013), and de facto protection of political and civil rights may be morerelevant for distributional outcomes. Finally, tests are also reported for theDemocracy-Dictatorship (DD) measure from Cheibub et al. (2010) and Uni-fied Democracy Scores from Pemstein et al. (2010). Table A.1 in the Ap-pendix presents descriptive statistics for the various democracy measuresand Table A.2 in the Online Appendix reports their pairwise correlations.
There is a positive and moderately strong correlation between WS andPI (.32; 3317 country-year obs.). However, this correlation could stem fromother variables systematically affecting both regime type and income in-equality. The regression models below therefore include several controls:First, they include (log) PPP-adjusted real GDP per capita (p.c.) from Mad-dison (2007), measured in 1990 USD. The relationships between incomelevel and inequality (Kuznets 1955) and between income level and democ-racy (Przeworski et al. 2000) may, however, be non-monotonic, and themodels therefore also controls for log GDP p.c. squared. Moreover, an econ-omy dominated by natural-resource extraction may stabilize dictatorships(Ross 2001) and increase income inequality (Leamer et al. 1999). Hence,the models control for log (oil and gas income p.c.+1) using data from Ross(2011). They also control for log population level from Maddison (2007), and
http://www.rei.unipg.it/rei/article/view/173 11
REVIEW OF ECONOMICS AND INSTITUTIONS, Vol. 6, Issue 2 - Summer-Fall 2015, Article 1
for log (regime duration+1), based on Polity IV data, since political instabil-ity may relate both to regime type and distributional aspects (Alesina andPerotti 1996). Table A.3 in the Online Appendix reports descriptive statisticsfor these variables.
3.2 Pertinent methodological issues when investigating thecausal links between democracy and inequality
Different factors may generate a correlation between democracy and in-equality, and need to be accounted for when investigating potential causaleffects. In addition to the control variables listed, most models below con-trol for country- and year fixed effects. However, there is another pertinentconcern: As indicated by the review above, democracy may both cause andbe affected by income inequality. Estimating these effects without account-ing for endogeneity therefore likely leads to biased results. The few studiesthat explicitly model the democracy–inequality relationship as reciprocaldraw on limited data and have generated quite mixed results. Rubinsonand Quinlan (1977) include 32 countries with data from 1965–1975, findingthat inequality enhances democracy, whereas democracy does not affect in-equality. Bollen and Jackman (1985) include 60 countries, with inequalitymeasured once during 1958–1975; they find no robust effect in either direc-tion. Burkhart (1997) uses data from 56 countries for four points in time.3
His results indicate that improvements in democracy increase inequality atlow democracy levels, but reduce inequality at high democracy levels. Like-wise, modest income inequality generates the best prospects for democracy.The above-mentioned studies rely on instrumental-variable approaches, buttheir choices of instruments may have generated biases.4
Therefore, different models accounting for endogeneity biases are em-ployed below, drawing on data for about 3000 observations from 120 coun-tries. The first such specifications are fixed effects two stage least squares(FE2SLS) models. For studying the causal effect of democracy on inequal-ity, two valid instruments – i.e. measures correlated with the endogenousindependent variable, but not directly related to the dependent – are iden-tified: The first instrument, WAVE, has previously been applied in analyz-ing democracy’s effects on property rights and economic growth (Knutsen2011a,b). WAVE is based on Huntington’s (1991) observation that democ-racy, globally, has thrived in temporal waves, with set-backs during “reverse-waves”. The waves reflect sources of regime-type variation exogenous to
3 For a relatively similar analysis, see Burkhart (2007).4 Burkhart, for instance, uses many of the same instruments in the first stages of both the
democracy and inequality models. As the exclusion restriction, somewhat simplified,states there should be no direct effect of the instruments on the dependent variable inthe second-stage equation, this is problematic. It is, for example, inconsistent to assumeenergy consumption is a proper instrument for democracy in the inequality model, andthen assume they are unrelated in the democracy model.
Knutsen: Reinvestigating the Reciprocal Relationship between Democracy and Income Inequality
domestic economic outcomes, as they proxy for changes in the international-political environment affecting democracy prospects and spill-over effectsfrom regime changes abroad. WAVE is scored 1 where the reigning regimeoriginated within the (reverse-wave) periods 〈, 1827], [1922, 1942], [1958, 1975],[1998, 2003], and 0 otherwise. RPRI, which was constructed to investigatedemocracy’s effect on different types of inequality (Huber et al. 2011), isthe second instrument. RPRI also uses the international context as source ofexogenous variation, taking the current regime’s inception date as point ofdeparture. RPRI records average Polity-score of other countries in the geo-graphic region at the date of the country in question’s last regime change.
These instruments correlate very strongly with current regime type, andthere is little theoretical reason – and this is also clearly supported by overi-dentification tests presented below – to fear that they are directly relatedto inequality (when controlling for all the covariates). In contrast, I havebeen unable to identify any instrument for income inequality both satisfy-ing the “strong instrument” criterion and the exclusion restriction.5 Thus,one needs a different strategy to investigate how inequality causally affectsregime type.
The empirical analysis therefore contains different GMM models thattreat inequality as an endogenous regressor to investigate the latter effect. Italso presents GMM models for investigating the effect of regime type on in-equality – then with regime type as endogenous regressor. The GMM mod-els include Arellano-Bond, or difference GMM, models, which use lags oflevels as instruments for the first-differences of the endogenous regressors(Arellano and Bond 1991). Despite its many beneficial properties, Arellano-Bond models perform sub-optimally for slow-moving variables, such asdemocracy and inequality. Blundell and Bond (1998), using Monte Carlosimulations, show that system GMM models – which augment the Arellano-Bond instrumentation strategy for endogenous regressors by also instru-menting for levels with lags of differences – perform better in such contexts.Hence, the analysis below reports system GMM models as well.
Different GMM specifications are tested and evaluated on the basis ofrelevant diagnostics tests (see, e.g., Roodman 2009a), notably Arellano-BondAr(x) autocorrelation tests and Hansen-J tests for overidentifying restric-tions. Arellano-Bond Ar(2) autocorrelation tests, for example, often indi-cate that models with inequality as dependent variable should include twolags of the dependent as regressor, whereas one lag is sufficient for models
5 Acemoglu et al. (2008) use lagged savings rates as instrument when investigating theimpact of income level on democracy. I tested both 5- and 10-year lagged savings ratesas instruments for inequality – the ‘Kaldor Hypothesis’ proposes that rich capital ownerssave higher shares of their incomes; savings rates and inequality might thus correlate.Yet, while overidentification tests indicate the exclusion restriction holds, savings ratesturn out to be very weak instruments. Hence, such FE2SLS models unsurprisingly fail toidentify any significant effect of inequality on democracy, this is actually in line also withthe more credible GMM results presented below.
http://www.rei.unipg.it/rei/article/view/173 13
REVIEW OF ECONOMICS AND INSTITUTIONS, Vol. 6, Issue 2 - Summer-Fall 2015, Article 1
having democracy as dependent. Following Roodman (2009b), most mod-els below restrict the number of lags used for instrumentation to reduce theoverall number of instruments. Having substantially more instruments thancross-section units may lead to failure to exclude the endogenous compo-nent of the instrumented regressors and difficulties in detecting this throughstandard (Hansen J) tests.
The initial analysis is conducted on panel data where country-year isthe unit of analysis, thus including around 3000 country-year observations.However, these models are complemented by running otherwise equivalentmodels on 5-year panel periods, as is common, for example, in the economicgrowth literature. The former has the advantage of increasing efficiency ofestimates by including more information. It also allows for more appro-priately capturing effects if they operate with a short time-lag. However,the latter approach also has advantages. First, both regime type and in-come inequality are, as noted, both slow-moving variables, and capturingshort-term dynamics may thus not be as important as smoothing out ran-dom measurement errors by averaging over multiple years. This approachmay also partly alleviate endogeneity concerns, if the independent variableis measured early in the 5-year panel, or if one lags the independent vari-ables by one panel unit (as below). Increasing panel length also reduces thenumber of instruments in the GMM models and thus mitigates the “too-many-instruments problem” (Roodman 2009b). Finally, averaging over 5-year periods alleviates problems with missing data, which is particularlypertinent for many of the Gini measures, if one does not require coverage forevery year in the panel to provide a score. It should, however, be noted thatone underestimates the uncertainty inherent in the scores by doing this, asshort-term fluctuations and measurement errors in particular years becomemore influential. But, there are other ways of dealing more systematicallywith missing data:
Despite having far better coverage than most other inequality data sour-ces, INDSTAT2 and SWIID still contain a substantial amount of missing.This generates less reliable coefficient estimates. But, what is far worse,the data may not be missing at random, and omitting these observationscould produce biased coefficients. For example, if most democracies, butonly dictatorships with strong concerns for redistribution, report data, onemight underestimate the effect of PI on WS. Inspection of the data substan-tiates concerns of sample-selection biases. For example, whereas the aver-age (0–100 normalized) PI score for observations with WS data is 63, it is42 for those missing WS data. Furthermore, the average GDP p.c. (1990USD) for country-year observations with WS data is 7147, and only 3558 forthose missing data. Hence, multiple imputation was employed to predictmissing values, using Amelia II software (Honaker and King 2010). The re-sults reported below draw on 10 imputed datasets, reporting average coef-ficients and imputation-corrected errors. The datasets include 124 variables
Knutsen: Reinvestigating the Reciprocal Relationship between Democracy and Income Inequality
– selected because they are anticipated to be informative predictors of in-equality or regime type, and have fairly good empirical coverage (see FigureA.4 in the Online Appendix for a missingness map). The datasets include184 countries with maximum time series from 1960–2008. The imputation-algorithm assumes second-order polynomial, country-specific time trends.
The imputation model performs fairly well, as illustrated by the over-imputation plot for WS (Figure A.4), showing how the imputation model isable to accurately “predict” actual scores on WS – except for the very high-est scores – when treating them “as if” they were missing. Also time-seriesplots (such as Figure A.6 in the Online Appendix) suggest that the imputa-tion model mostly produces sensible predictions.
4 Empirical analysis
Section 4.1, presents “naive” baseline models on how inequality affectsregime type and on how regime type affects inequality. As in most of theempirical literature, these models do not account for endogeneity biases.Section 4.2 then employs more appropriate model specifications investigat-ing the effect of inequality on regime type. Finally, Section 4.3 reports moreappropriate specifications for investigating how regime type affects incomeinequality.
4.1 Baseline models
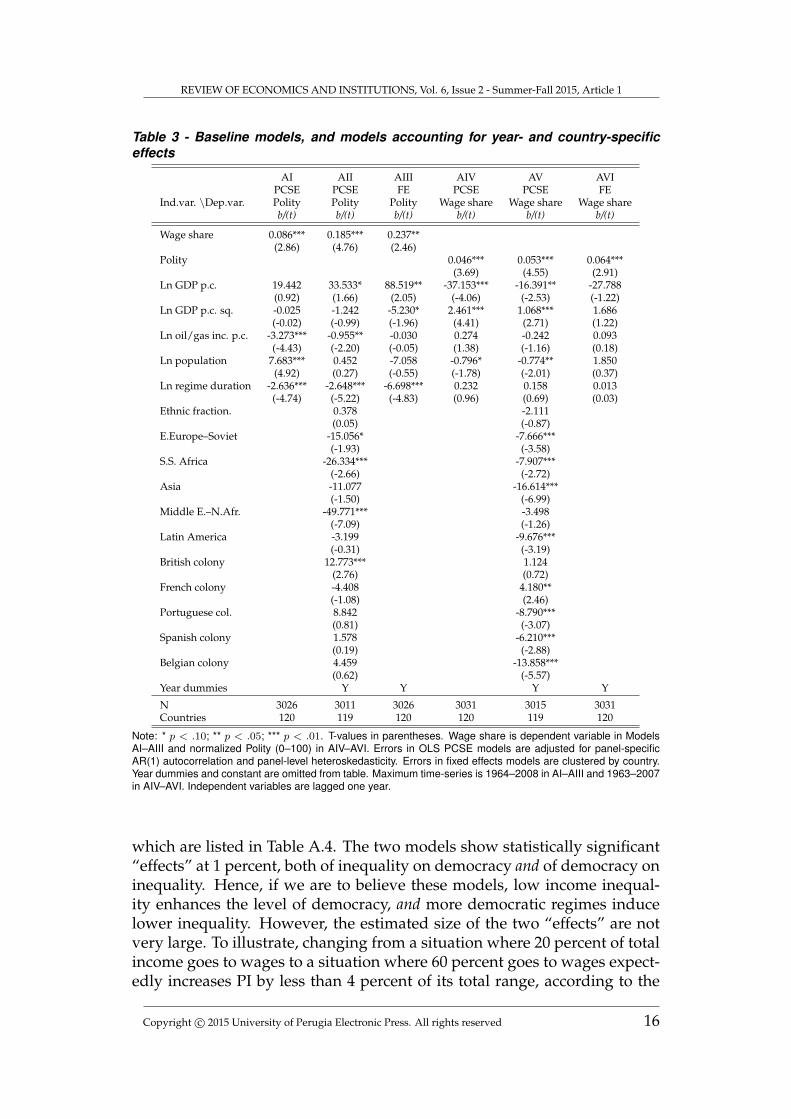
Table 3 shows models with regime type, measured by PI, as depen-dent variable (henceforth “democracy models”), and models with incomeinequality, proxied by WS, as dependent variable (“inequality models”).WS measures income share going to wages in percent, and PI is also nor-malized to vary from 0–100. This normalization does not affect the t-values,but eases comparisons of the size of the estimated effects (of democracy oninequality and vice versa) by setting WS and PI to equivalent scales. Thebaseline models are Ordinary Least Squares with Panel Corrected StandardErrors (OLS PCSE) (see Beck and Katz 1995). Initially, country-year is unitof analysis, independent variables are lagged one year, and errors are ad-justed for panel-level heteroskedasticity and AR(1) autocorrelation withinpanels (countries). The baseline democracy and inequality models are, re-spectively:
Note: * p < .10; ** p < .05; *** p < .01. T-values in parentheses. Wage share is dependent variable in ModelsAI–AIII and normalized Polity (0–100) in AIV–AVI. Errors in OLS PCSE models are adjusted for panel-specificAR(1) autocorrelation and panel-level heteroskedasticity. Errors in fixed effects models are clustered by country.Year dummies and constant are omitted from table. Maximum time-series is 1964–2008 in AI–AIII and 1963–2007in AIV–AVI. Independent variables are lagged one year.
which are listed in Table A.4. The two models show statistically significant“effects” at 1 percent, both of inequality on democracy and of democracy oninequality. Hence, if we are to believe these models, low income inequal-ity enhances the level of democracy, and more democratic regimes inducelower inequality. However, the estimated size of the two “effects” are notvery large. To illustrate, changing from a situation where 20 percent of totalincome goes to wages to a situation where 60 percent goes to wages expect-edly increases PI by less than 4 percent of its total range, according to the
Knutsen: Reinvestigating the Reciprocal Relationship between Democracy and Income Inequality
point estimate in Model AI. This is not a substantial democratization. Re-garding the effect of regime type on inequality, Model AIV indicates thatthe kind of democratization experienced in the Philippines with the fall ofMarcos – from 30 to 90 on the PI – would increase the percentage-share ofincome going to wages with around 3.
The estimates in Models AI and AIV may, however, be affected by omit-ted variable bias. One concern relates to systematic time trends in incomeinequality (Rogowski 2009) and in regime characteristics (Huntington 1991).The baseline models are therefore expanded by including year-dummies.Also different geographical, socio-cultural, and political-historical factors,could impact on both regime type and inequality (Engerman and Sokolo1997; Acemoglu et al. 2008). Thus, Models AII (democracy model) and AV(inequality model) also add the Ethnic Fractionalization Index from Alesinaet al. (2003) and dummies for geographic region and historical colonizer.Still, there may be other consequential country-fixed characteristics, andModels AIII and AVI thus include both country- and year-dummies. Yet,controlling for time- and country-fixed characteristics does not weaken theestimated relationships between democracy and income inequality: The es-timate from Model AIII, for example, indicates that an increase in WS from20 to 60 increases PI by around 9.5 percent. Furthermore, a democratizationakin to that in the mid-1980s Philippines (from 30 to 90) would, accord-ing to Model AVI, increase WS with about 4. Hence, the results in Table 3suggest that democracy reduces income inequality, and that low inequalityenhances the level of democracy. This is replicated also for similar modelsrun on 5-year panels (Table A.6), and when controlling for education (TableA.7), although the significance is weakened for the “effect” of inequality ondemocracy in the latter models. Yet, these results are only preliminary: De-spite controlling for country- and year-fixed effects, the models in Table 3do not account for endogeneity biases.
4.2 Further investigating how inequality affects democracy
I first turn to scrutinizing the (potential) causal effect of inequality onregime type. The baseline models above suggested that lower levels of in-equality lead to more democratic regimes. Yet, this is seemingly not thecase according to most of the GMM Models with inequality as dependentvariable, reported in the Online Appendix. These models draw on quite dif-ferent specifications (e.g. 1-year versus 5-year periods as panel unit), datasamples (only observed versus also including imputed data), and measures.Importantly, however, they all treat inequality as endogenous and accountfor both country- and year-fixed effects.
To be more specific, Table A.8 reports five Arellano-Bond and five Sys-tem GMM specifications with country-year as unit of analysis, PI as depen-dent variable, and WS as the (endogenous) measure of democracy. These
http://www.rei.unipg.it/rei/article/view/173 17
REVIEW OF ECONOMICS AND INSTITUTIONS, Vol. 6, Issue 2 - Summer-Fall 2015, Article 1
include models with one and with two lags of the dependent variable asregressors; models treating only WS as endogenous and models treating allregressors except the year dummies as regressors; and, models with dif-ferent restrictions on lags used for instrumentation. 4 of these 10 modelsreport a negative WS coefficient, whereas 6 report a positive. WS is alwaysinsignificant even at 10 percent, with one single exception. Furthermore,this exception – an Arellano-Bond model including one lag of WS as regres-sor and using only the second lag for instrumentation – is not appropriatelyspecified, as indicated by the low p-value (0.02) on the Arellano-Bond Ar(2)autocorrelation test.
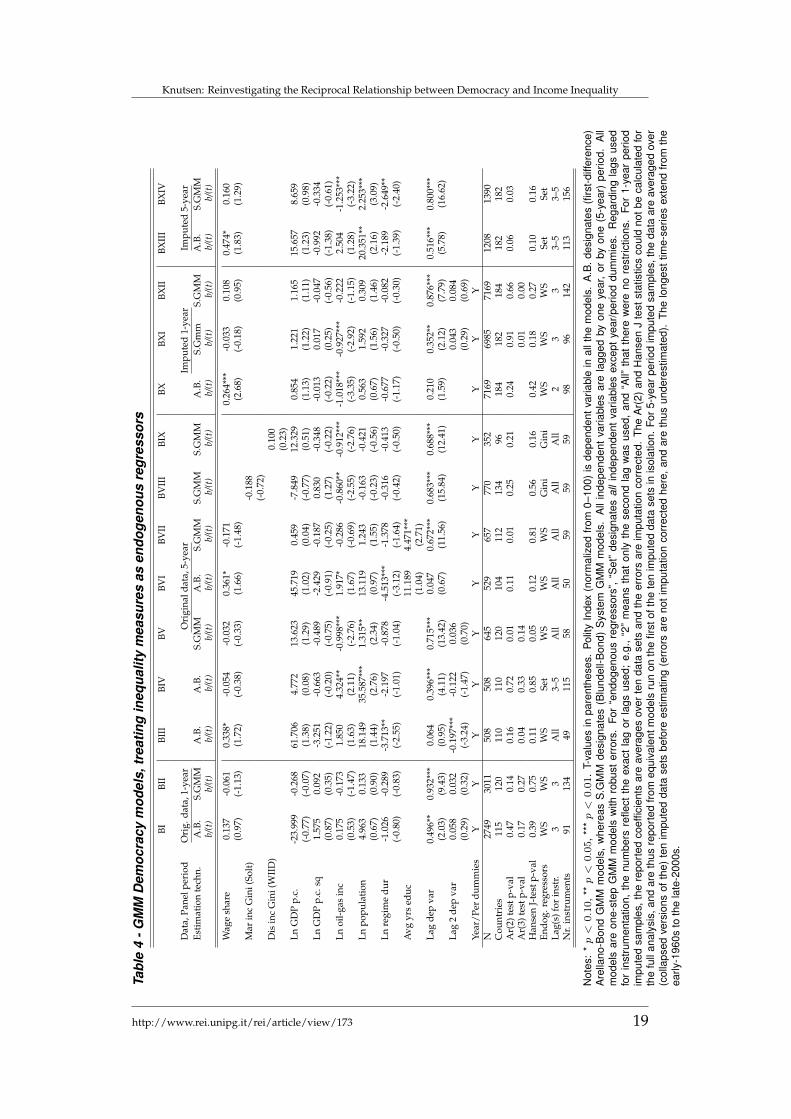
Indeed, only models including two lags of WS as regressors yield p-values above 0.10 on the Ar(2) test. Two of these models – one Arellano-Bond and one System GMM model – are reproduced as BI and BII in Table4. These models are also associated with sufficiently high p-values on theAr(3) and Hansen J-tests. Further, the number of instruments in BI is be-low the number of cross-section units, whereas it is slightly above in BII.Taken together, BI and BII should thus provide consistent results, and theyreport that changes in WS do not systematically affect PI. Hence, there areno clear indications that inequality systematically affects democracy onceaccounting for inequality being endogenous.
This (non-)result is fairly stable. For instance, it holds up in varioustwostep-GMM specifications (see Table A.9). However, due to the numer-ous time periods in the country-year panel set-up, it is difficult to modelother regressors than PI as endogenous – at least while relaxing restrictionson lags used for instrumentation – without increasing the number of instru-ments far beyond the number of cross-section units. Thus, the Appendixcontains several models where 5-year periods (starting with 1960–1964) arethe panel units; the variables are provided their average score during the5-year period in question, and all independent variables are lagged one 5-year period to further mitigate endogeneity concerns. These models mostlyreplicate the non-result from the 1-year specifications (see, e.g., Table A.10),with a few exceptions. One is Model BIII in Table 4, which is an Arellano-Bond specification with two lags of the dependent variable (WS) as regres-sors, and modelling only PI as endogenous. In BIII, there is a weakly signif-icant (t=1.7) positive effect of WS on PI, but whereas the Ar(2) and HansenJ-test p-values (barely) exceed 0.10, the p-value for the Ar(3) test is 0.04.In contrast, all the different test statistics indicate that Model BIV – wherethe entire set of regressors are endogenous, but only 3–5 lags are used forinstrumentation – is consistent, and here WS is actually negative, but sta-tistically insignificant (t=-0.4). This result is reproduced in BV (t=-0.3 forWS), the System GMM version of Model BIII, although the test-statistics aremore problematic for this model. In any case, there is no clear evidence thatinequality systematically affects democracy according to the 5-year panelmodels either.
Knutsen: Reinvestigating the Reciprocal Relationship between Democracy and Income Inequality
Tabl
e4
-GM
MD
emoc
racy
mod
els,
trea
ting
ineq
ualit
ym
easu
res
asen
doge
nous
regr
esso
rs
BIBI
IBI
IIBI
VBV
BVI
BVII
BVII
IBI
XBX
BXI
BXII
BXII
IBX
IV
Dat
a,Pa
nelp
erio
dO
rig.
data
,1-y
ear
Ori
gina
ldat
a,5-
year
Impu
ted
1-ye
arIm
pute
d5-
year
Esti
mat
ion
tech
n.A
.B.
S.G
MM
A.B
.A
.B.
S.G
MM
A.B
.S.
GM
MS.
GM
MS.
GM
MA
.B.
S.G
mm
S.G
MM
A.B
.S.
GM
Mb/
(t)
b/(t
)b/
(t)
b/(t
)b/
(t)
b/(t
)b/
(t)
b/(t
)b/
(t)
b/(t
)b/
(t)
b/(t
)b/
(t)
b/(t
)
Wag
esh
are
0.13
7-0
.061
0.33
8*-0
.054
-0.0
320.
361*
-0.1
710.
264*
**-0
.033
0.10
80.
474*
0.16
0(0
.97)
(-1.
13)
(1.7
2)(-
0.38
)(-
0.33
)(1
.66)
(-1.
48)
(2.6
8)(-
0.18
)(0
.95)
(1.8
3)(1
.29)
Mar
inc
Gin
i(So
lt)
-0.1
88(-
0.72
)D
isin
cG
ini(
WII
D)
0.10
0(0
.23)
LnG
DP
p.c.
-23.
999
-0.2
6861
.706
4.77
213
.623
45.7
190.
459
-7.8
4912
.329
0.85
41.
221
1.16
515
.657
8.65
9(-
0.77
)(-
0.07
)(1
.38)
(0.0
8)(1
.29)
(1.0
2)(0
.04)
(-0.
77)
(0.5
1)(1
.13)
(1.2
2)(1
.11)
(1.2
3)(0
.98)
LnG
DP
p.c.
sq1.
575
0.09
2-3
.251
-0.6
63-0
.489
-2.4
29-0
.187
0.83
0-0
.348
-0.0
130.
017
-0.0
47-0
.992
-0.3
34(0
.87)
(0.3
5)(-
1.22
)(-
0.20
)(-
0.75
)(-
0.91
)(-
0.25
)(1
.27)
(-0.
22)
(-0.
22)
(0.2
5)(-
0.56
)(-
1.38
)(-
0.61
)Ln
oil-
gas
inc
0.17
5-0
.173
1.85
04.
324*
*-0
.998
***
1.91
7*-0
.286
-0.8
60**
-0.9
12**
*-1
.018
***
-0.9
27**
*-0
.222
2.50
4-1
.253
***
(0.5
3)(-
1.47
)(1
.63)
(2.1
1)(-
2.76
)(1
.67)
(-0.
69)
(-2.
55)
(-2.
76)
(-3.
35)
(-2.
92)
(-1.
15)
(1.2
8)(-
3.22
)Ln
popu
lati
on4.
963
0.13
318
.149
35.5
87**
*1.
315*
*13
.119
1.24
3-0
.163
-0.4
210.
563
1.59
20.
309
20.3
51**
2.25
3***
(0.6
7)(0
.90)
(1.4
4)(2
.76)
(2.3
4)(0
.97)
(1.5
5)(-
0.23
)(-
0.56
)(0
.67)
(1.5
6)(1
.46)
(2.1
6)(3
.09)
Lnre
gim
edu
r-1
.026
-0.2
89-3
.713
**-2
.197
-0.8
78-4
.513
***
-1.3
78-0
.316
-0.4
13-0
.677
-0.3
27-0
.082
-2.1
89-2
.649
**(-
0.80
)(-
0.83
)(-
2.55
)(-
1.01
)(-
1.04
)(-
3.12
)(-
1.64
)(-
0.42
)(-
0.50
)(-
1.17
)(-
0.50
)(-
0.30
)(-
1.39
)(-
2.40
)A
vgyr
sed
uc11
.189
4.47
1***
(1.0
4)(2
.71)
Lag
dep
var
0.49
6**
0.93
2***
0.06
40.
396*
**0.
715*
**0.
047
0.67
2***
0.68
3***
0.68
8***
0.21
00.
352*
*0.
876*
**0.
516*
**0.
800*
**(2
.03)
(9.4
3)(0
.95)
(4.1
1)(1
3.42
)(0
.67)
(11.
56)
(15.
84)
(12.
41)
(1.5
9)(2
.12)
(7.7
9)(5
.78)
(16.
62)
Lag
2de
pva
r0.
058
0.03
2-0
.197
***
-0.1
220.
036
0.04
30.
084
(0.2
9)(0
.32)
(-3.
24)
(-1.
47)
(0.7
0)(0
.29)
(0.6
9)Ye
ar/P
erdu
mm
ies
YY
YY
YY
YY
YY
YY
N27
4930
1150
850
864
552
965
777
035
271
6969
8571
6912
0813
90C
ount
ries
115
120
110
110
120
104
112
134
9618
418
218
418
218
2A
r(2)
test
p-va
l0.
470.
140.
160.
720.
010.
110.
010.
250.
210.
240.
910.
660.
060.
03A
r(3)
test
p-va
l0.
170.
270.
040.
330.
140.
010.
00H
anse
nJ-
test
p-va
l0.
390.
750.
110.
850.
050.
120.
810.
560.
160.
420.
180.
270.
100.
16En
dog.
regr
esso
rsW
SW
SW
SSe
tW
SW
SW
SG
ini
Gin
iW
SW
SW
SSe
tSe
tLa
g(s)
for
inst
r.3
3A
ll3–
5A
llA
llA
llA
llA
ll2
33
3–5
3–5
Nr.
inst
rum
ents
9113
449
115
5850
5959
5998
9614
211
315
6
Not
es:
*p<
0.10,*
*p<
0.05,*
**p<
0.01.
T-va
lues
inpa
rent
hese
s.Po
lity
Inde
x(n
orm
aliz
edfro
m0–
100)
isde
pend
entv
aria
ble
inal
lthe
mod
els.
A.B
.des
igna
tes
(firs
t-diff
eren
ce)
Are
llano
-Bon
dG
MM
mod
els,
whe
reas
S.G
MM
desi
gnat
es(B
lund
ell-B
ond)
Sys
tem
GM
Mm
odel
s.A
llin
depe
nden
tva
riabl
esar
ela
gged
byon
eye
ar,
orby
one
(5-y
ear)
perio
d.A
llm
odel
sar
eon
e-st
epG
MM
mod
els
with
robu
ster
rors
.Fo
r“e
ndog
enou
sre
gres
sors
”,“S
et”
desi
gnat
esal
lin
depe
nden
tva
riabl
esex
cept
year
/per
iod
dum
mie
s.R
egar
ding
lags
used
for
inst
rum
enta
tion,
the
num
bers
refle
ctth
eex
act
lag
orla
gsus
ed;
e.g.
,“2
”m
eans
that
only
the
seco
ndla
gw
asus
ed,
and
“All”
that
ther
ew
ere
nore
stric
tions
.Fo
r1-
year
perio
dim
pute
dsa
mpl
es,t
here
port
edco
effic
ient
sar
eav
erag
esov
erte
nda
tase
tsan
dth
eer
rors
are
impu
tatio
nco
rrec
ted.
The
Ar(
2)an
dH
anse
nJ
test
stat
istic
sco
uld
notb
eca
lcul
ated
for
the
full
anal
ysis
,and
are
thus
repo
rted
from
equi
vale
ntm
odel
sru
non
the
first
ofth
ete
nim
pute
dda
tase
tsin
isol
atio
n.Fo
r5-
year
perio
dim
pute
dsa
mpl
es,t
heda
taar
eav
erag
edov
er(c
olla
psed
vers
ions
ofth
e)te
nim
pute
dda
tase
tsbe
fore
estim
atin
g(e
rror
sar
eno
tim
puta
tion
corr
ecte
dhe
re,a
ndar
eth
usun
dere
stim
ated
).Th
elo
nges
ttim
e-se
ries
exte
ndfro
mth
eea
rly-1
960s
toth
ela
te-2
000s
.
http://www.rei.unipg.it/rei/article/view/173 19
REVIEW OF ECONOMICS AND INSTITUTIONS, Vol. 6, Issue 2 - Summer-Fall 2015, Article 1
The lack of a clear result holds true also, for instance, when making ad-justments to the set of controls, such as adding average years of educationin the population (above 25 years old), with data from the Barro and Leedataset (see Barro and Lee 1993, results are reported in Models BVIBVII, Ta-ble 4 and Appendix Table A.12).6 The weak results may, however, be dueto measurement problems with PI, or to PI not capturing relevant aspectsof democracy. Casper and Tufis (2003) show how even highly correlateddemocracy measures give different results in regressions estimating the de-terminants of democracy. Models using (mean) Unified Democracy Scoresfrom Pemstein et al. (2010) were therefore also tested. PI was also substi-tuted with SIP (Gates et al. 2006), to check whether inequality impacts ona democracy measure incorporating differences in electoral participation.Moreover, high income inequality may negatively impact on the function-ing of democratic institutions, for example through intensifying social con-flict and increasing incentives for elites to subvert formally granted polit-ical and civil rights (e.g., Dreze and Sen 2002). Thus, inequality might bemore strongly related with the FHI than indices measuring formal institu-tions. However, the lack of robust results is replicated when substitutingthe PI with either SIP, UDS or FHI (see Tables A. 19–21). The various GMMmodels were also modified by including squared WS-terms as endogenousregressors, to investigate whether intermediary levels of inequality inducedemocracy (e.g., Acemoglu and Robinson 2006). However, there is no evi-dence of such a hump-shaped relationship either.7
Despite these findings, two other methodological explanations could ac-count for the lack of an estimated causal effect of inequality on regime type.The first relates to choice of inequality measure and data. The second relatesto systematic missingness and resulting selection biases that may blur a po-tential net causal effect from being revealed in the GMM estimates. How-ever, further investigation indicates that this is not the case:
First, WS was substituted with the various Gini measures. Gini coeffi-cients arguably provide more direct measures of overall income inequalitythan WS, but collecting data and comparing Gini coefficients without limit-ing the number of observations too much, is complicated. As noted, the pro-cedure and data provided by Solt (2009) constitute a very good attempt toresolve these issues. SWIID draws on standards set by the Luxembourg In-come Survey, the rich data material in WIID, and multiple imputation mod-els to produce comparable estimates of both market and disposable incomeinequality. If anything, the results are even weaker for the Solt measures,as illustrated by the system GMM models BVIII and BIX with the market
6 It should, however, be noted that most models controlling for education level performsvery poorly on the Ar(2) test, and may thus produce inconsistent results.
7 Actually, the squared WS-terms are positive and significant at 5 percent in two SystemGMM models in Table A.11. The point estimates indicate a negative marginal effect ofWS on democracy for inegalitarian countries and a (weaker) positive marginal effect forvery egalitarian countries.
Knutsen: Reinvestigating the Reciprocal Relationship between Democracy and Income Inequality
(t=-0.72) and disposable (t=0.23) income Ginis, respectively, as endogenousregressors.8
Equivalent GMM models were also run using Gini indices from the otherdata sources. Models employing the Galbraith and Kum (2005) Gini, theWDI Gini, and Gini data extracted directly from the WIID on householddisposable incomes (using the above-described algorithm) are reported inTables A.16 – A.18. In general, the choice of inequality measure does notmatter much; there is no clear net effect of income inequality on democ-racy. One exception relates to the System GMM specifications employingthe extracted WIID Gini data: Four of five such models in Table A.18 showa statistically significant (at least 10 percent) Gini, and actually indicate thathigher inequality increases democracy. Nevertheless, these models only drawon about 350 5-year period observations from around 95 countries, and allmodels may be affected by the too-many-instruments problem. In the Sys-tem GMM model with fewer instruments than countries – which also pro-duces acceptable p-values for the Ar(2) and Hansen tests – the effect is in-significant (t=0.45).
Second, the datasets generated by the multiple imputation model, de-scribed in Section 3.2, were employed. The null-result might stem frommissing data reducing the precision of the estimates, or even generatingbiases. Whereas Models BI and BII contain around 3000 country-year ob-servations, the models including imputed data exceed 7000 observationsfrom more than 180 countries. The multiple imputation was conductedon the country-year version of the dataset, so calculating the appropriateimputation-corrected standard errors over the ten imputed datasets is onlyfeasible for this format. This is therefore the baseline, but additional testsare conducted on a collapsed 5-year period version.9
Some models including imputed data show support for the hypothesisthat low levels of income inequality – at least when proxied by WS – inducemore democratic regimes. More specifically, 3 of the 12 GMM specifica-tions reported in Table A.37 show a positive and significant WS at 5 percent(whereas three other models show a negative, but insignificant WS). How-ever, there are about 6 times as many instruments as countries in two ofthese specifications. The only appropriate specification – an Arellano-Bondmodel with one lag on the dependent variable and using only the secondlag for instrumentation – is reported as Model BX in in Table 4. Here, thet-value of WS is 2.7. However, System GMM specifications with relativelyfew instruments – and that perform well on the Hansen J-test and Ar(2) test(though not the Ar(3) test) – show no effect of WS. These models include
8 For the Gini coefficients, high values indicate higher inequality; see also Tables A.14 andA.15.
9 For the latter, variable-scores are averages over the ten imputed datasets, and errors arenot imputation corrected. Thus, these models underestimate the errors by failing to ac-count for the data being imputed rather than observed (see, e.g., Honaker and King 2010).
http://www.rei.unipg.it/rei/article/view/173 21
REVIEW OF ECONOMICS AND INSTITUTIONS, Vol. 6, Issue 2 - Summer-Fall 2015, Article 1
the two System GMM models reported as BXI and BXII in Table 4. Thereis some evidence that WS increases democracy also from the 5-year panelmodels (see Table Table A.39), although one should keep in mind that thestandard errors here are not imputation corrected. However, this evidenceis at best mixed – as suggested by contrasting the weakly significant coef-ficient in the Arellano-Bond Model BXIII with the statistically insignificantcoefficient in the System GMM model BXIV. Furthermore, as Table A.38 re-porting models using the Solt market income Gini illustrates, there are noindications of any effect when employing various Gini coefficients ratherthan WS. In sum, there is no robust evidence that low inequality inducesdemocracy.
4.2.1 Separating between effects on democratization and democratic sur-vival
The lack of any robust effect of inequality on democracy level may, how-ever, be due to inequality having quite different effects on democratizationand on democratic stability. Making this distinction, Houle (2009) does notfind that low inequality enhances democratization. However, he does findthat low inequality stabilizes existing democracies. I reinvestigate this by – asHoule does – running dynamic probit models. Some specifications, employ-ing the control variables from above, are reported in Table A.43. The tableincludes models using WS and the SWIID market income Gini as inequalitymeasures, and different democracy measures: PI is dichotomized by classi-fying all country-years that score ≥ 6 on PI (-10 to 10) as democracies, and Ialso employ the dichotomous DD, or ACLP, measure distinguishing democ-racies from dictatorships according to whether contested elections exist ornot (Cheibub et al. 2010).
I tested different specifications – also other than those reported in TableA.43 – and neither the effect on democratization nor on democratic stabil-ity is robust. The models using DD and WS provide some indications thathigher inequality spurs democratization, as suggested by Acemoglu andRobinson (2000). However, the result turns insignificant when exchangingeither the democracy or the inequality measure. The more surprising find-ing, in light of the results in Houle (2009), is that the inequality–democraticstability relationship is also very sensitive. Houle uses WS as inequalitymeasure and DD as democracy measure. My model using these measures,and including year-specific effects, replicates Houle’s main result; lower in-equality significantly (5 percent) enhances democratic stability. This resultis also retained in the model including year-specific effects and using di-chotomized Polity. Still, including year-specific effects on both democrati-zation and democratic survival leads to serious collinearity issues and thesample being approximately halved. When excluding year-specific effects,there is no significant relationship between WS and democratic survivaleven at 10 percent. Furthermore, no model using SWIID Gini coefficients
Knutsen: Reinvestigating the Reciprocal Relationship between Democracy and Income Inequality
report anything close to significant effects on democratic survival.10
In sum, the main result in Houle (2009) – low inequality stabilizes democ-racies – is not robust.11 The findings above correspond well with those ofTeorell (2010), who fails to identify any robust effect of income inequalityon either democratic “upturns” or “downturns”. Hence, the evidence issimply very weak for any (non-conditional) effect of income inequality ontransitions to and from democracy.
4.3 Further investigating how democracy affects inequality
Rodrik (1999) finds that democracy enhances wages, but how robust isthis relationship to accounting, for example, for endogeneity and sample-selection biases? The analysis below suggests it is fairly robust, althoughit does not hold across all plausible specification choices.12 Nevertheless,there are indications that democracy increases the share of income goingto wages. The evidence is far weaker when it comes to the link betweendemocracy and inequality when the latter is measured by the various Ginicoefficients.
The analysis includes both FE2SLS and GMM models, treating democ-racy as an endogenous independent variable. As already noted in Section3.2, WAVE and RPRI are valid instruments for democracy in regressionswhere inequality is considered the effect-variable. This goes, for instance,for the FE2SLS Model CI in Table 5 with PI as democracy measure and WSas inequality measure: First, WAVE and RPRI are very strong instruments,as evidenced by first-stage t-values of, respectively, -17.8 and 21.9. The Sar-gan overidentification test also indicates the estimator is consistent (p=0.32).Indeed, CI reports a positive significant effect (1 percent) of PI on WS. Theestimated causal effect of “full democratization” on PI is a 6 point increasein the percentage-share of income going to wages. Although not robust tothe choice of inequality measure (see Table A.22), the positive causal effectholds up when using different democracy measures, as illustrated by CIIemploying UDS (t=3.1; Sargan p=0.28).13 Also when substituting WS with
10 This non-result is even clearer when including imputed data to account for sample selec-tion biases. This is, for instance, clear from Table A.44, but the non-robust link betweeninequality and democratic survival has also been replicated for different model speci-fications and datasets based on other imputation models for previous working paperversions.
11 Furthermore, the dynamic probit models presented here and in Houle (2009) do not ac-count for the endogeneity of inequality. I tried out different instrumental variables dy-namic probit models, but they did not converge.
12 This is also demonstrated by Acemoglu et al. (2013, 44–46), who report that Rodrik’sresults are not completely robust when employing models more closely resembling Ro-drik’s original specification.
13 I also tested a Treatment-Effects selection model (Greene 2003, 787-789), applying thedichotomous DD measure. In the first-stage equation, DD is considered a function of thecontrols, RPRI and WAVE. This model indicates that democracy – also when measuring
http://www.rei.unipg.it/rei/article/view/173 23
REVIEW OF ECONOMICS AND INSTITUTIONS, Vol. 6, Issue 2 - Summer-Fall 2015, Article 1
the disposable income Gini from Solt (2009) in Model CIII, there are indica-tions of democracy reducing income inequality (t=-1.9; Sargan p=0.78).
Also the baseline GMM models run on the country-year panels mostlyreport a positive and significant PI when WS is the dependent variable (seeTable A.23).14 Some of these models also seem well-specified according tothe Ar- and Hansen J-test statistics. For example, Model CIV is an Arellano-Bond model including only one lag of WS as regressor, with an Ar(2)-test p-value of 0.32, Hansen p-value of 0.20, and fewer instruments than countries.PI is significant at 10 percent, and the estimated short-term effect of full de-mocratization is a 7.6 point increase in WS. When accounting for multipliereffects via the lagged dependent variable, the estimated long-run effect is asubstantial 10.5 increase in the share of total income going to wages. In theequivalent System GMM model (CV), the effect is significant at 1 percent.Here, the estimated short-term effect of full democratization is lower (5.7),but the long-term effect is higher (20.4). To illustrate, the latter is substan-tially larger than even the difference in WS scores (14.3) between Swedenand the (far more inegalitarian) US in year 2000.
The results are somewhat more mixed, but still point in the same di-rection, when employing 5-year panels. Table A.25 reports 12 differentArellano-Bond and System GMM specifications, for instance varying thenumber of lags used for instrumentation and varying whether only PI orthe whole set of regressors are considered endogenous. All 12 models showpositive PI coefficients, ranging from 0.02–0.11, and 6 (7) of these coefficientsare significant at 5 (10) percent. Two of these models are also reported, asCVI and CVII, in Table A.5.15 As shown in the Appendix, this pattern (apositive effect of democracy on WS that is often significant, but not robust),holds up also in two-step models and models using different democracymeasures on the 5-year panels. Further, the results are quite similar, al-though slightly weakened, when also controlling for education (see TableA.27). This is exemplified by Model CVIII, which controls for average yearsof education for the adult (25+ years) population with data from Barro andLee. The point estimate is fairly high (0.088), but the t-value is only 1.6.16
only its contestation component – reduces income inequality (p-value=.003). Going fromdictatorship to democracy is estimated to increase WS by 10.7.
14 Two-step versions of these GMM models more often generate insignificant results, butthe point estimates are fairly sizeable and similar to those in one-step models (see TableA.26).
15 Yet, it should be noted that the Ar(2) test p-value for Model CVII is very low.16 Nevertheless, controlling for education may take out an important channel through
which democracy reduces inequalities, potentially inducing post-treatment bias. Demo-cratic regimes may incentivize politicians to provide broad-based education systems, andnot only elite education, to please large groups of voters, as theorized in various contri-butions (Saint-Paul and Verdier 1993; Lake and Baum 2001) and identified in empiricalcontexts such as 19th century Europe (Lindert 2005) and post-colonial Africa (Stasav-age 2005). This might provide lower-income citizens with the requisite human capital toincrease their productivity and wages, potentially also reducing aggregate inequality.
Knutsen: Reinvestigating the Reciprocal Relationship between Democracy and Income Inequality
Tabl
e5
-Ine
qual
itym
odel
str
eatin
gde
moc
racy
mea
sure
sas
endo
geno
usre
gres
sors
.
CI
CII
CII
IC
IVC
VC
VI
CV
IIC
VII
IC
IXC
XC
XI
CX
IIC
XII
IC
XIV
Dat
a,Pa
nelp
erio
dO
rig.
data
,1-y
ear
Ori
gina
ldat
a,5-
year
Impu
ted
1-ye
arIm
pute
d5-
year
Esti
mat
ion
tech
n.FE
2SLS
FE2S
LSFE
2SLS
A.B
.S.
GM
MA
.B.
A.B
.S.
GM
MA
.B.
A.B
.A
.B.
S.G
MM
A.B
.S.
GM
MD
epen
dent
var.
WS
WS
Gin
iW
SW
SW
SW
SW
SW
SG
ini
WS
WS
WS
WS
b/(t
)b/
(t)
b/(t
)b/
(t)
b/(t
)b/
(t)
b/(t
)b/
(t)
b/(t
)b/
(t)
b/(t
)b/
(t)
b/(t
)b/
(t)
Polit
yin
dex
0.06
0***
-0.0
26**
*0.
076*
0.05
7***
0.08
80.
111*
*0.
057*
*0.
094
-0.0
200.
057
0.08
2***
0.12
0***
0.04
0**
(3.1
9)(-
3.30
)(1
.91)
(3.1
1)(1
.56)
(2.2
8)(2
.00)
(1.5
8)(-
0.87
)(1
.48)
(2.8
2)(2
.96)
(2.0
3)U
DS
(mea
nsc
ore)
2.61
8***
(3.0
8)Ln
GD
Pp.
c.-2
5.96
3***
-24.
771*
**-6
.835
***
2.49
8-1
2.05
3**
-9.9
49-7
6.99
1**
-13.
997*
*-9
.443
23.8
20**
*0.
638
-0.6
44-0
.049
-2.3
95(-
3.88
)(-
3.73
)(-
2.62
)(0
.19)
(-2.
26)
(-0.
34)
(-2.
17)
(-2.
03)
(-0.
29)
(2.7
3)(0
.70)
(-0.
56)
(-0.
02)
(-1.
21)
LnG
DP
p.c.
sq1.
559*
**1.
485*
**0.
435*
**0.
269
0.74
0**
0.77
74.
286*
*0.
871*
*0.
739
-1.3
43**
-0.0
510.
078
0.00
60.
163
(3.9
2)(3
.77)
(2.7
2)(0
.33)
(2.1
6)(0
.44)
(2.0
9)(2
.04)
(0.3
8)(-
2.56
)(-
0.72
)(0
.98)
(0.0
5)(1
.31)
Lnoi
l-ga
sin
c.-0
.035
-0.0
79-0
.056
0.46
1*0.
026
0.52
01.
407
0.17
10.
499
0.04
4-0
.068
0.02
10.
263
-0.0
02(-
0.22
)(-
0.50
)(-
0.71
)(1
.76)
(0.2
5)(0
.99)
(1.2
7)(0
.92)
(0.9
4)(0
.18)
(-0.
31)
(0.1
1)(0
.84)
(-0.
01)
Lnpo
pula
tion
0.31
61.
056
4.04
0***
3.84
1-0
.547
***
4.69
11.
036
-0.9
36**
*5.
093
-5.6
08**
-0.3
98-1
.087
***
1.31
3-0
.755
***
(0.2
1)(0
.66)
(6.0
9)(0
.90)
(-2.
60)
(0.6
3)(0
.13)
(-3.
01)
(0.7
5)(-
2.03
)(-
0.50
)(-
4.61
)(0
.52)
(-5.
42)
Lnre
gim
edu
r.0.
031
-0.0
62-0
.149
0.11
60.
339
0.81
11.
582
0.62
20.
762
0.05
10.
024
0.43
20.
680*
0.52
6**
(0.1
3)(-
0.26
)(-
1.42
)(0
.39)
(1.5
4)(1
.11)
(1.3
9)(1
.48)
(1.0
4)(0
.17)
(0.0
9)(1
.84)
(1.7
2)(2
.26)
Avg
yrs
educ
atio
n-1
.174
(-0.
78)
Lag
dep
var
0.27
60.
720*
**-0
.038
0.24
8**
0.54
3***
-0.0
470.
121*
-0.1
310.
429*
**-0
.333
***
0.38
6***
(1.1
6)(8
.13)
(-0.
40)
(2.5
5)(6
.37)
(-0.
50)
(1.8
4)(-
0.93
)(5
.06)
(-6.
28)
(9.5
5)La
g2
dep
var
-0.1
86**
*-0
.158
*0.
116
-0.1
50**
*-0
.256
***
-0.1
73**
*0.
319*
**(-
3.40
)(-
1.66
)(1
.50)
(-3.
09)
(-7.
51)
(-4.
27)
(6.8
6)Ye
ar/P
erdu
mm
ies
YY
YY
YY
YY
YY
YY
N27
6427
4633
4125
8527
8540
940
951
539
847
071
6973
5310
2612
08C
ount
ries
106
105
122
113
115
9191
103
8711
418
418
418
218
2A
r(2)
test
p-va
l0.
320.
550.
870.
880.
000.
240.
090.
120.
020.
150.
00A
r(3)
test
p-va
l0.
120.
330.
430.
120.
930.
000.
75H
anse
nJ-
test
p-va
l0.
200.
980.
350.
990.
930.
430.
510.
040.
220.
590.
46Sa
rgan
test
p-va
l0.
320.
280.
78En
dog.
regr
esso
rsPI
UD
SPI
PIPI
PISe
tPI
PIPI
PIPI
PIPI
Lag(
s)fo
rin
str.
22
All
3–5
All
All
All
22
All
All
Nr.
inst
rum
ents
9313
849
115
5850
4998
145
4958
Not
es:p<
.10;*
*p<
.05;*
**p<
.01.
T-va
lues
inpa
rent
hese
s.W
age
shar
eor
SW
IIDG
inim
easu
refo
rdi
spos
able
inco
me
ineq
ualit
yar
ede
pend
entv
aria
bles
.FE
2SLS
desi
gnat
esfix
edef
fect
stw
o-st
age
leas
tsq
uare
sm
odel
s.A
.B.
desi
gnat
es(fi
rst-d
iffer
ence
)A
rella
no-B
ond
GM
Mm
odel
s,w
here
asS
.GM
Mde
sign
ates
(Blu
ndel
l-Bon
d)S
yste
mG
MM
mod
els.
All
inde
pend
ent
varia
bles
are
lagg
edby
one
year
,or
byon
e(5
-yea
r)pe
riod.
All
GM
Mm
odel
sar
eon
e-st
epm
odel
sw
ithro
bust
erro
rs.
WAV
Ean
dR
PR
Iar
eus
edas
inst
rum
ents
for
dem
ocra
cym
easu
res
inth
eFE
2sls
mod
els.
For
“end
ogen
ous
regr
esso
rs”,
“Set
”de
sign
ates
all
inde
pend
ent
varia
bles
exce
ptye
ar/p
erio
ddu
mm
ies.
Reg
ardi
ngla
gsus
edfo
rin
stru
men
tatio
n,th
enu
mbe
rsre
flect
the
exac
tlag
orla
gsus
ed;e
.g.,
“2”
mea
nsth
aton
lyth
ese
cond
lag
was
used
,and
“All”
that
ther
ew
ere
nore
stric
tions
.Fo
r1-
year
perio
dim
pute
dsa
mpl
es,t
here
port
edco
effic
ient
sar
eav
erag
esov
erte
nda
tase
tsan
dth
eer
rors
are
impu
tatio
nco
rrec
ted.
The
Ar(
2)an
dH
anse
nJ
test
stat
istic
sco
uld
notb
eca
lcul
ated
for
the
full
anal
ysis
,an
dar
eth
usre
port
edfro
meq
uiva
lent
mod
els
run
onth
efir
stof
the
ten
impu
ted
data
sets
inis
olat
ion.
For
5-ye
arpe
riod
impu
ted
sam
ples
,th
eda
taar
eav
erag
edov
erte
nim
pute
dda
tase
tsbe
fore
estim
atin
g(e
rror
sar
eno
tim
puta
tion
corr
ecte
dhe
re,a
ndar
eth
usun
dere
stim
ated
).Th
elo
nges
ttim
e-se
ries
exte
ndfro
mth
eea
rly-1
960s
toth
ela
te-2
000s
.
http://www.rei.unipg.it/rei/article/view/173 25
REVIEW OF ECONOMICS AND INSTITUTIONS, Vol. 6, Issue 2 - Summer-Fall 2015, Article 1
The results for the 1-year (Table A.40) and 5-year panels (Table A.42) alsomostly hold up when employing the imputed datasets: Democracy thusseems to boost the share of income going to wages, even when address-ing potential sample selection biases. However, many models includingimputed data encounter problems either with the Ar- or Hansen tests, indi-cating these models may provide inconsistent results after all. This is exem-plified by Models CXI and CXII on 1-year panels, and by Models CXIII andCXIV on 5-year panels.
In sum, the analysis does not provide unequivocal support for Rodrik’shypothesis that democracy increases wages. However, there is, at the veryleast, no evidence that democracy reduces WS. One could go further andnote that the many different model specifications generally point in thesame direction, and that an overweight of the evidence indicates that democ-racy does, indeed, increase wages. This positive estimate is reported insome models that account for sample-selection biases, the endogeneity ofdemocracy, and country- and year-fixed effects. To the extent that WS is agood proxy, democracy seems to generate more egalitarian income distribu-tions. There is, however, one additional concern that should be addressed,namely how choice of inequality measure affects estimates:
When running GMM models similar to above, but with the differentGini coefficients rather than WS as dependent variable, there is surprisinglylittle evidence of any inequality-reducing effect of democracy. Some Sys-tem GMM models using the WDI Gini (Online Appendix Table A.33) orWIID-extracted disposable household Gini (Online Appendix Table A.35)even indicate that democracy increases inequality. Figure 2 illustrates thelack of correspondence between the WS and (for the sake of easing com-parisons, reversed) WDI Gini measure for selected countries, and how thismay influence inferences on democracy and inequality: Autocratic Chinahas traditionally had relatively high Gini-scores and low WS-scores. China’sGini has, however, been declining over the sample period, whereas WS hasnot changed much. In contrast, the US’ Gini-score has held relatively con-stant since 1960, whereas WS has decreased sharply. Poland and Malawiillustrate that also post-democratization changes in Gini and WS may goin different directions. Poland experienced reduction of its relatively high(reversed) Gini after democratization in the early 1990s, whereas WS in-creased throughout the decade. In contrast, Malawi’s WS score was rel-atively unchanged after democratization, whereas its (reversed) Gini in-creased sharply.
Yet, there are, as discussed, problems with using the WDI and WIIDdata, particularly related to small sample sizes and potential for systematicselection biases. Hence, I tested GMM models using SWIID Gini data. WSmeasures share of gross income going to wages. It is therefore natural to ro-bustness test the models above using the SWIID market income Gini. How-ever, as Online Appendix Table A.31 indicates, such models fail to iden-
Notes: The figure shows normalized (0–100) annual PI, WS and (reversed) WDI Gini scores; high values indicaterelatively democratic or egalitarian scores.
tify any inequality-reducing effect of democracy. When running these 12models on the imputed datasets, two models find a significant inequality-reducing effect of democracy at 5 percent (Table A.41), but another specifi-cation actually shows a significant inequality-increasing effect of democracy.It could be that democracy reduces inequality in disposable income throughpromoting more progressive taxation systems and redistributive transfers.Yet, there is no clear evidence of this either. As Table A.31 and the selectedArellano-Bond model CX in Table 5 exemplifies, there is no evidence fromthe GMM models (as opposed to from the FE2SLS model CIII) of any effectof democracy on the disposable income Gini.
4.3.1 Do various types of autocracies differ in inequality and redistribu-tion?
The most obvious explanation for the divergent results on the inequality-reducing effect of democracy involves pointing to the poor quality of in-equality data. If we treat all the measures discussed above as problematicproxies of (the same type of) income inequality concept, interpreting themixed results boils down to acknowledging that there is a lack of robust-ness to the relationship. However, democracies may generally be good atincreasing the wages of workers, whereas at least some types of autocracies
http://www.rei.unipg.it/rei/article/view/173 27
REVIEW OF ECONOMICS AND INSTITUTIONS, Vol. 6, Issue 2 - Summer-Fall 2015, Article 1
pursue quite extensive redistributive strategies, for instance in the form ofsocial welfare and educational policies (Haggard and Kaufman 2008; Knut-sen and Rasmussen 2014), with important consequences (only) for disposableincome inequality measures.17 In particular, several one-party dictatorships,both Communist and non-Communist, have relied on extensive redistribu-tion to their relatively large winning coalitions. The Soviet Union (see Mi-lanovic 1998) and Mexico under the PRI (see Magaloni 2006) are examplesof party-based regimes combining extensive taxation or expropriation withsubsequent redistribution to numerous relatively poor supporters. Such re-distribution is captured by disposable income Gini coefficients, but not byWS (or market income SWIID Gini).
To investigate this further, I utilize data from Hadenius and Teorell (2007)and run models separating between monarchies, military regimes, one-partyregimes, multi-party autocracies, other autocracies (including no-party re-gimes), and democracies.18 Appendix Table A.45 reports OLS PCSE mod-els using WS, the two SWIID Ginis, and the redistribution measure fromSolt (2009) based on differences between the two SWIID Ginis as dependentvariables. No dictatorship type is associated with higher WS than democ-racies. Indeed, monarchies, military regimes and multiparty autocracies areall associated with a significantly (5 percent) lower WS. The monarchy coef-ficient indicates an 11.2 point drop in WS when going from a democracy toan autocratic monarchy.
Monarchies are also less egalitarian than democracies when using mar-ket income and disposable income Ginis as dependent variables. However,none of the other autocracy types are associated with significantly lower in-equality than democracy on the Gini measures, and democracy does notoutperform any autocratic regime type on progressive redistribution.
The most interesting result relates to the one-party dummy. Models us-ing WS and the market income Gini do not find that one-party regimes havesignificantly different income inequalities from democracies. When apply-ing the disposable income Gini, however, one-party regimes are seeminglyassociated with lower inequality. The weakly significant coefficient might bedue to several one-party regimes – including a sizeable number of Commu-nist regimes – pursuing extensive redistribution of income to their relativelypoor winning coalitions through different programs (Haggard and Kauf-
17 Interestingly, the democracy–inequality relationship may depend, more generally, onwhether we measure inequality between groups (as WS; separating wage earners andcapital owners) or individuals (as Gini coefficients). Huber et al. (2011) find that democ-racy reduces inequality between ethnic groups, but not within-group inequality or over-all inequality. Hence, the notion that democracy mainly mitigates between-group in-equalities – also when groups are not distinguished by ethnic characteristics – may con-stitute a viable explanation for the diverging results above.
18 Hadenius and Teorell (2007) separate democracies and dictatorships by taking the aver-age of normalized (0–10) scores on the PI and FHI, and set a threshold of 7.5 for beingcoded as democratic on this index.
Knutsen: Reinvestigating the Reciprocal Relationship between Democracy and Income Inequality
man 2008; Knutsen and Rasmussen 2014). This notion is further supportedwhen employing the redistribution measure from Solt (2009); the one-partydummy remains significant, albeit only at 10 percent. Yet, these results arefrom robust, and it is thus premature to draw any clear conclusions on re-lationships between different types of autocracies, income inequality andredistribution.19 Still, the fact that there is no evidence, whatsoever, for anypositive relationship between democracy and redistribution is noteworthy.
5 Conclusion
Fascinating theoretical work has been produced on the interrelationshipbetween income inequality and democracy. Several empirical studies havealso been conducted on whether and how income inequality affects democ-racy, and on whether and how democracy affects inequality. However, thesestudies have failed to fully account for different, potentially important, bi-ases. When applying models that simultaneously adjust for country- andyear-fixed effects as well as endogeneity bias, the analysis above suggeststhat there is no effect of income inequality on level of democracy. The non-results could, in principle, be due to income inequality having quite differ-ent effects on the probabilities of democratization and democratic survival.High inequality might, for instance, increase democratization prospects –through inducing grievances among the poor and reducing the credibilityof elite commitments to redistribute (Acemoglu and Robinson 2000) – butimpede democratic stability (Houle 2009). Nevertheless, the result that lowinequality stabilizes existing democracies is very sensitive, and so is the re-lationship between inequality and democratization. In sum, there is littleevidence that income inequality causally affects democracy in any simpleand systematic manner.
In contrast, democracy seems to increase the share of income going towages (see also Rodrik 1999), even when accounting for endogeneity andcountry- and year-fixed effects. Since wage earners are generally poorerthan capital owners, this result also indicates that democracy reduces in-come inequality. However, there is no evidence of democracy reducinginequality – neither in gross nor in disposable income – when applyingGini-coefficient data from, for instance, the WIID or SWIID. Furthermore,some results indicated that one-party dictatorships may be associated withmore redistribution and more egalitarian disposable income distributionsthan their democratic counterparts. Despite also these results lacking inrobustness, they point to the potential importance of nuancing the regime
19 When running GMM models accounting for the endogeneity of regime type, the one-party coefficient often changes sign (see Table A.46). The other results are also quitesensitive. As indicated by the changes from Table A.45 to A.46, monarchies, for instance,may not increase inequality after all; it may rather be that monarchies form and survivein already inegalitarian contexts.
http://www.rei.unipg.it/rei/article/view/173 29
REVIEW OF ECONOMICS AND INSTITUTIONS, Vol. 6, Issue 2 - Summer-Fall 2015, Article 1
variable in future research.The clearest conclusion, however, is that choices of measures matter.
Most notably, the inequality-reducing impact of democracy only holds whenusing WS. It is tempting to pursue substantial conclusions based on the di-verging findings: Democracy reduces the inter-group inequality betweenwage earners and capital owners – possibly because democracies allow forfreedom of association, including the freedom to form independent unions,thereby strengthening labor’s bargaining power. Yet, democracy does notreduce broader societal inequalities, neither in terms of gross nor disposableincomes. While tempting, I would caution against prematurely drawingthese conclusions. To the extent that all democracy and inequality measurestap common conceptual cores – and are associated with different reliabilityand validity issues – it may be safer, at this point, to conclude that there isno robust support for any causal effect (in either direction). With the data athand, we simply do not have strongly founded knowledge of any aggregateeffect of democracy on inequality, or of inequality on democracy.
Knutsen: Reinvestigating the Reciprocal Relationship between Democracy and Income Inequality
References
Acemoglu, D., Robinson, J.A., 2000. Why did the West extend the fran-chise? Democracy, inequality, and growth in historical perspective. Quar-terly Journal of Economics 115, 1167-1199. doi: 10.1162/003355300555042
Acemoglu, D., Robinson, J.A., 2006. Economic origins of dictator-ship and democracy. New York: Cambridge University Press. doi:10.1017/cbo9780511510809
Acemoglu, D., Robinson, J.A., Yared., P. 2008. Income and Democracy.American Economic Review 98, 808-842.
Acemoglu, D., Naidu, S., Restrepo, P., Robinson, J.A. 2013. Democracy, re-distribution and inequality. Cambridge, MA.: NBER Working Paper No.19746. doi: 10.3386/w19746
Aidt, T.S., Jensen, P.S. 2013. Democratization and the size of government:Evidence from the long 19th century. Public Choice 157, 511-542. doi:10.1007/s11127-013-0073-y
Albertus, M., Menaldo, V. 2014. Gaming democracy: Elite dominance dur-ing transition and the prospects for redistribution. British Journal of Polit-ical Science, Forthcoming. doi: 10.1017/s0007123413000124
Alesina, A., Devleeschauwer, A., Easterly, W., Kurlat, S., Wacziarg, R. 2003.Fractionalization. Journal of Economic Growth 8, 155-194.
Alesina, A., Perotti, R. 1996. Income distribution, political instability andinvestment. European Economic Review 40, 1203-1228. doi: 10.1016/0014-2921(95)00030-5
Ansell, B. , Samuels, D. 2010. Inequality and democratization: A con-tractarian approach. Comparative Political Studies 43, 1543-1574. doi:10.1016/0014-2921(95)00030-5
Arellano, M., Bond, S. 1991. Some tests of specification for panel data: MonteCarlo evidence and an application to employment equations. Review ofEconomic Studies 58, 277-297. doi: 10.2307/2297968
Barro, R.J., Lee, J-W. 1993. International comparisons of educational at-tainment. Journal of Monetary Economics 32, 363-394. doi: 10.1016/0304-3932(93)90023-9
Beck, N., Katz, J.N. 1995. What to do (and not to do) with time-seriescross-section data. American Political Science Review 89, 634-647. doi:10.2307/2082979
REVIEW OF ECONOMICS AND INSTITUTIONS, Vol. 6, Issue 2 - Summer-Fall 2015, Article 1
Blundell, R., Bond, S.R. 1998. Initial conditions and moment restrictionsin dynamic panel data models. Journal of Econometrics 87, 115-143. doi:10.1016/s0304-4076(98)00009-8
Bollen, K.A., Jackman, R.W. 1985. Political democracy and the sizedistribution of income. American Sociological Review, 438-457. doi:10.2307/2095432
Bollen, K.A., Jackman, R.W. 1995. Income inequality and democratizationrevisited: Comment on Muller. American Sociological Review 60, 983-989.doi: 10.2307/2096436
Brautigam, D. 1997. Institutions, economic reform and democratic consoli-dation in Mauritius. Comparative Politics 30, 45-62. doi: 10.2307/422192
Bueno de Mesquita, B., Smith, A., Siverson, R.M., Morrow, J.D. 2003. Thelogic of political survival. Cambridge, Ma.: MIT Press.
Burkhart, Ross E. 1997. Comparative democracy and income distribution:Shape and direction of the causal Arrow. Journal of Politics 59, 148-164.doi: 10.2307/2998219
Burkhart, R.E. 2007. Democracy, capitalism, and income inequality:seeking causal directions. Comparative Sociology 6, 481-507. doi:10.1163/156913307x233683
Casper, G., Tufis, C. 2003. Correlation versus interchangeability: The lim-ited robustness of empirical findings on democracy using highly correlateddata sets. Political Analysis 11, 196-203. doi: 10.1093/pan/mpg009
Chabal, P., Daloz, J-P. 1999. Africa works: Disorder as political instrument.Oxford: James Currey. doi: 10.2307/20049597
Cheibub, J.A. 1998. Political regimes and the extractive capacity of govern-ments: Taxation in democracies and dictatorships. World Politics 50, 349-376. doi: 10.1017/s0043887100012843
Cheibub, J.A, Gandhi, J., Vreeland, J. 2010. Democracy and dictatorship re-visited. Public Choice 143, 67-101.
Chong, A. 2004. Inequality, democracy, and persistence: Is there a politi-cal Kuznets curve? Economics & Politics 16, 189-212. doi: 10.1111/j.1468-0343.2004.00137.x
Knutsen: Reinvestigating the Reciprocal Relationship between Democracy and Income Inequality
Dahl, R.A. 1989. Democracy and its critics. New Haven: Yale UniversityPress.
Deyo, F.C. 1998. Industrial flexibility, economic restructuring and East Asianlabor. In the four Asian tigers: Economic development and the global polit-ical economy, Ed. Kim, E.-M. Academic Press, 184-207. doi: 10.1016/b978-012407440-8/50019-4
Diamond, L., Morlino. L. 2005. Introduction. In assessing the quality ofdemocracy, Ed. Diamond, L., Morlino, L. Baltimore: Johns Hopkins Uni-versity Press, ix-xliii.
Dreze, J., Amartya, S. 2002. Democratic practice and social inequal-ity in India. Journal of African and Asian Studies 37, 6-37. doi:10.1177/002190960203700202
Engerman, S.L., Sokoloff, K.L 1997. Factor endowments, institutions, anddifferential paths of growth among new world economies: A view fromeconomic historians of the United States. In How Latin America Fell Be-hind, Ed. Haber, S. Stanford: Stanford University Press, 260-304.
Freeman, J.R., Quinn, D.P. 2012. The economic origins of democ-racy reconsidered. American Political Science Review 106, 58-80. doi:10.1017/s0003055411000505
Galbraith, J.K., Kum, H. 2005. Estimating the inequality of household in-comes: Toward a dense and consistent global data set. Review of Incomeand Wealth 51, 115-143. doi: 10.1111/j.1475-4991.2005.00147.x
Gandhi, J. 2008. Dictatorial institutions and their impact on eco-nomic growth. European Journal of Sociology 49, 3-30. doi:10.1017/s0003975608000015
Gates, S., Hegre, H., Jones, M.P., Strand, H. 2006. Institutional inconsistencyand political instability: Polity duration, 1800-2000. American Journal ofPolitical Science 50, 893-908. doi: 10.1111/j.1540-5907.2006.00222.x
Gerry, C.J., Mickiewicz, T.M. 2008. Inequality, democracy and taxation:Lessons from the post-communist transition. Europe-Asia Studies 60, 89-111. doi: 10.1080/09668130701760356
Gradstein, M., Milanovic, B. 2004. Does liberte = egalite? A survey of theempirical links between democracy and inequality with some evidence onthe transition economies. Journal of Economic Surveys 18, 515-537. doi:10.1111/j.0950-0804.2004.00229.x
REVIEW OF ECONOMICS AND INSTITUTIONS, Vol. 6, Issue 2 - Summer-Fall 2015, Article 1
Grossman, G.M., Helpman, E. 2001. Special interest politics. Cambridge,Ma.: The MIT Press.
Hadenius, A., Teorell, J. 2007. Pathways from authoritarianism. Journal ofDemocracy 18, 143-156. doi: 10.1353/jod.2007.0009
Haggard, S., Kaufman, R.R. 2008. Development, democracy, and welfarestates: Latin America, East Asia, and Eastern Europe. Princeton: PrincetonUniversity Press.
Haggard, S., Kaufman., R.R. 2012. Inequality and regime change: Demo-cratic transitions and the stability of democratic rule. American PoliticalScience Review 106, 495-516. doi: 10.1017/s0003055412000287
Honaker, J., King, G. 2010. What to do about missing values in time-seriescross-section data. American Journal of Political Science 54, 561-581. doi:10.1111/j.1540-5907.2010.00447.x
Houle, C. 2009. Inequality and democracy: Why inequality harms consoli-dation but does not affect democratization. World Politics 61, 589-622. doi:10.1017/s0043887109990074
Huber, J.D., Ogorzalek, T.K, Gore, R. 2011. Democracy, targeted redistri-bution and ethnic inequality. New York: Columbia University. WorkingPaper.
Huntington, S.P. 1991. The third wave: Democratization in the late Twenti-eth century. Norman: University of Oklahoma Press.
Knutsen, C.H. 2011a. Democracy, dictatorship and protection ofproperty rights. Journal of Development Studies 47, 164-182. doi:10.1080/00220388.2010.506919
Knutsen, C.H. 2011b. The economic effects of democracy and dictatorship.PhD thesis. University of Oslo, Department of Political Science.
Knutsen, C.H., Rasmussen, M. 2014. The autocratic welfare state: Resourcedistribution, credible commitments and regime survival. University ofOslo and Aarhus University: Working paper. doi: 10.2139/ssrn.2482593
Kuran, T.. 1989. Sparks and prairie fires: A theory of unanticipated politicalrevolution. Public Choice 61, 41-74. doi: 10.1007/bf00116762
Kuznets, S. 1955. Economic growth and income inequality. American Eco-nomic Review 45, 1-28.
Lake, D.A., Baum, M.A. 2001. The invisible hand of democracy: Politicalcontrol and the provision of public services. Comparative Political Studies34, 587-621. doi: 10.1177/0010414001034006001
Knutsen: Reinvestigating the Reciprocal Relationship between Democracy and Income Inequality
Lambert, P.J. 2001. The distribution and redistribution of Income. New York:Palgrave.
Leamer, E.E., Maul, H., Rodriguez, S., Schott, P.K., 1999. Does natural re-source abundance increase Latin American income inequality? Journal ofDevelopment Economics 59, 3-42. doi: 10.1016/s0304-3878(99)00004-8
Li, Hongyi, L.S., Zou, H-F. 1998. Explaining international and intertem-poral variations in income inequality. Economic Journal 108, 26-43. doi:10.1111/1468-0297.00271
Lindert, P.H. 2005. Growing public: Social spending and economic growthsince the Eighteenth century. Volume 1. Cambridge: Cambridge UniversityPress.
Lipset, S.M. 1959. Some social requisites of democracy: Economic develop-ment and political legitimacy. American Political Science Review 53, 69-105. doi: 10.2307/1951731
Maddison, A. 2007. Contours of the world economy, 1-2030 AD. Oxford:Oxford University Press.
Magaloni, B. 2006. Voting for autocracy: Hegemonic party survival and itsdemise in Mexico. New York: Cambridge University Press.
Marshall, M.G., Jaggers, K. 2002. Polity IV project - Dataset users’ manual.College Park: Program Center for International Development and ConflictManagement, University of Maryland. Manual.
Meltzer, A., Scott, R. 1981. A rational theory of the size of government. Jour-nal of Political Economy 89, 914-927. doi: 10.1086/261013
Milanovic, B. 1998. Income, inequality, and poverty during the transitionfrom planned to market economy. Washington D.C.: The World Bank.
Miller, M.K. 2014. Democratic pieces: Autocratic elections and democraticdevelopment since 1815. British Journal of Political Science, Forthcoming.doi: 10.1017/s0007123413000446
M , J., Skaaning, S-E. 2013. Autocracies, democracies, and theviolation of civil liberties. Democratization 20, 82-106. doi:10.1080/13510347.2013.738863
Muller, E.N. 1988. Democracy, economic development, and income inequal-ity. American Sociological Review 53, 50-68. doi: 10.2307/2095732
Muller, E.N. 1995. Economic determinants of democracy. American Socio-logical Review 60, 966-982.
REVIEW OF ECONOMICS AND INSTITUTIONS, Vol. 6, Issue 2 - Summer-Fall 2015, Article 1
Mulligan, C.B., Sala-i Martin, X., Gill, R. 2004. Do democracies have differ-ent public policies than non-democracies? Journal of Economic Perspec-tives 18, 51-74. doi: 10.1257/089533004773563430
Munck, G.L., Verkuilen, J. 2002. Conceptualizing and measuring democ-racy: Evaluating alternative indices. Comparative Political Studies 35, 5-34.doi: 10.1177/0010414002035001001
Pemstein, D., Meserve, S., Melton, J. 2010. Democratic compromise: A La-tent variable analysis of ten measures of regime type. Political Analysis 21,1-24. doi: 10.1093/pan/mpq020
Piketty, T. 2014. Capital in the Twenty-First century. Cambridge, Ma.: TheBelknapp Press of Harvard University Press.
Przeworski, A. 2010. Democracy and the limits of self-government. Cam-bridge: Cambridge University Press.
LPrzeworski, A., Alvarez, M.E., Cheibub, J.A., Limongi, F. 2000. Democracyand development. Political institutions and well-being in the world, 1950-1990. Cambridge: Cambridge University Press.
Rodrik, D. 1999. Democracies pay higher wages. The Quarterly Journal ofEconomics 114, 707-738. doi: 10.1162/003355399556115
Rogowski, R.L. 2009. What changes inequality, and what does inequalitychange? Paper presented at the 50th Annual ISA Conference in New York.
Roodman, D. 2009a. How to do xtabond2: An introduction to difference andsystem GMM in Stata. Stata Journal 9, 86-136.
Roodman, D. 2009b. A note on the theme of too many instruments. Ox-ford Bulletin of Economics and Statistics 71, 135-158. doi: 10.1111/j.1468-0084.2008.00542.x
Ross, M. 2001. Does oil hinder democracy? World Politics 53, 325-361. doi:10.1353/wp.2001.0011
Ross, M.L. 2011. Replication data for: Oil and gas production and value,1932-2009, Version 4. Data set.
Rubinson, R., Quinlan, R., 1977. Democracy and social inequality: A reanal-ysis. American Sociological Review 42, 611-623. doi: 10.2307/2094559
Saint-Paul, G., Verdier, T. 1993. Education, democracy and growth. Journalof Development Economics 42, 399-407. doi: 10.1016/0304-3878(93)90027-k
Sirowy, L., Inkeles, A. 1990. The effects of democracy on economic growthand inequality: A review. Studies in Comparative International Develop-ment 25, 126-156. doi: 10.1007/bf02716908
Knutsen: Reinvestigating the Reciprocal Relationship between Democracy and Income Inequality
Solt, F. 2009. Standardizing the world income inequality database. SocialScience Quarterly 90, 231-242. doi: 10.1111/j.1540-6237.2009.00614.x
Solt, Frederick. 2014. The standardized world income inequality database.University of Iowa: Working Paper.
Stasavage, D. 2005. Democracy and educational spending in Africa. Ameri-can Journal of Political Science 49, 343-358.
Teorell, J. 2010. Determinants of democratization: Explaining regime changein the world, 1972-2006. Cambridge: Cambridge University Press.
Timmons, J.F. 2010. Does democracy reduce economic inequality? BritishJournal of Political Science 40, 741-757. doi: 10.1017/s0007123410000165
UNIDO. 2011. INDSTAT2 2011 ISIC Rev. 3. Data set.
UNU-WIDER. 2008. World income inequality database, Version 2.0c. Dataset.
Vanhanen, T.. 1997. Prospects of democracy: A study of 172 countries. Lon-don: Routledge.
Ziblatt, D. 2008. Does landholding inequality block democratization? A testof the bread and democracy thesis and the case of Prussia. World Politics60, 610-641. doi: 10.1353/wp.0.0021