JRER | Vol. 39 | No. 1 – 2017 REITs and Market Microstructure: A Comprehensive Analysis of Market Quality Authors Pawan Jain, Mark Sunderman, and K. Janean Westby-Gibson Abstract In this study, we analyze the market quality differences, in terms of liquidity and volatility, between real estate investment trusts (REITs) and non-REIT common stocks. The recent financial crisis has significantly influenced the market quality for REITs. Our findings reveal intraday patterns indicating a lower liquidity, higher volatility, and greater price impact for REITs than non- REITs for the pre-crisis period. These relations reverse during the post-crisis period with REITs becoming more liquid, less volatile, and cheaper to trade than non-REITs. Further, we document that post-crisis trading interest in REITs has increased significantly as reflected by increased volume, number of trades, and number of quotes. The ability of real estate investment trusts (REITs), as real estate investments, to be traded in the secondary market as common stocks has intrigued researchers since the early 1990s. The fact that REITs are traded on the secondary markets makes them more liquid than traditional real estate investments. However, REITs may not necessarily be perfect substitutes for conventional equity due to their unique institutional features. Specifically, the dividend distribution requirement and greater level of institutional ownership for REITs limits managerial discretion (Jensen, 1986) and improves corporate governance (Chung, Fung, and Hung, 2012). 1,2 This implies a lower level of asymmetric information and, therefore, different risk characteristics as compared to non-REIT common stocks. These different characteristics make REITs more attractive to general investors due to their potential for adding diversification benefits to stock portfolios (Huang and Zhong, 2013; Chun, Sa-Aadu, and Shilling, 2004). However, any diversification benefits must be weighed against market microstructure differences, such as stock market liquidity and price volatility, which may translate into higher trading costs (Cannon and Cole, 2011; Bertin, Kofman, Michayluk, and Prather, 2005). 3 In this paper, we investigate the impact of the 2008 financial crisis on REIT market quality. Hoffmann, Post, and Pennings (2013) argue that the 2008 financial crisis
Transcript
J R E R u V o l . 3 9 u N o . 1 – 2 0 1 7
R E I Ts a n d M a r k e t M i c r o s t r u c t u r e :
A C o m p r e h e n s i v e A n a l y s i s o f M a r k e t
Q u a l i t y
A u t h o r s Pawan Jain , Mark Sunderman, and K. Janean
Westby-Gibson
A b s t r a c t In this study, we analyze the market quality differences, in terms
of liquidity and volatility, between real estate investment trusts
(REITs) and non-REIT common stocks. The recent financial
crisis has significantly influenced the market quality for REITs.
Our findings reveal intraday patterns indicating a lower liquidity,
higher volatility, and greater price impact for REITs than non-
REITs for the pre-crisis period. These relations reverse during
the post-crisis period with REITs becoming more liquid, less
volatile, and cheaper to trade than non-REITs. Further, we
document that post-crisis trading interest in REITs has increased
significantly as reflected by increased volume, number of trades,
and number of quotes.
The ability of real estate investment trusts (REITs), as real estate investments, to
be traded in the secondary market as common stocks has intrigued researchers
since the early 1990s. The fact that REITs are traded on the secondary markets
makes them more liquid than traditional real estate investments. However, REITs
may not necessarily be perfect substitutes for conventional equity due to their
unique institutional features. Specifically, the dividend distribution requirement
and greater level of institutional ownership for REITs limits managerial discretion
(Jensen, 1986) and improves corporate governance (Chung, Fung, and Hung,
2012).1,2 This implies a lower level of asymmetric information and, therefore,
different risk characteristics as compared to non-REIT common stocks. These
different characteristics make REITs more attractive to general investors due to
their potential for adding diversification benefits to stock portfolios (Huang and
Zhong, 2013; Chun, Sa-Aadu, and Shilling, 2004). However, any diversification
benefits must be weighed against market microstructure differences, such as stock
market liquidity and price volatility, which may translate into higher trading costs
(Cannon and Cole, 2011; Bertin, Kofman, Michayluk, and Prather, 2005).3
In this paper, we investigate the impact of the 2008 financial crisis on REIT market
quality. Hoffmann, Post, and Pennings (2013) argue that the 2008 financial crisis
6 6 u J a i n , S u n d e r m a n , a n d W e s t b y - G i b s o n
was one of the worst stock market crashes during the past several decades. Theydocument that individual investors were hit hard by the financial crisis, whichalmost halved their portfolio values within a few months. Malmendier and Nagel(2011) document that this dramatic shock to investor wealth permanently shiftedinvestors’ return expectations and risk tolerance. Barberis, Shleifer, and Vishny(1998), Case and Shiller (2003), and Case, Quigley, and Shiller (2005) argue thatif common stocks depreciate in value, some speculators, either irrationally orrationally, extrapolate that stocks no longer represent an attractive investmentopportunity and shift to REITs. REITs tend to have low risk, serve as an inflation-hedging instrument, and have characteristics similar to defensive stocks. REITsare an attractive investment vehicle during highly volatile market conditions(Goetzmann and Ibbotson, 1990; Glascock, Michayluk, and Neuhauser, 2004;Jain, 2015; Cotter and Roll, 2015). Our hypothesis is that this flight to qualityduring the recent financial crisis results in higher trading volume and lowervolatility due to price competition, and better REIT market quality as comparedto non-REIT stocks.
Using high-frequency intraday data, our analyses confirm that REITs have lowerpre-crisis period liquidity and substantially higher price volatility than non-REITstocks as documented by earlier studies. However, we find that liquidity for REITshas improved significantly during the post-crisis period. Our results further showthat, while the financial crisis dramatically increased price volatility for allcommon stocks, REITs were much less affected as compared to matching non-REIT stocks. We also document improved trading interest in REITs during thepost-crisis period as reflected by increased volume, number of trades, and numberof quotes. We find similar results for our intraday analyses. We show that ourresults are robust across different measures of market quality, REIT and non-REITmatching algorithms, and estimation methods. During the period of heightenedvolatility, investors fleeing risky securities found the long-term diversificationbenefits of REITs more attractive, improving the overall market quality of REITs.4
u L i t e r a t u r e R e v i e w
R E I T L i q u i d i t y : H i s t o r i c a l T r e n d
The explosive growth in the REIT market in the 1990s led many researchers totest whether the REIT microstructure environment changed accordingly. Theability of REITs to trade in the stock market makes them more attractive toinvestors as compared to other forms of real estate investments. Illiquidity carriesa price (Amihud and Mendelson, 1991; Brennan and Subrahmanyam, 1996),which can result in a less efficient risk-return trade-off for REITs assuming thatREITs are, ceteris paribus, less liquid than other common stocks. If the influenceof REIT liquidity levels on returns is significant enough, the average investor maynot consider REITs as appropriate substitutes for common stocks. Bhasin, Cole,
R E I T s a n d M a r k e t M i c r o s t r u c t u r e u 6 7
J R E R u V o l . 3 9 u N o . 1 – 2 0 1 7
and Kiely (1997) find a decline in REIT percentage bid-ask spreads duringthe 1990–1994 period. Below, Kiely, and MacIntosh (1996) and Cole (1998)document improved REIT liquidity between 1992 and 1994 and between 1991and 1993, respectively.5
Clayton and MacKinnon (2000) extend the literature by analyzing REIT liquidityfor the period from 1993 to 1996. They find that self-advised, self-managed REITsexhibited liquidity declines during that period. More recently, Cannon and Cole(2011) analyze daily data for the 1988–2007 period. They find that REIT liquidity‘‘improved during the early and mid-1990s, deteriorated during the late 1990s,and then improved dramatically during 2000–2006.’’6 All of these researchersanalyze REIT liquidity during the pre-financial crisis period.
REITs’ dependence on external financing can curtail their ability to exploitprofitable investment opportunities (Mooradian and Yang, 2001). This constraintis likely to be more severe during market crises (Ben-David, Franzoni, andMoussawi, 2011). At such times, capital providers may withdraw, forcingcompanies to liquidate their positions prematurely and leading to a deteriorationof liquidity in the market. These liquidity dry-ups can occur simultaneously acrossasset types, which forces investors to undertake other trades with greater expectedrisk-adjusted returns.7 On the other hand, Ooi, Wong, and Ong (2012) find thatbank lines of credit insure REITs against credit rationing at the broad marketlevel. Therefore, these possible liquidity dry-ups may not be as prominent inREITs.8
We contribute to the REIT literature by analyzing the impact of the recent financialcrisis on REITs’ stock market liquidity. Bhasin, Cole, and Kiely (1997), Claytonand MacKinnon (2002), and Ling and Naranjo (2003) argue that part of theincreased investors’ interest in REITs in the last couple decades stemmed fromdesiring liquid access to the real estate asset class, especially during times of stockmarket downturns. Barberis, Shleifer, and Vishny (1998), Case and Shiller (2003),and Case, Quigley, and Shiller (2005) argue that if stock markets depreciate invalue, some speculators, either irrationally or rationally, extrapolate that stocks nolonger represent an attractive investment opportunity and shift to REITs. Byexamining REIT liquidity before and after the recent financial crisis, weempirically test the above theories.
REITs have low risk, serve as an inflation hedging instrument, and havecharacteristics similar to defensive stocks, which might make REITs an attractiveinvestment vehicle in highly volatile market conditions (Goetzmann and Ibbotson,1990; Glascock, Michayluk, and Neuhauser, 2004; Cotter and Roll, 2015; Jain,2015). This flight to quality should result in higher trading volume for REITs,resulting in better liquidity. We analyze these arguments and test the followinghypothesis:
Hypothesis 1: REIT liquidity improved during the post-financial crisisperiod.
6 8 u J a i n , S u n d e r m a n , a n d W e s t b y - G i b s o n
A r e R E I Ts L e s s L i q u i d t h a n N o n - R E I T C o m m o n S t o c k s ?
Another interesting area of research is the substitutability of REITs for non-REITcommon stocks. Researchers in this area offer conflicting predictions. Nelling,Mahoney, Hildebrand, and Goldstein (1995) document REIT liquidity to be similarto that of other common stocks.9 However, Ghosh, Miles, and Sirmans (1996)find that REITs may not be as liquid as comparably sized non-REIT stocks.10
Since these researchers consider a period before 1995, their findings arequestionable in the current period.11 Hence, comparing REIT and non-REITcommon stock liquidity during the pre- and post-financial crisis periods canprovide some interesting insights about the substitutability of these investmentvehicles. Since REIT income is derived from real property earnings, REITs’ long-term return characteristics must be identical to traditional real estate investments(Giliberto, 1990). Hence, we expect that during periods of extreme volatility andlow interest rates, such as the recent financial crisis, investors would value thelong-term diversification benefits of REITs. Additionally, Jain (2015) argues thatthe recent financial crisis increased the information asymmetry in the stock market.Danielsen, Harrison, Van Ness, and Warr (2014) argue that the regulatorydistribution requirements force REITs to frequently raise capital in the publicmarkets, which makes REITs more transparent (having lower informationasymmetry) as compared to non-REIT stocks. This reduction in informationasymmetry should increase the attractiveness of REITs as an investmentopportunity. As investors flee from opaque common stocks to REITs, liquidity forREITs in comparison to non-REITs should improve. We test the followinghypothesis:
Hypothesis 2: REITs have higher liquidity than non-REITs during thepost-crisis period.
R E I T Vo l a t i l i t y
Understanding the evolution of volatility is very important as volatility is not onlya major determinant of options prices (Foucault, 1999; Hasbrouck and Saar, 2002)but also plays an important role in execution strategies and investment decisions(Fleming, Kirby, and Ostdiek, 2003). Despite its importance, not until recentlyhas REIT idiosyncratic risk attracted the attention of real estate researchers. Ooi,Wang, and Webb (2009) posit that the tendency of real estate markets to belocalized and segmented has led to wide acceptance of the notion that real estateassets and property-related stocks, such as REITs, may be more exposed toidiosyncratic risk than typical common stocks. They find that idiosyncratic risk ispriced and dominates the market beta in explaining REIT returns. Sun and Yung(2009) support these findings. However, Chiang, Jiang, and Lee (2009) find anegative relation between REIT returns and idiosyncratic volatility.12
There is a paucity of published studies on the evolution of REIT volatility overtime. We extend the literature by presenting a comprehensive analysis of REIT
R E I T s a n d M a r k e t M i c r o s t r u c t u r e u 6 9
J R E R u V o l . 3 9 u N o . 1 – 2 0 1 7
volatility during the real estate market peak, bubble burst, and subsequent financialcrisis. We analyze the evolution of REIT volatility during these periods and extendthis analysis by presenting intraday volatility patterns and document the changesinduced by the recent financial crisis. Investors fleeing risky securities during thecrisis would find REITs, and their relatively low risk and inflation hedgingabilities, more attractive. Hence, we expect a lower volatility for REITs ascompared to non-REIT common stocks during the recent financial crisis. We testthe following hypothesis:
Hypothesis 3: REITs have lower volatility than non-REITs during the post-crisis period.
I n t r a d a y P a t t e r n s f o r R E I T L i q u i d i t y a n d Vo l a t i l i t y
Finally, motivated by the literature on investment flows and optimal trading, weexamine the intraday patterns for several market quality variables. The speed oftrading has increased over the past decade and trades now happen within a fewmilliseconds (Hendershott, Jones, and Menkveld, 2011). Hence, an intradayanalysis of liquidity and volatility can have significant implications for howinvestors choose to time their trades, to minimize trading costs or price impact.While there is a rich literature on the intraday patterns for various microstructureparameters (e.g., McInish and Wood, 1992), only Bertin, Kofman, Michayluk, andPrather, (2005) analyze the intraday patterns for REITs. These authors alsocompare the intraday patterns for REITs with matching non-REIT stocks. Whilethey show that REITs have a well-defined U-shape pattern for percentage spreads,they do not find a well-specified intraday pattern for volatility.13 They also showthat REITs have lower liquidity than non-REIT common stocks. However, theseresults are derived using the data from the 1996 period. As shown by Jain (2005),technological advancements have dramatically changed trading; therefore, therelevance of results based on the data from 1996 is questionable. Current stockmarket microstructure research typically excludes REITs from analyses of marketquality due to their unique characteristics discussed above.14 Hence, the liquidityand volatility differences between REITs and common stocks warrant a more in-depth analysis. In addition, we argue that the recent financial crisis might have asignificant impact on investors’ trading behavior and thus, the intraday patternsthat define stock market quality. The identification of post-financial crisis intradayliquidity and volatility patterns of REITs can also provide guidance on the optimaltiming of trades to minimize trading costs or price impact.
u D a t a a n d M e a s u r e s o f L i q u i d i t y a n d Vo l a t i l i t y
We obtain the ticker symbols and the market capitalization for all stocks that wereactively traded from the Center for Research in Security Prices (CRSP) database.We cross-reference the REITs with the January issue of each year (2005–2011)of the National Association of Real Estate Investment Trusts’ (NAREIT’s)
7 0 u J a i n , S u n d e r m a n , a n d W e s t b y - G i b s o n
StockWatch. REITs not listed on StockWatch are deleted from the final sample.We also delete the stocks that are not traded in at least two consecutive years andstocks with no market capitalization available. Since mortgage REITs are differentthan both non-mortgage REITs and other common stocks, we remove these fromour final sample.15 The remaining REITs and non-REIT common stocks arematched based on the previous year-end market capitalization.16 The resultingsample contains 214 REITs and 1,093 matching non-REIT stocks over the entiresample period.
We obtain the intraday data on stock prices, trading volume, trade prices, best bidand ask quotes, and the respective volume supplied for every five minutes oftrading from the New York Stock Exchange (NYSE) Trades and Quotes (TAQ)database for all REITs and non-REIT matching stocks listed on the NYSE for theperiod from January 2005 to June 2011.17
L i q u i d i t y M e a s u r e s
Kyle (1985) states that ‘‘liquidity is a slippery and elusive concept, in part becauseit encompasses a number of transactional properties of markets, these includetightness, depth, and resiliency.’’ The author defines three components of bid-askspread: tightness, depth, and resiliency. Tightness is the distance between the bidand ask quotes. Depth, defined as the volume supplied by each order, basicallyrepresents how many shares an investor can trade at a given price without causinga change in price. Resiliency represents how quickly the market can return to itsoriginal state after a large order. In simple terms, markets are liquid if a tradercan trade quickly at a minimum cost of trading.
Trading volume, most recently studied by Bertin, Kofman, Michayluk, and Prather(2005), has been revealed as a significant activity-based measure of liquidity.However, in this paper, we base our analysis of volume on the number of trades,because Jones, Kaul, and Lipson (1994) find that this is a better measure ofinformation asymmetry. In addition, we also analyze the average trade size andtrading volume.
We estimate four different measures of time-lapse-weighted liquidity—quotedspread, relative spread, effective spread, and relative effective spread—for eachstock at the end of every five minutes of trading as follows:
t D t (Ask 2 Bid )Oi51 i i i
Quoted Spread 5 Sprd 5 (1)t D tOi51 i
(Ask 2 Bid )i i
t D t Ask 1 BidOi51 i i i 43S D2
Relative Spread 5 Rsprd 5 (2)t D tOi51 i
R E I T s a n d M a r k e t M i c r o s t r u c t u r e u 7 1
J R E R u V o l . 3 9 u N o . 1 – 2 0 1 7
where D ti is defined as the time lapse between quotes.
While quoted spread, often called bid-ask spread, is the most widely used measureof liquidity, it is not without critics (Grossman and Miller, 1988; Lee, Mucklowand Ready, 1993).18 Relative spread, sometimes referred to as percentage spread,more accurately reflects the percentage cost of trading by scaling the size of thespread to the fundamental value of the stock, as reflected by the quote midpoint.Higher values for spreads indicate lower liquidity and vice versa.
Effective Spread 5 Esprd
t VOL 2 uPrice 2 Midpoint uOi51 i i i
5 (3)t VOLOi51 i
Relative Effective Spread 5 REsprd
Effective Spreadit VOLO F Gi51 i Midpointi5 (4)
t VOLOi51 i
where VOLi is the trading volume, and Midpointi is defined as:
Effective spread is the difference between the price at which a trader buys a stockand the fundamental value of the stock as reflected by the quote-midpoint (Smithand Whaley, 1994). This measure quantifies the cost of an order by taking twomeasures into account: price movement and the market impact due to wideningof the spread resulting from the size of the order itself. Therefore, effective spreadcan be considered an estimate of the trader’s actual execution cost and the grossrevenue earned by the liquidity provider. Relative effective spread scales theeffective spread by the quote midpoint, and hence, presents a bettercharacterization of a stock’s liquidity provisions. Higher values for spreadsindicate lower liquidity and vice versa.
Vo l a t i l i t y M e a s u r e s
We calculate time-lapse-weighted price volatility for each stock at the end of everyfive minutes of trading as follows:
7 2 u J a i n , S u n d e r m a n , a n d W e s t b y - G i b s o n
Price Volatility 5 Privol
2Pricei2Price 2t S DiD tO Number of Tradesi51 i i5 SQRT . (5)3 4
Number of Trades 2 1i5 6t D tOi51 i
Time-lapse-weighted price volatility presents a more accurate assessment of pricevolatility as it captures the movement in stock prices by taking into account thenumber of trades and the time lapse between subsequent price movements.
u R e s u l t s
D e s c r i p t i v e S t a t i s t i c s
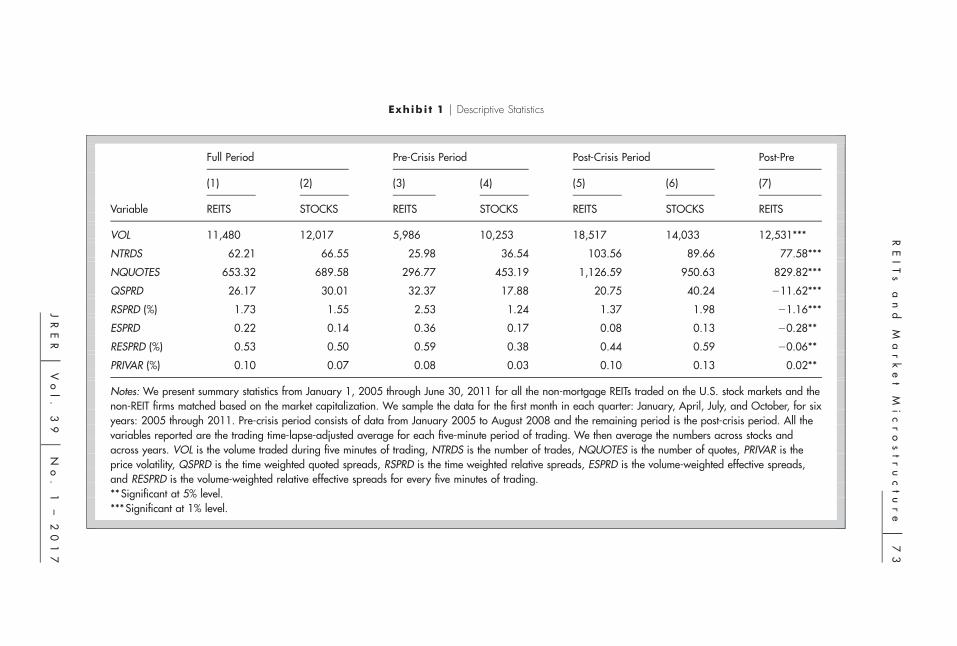
Exhibit 1 reports the descriptive statistics for the various market quality parametersfor REITs and comparable non-REIT firms matched on total market capitalization.We report the means for the full sample period, the pre-crisis period from January2005 to July 2008, and the post-crisis period from August 2008 to June 2011.19
All values presented are calculated by taking the time-lapse-adjusted averages foreach five-minute period of trading and then across stocks. Column (7) presentsthe difference in means for REITs between the pre-crisis and post-crisis periods.
The results in Exhibit 1, summarized in columns (1) and (2) (full sample period),show that shares of REITs have about 5% lower trading volume (VOLUME) thanshares of comparable non-REIT stocks. We also find that the REITs are tradedless than their non-REIT counterparts as reflected by the lower number of trades(NTRDS). The combined effect of VOLUME and NTRDS reflect that the averagetrade size for REITs is significantly lower than non-REIT stocks. As alreadyestablished, REITs are widely held by institutional investors. To reduce priceimpact, it appears that these sophisticated investors are slicing their larger ordersinto several smaller trades to get better execution quality, resulting in a loweraverage trade size and a larger number of trades. We also find that REITs havelower number of quotes (NQUOTES) as compared to non-REIT matching stocks.
Columns (1) and (2) also report that REITs are more liquid than non-REIT stocks,as reflected by lower quoted spreads (QSPRD) and relative spreads (RSPRD).However, REITs also experience a higher price impact compared to matching non-REIT stocks as reflected by higher effective spreads (ESPRD) and relative effectivespreads (RESPRD). Additionally, REITs are nearly 50% more volatile thanmatched non-REIT stocks over the full sample period.
RE
IT
sa
nd
Ma
rk
et
Mi
cr
os
tr
uc
tu
re
u7
3
JR
ER
uV
ol
.3
9u
No
.1
–2
01
7
Exhibi t 1 u Descriptive Statistics
Full Period Pre-Crisis Period Post-Crisis Period Post-Pre
Notes: We present summary statistics from January 1, 2005 through June 30, 2011 for all the non-mortgage REITs traded on the U.S. stock markets and thenon-REIT firms matched based on the market capitalization. We sample the data for the first month in each quarter: January, April, July, and October, for sixyears: 2005 through 2011. Pre-crisis period consists of data from January 2005 to August 2008 and the remaining period is the post-crisis period. All thevariables reported are the trading time-lapse-adjusted average for each five-minute period of trading. We then average the numbers across stocks andacross years. VOL is the volume traded during five minutes of trading, NTRDS is the number of trades, NQUOTES is the number of quotes, PRIVAR is theprice volatility, QSPRD is the time weighted quoted spreads, RSPRD is the time weighted relative spreads, ESPRD is the volume-weighted effective spreads,and RESPRD is the volume-weighted relative effective spreads for every five minutes of trading.**Significant at 5% level.***Significant at 1% level.
7 4 u J a i n , S u n d e r m a n , a n d W e s t b y - G i b s o n
These results contradict the findings of Bertin, Kofman, Michayluk, and Prather(2005) that REITs have lower liquidity and trading volume as compared to non-REIT stocks. We test whether these contradictory results are due to the recentfinancial crisis by dividing our sample into pre- and post-financial crisis periods.The results of this analysis are reported in Exhibit 1, columns (3) through (6). Wefind that during the pre-crisis period (columns (3) and (4)), REITs have 42% lessVOLUME and nearly 29% less NTRDS as compared to non-REIT stocks. We alsofind that the NQUOTES for REITs are almost 35% less than those for non-REITstocks. These results reflect the low level of trading interest in REITs during thepre-financial crisis period as compared to their non-REIT counterparts.
Our pre-crisis liquidity measures, QSPRD and RSPRD, are significantly higher forREITs reflecting that the REITs have lower liquidity than the non-REIT stocks.Hence, our contradictory results [as compared to Bertin, Kofman, Michayluk, andPrather (2005)] are due to the financial crisis. We also find that pre-crisis periodprice impact for REITs is higher than the non-REIT stocks as reflected by higherESPRD and RESPRD. REITs are also nearly 2.5 times more volatile than non-REIT stocks for every five minutes of trading.
Columns (5) and (6) in Exhibit 1 also show that the financial crisis significantlyimpacted both the trading activity and market quality of REITs and non-REITstocks. We find that trading volume for REITs during the post-crisis period isnearly three times the trading volume during the pre-crisis period. We also findthat the NTRDS for REITs increased by almost four times while NQUOTES
increased by more than three and a half times during the post-crisis period ascompared to their pre-crisis level. Comparing the trading activity for REITs withnon-REIT stocks during the post-crisis period, we find that VOLUME and NTRDS
for REITs are much higher than those for non-REIT stocks.20 While the liquidity(QSPRD and RSPRD) has substantially declined for non-REIT stocks and slightlyimproved for REITs during the post-crisis period, REITs are almost 50% moreliquid than non-REIT stocks during the post-crisis period. These findings supportHypothesis 1 (REITs have higher liquidity during the post-crisis period) andHypothesis 2 (REITs have higher liquidity than non-REITs during the post-crisisperiod). We also document that non-REIT stocks experienced a much higherincrease in volatility as compared to REITs during the post-crisis period, makingnon-REIT stocks about 23% more volatile as compared to REITs, which isconsistent with Hypothesis 3 (REITs have lower volatility than non-REITs duringthe post-crisis period). In column (7), we report the statistical significance of thepositive impact of the financial crisis on REIT trading activity as measured bytrading volume, number of trades, number of quotes, and market quality asmeasured by liquidity, price impact, and volatility. The most striking finding isthat, while the trading interest and market quality during the pre-crisis period ishigher for non-REIT matching stocks, REITs have higher trading activity andbetter market quality during the post-crisis period.
R E I T s a n d M a r k e t M i c r o s t r u c t u r e u 7 5
J R E R u V o l . 3 9 u N o . 1 – 2 0 1 7
I n t r a d a y A n a l y s i s o f M a r k e t Q u a l i t y
In this section, we analyze the evolution of various liquidity and volatilitymeasures across a trading day by dividing the trading day into 77 five-minuteintervals. In Exhibits 2–9, we summarize the intraday patterns for each of themarket quality parameters across the 77 intraday trading intervals. For most ofour liquidity and volatility measures, we observe well-established U-shape patterns(see McInish and Wood, 1992).
In Exhibits 2–4, we present the intraday trading pattern for trading volume,number of trades, and number of quotes, respectively, for the pre- and post-crisisperiods. We observe that trading volume for REITs is lower than non-REIT stocksthroughout the trading day during the pre-crisis period; however, REIT tradingvolume is significantly higher than that of non-REIT stocks during the post-crisisperiod. Additionally, REITs are quoted and traded less frequently than non-REITstocks during the pre-crisis period. This relation is reversed during the post-crisisperiod, with REITs having twice as many quotes and trades as their non-REITcounterparts. These results suggest that, while intraday trading in both REITs andnon-REITs increased following the financial crisis, the level of trading in REITsis significantly higher than that of non-REITs during the post-crisis period.
Exhibits 2 and 3 report that REIT trading volume is highest at the end of eachtrading day and reaches the minimum at about 1:30 p.m. Non-REIT stocks showa similar pattern; however, they do have higher pre-crisis trading volume andgreater number of trades than REITs throughout the trading day. In contrast tothe pre-crisis period, the trading volume and number of trades for REITs aresignificantly higher than non-REITs throughout the post-crisis day.
Exhibit 4 illustrates the five-minute average for the number of quotes during thetrading day. While the pre-crisis patterns for both REITs and non-REITs aresimilar and have the previously mentioned U-shaped pattern, the post-crisis tradingday for both REITs and non-REITs begins with the highest number of quotes andthen declines to a minimum at around 1:30 p.m., with a steady rebound to theend of day value. As with trading volume and number of trades, the pre-crisisnumber of quotes for REITs is lower as compared to non-REITs while the post-crisis period number of quotes is higher for the REITs than for non-REIT firms.
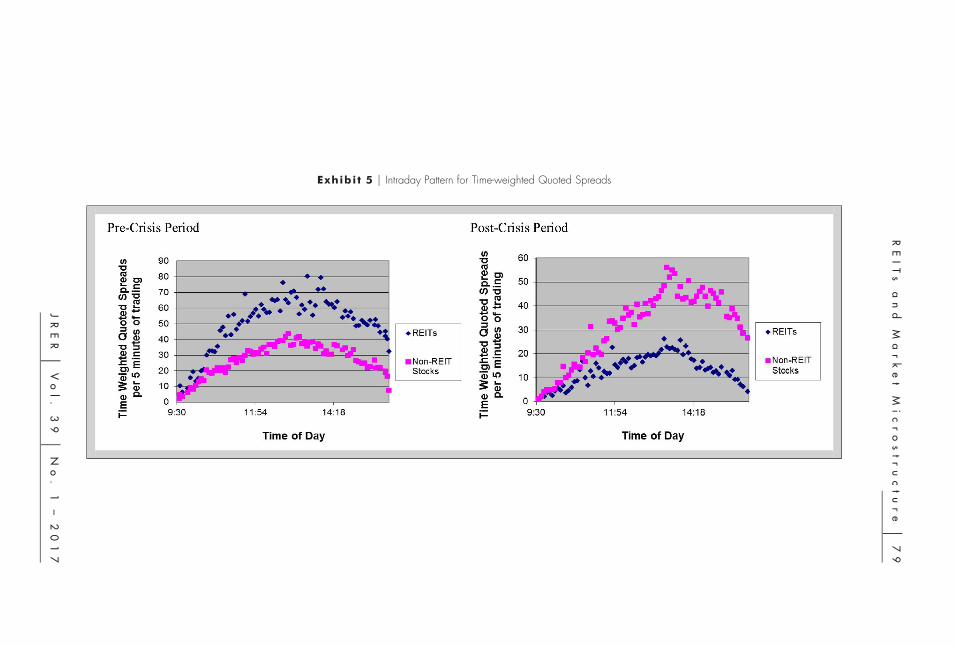
Exhibits 5 and 6 illustrate the intraday patterns for our key liquidity measures:time-lapse-weighted quoted spread and time-lapse-weighted relative spread.Exhibit 5 shows that during the pre-crisis period, REITs were less liquid ascompared to non-REIT matching stocks throughout the day. This relation reversesduring the post-crisis period with REITs having higher liquidity than non-REITmatching stocks. We also observe a more pronounced inverted U-shaped patternfor quoted spreads for both REITs and non-REITs during the pre-crisis period. InExhibit 6, we find similar results for relative spreads with REITs having lowerliquidity than non-REITs during the pre-crisis period. However, during the post-crisis period, REITs become nearly twice as liquid as non-REIT matching stocksas reflected by lower relative spreads throughout the trading day.
76
uJ
ai
n,
Su
nd
er
ma
n,
an
dW
es
tb
y-
Gi
bs
on
Exhibi t 2 u Intraday Pattern for Trading Volume
RE
IT
sa
nd
Ma
rk
et
Mi
cr
os
tr
uc
tu
re
u7
7
JR
ER
uV
ol
.3
9u
No
.1
–2
01
7
Exhibi t 3 u Intraday Pattern for Number of Trades
78
uJ
ai
n,
Su
nd
er
ma
n,
an
dW
es
tb
y-
Gi
bs
on
Exhibi t 4 u Intraday Pattern for Number of Quotes
RE
IT
sa
nd
Ma
rk
et
Mi
cr
os
tr
uc
tu
re
u7
9
JR
ER
uV
ol
.3
9u
No
.1
–2
01
7
Exhibi t 5 u Intraday Pattern for Time-weighted Quoted Spreads
80
uJ
ai
n,
Su
nd
er
ma
n,
an
dW
es
tb
y-
Gi
bs
on
Exhibi t 6 u Intraday Pattern for Time-weighted Relative Spreads
R E I T s a n d M a r k e t M i c r o s t r u c t u r e u 8 1
J R E R u V o l . 3 9 u N o . 1 – 2 0 1 7
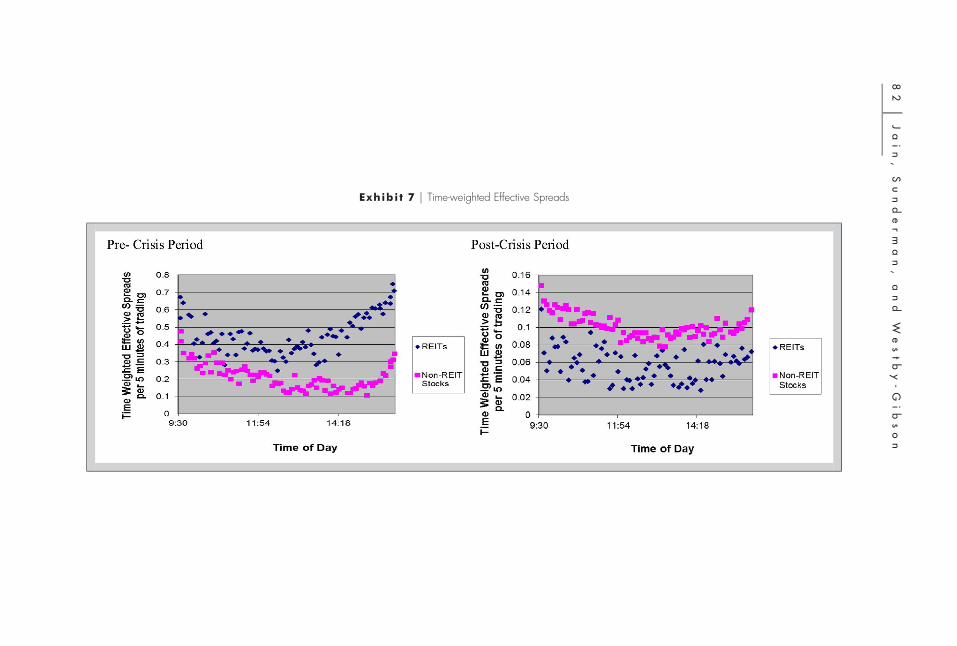
The intraday patterns for price impact as measured by time-lapse-weightedeffective and relative effective spreads are shown in Exhibits 7 and 8. We observethat the effective spreads are larger at the start of the trading day and declinesignificantly during the first half of trading during the pre-crisis period. After thisinitial decline, the level of effective spread starts increasing for the rest of thetrading day for both REITs and non-REITs. The U-shaped pattern for effectivespreads is more pronounced for REITs during the pre-crisis period. The moststriking observation is that REITs experience a larger price impact than non-REITsduring the pre-crisis period. However, this relation reverses during the post-crisisperiod, with REITs experiencing lower price impact than non-REITs.
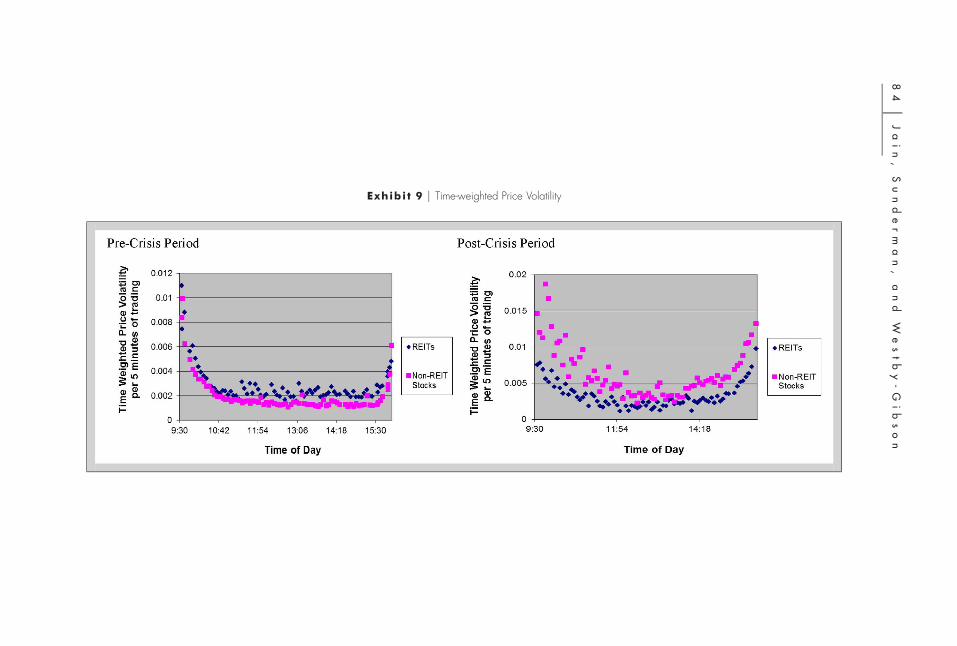
Exhibit 9 presents the intraday patterns for volatility. Both REITs and non-REITsdemonstrate high price volatility during the start and end of the trading day, duringboth sub-periods, forming a U-shaped pattern for the entire trading day. The U-shaped patterns are more pronounced during the post-crisis period. The pre-crisisprice volatility for REITs is much higher than non-REITs. However, during thepost-crisis period, REITs display much lower price volatility than non-REITsthroughout the trading day.
R e g r e s s i o n A n a l y s i s
We follow Stoll’s (2000) model to formally test the liquidity differences betweenREITs and non-REIT matching common stocks. Market orders demand liquiditywhile limit orders supply liquidity. The liquidity demanders incur a cost forimmediate trading due to market frictions. These frictions are measured by theprice premium paid by the liquidity demander for an immediate transaction(Demsetz, 1968; Stoll, 2000). Market sell orders are usually executed at the bidprice, while market buy orders are usually executed at the ask price. The bid-askspread represents the instantaneous cost of a round-trip trade and is a measure ofmarket frictions. Demsetz (1968) and Stoll (2000) model the cross-sectionalrelation of spreads to firms’ trading characteristics as follows:
RSPRD 5 a 1 b LogVOL 1 b LogNTRD 1 b LogMV0 1 2 3
1 b LogPRICE 1 b PRIVAR 1 «, (6)4 5
where RSPRD is the time-weighted relative spread for each five-minute tradinginterval, VOL is the volume traded, and NTRD is the number of trades for eachfive-minute trading interval. MV is the stock’s market value, PRICE is the stock’sprice at the end of each five-minute trading interval, PRIVAR is the price volatilityduring the five-minute trading period, and « is the error term.21
To formally test the differences in liquidity between REITs and non-REITmatching stocks, we add a dummy variable, REIT, to the above model
82
uJ
ai
n,
Su
nd
er
ma
n,
an
dW
es
tb
y-
Gi
bs
on
Exhibi t 7 u Time-weighted Effective Spreads
RE
IT
sa
nd
Ma
rk
et
Mi
cr
os
tr
uc
tu
re
u8
3
JR
ER
uV
ol
.3
9u
No
.1
–2
01
7
Exhibi t 8 u Time-weighted Relative Effective Spreads
84
uJ
ai
n,
Su
nd
er
ma
n,
an
dW
es
tb
y-
Gi
bs
on
Exhibi t 9 u Time-weighted Price Volatility
R E I T s a n d M a r k e t M i c r o s t r u c t u r e u 8 5
J R E R u V o l . 3 9 u N o . 1 – 2 0 1 7
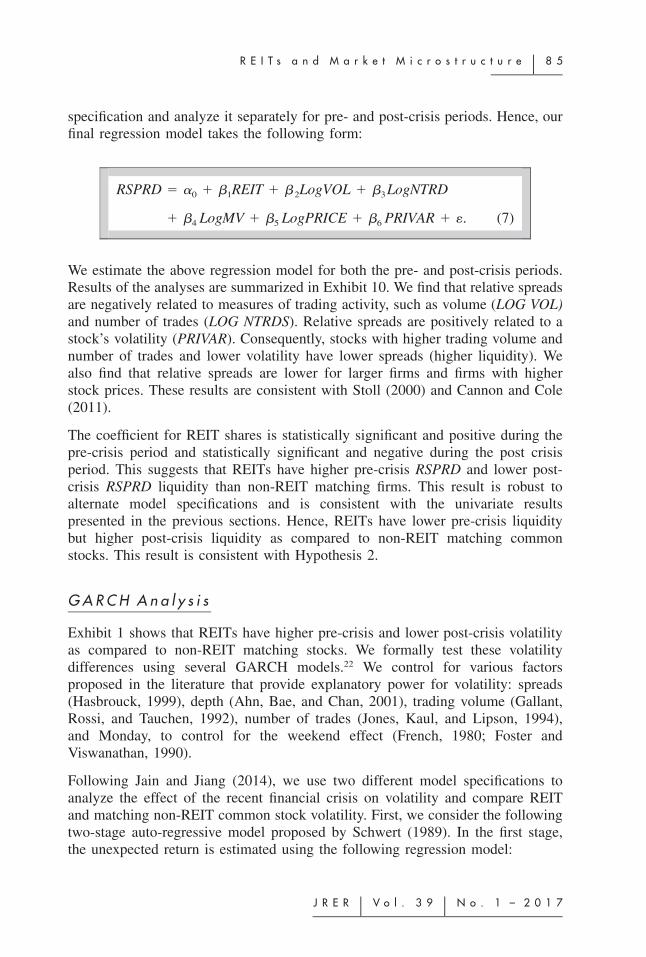
specification and analyze it separately for pre- and post-crisis periods. Hence, our
final regression model takes the following form:
RSPRD 5 a 1 b REIT 1 b LogVOL 1 b LogNTRD0 1 2 3
1 b LogMV 1 b LogPRICE 1 b PRIVAR 1 «. (7)4 5 6
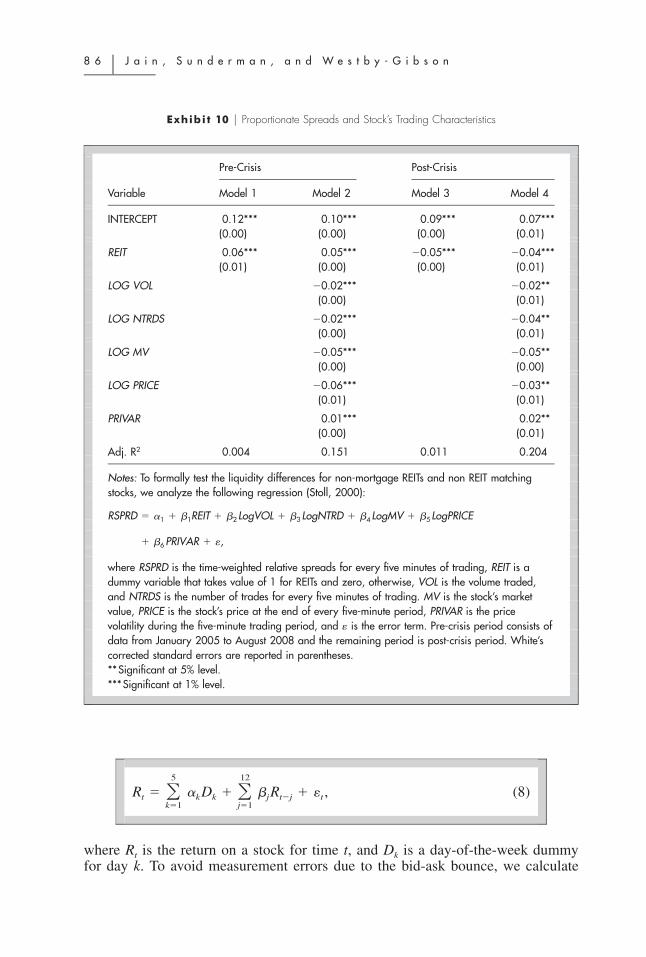
We estimate the above regression model for both the pre- and post-crisis periods.
Results of the analyses are summarized in Exhibit 10. We find that relative spreads
are negatively related to measures of trading activity, such as volume (LOG VOL)
and number of trades (LOG NTRDS). Relative spreads are positively related to a
stock’s volatility (PRIVAR). Consequently, stocks with higher trading volume and
number of trades and lower volatility have lower spreads (higher liquidity). We
also find that relative spreads are lower for larger firms and firms with higher
stock prices. These results are consistent with Stoll (2000) and Cannon and Cole
(2011).
The coefficient for REIT shares is statistically significant and positive during the
pre-crisis period and statistically significant and negative during the post crisis
period. This suggests that REITs have higher pre-crisis RSPRD and lower post-
crisis RSPRD liquidity than non-REIT matching firms. This result is robust to
alternate model specifications and is consistent with the univariate results
presented in the previous sections. Hence, REITs have lower pre-crisis liquidity
but higher post-crisis liquidity as compared to non-REIT matching common
stocks. This result is consistent with Hypothesis 2.
G A R C H A n a l y s i s
Exhibit 1 shows that REITs have higher pre-crisis and lower post-crisis volatility
as compared to non-REIT matching stocks. We formally test these volatility
differences using several GARCH models.22 We control for various factors
proposed in the literature that provide explanatory power for volatility: spreads
Notes: To formally test the liquidity differences for non-mortgage REITs and non REIT matchingstocks, we analyze the following regression (Stoll, 2000):
RSPRD 5 a 1 b REIT 1 b LogVOL 1 b LogNTRD 1 b LogMV 1 b LogPRICE1 1 2 3 4 5
1 b PRIVAR 1 «,6
where RSPRD is the time-weighted relative spreads for every five minutes of trading, REIT is adummy variable that takes value of 1 for REITs and zero, otherwise, VOL is the volume traded,and NTRDS is the number of trades for every five minutes of trading. MV is the stock’s marketvalue, PRICE is the stock’s price at the end of every five-minute period, PRIVAR is the pricevolatility during the five-minute trading period, and « is the error term. Pre-crisis period consists ofdata from January 2005 to August 2008 and the remaining period is post-crisis period. White’scorrected standard errors are reported in parentheses.**Significant at 5% level.***Significant at 1% level.
5 12
R 5 a D 1 b R 1 « , (8)O Ot k k j t2j tk51 j51
where Rt is the return on a stock for time t, and Dk is a day-of-the-week dummyfor day k. To avoid measurement errors due to the bid-ask bounce, we calculate
R E I T s a n d M a r k e t M i c r o s t r u c t u r e u 8 7
J R E R u V o l . 3 9 u N o . 1 – 2 0 1 7
returns from the average of bid-ask prices (mid-quote) at the end of each fiveminutes of trading. The 12 lagged returns are included to account for short-termmovements in conditional expected returns. The absolute value of the residual, «t,constitutes the estimate of the volatility for a stock at time t.
In the second stage, we run the following regression model to analyze the returnvolatility:
u« u 5 a 1 b REIT 1 b RSPRD 1 b DEPTH 1 b VOLi,t 0 1 t 2 t 3 t 4 t
121 b NTRD 1 b M 1 d u« u 1 m , (9)O5 t 6 t j51 i,j i,t2j i,t11
where REIT is a dummy variable that takes the value of 1 for REITs and zerootherwise, RSPRD is the time-lapse-weighted average relative spread, DEPTH isthe time-lapse-weighted average volume supplied at the best bid and best ask, ATS
is the average trade size, VOL is the volume traded, NTRD is the number of tradesfor each five-minute trading interval, M is a dummy variable that is equal to 1 forMondays and 0 otherwise, and «i,t is the residual from the return equation. Theparameter d captures the persistence in volatility.
Pagan and Ullah (1988) find that the above two-stage estimation, using equations(8) and (9), leads to inconsistent estimates as the true volatility is unobservable.Also, Bollerslev and Domowitz (1991) note that the two-stage OLS model doesnot account for the volatility clustering observed in the data. To address theseeconometric problems, we use the following GARCH(1,1) specification:
5 12R 5 a D 1 b R 1 « . (10)O Ot k51 k k j51 j t2j t
2s 5 a 1 b REIT 1 b RSPRD 1 b DEPTH 1 b VOLt 0 1 t 2 t 3 t 4 t
2 21 b NTRD 1 b M 1 a « 1 gs . (11)5 t 6 t 1 t21 t21
Both equations are estimated simultaneously as one system. The variables are asdefined previously. The selection of a GARCH(1,1) model is based on the tradeoffbetween accuracy and efficiency in model constructions. GARCH(1,1) has thelowest AIC and SIC values. We conduct the analysis using both the abovementioned model specifications. Since the results from the two models arequalitatively similar, we present only the results from GARCH(1,1) analysis.
In Exhibit 11, we summarize the results from the estimation of the variousGARCH(1,1) models summarized by equations (10) and (11), using the high-frequency data sampled at a five-minute sampling frequency for all sample stocksfor the pre- and post-crisis periods. Models 1 and 2 provide results for the pre-crisis period, while Models 3 and 4 provide the results for the post-crisis period.
8 8 u J a i n , S u n d e r m a n , a n d W e s t b y - G i b s o n
Notes: We report the results from the estimation of the following GARCH model for non-mortgageREITs and non REIT matching stocks:
5 12R 5 a D 1 b R 1 « .O Ot k51 k k j51 j t2j t
2 2 2s 5 a 1 b REIT 1 b RSPRD 1 b DEPTH 1 b VOL 1 b NTRD 1 b M 1 a « 1 gs .t 0 1 t 2 t 3 t 4 t 5 t 6 t 1 t21 t21
Rt is the return on a stock for the five-minute interval t, Dk is a day-of-the-week dummy for day k,is the conditional variance of «t from the return equation, REIT is a dummy variable that takes2s t
value of 1 for REITs and zero otherwise, RSPRD is the time-lapse-weighted average relativespread, DEPTH is the time-lapse-weighted average volume at the best bid and best ask, ATS is theaverage trade size, VOL is the volume traded, NTRDS is the number of trades for each fiveminutes of trading, M is a dummy variable that is equal to 1 for Mondays and 0 otherwise, and«t is the residual from the return equation. We report the standardized parameter estimates in thistable. Pre-crisis period consists of data from January 2005 to August 2008 and the remainingperiod is post-crisis period. White’s corrected standard errors are reported in parentheses.**Significant at 5% level.***Significant at 1% level.
The positive coefficient on the REIT dummy in Models 1 and 2 documents thatREITs have significantly higher volatility than non-REIT matching stocks duringthe pre-crisis period. This relation reverses during the post-crisis period asdocumented by a negative and significant coefficient for the REIT dummy inModels 3 and 4. These results support Hypothesis 3. Consistent with the findingsfrom the microstructure literature (see Jain and Jiang, 2014), we find a positiveand statistically significant coefficient for RSPRD, suggesting a negative relation
R E I T s a n d M a r k e t M i c r o s t r u c t u r e u 8 9
J R E R u V o l . 3 9 u N o . 1 – 2 0 1 7
between liquidity and volatility. We also find a positive and statistically significantcoefficient for NTRD, which suggests that informed traders camouflage theirtrading activity by splitting one large trade into several small trades (Kyle, 1985;Admati and Pfleiderer, 1988). Thus the number of trades conveys privateinformation as reflected by increased volatility (Jones, Kaul, and Lipson, 1994).
Overall, our results from GARCH analysis indicate that REITs have significantlyhigher volatility than non-REIT matching stocks during the pre-crisis period. Wealso document that, while the recent financial crisis increased the volatility for allof the sample stocks, the volatility for REITs as compared to non-REITs declinedsignificantly during the post-crisis period.23
u R o b u s t n e s s Te s t s
To address potential rival alternative hypotheses, we conduct several robustnesstests. Specifically, we test whether our results are driven by exclusion of mortgage
REITs, increased stock offerings by REITs during the post-crisis period, our
matching process, or our definition of the crisis period. Results of these tests
indicate that our findings of the changing REIT microstructure characteristics, in
terms of improved liquidity and reduced volatility as compared to non-REIT
stocks, during the post-crisis period are robust to these alternate economic or
statistical explanations.
M o r t g a g e v s . N o n - m o r t g a g e R E I Ts
It can be argued that mortgage REITs are different than the non-mortgage REITs
and other common stocks as their fundamental and microstructural characteristics
are more similar to fixed income securities. In the results presented thus far, we
excluded mortgage REITs from our analyses. We test the robustness of our results
by including the mortgage REITs and find results consistent with our findings.
We conclude that our results are not driven by excluding mortgage REITs.
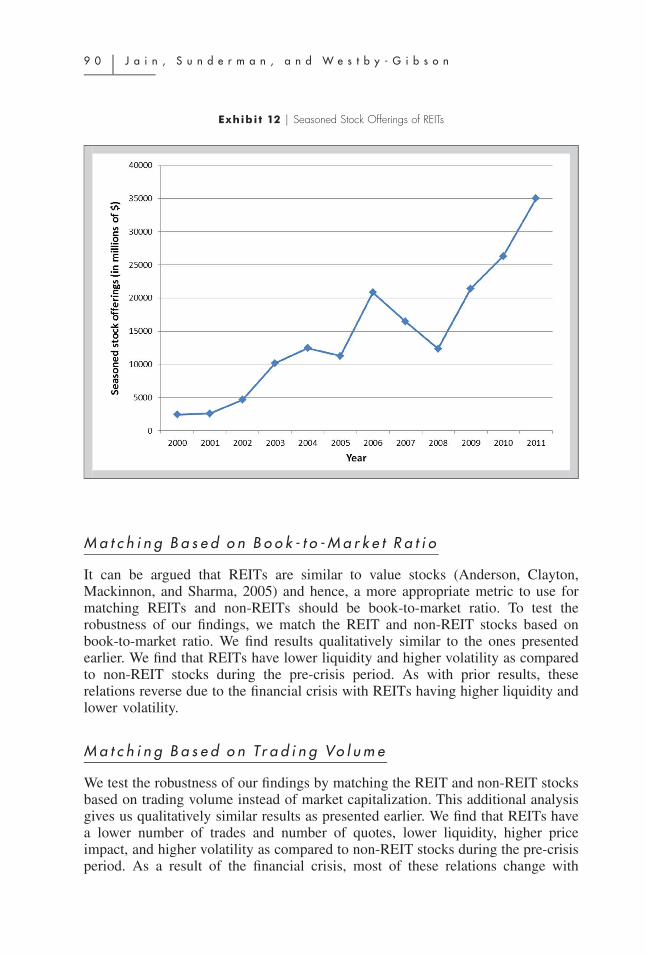
I n c r e a s e d R E I T S e a s o n e d S t o c k O f f e r i n g s P o s t - c r i s i s
We find that REITs significantly increased their seasoned equity offerings during
the post-crisis period to raise capital (Exhibit 12). To test whether our results
could be explained by the increase in REIT stock offerings, we excluded all the
REITs with abnormal stock offerings during the post-crisis period.24 While we
still find support for our significant liquidity and volatility differences results, we
fail to find any statistical difference in trading activity, in terms of volume, number
of trades, and number of quotes, between REIT and non-REIT common stocks
during the post-crisis period. Therefore, the increased trading activity in REITs
post-crisis may in fact be due in part to their increased seasoned stock offerings.
9 0 u J a i n , S u n d e r m a n , a n d W e s t b y - G i b s o n
Exhibi t 12 u Seasoned Stock Offerings of REITs
M a t c h i n g B a s e d o n B o o k - t o - M a r k e t R a t i o
It can be argued that REITs are similar to value stocks (Anderson, Clayton,Mackinnon, and Sharma, 2005) and hence, a more appropriate metric to use formatching REITs and non-REITs should be book-to-market ratio. To test therobustness of our findings, we match the REIT and non-REIT stocks based onbook-to-market ratio. We find results qualitatively similar to the ones presentedearlier. We find that REITs have lower liquidity and higher volatility as comparedto non-REIT stocks during the pre-crisis period. As with prior results, theserelations reverse due to the financial crisis with REITs having higher liquidity andlower volatility.
M a t c h i n g B a s e d o n Tr a d i n g Vo l u m e
We test the robustness of our findings by matching the REIT and non-REIT stocksbased on trading volume instead of market capitalization. This additional analysisgives us qualitatively similar results as presented earlier. We find that REITs havea lower number of trades and number of quotes, lower liquidity, higher priceimpact, and higher volatility as compared to non-REIT stocks during the pre-crisisperiod. As a result of the financial crisis, most of these relations change with
R E I T s a n d M a r k e t M i c r o s t r u c t u r e u 9 1
J R E R u V o l . 3 9 u N o . 1 – 2 0 1 7
REITs having a higher number of trades and quotes, higher liquidity, lower priceimpact, and lower volatility.
D o u b l e S o r t B a s e d o n M a r k e t C a p i t a l i z a t i o n a n d Tr a d i n g
Vo l u m e
When we test the robustness of our findings by matching the REIT and non-REITstocks first on market cap and then on trading volume, we find results consistentwith those previously presented.
T r i p l e S o r t B a s e d o n F a m a a n d F r e n c h ( 1 9 9 3 ) R i s k
F a c t o r s
We test the robustness of our findings by matching the REIT and non-REIT stocksfirst on market beta, then on market capitalization, and finally on book-to-marketratio. We find results consistent with those presented earlier.
A l t e r n a t e D e f i n i t i o n f o r P o s t - c r i s i s P e r i o d
In our analysis, we define the post-crisis period as the period following August2008. Our choice of date is based on the fact that during August of 2008, theS&P 500 index reached its local peak of 1300.68 and following that high priceevent saw an unprecedented decline. This period is marked by significant declinein market confidence and a dramatic collapse in risk appetites. An extreme flightto quality led to massive sell-offs in major world stock markets during Septemberand October of 2008.
We test the robustness of our results using an alternate definition for the financialcrisis period. The major world markets started showing signs of a financial crisisin the third quarter of 2007. The increasing inability of market participants toprice some risky assets during this period, highlighted by the French bank BNPParibas’s announcement to this effect on August 9, 2007, signaled the start of thefinancial crisis. The S&P 500 index hit its global maximum during October 2007and ran downhill from there. Hence, we define post-financial crisis period as theperiod following October 2007. This exercise gives us even stronger results interms of larger coefficients for the REIT dummy, supporting our findings.
E x c l u d i n g t h e C r i s i s P e r i o d
Finally, we test whether our results are driven by the extreme market movementsduring late 2007 to early 2009. We remove this period and re-analyze the data.We find that most of our results hold to this alternate data sampling. However,we do not find any statistically significant difference in volatility between the pre-and post-crisis periods if we exclude the crisis period. Hence, our result of a
9 2 u J a i n , S u n d e r m a n , a n d W e s t b y - G i b s o n
significant increase in volatility in our sample stocks during the post-crisis period
is driven by the extremely volatile crisis period. A further analysis reveals that
REIT volatility declined significantly during the post-crisis period.
u C o n c l u s i o n
In this study, we document the market quality differences between REIT and non-
REIT common stocks. We define market quality in terms of stock market liquidity,
price volatility, and price impact. We also test the impact of the recent financial
crisis on the market quality for REITs and other common stocks. Finally, we
present the differences in the intraday patterns of liquidity, volatility, and trading
activity between REITs and non-REIT common stocks.
Prior to the recent financial crisis, we find that REITs have significantly poorer
stock market quality, as documented by lower liquidity, higher price volatility,
higher price impact, and lower trading activity, than non-REIT common stocks.
However, the financial crisis dramatically improved the market quality for REITs.
We find that, during the post-crisis period, REITs have higher liquidity, lower
volatility, lower price impact, and greater trading activity than non-REIT stocks.
These significant differences in stock market liquidity and volatility between REIT
and non-REIT stocks and pre- and post-crisis periods are confirmed through
regression analysis using Stoll’s (2000) model for relative spreads and the GARCH
model, respectively. We show that our results are robust to alternate economic and
statistical explanations for our findings.
Overall, our results suggest that REITs became more liquid during the post-crisis
period. Additionally, their volatility and cost of trading declined significantly
making them an attractive vehicle for adding diversification to investor portfolios.
This is reflected by the increased trading activity in REITs during the post-crisis
period.
Further, our analysis of intraday patterns indicates that it is preferable to trade
REIT stocks during the closing hour of the trading day when liquidity is higher,
volatility is lower, and the price impact is smaller as compared to the opening
session of a trading day. By appropriately timing the trades, a trader can minimize
transaction costs and improve execution quality.
This study contributes to the literature by not only documenting the significant
market microstructure differences between the REIT and non-REIT common
stocks but also presenting the evolution of market quality during the post-crisis
period. Our results show that REITs behave differently as compared to non-REIT
common stocks during the period of large market decline. Investors, fleeing risky
investments, find the long-term diversification benefits of REITs more attractive
during periods of high volatility and low interest rates. The portfolio adjustment
actions of investors during these periods make REITs more liquid and less volatile.
R E I T s a n d M a r k e t M i c r o s t r u c t u r e u 9 3
J R E R u V o l . 3 9 u N o . 1 – 2 0 1 7
u E n d n o t e s1 A real estate investment trust (REIT) is a corporate tax designation for an entity that
invests in real estate and is designed to provide a real estate investment structure similar
to the structure provided by mutual funds for investment in stocks. This designation
reduces or eliminates corporate taxes as long as a REIT distributes 90% of its taxable
income as dividends. For more details, see Feng, Price, and Sirmans (2011).2 According to the National Association of Real Estate Investment Trusts (NAREIT),
approximately 76% of all REIT shares were held by institutional investors in 2008. In
fact, Huang and Zhong (2013) find that approximately 50% of all REIT shares are owned
by the 25 largest institutional investors.3 Chou and Chen (2014) argue that the unique characteristics of REITs create a very close
tie between the performance of the REIT and the underlying property portfolio which,
in turn, should increase the transparency in REIT valuation resulting in a higher liquidity.4 This flight to REITs was further fueled by the historically low interest rates, which made
the fixed income securities market less attractive to investors.5 However, Cole (1998) finds that this increase in liquidity can be attributed to the ‘‘new
REITs’’ going public between 1991 and 1993. These larger, higher priced REITs were
traded with more volume than the REITs that existed in 1990. When he excludes these
new REITs, he finds that there was actually a decline in REIT liquidity during that
period.6 We extend Cannon and Cole (2011) by presenting intraday patterns to identify optimal
trading strategies for investors and analyzing the effect of the financial crisis on REIT
stock market quality.7 Hill, Kelly, and Hardin (2012) examine accounting liquidity in the form of cash versus
lines of credit and find that the proverbial saying ‘‘cash is king’’ holds for REITs as the
market values cash over available lines of credit during periods of financial crisis.8 Butler, Grullon, and Weston (2005) and Glascock and Lu-Andrews (2014) find that
accounting liquidity is positively related to financial market liquidity. Cost of raising
new capital is much higher when the financial markets are illiquid.9 Subrahmanyam (2007) finds that there is significant liquidity spillover from REITs to
non-REIT stocks.10 Wang, Erickson, Gau, and Chan (1995) find that REITs have lower institutional investor
participation and are followed by fewer stock analysts as compared to non-REIT stocks.11 Jain (2005) documents that the way the trading takes place has changed dramatically
over the past decade.12 Devos, Ong, Spieler and Tsang (2013) examine the impact of the financial crisis on
REIT institutional holdings. They suggest that the surge in volatility during periods of
crisis may drive institutional investors away from REITs. However, their analysis of the
various REIT subsectors (e.g. retail, industrial, etc.) reveals a ‘‘flight to quality’’ since
institutional investors decreased their positions in the smaller riskier REITs and increased
investment in larger, less risky ones.13 McInish and Wood (1992) finds that most of the stocks experience lower liquidity (or
higher spreads) at the start and the end of the trading day, and higher liquidity (or lower
spreads) during the rest of the trading day, generating a U-shape pattern for spreads.
9 4 u J a i n , S u n d e r m a n , a n d W e s t b y - G i b s o n
14 See Easley, Hvidkjaer, and Ohara (2010), Karolyi, Lee, and Van Dijk (2012), and Jain,
Jain, and McInish (2016).15 The fundamental and microstructural characteristics of mortgage REITs are more similar
to fixed income securities.16 Previous studies on REITs have matched REITs and non-REITs based on volume or
liquidity. That process essentially matches based on a liquidity measure and then
compares liquidity. In microstructure studies, however, match stocks are matched based
on market capitalization, which is not a liquidity measure (see Stoll, 2000). We test the
robustness of our results by matching REITs and non-REITs using volume, double
sorting based on market capitalization and volume, and triple sorting based on Fama
and French (1993) risk factors.17 Due to computational limitations, we limit our analysis to the first month of each
quarter—January, April, June, and October—for each of the sample years.18 Quoted spread may not capture true trading cost since it might reflect differences in
price levels across time and stocks.19 We test the robustness of our results by deleting the extreme volatile period, the last
quarter of 2007 through the first quarter of 2009, and by using an alternate post-crisis
period definition. Details are provided in the robustness section.20 Volume can proxy information arrival. This makes volume a proxy for liquidity since
adverse selection (resulting due to information asymmetry) is an important component
of liquidity (Kyle, 1985). Additionally, the new information about the financial markets
should impact REITs and non-REITs similarly and hence, might not affect our findings.21 Danielsen and Harrison (2000) find that determinants of REIT liquidity vary depending
on the exchange where the security is listed and hence, we only analyze the REITs
listed on NYSE.22 Zhou and Anderson (2012) report extreme returns are more prominent for REIT returns
compared to equities. Hence, REIT returns can be successfully modeled with GARCH
models.23 We analyzed Model 4 separately for REIT and non-REIT matching stocks and include
a dummy variable, CRISIS, to control for the crisis period. We find the coefficient on
CRISIS to be positive and statistically significant for both the REITs and non-REIT
stocks at the 5% level of significance, which suggests that the recent financial crisis
significantly increased the volatility for all the sample stocks.24 Normal level of stock offerings is defined as the average stock offerings during the pre-
crisis period by any given REIT. If any REIT’s stock offerings during the post-crisis
period were significantly higher than the normal level, we excluded that REIT from our
analyses.
u R e f e r e n c e s
Admati, A.R. and P. Pfleiderer. A Theory of Intraday Patterns: Volume and Price Variability.
Review of Financial Studies, 1988, 1:1, 3–40.
Ahn, H-J., K-H. Bae, and K. Chan. Limit Orders, Depth and Volatility: Evidence from the
Stock Exchange of Hong Kong. Journal of Finance, 2001, 56:2, 767–88.
Amihud, Y. and H. Mendelson. Liquidity, Maturity, and the Yields on U.S. Treasury
Securities. Journal of Finance, 1991, 46:4, 1411–25.
R E I T s a n d M a r k e t M i c r o s t r u c t u r e u 9 5
J R E R u V o l . 3 9 u N o . 1 – 2 0 1 7
Anderson, R., J. Clayton, G. Mackinnon, and R. Sharma. REIT Returns and Pricing: The
Small Cap Value Stock Factor. Journal of Property Research, 2005, 22:4, 267–86.
Barberis, N., A. Shleifer, and R. Vishny. A Model of Investor Sentiment. Journal of
Financial Economics, 1998, 49:3, 307–43.
Below, S.D., J.K. Kiely, and W. McIntosh. REIT Pricing Efficiency: Should Investors Still
Be Concerned? Journal of Real Estate Research, 1996, 12:3, 397–412.
Ben-David, I., F. Franzoni, and R. Moussawi. Hedge Fund Stock Trading in the Financial
Crisis of 2007–2008. Review of Financial Studies, 2011, 25:1, 1–54.
Bertin, W., P. Kofman, D. Michayluk, and L. Prather. Intraday REIT Liquidity. Journal of
Real Estate Research, 2005, 27:2, 155–76.
Bhasin, V., R.A. Cole, and J.K. Kiely. Changes in REIT Liquidity 1990–1994: Evidence
from Intra-day Transactions. Real Estate Economics, 1997, 25:4, 615–30.
Bollerslev, T. and I. Domowitz. Price Volatility, Spread Variability, and the Role of
Alternative Market Mechanisms. Review of Futures Markets, 1991, 10:1, 78–102.
Brennan, M.J. and A. Subrahmanyam. Market Microstructure and Asset Pricing: On the
Compensation for Illiquidity in Stock Returns. Journal of Financial Economics, 1996,
41:3, 441–64.
Butler, A.W., G. Grullon, and J.P. Weston. Stock Market Liquidity and the Cost of Issuing
Equity. Journal of Financial and Quantitative Analysis, 2005, 40:2, 331–48.
Cannon, S.E. and R.A. Cole. Changes in REIT Liquidity 1988–2007: Evidence from Daily
Data. Journal of Real Estate Finance and Economics, 2011, 43:1, 258–80.
Case, K., J. Quigley, and R. Shiller. Comparing Wealth Effects: The Stock Market versus
the Housing Market. Advances in Macroeconomics, 2005, 5:1, 1–32.
Case, K. and R. Shiller. Is There a Bubble in the Housing Market? Brookings Papers on
Economic Activity, 2003, 2, 299–362.
Chiang, K.C.H., X. Jiang, and M.L. Lee. REIT Idiosyncratic Risk. Journal of Property
Research, 2009, 26:4, 349–66.
Chou, Y.H. and Y.C. Chen. Is the Response of REIT Returns to Monetary Policy
Asymmetric? Journal of Real Estate Research, 2014, 36:1, 109–35.
Chun, G.H., J. Sa-Aadu, and J.D. Shilling. The Role of Real Estate in an InstitutionalInvestor’s Portfolio Revisited. Journal of Real Estate Finance and Economics, 2004, 29:3,295–320.
Chung, R., S. Fung, and K. Hung. Institutional Investors and Firm Efficiency of Real EstateInvestment Trusts. Journal of Real Estate Finance and Economics, 2012, 45:1, 171–211.
Clayton, J. and G. MacKinnon. Measuring Changes in REIT Liquidity: Moving Beyondthe Bid/Ask Spread. Real Estate Economics, 2000, 28:1, 89–115.
——. Departures from NAV in REIT Pricing: The Private Real Estate Cycle, the Value ofLiquidity and Investor Sentiment. Real Estate Research Institute, 2002.
Cole, R. Changes in REIT Liquidity 1990–94: The Role of New REITs. Paper presentedat the 1998 AREUEA meeting, 1998.
Cotter, J. and R. Roll. A Comparative Anatomy of Residential REITs and Private RealEstate Markets: Returns, Risks and Distributional Characteristics. Real Estate Economics,2015, 43:1, 209–40.
Danielsen, B.R. and D.M. Harrison. The Impact of Potential Private Information on REITLiquidity. Journal of Real Estate Research, 2000, 19:1/2, 49–71.
9 6 u J a i n , S u n d e r m a n , a n d W e s t b y - G i b s o n
Danielsen, B., D. Harrison, R. Van Ness, and R. Warr. Liquidity, Accounting Transparency,
and the Cost of Capital: Evidence from Real Estate Investment Trusts. Journal of Real
Estate Research, 2014, 36:2, 221–51.
Demsetz, H. The Cost of Transacting. Quarterly Journal of Economics, 1968, 82:1, 33–
53.
Devos, E., S. Ong, A.C. Spieler, and D. Tsang. REIT Institutional Ownership Dynamics
and the Financial Crisis. Journal of Real Estate Finance and Economics, 2013, 47:2, 266–
88.
Easley, D., S. Hvidkjaer, and M. O’Hara. Factoring Information into Returns. Journal of
Financial and Quantitative Analysis, 2010, 45:2, 293–309.
Fama, E.F. and K.R. French. Common Risk Factors in the Returns on Stocks and Bonds.
Journal of Financial Economics, 1993, 33:1, 3–56.
Feng, Z., S.M. Price, and C.F. Sirmans. An Overview of Equity Real Estate Investment
Trusts (REITs): 1993–2009. Journal of Real Estate Literature, 2011, 19:2, 307–43.
Fleming, J., C. Kirby, and B. Ostdiek. The Economic Value of Volatility Timing Using
Realized Volatility. Journal of Financial Economics, 2003, 67:3, 473–509.
Foucault, T. Order Flow Composition and Trading Costs in a Dynamic Limit Order Market.
Journal of Financial Markets, 1999, 2:2, 99–134.
Foster, F.D. and S. Viswanathan. A Theory of the Interday Variations in Volume, Variance,
and Trading Costs in Securities Markets. Review of Financial Studies, 1990, 3:4, 593–624.
French, K.R. Stock Returns and the Weekend Effect. Journal of Financial Economics, 1980,
8:1, 55–69.
Gallant, A.R., P.E. Rossi, and G.E. Tauchen. Stock Prices and Volume. Review of Financial
Studies, 1992, 5:2, 199–242.
Ghosh, C., M. Miles, and C.F. Sirmans. Are REITs Stocks? Real Estate Finance, 1996,
13, 46–53.
Giliberto, M. Equity Real Estate Investment Trusts and Real Estate Return. Journal of Real
Estate Research, 1990, 5:2, 259–63.
Glascock, J.L. and R. Lu-Andrews. An Examination of Macroeconomic Effects on the
Liquidity of REITs. Journal of Real Estate Finance and Economics, 2014, 49:1, 23–46.
Glascock, J.L., D. Michayluk, and K. Neuhauser. The Riskiness of REITs Surrounding theOctober 1997 Stock Market Decline. Journal of Real Estate Finance and Economics, 2004,28:4, 339–54.
Goetzmann, W. and R. Ibbotson. The Performance of Real Estate as an Asset Class. Journal
of Applied Corporate Finance, 1990, 3:1, 65–76.
Grossman, S.J. and M.H. Miller. Liquidity and Market Structure. Journal of Finance, 1988,43:3, 617–33.
Hasbrouck, J. The Dynamics of Discrete Bid and Ask Quotes. Journal of Finance, 1999,54:6, 2109–42.
Hasbrouck, J. and G. Saar. Limit Orders and Volatility in a Hybrid Market: The IslandECN. Working paper, NYU, 2002.
Hendershott, T., C.M. Jones, and A.J. Menkveld. Does Algorithmic Trading ImproveLiquidity? Journal of Finance, 2011, 66:1, 1–33.
Hill, M., G.W. Kelly, and W.G. Hardin. Market Value of REIT Liquidity. Journal of Real
Estate Finance and Economics, 2012, 45:1, 383–401.
R E I T s a n d M a r k e t M i c r o s t r u c t u r e u 9 7
J R E R u V o l . 3 9 u N o . 1 – 2 0 1 7
Hoffmann, A.O., T. Post, and J.M. Pennings. Individual Investor Perceptions and Behavior
During the Financial Crisis. Journal of Banking and Finance, 2013, 37:1, 60–74.
Huang, J. and Z. Zhong. Time Variation in Diversification Benefits of Commodity, REITs,
and TIPS. Journal of Real Estate Finance and Economics, 2013, 46:1, 152–92.
Jain, P.K. Financial Market Design and the Equity Premium: Electronic versus Floor
Trading. Journal of Finance, 2005, 60:6, 2955–85.
Jain, P. J-REIT Market Quality: Impact of High Frequency Trading and the Financial Crisis.
Paper presented at the 2015 AREUEA/NAREIT conference, 2015.
Jain, P. and C.X. Jiang. Predicting Future Price Volatility: Empirical Evidence from an
Emerging Limit Order Market. Pacific-Basin Finance Journal, 2014, 27, 72–93.
Jain, P.K., P. Jain, and T. McInish. Risks of High Speed Trading. Journal of Financial
Markets, 2016, 31, 1–24.
Jensen, M.C. Agency Cost of Free Cash Flow, Corporate Finance, and Takeovers. American
Economic Review, 1986, 76:2, 323–29.
Jones, C.M., G. Kaul, and M.L. Lipson. Information, Trading, and Volatility. Journal of
Financial Economics, 1994, 36:1, 127–54.
Jones, C.M., G. Kaul, and M.L. Lipson, Transactions, Volume and Volatility, Review of
Financial Studies, 1994, 7:4, 631–51.
Karolyi, G.A., K.H. Lee, and M.A. Van Dijk. Understanding Commonality in Liquidity
Around the World. Journal of Financial Economics, 2012, 105:1, 82–112.
Kyle, A. Continuous Auctions and Insider Trading. Econometrica, 1985, 53:6, 1315–35.
Lee, C.M.C., B. Mucklow, and M.J. Ready. Spreads, Depths and the Impact of Earnings
Information: An Intraday Analysis. Review of Financial Studies, 1993, 6:2, 345–74.
Ling, D. and A. Naranjo. The Dynamics of REIT Capital Flows and Returns. Real Estate
Economics, 2003, 31:3, 405–34.
Malmendier, U. and S. Nagel. Depression Babies: Do Macroeconomic Experiences Affect
Risk-Taking? Quarterly Journal of Economics, 2011, 126:1, 373–416.
McInish, T. and R. Wood. An Analysis of Intraday Patterns in Bid/Ask Spread for NYSE
Stocks. The Journal of Finance, 1992, 47:2, 753–64.
Mooradian, R. and S. Yang. Dividend Policy and Firm Performance: Hotel REITs vs. Non-
REIT Hotel Companies. Journal of Real Estate Portfolio Management, 2001, 7:1, 79–87.
Nelling, E.F., J.M. Mahoney, T.L. Hildebrand, and M.A. Goldstein. Real Estate Investment
Trusts, Small Stocks and Bid-Ask Spreads. Real Estate Economics, 1995, 23:1, 45–64.
Ooi, J.T.L., J. Wang, and J.R. Webb. Idiosyncratic Risk and REIT Returns. The Journal of
Real Estate Finance and Economics, 2009, 38:4, 420–42.
Ooi, J.T.L., W. Wong, and S. Ong. Can Bank Lines of Credit Protect REITs against a
Credit Crisis? Real Estate Economics, 2012, 40:2, 285–316.
Pagan, A.R. and A. Ullah. The Econometric Analysis of Models with Risk Terms. Journal
of Applied Econometrics, 1988, 3:2, 87–105.
Schwert, W.G. Why Does Stock Market Volatility Change Over Time? Journal of Finance,
1989, 44:5, 1115–53.
Smith, T. and R.E. Whaley. Estimating the Effective Bid/Ask Spread from Time and Sales
Data. The Journal of Futures Markets, 1994, 14:4, 437–55.
Stoll, H. Friction. Journal of Finance, 2000, 55:4, 1479–1514.
9 8 u J a i n , S u n d e r m a n , a n d W e s t b y - G i b s o n
Subrahmanyam, A. Liquidity, Return, and Order-Flow Linkages Between REITs and the
Stock Market. Real Estate Economics, 2007, 35:3, 383–408.
Sun, Q.S. and K. Yung. Idiosyncratic Risk and Expected Returns of Equity Real Estate
Investment Trusts. Journal of Real Estate Portfolio Management, 2010, 15:1, 45–57.
Wang, K., J. Erickson, G. Gau, and S.H. Chan. Market Microstructure and Real Estate
Returns. Real Estate Economics, 1995, 23:1, 85–100.
Zhou, J. and R.I. Anderson. Extreme Risk Measures for International REIT Markets. The
Journal of Real Estate Finance and Economics, 2012, 45:1, 152–70.
We thank Frank J. SanPietro, Department of Finance, Insurance and Real Estate,
University of Memphis, for his assistance on the preparation of the final manuscript.
We further gratefully acknowledge the helpful comments from the anonymous referees.
We also thank the discussants and attendees at the conferences where we presented
early versions of this paper for their comments.
Pawan Jain, University of Wyoming, Laramie, WY 82071 or [email protected].
Mark Sunderman, University of Memphis, Memphis, TN 38152-3120 or msndrman@
memphis.edu.
K. Janean Westby-Gibson, University of Memphis, Memphis, TN 38152-3120 or