53
Rejuvenating A Mature EOR Asset: Miscible CO 2 Flooding at SACROC Mark Linroth Kinder Morgan CO 2 Company, LP December 7 th , 2012
Rejuvenating A Mature EOR Asset: Miscible CO2
Flooding at SACROC
Mark LinrothKinder Morgan CO2
Company, LPDecember 7th, 2012

SACROC Unit (Canyon Reef)
• Discovered – Nov, 1948• Formation –
Canyon Reef
(Limestone)• Depth –
6200‐7000 ft.
• OOIP – 2.8 BSTB• Porosity – 9%• Permeability – 30mD• Reservoir Temp –
125oF
• Drive – Solution Gas• Gravity – 42oAPI
• Disc Pressure –
3300 psig• Pb
– 1800 psig• Rsi
– 1000 scf/bbl• Bo
– 1.65 rb/stb• Viscosity – 0.33 cP• Soi
–
80%• Sorw
–
35%
• MMP – 1850 psig
2

SACROC Unit (Canyon Reef)
• Discovered ‐
Nov 1948• Formation –
Canyon Reef
(Limestone)• OOIP – 2.8 BSTB• Gravity – 42oAPI• Porosity – 9%• Permeability – 30mD• Reservoir Temp –
130oF
• Depth –
6200’• VDP
– 0.85
• Disc Pressure –
3300 psig• Rsi
– 1000 scf/bbl• Bo
– 1.65 rb/stb• Viscosity – 0.33 cP• Soi
–
80%• Sorw
–
36%• Pb
– 1800 psig• MMP – 1850 psig• Drive – Solution Gas
3

Regional & Geologic Setting
Howard
Hockley Lubbock Crosby Dickens
Terry Lynn Garza Kent
Gaines
ScurryDawsonBorden
WellmanField
WellmanField
Adair FieldAdair Field
Hobo Hobo FldFld
OceanicField
OceanicField
VealmoorField
VealmoorVealmoorField
CogdellField
CogdellField
S. BrownfieldField
S. BrownfieldField
Mungerville
FldMungerville
Fld
Von Roeder Von Roeder FldFld
Good FldGood FldReineckeReinecke
FieldField
500'
500'
0 20
Miles
Sharon Ridge UnitSharon Ridge Unit
Diamond M Diamond M FldFld
Kelly‐Snyder FldKelly‐Snyder Fld
SACROC UnitSACROC Unit
Oklahoma
Texas
Midland Basin
S. Von Roeder S. Von Roeder FldFld
E. E. VealmoorVealmoor
FldFld
Salt CreekField
Salt CreekField
Horseshoe AtollHorseshoe Atoll
4

SACROC Unit Structure
5
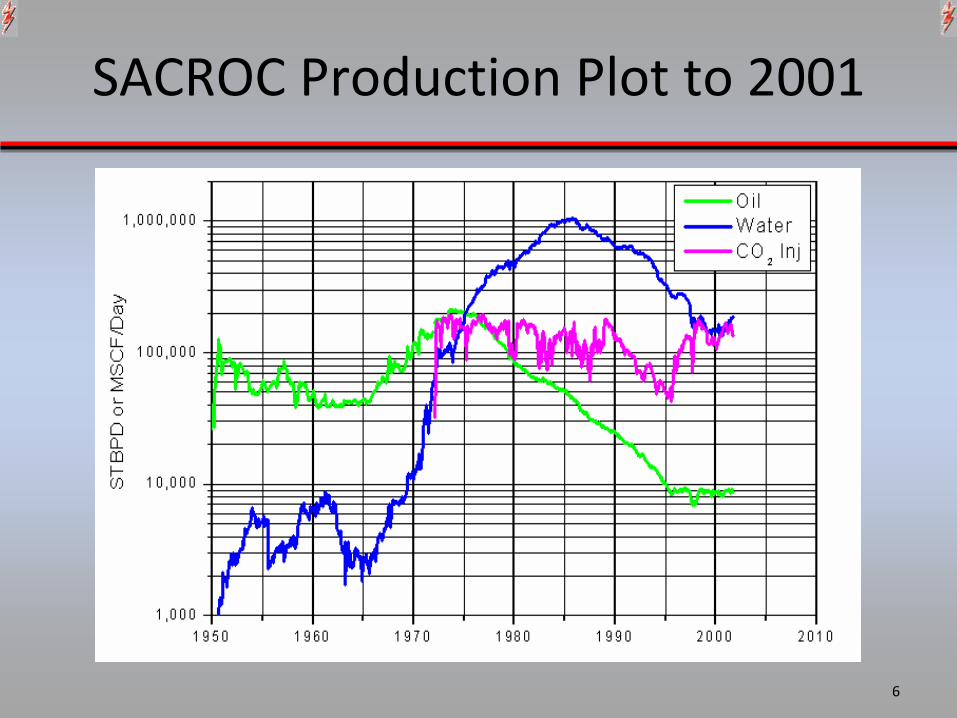
SACROC Production Plot to 2001
6

November 1948
• 66 BOPD• Water Cut 0%• Np
‐
2,000 STB
12/15/2012 7

November 1950
• 112,000 BOPD• Water Cut 1%• Np
‐
28 MMSTB• RF ‐
1%
12/15/2012 8

November 1954
• 52,000 BOPD• Water Cut 9%• Np
‐
129 MMSTB• RF – 4.6%
9

November 1971
• 134,000 BOPD• Water Cut 27%• Np
‐
528 MMSTB• RF –
19%
10

May 1972
• 175,000 BOPD• 174 MMSCF
CO2
• Water Cut 36%• Np
‐
552 MMSTB• RF –
20%
11

May 1974
• 211,000 BOPD• 150 MMSCF
CO2
• Water Cut 36%• Np
‐
680 MMSTB• RF –
24%
12
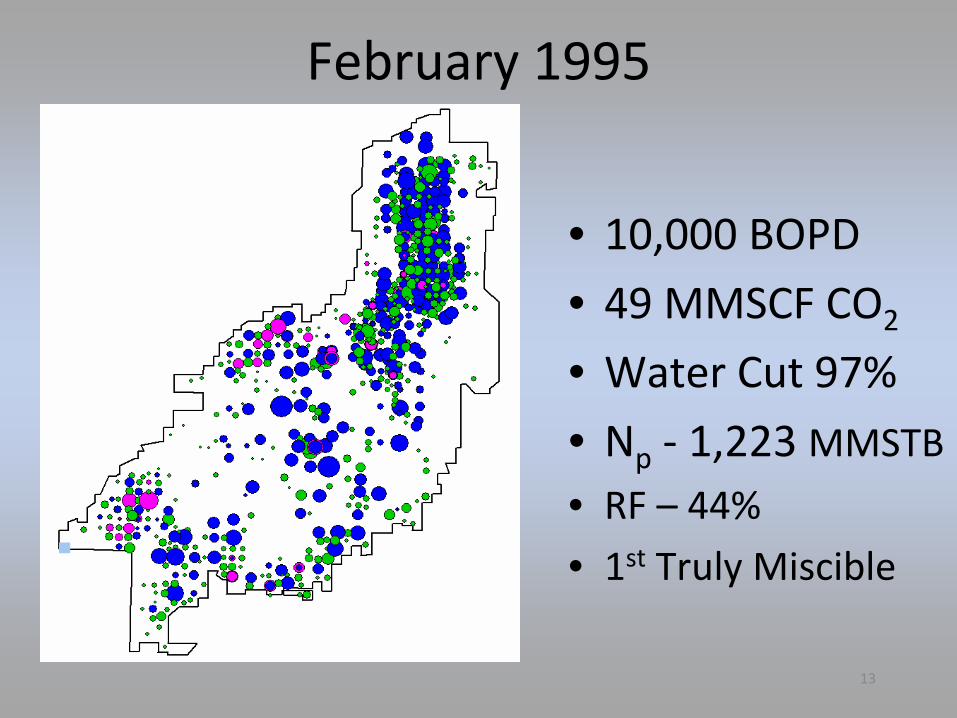
February 1995
• 10,000 BOPD• 49 MMSCF CO2
• Water Cut 97%• Np
‐
1,223 MMSTB• RF –
44%
• 1st
Truly Miscible
13

April 2000
• 8,400 BOPD• 118 MMSCF
CO2
• Water Cut 95%• Np
‐
1,239 MSTB• Cum CO2
– 1.3Tcf
14

October 2001
• 9,000 BOPD• 136 MMSCF
CO2
Water Cut 95%• Np
‐
1,244 MSTB
15
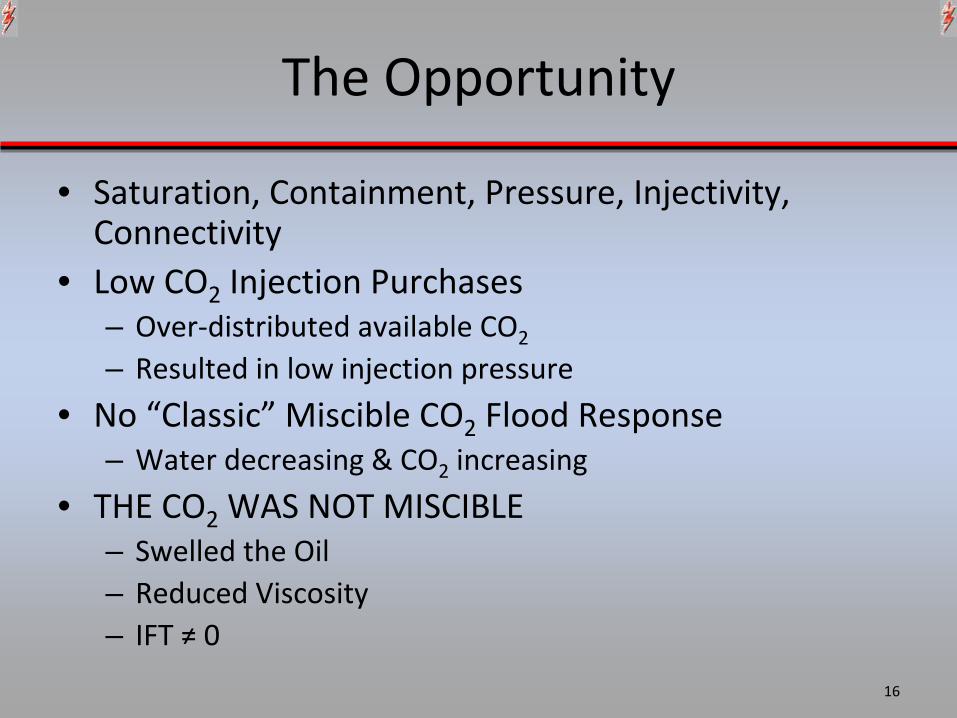
The Opportunity
• Saturation, Containment, Pressure, Injectivity, Connectivity
• Low CO2
Injection Purchases– Over‐distributed available CO2
– Resulted in low injection pressure• No “Classic”
Miscible CO2
Flood Response– Water decreasing & CO2
increasing• THE CO2
WAS NOT MISCIBLE– Swelled the Oil– Reduced Viscosity– IFT ≠
0
16

The Opportunity
17
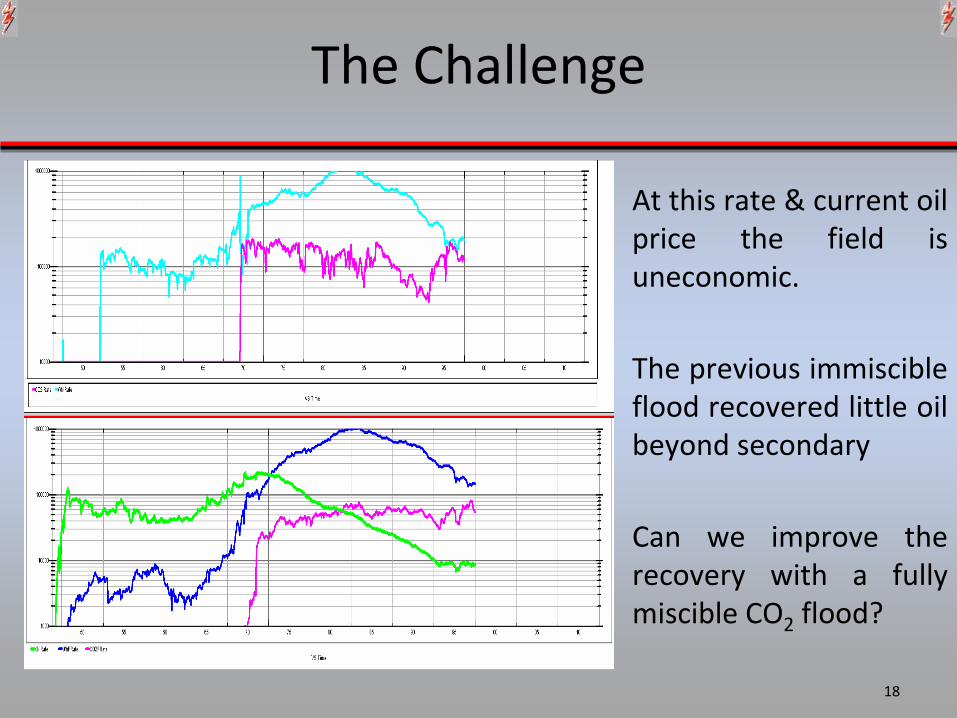
The Challenge
18
At this rate & current oil price
the
field
is
uneconomic.
The previous immiscible flood recovered little oil beyond secondary
Can
we
improve
the recovery
with
a
fully
miscible CO2
flood?
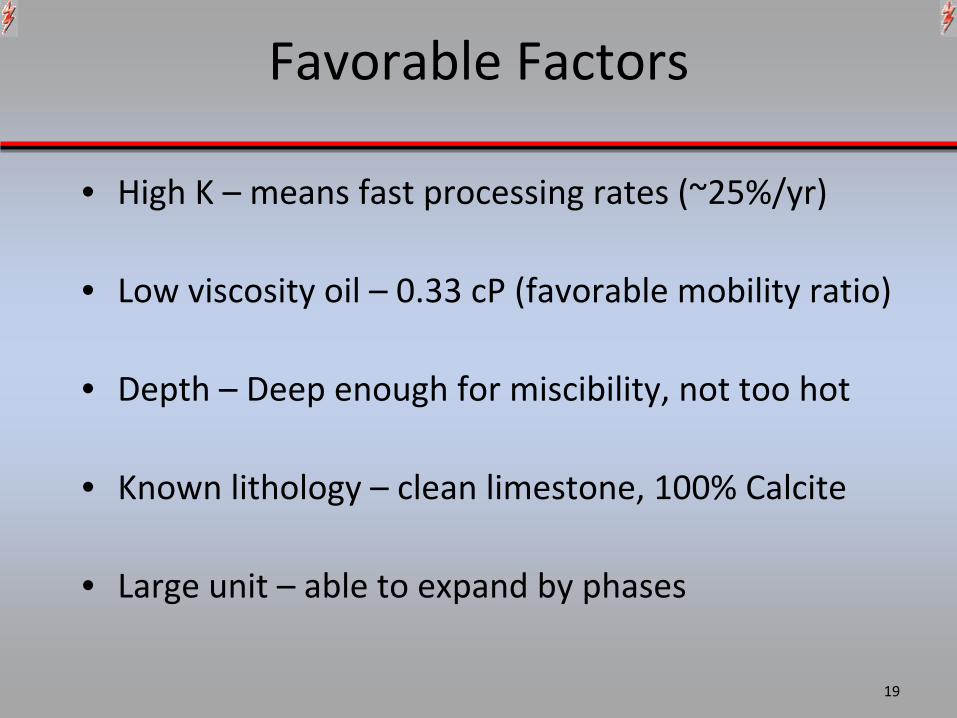
Favorable Factors
• High K – means fast processing rates (~25%/yr)
• Low viscosity oil – 0.33 cP
(favorable mobility ratio)
• Depth –
Deep enough for miscibility, not too hot
• Known lithology
–
clean limestone, 100% Calcite
• Large unit – able to expand by phases
19
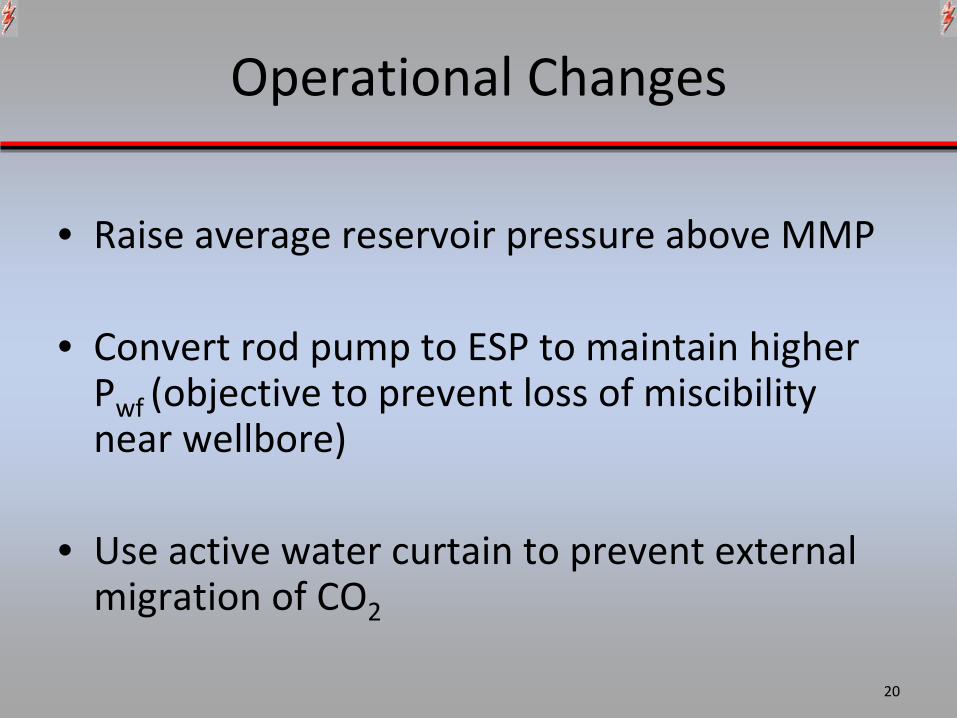
Operational Changes
20
• Raise average reservoir pressure above MMP
• Convert rod pump to ESP to maintain higher Pwf
(objective to prevent loss of miscibility near wellbore)
• Use active water curtain to prevent external migration of CO2

Operational Changes (cont.)
21
• Extend initial CO2
slug, follow with dry WAG (many patterns were WAG sensitive and
premature water injection led to loss of recovery)
• All injectors completed cased hole to control vertical conformance.
• SIGNIFICANT increase in CO2
purchases
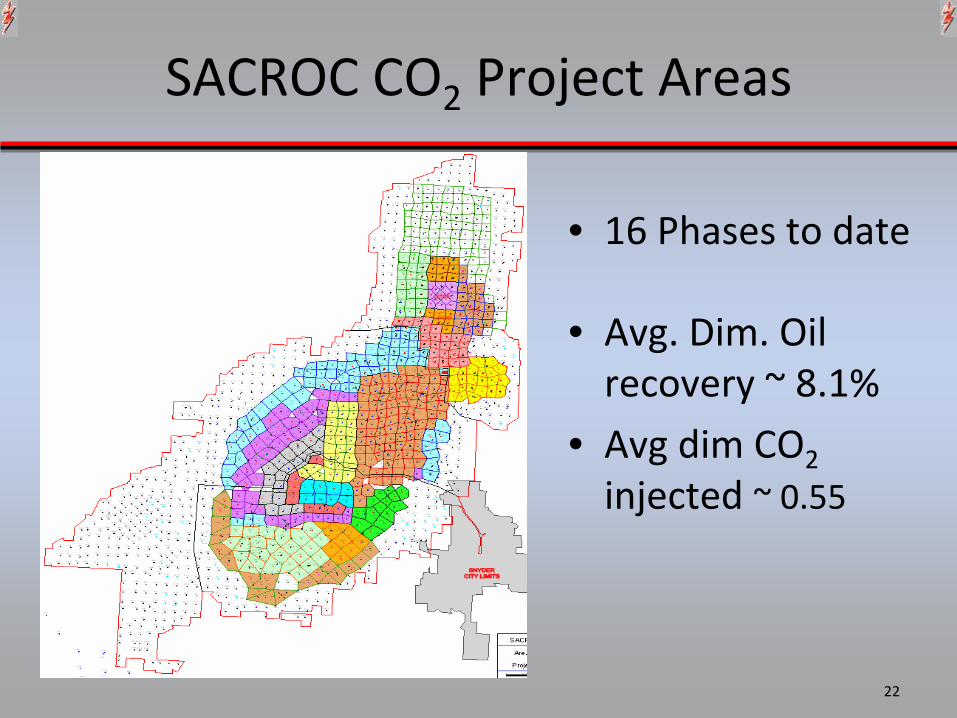
SACROC CO2
Project Areas
22
• 16 Phases to date
• Avg. Dim. Oil recovery ~ 8.1%
• Avg
dim CO2
injected ~ 0.55
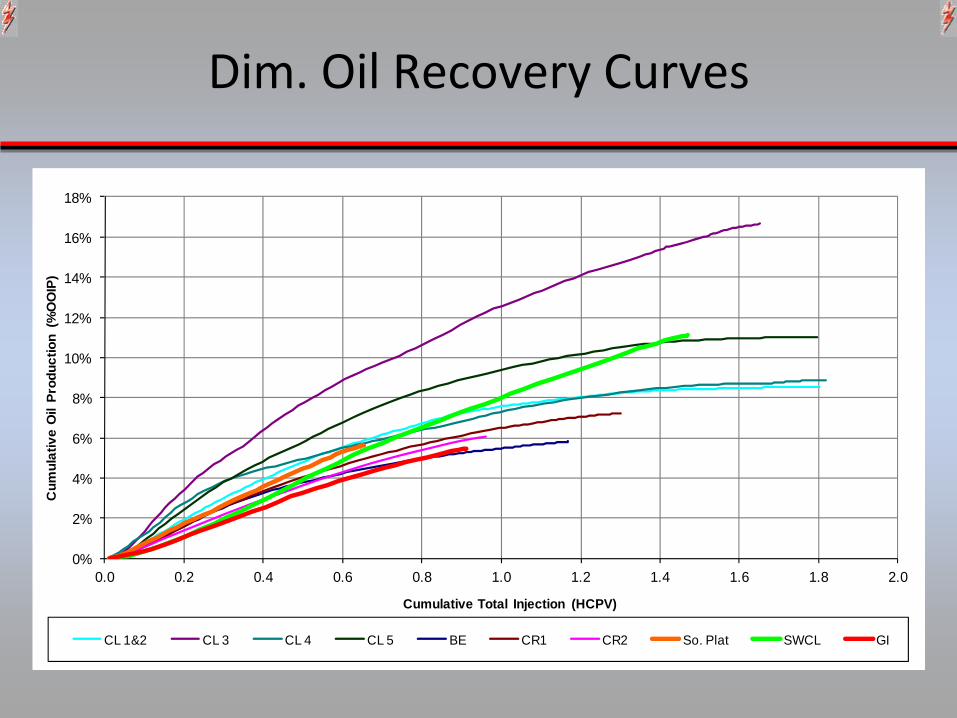
0%
2%
4%
6%
8%
10%
12%
14%
16%
18%
0.0 0.2 0.4 0.6 0.8 1.0 1.2 1.4 1.6 1.8 2.0
Cum
ulat
ive
Oil
Prod
uctio
n (%
OO
IP)
Cumulative Total Injection (HCPV)
CL 1&2 CL 3 CL 4 CL 5 BE CR1 CR2 So. Plat SWCL GI
Dim. Oil Recovery Curves
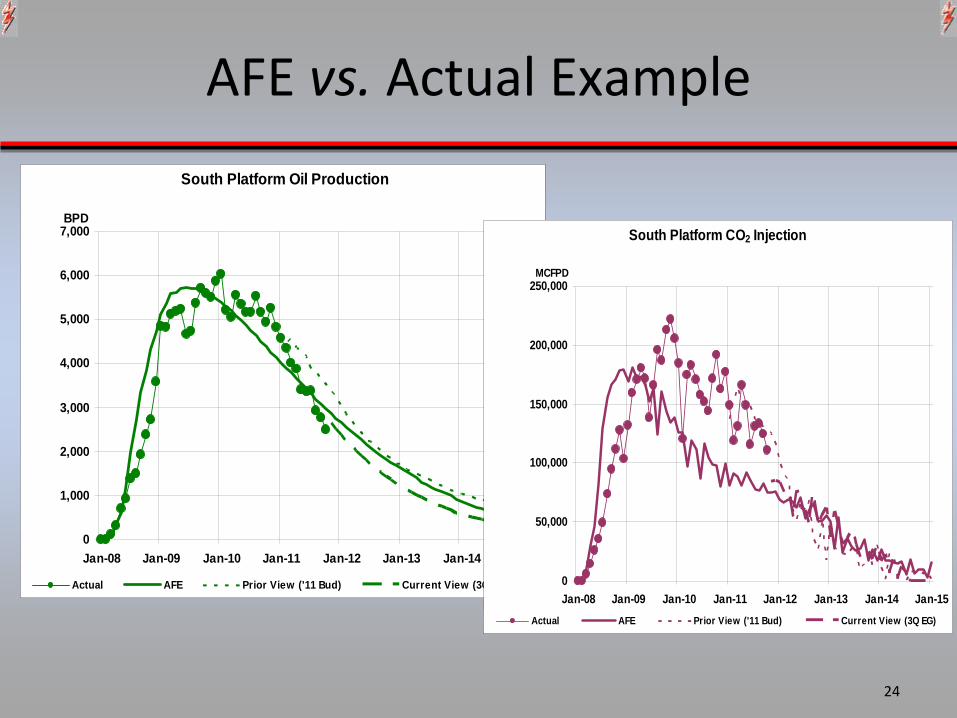
AFE vs.
Actual Example
24
South Platform Oil Production
0
1,000
2,000
3,000
4,000
5,000
6,000
7,000
Jan-08 Jan-09 Jan-10 Jan-11 Jan-12 Jan-13 Jan-14 Jan-15
BPD
Actual AFE Prior View ('11 Bud) Current View (3Q EG)
South Platform CO2 Injection
0
50,000
100,000
150,000
200,000
250,000
Jan-08 Jan-09 Jan-10 Jan-11 Jan-12 Jan-13 Jan-14 Jan-15
MCFPD
Actual AFE Prior View ('11 Bud) Current View (3Q EG)
25
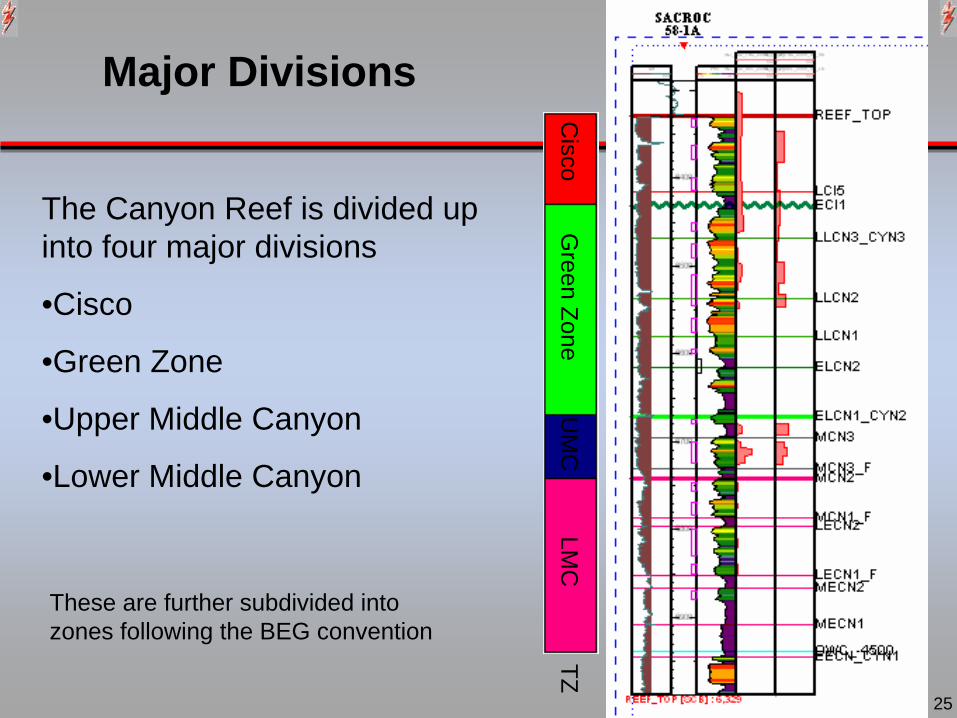
Cisco
Green Zone
UM
CLM
CTZ
Major Divisions
The Canyon Reef is divided up into four major divisions
•Cisco
•Green Zone
•Upper Middle Canyon
•Lower Middle Canyon
These are further subdivided into zones following the BEG convention
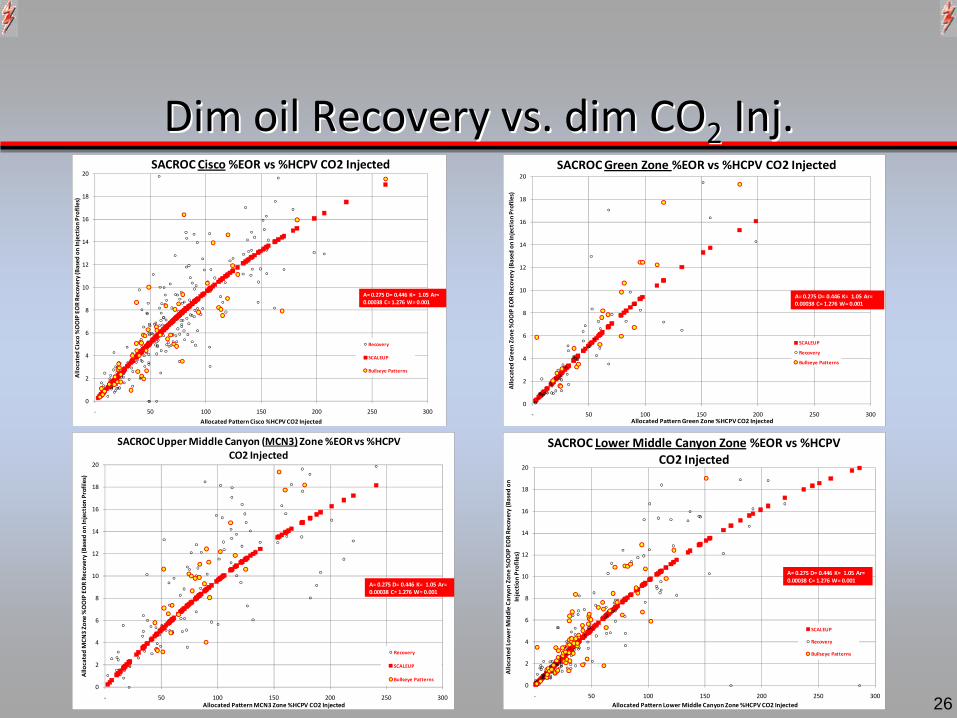
Dim oil Recovery vs. dim CODim oil Recovery vs. dim CO22
InjInj. .
0
2
4
6
8
10
12
14
16
18
20
‐ 50 100 150 200 250 300
Allo
cated Lower M
iddle Ca
nyon
Zon
e %OOIP EOR Re
covery (B
ased
on
Injection Profiles)
Allocated Pattern Lower Middle Canyon Zone %HCPV CO2 Injected
SACROC Lower Middle Canyon Zone %EOR vs %HCPV CO2 Injected
SCALEUP
Recovery
Bullseye Patterns
A= 0.275 D= 0.446 K= 1.05 Ar= 0.00038 C= 1.276 W= 0.001
260
2
4
6
8
10
12
14
16
18
20
‐ 50 100 150 200 250 300
Allo
cated MCN
3 Zo
ne %OOIP EOR Re
covery (B
ased
on Injection Profiles)
Allocated Pattern MCN3 Zone %HCPV CO2 Injected
SACROC Upper Middle Canyon (MCN3)Zone %EOR vs %HCPV CO2 Injected
Recovery
SCALEUP
Bullseye Patterns
A= 0.275 D= 0.446 K= 1.05 Ar= 0.00038 C= 1.276 W= 0.001
0
2
4
6
8
10
12
14
16
18
20
‐ 50 100 150 200 250 300
Allocated Green Zo
ne %OOIP EOR
Recov
ery (Based
on Injection Profiles)
Allocated Pattern Green Zone %HCPV CO2 Injected
SACROC Green Zone %EOR vs %HCPV CO2 Injected
SCALEUP
Recovery
Bullseye Patterns
A= 0.275 D= 0.446 K= 1.05 Ar= 0.00038 C= 1.276 W= 0.001
0
2
4
6
8
10
12
14
16
18
20
‐ 50 100 150 200 250 300
Allo
cated Cisco %OOIP EOR Re
covery (B
ased
on Injection Profiles)
Allocated Pattern Cisco %HCPV CO2 Injected
SACROC Cisco %EOR vs %HCPV CO2 Injected
Recovery
SCALEUP
Bullseye Patterns
A= 0.275 D= 0.446 K= 1.05 Ar= 0.00038 C= 1.276 W= 0.001
27
0
50
100
150
200
250
300
350
400
450
0
50
100
150
200
250
300
350
400
450
500
1/1/08
12/31/08
12/31/09
12/31/10
1/1/12
12/31/12
12/31/13
12/31/14
1/1/16
Cumulative
Oil (M
STBO
)
Oil Rate (BOP
D)
SACROC Unit Pattern PAT 58‐2AActual BOPD
Forecast BOPD
Base Case, BOPD
Forecast BOPD
Cumul EOR Oil (MSTBO)
Forecast Cumul Oil (MSTBO)
Base Case Cumul. MSTBO
Forecast Cumul Oil (MSTBO)
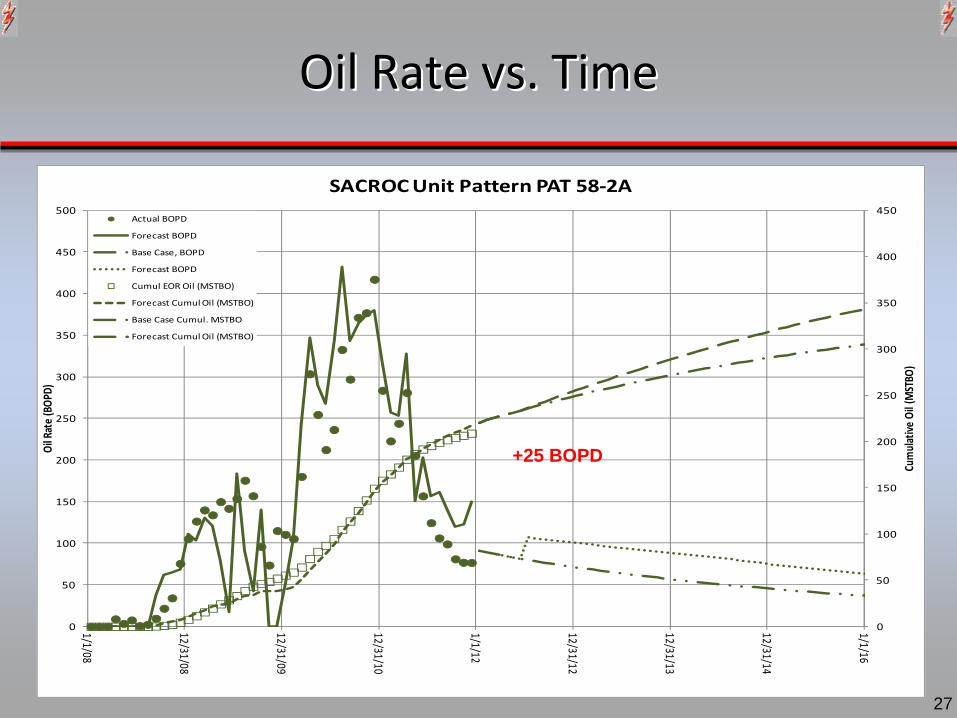
+25 BOPD
Oil Rate vs. Time Oil Rate vs. Time

28
0
2000
4000
6000
8000
10000
12000
14000
0
2000
4000
6000
8000
10000
12000
14000
1/1/08
12/31/08
12/31/09
12/31/10
1/1/12
12/31/12
12/31/13
12/31/14
1/1/16
Cumulative
CO2
Produ
ction (M
MSCF)
CO2 P
rodu
ction Rate (M
SCFD
)
SACROC Unit Pattern PAT 58‐2AActual CO2p MCFD
Forecast CO2 MCFD
Base Case MSCFD
Forecast CO2 MCFD
Cumul CO2 Prod (MMSCF)
Forecast Cumul CO2 Prod (MMSCF)
Base Case Cumul. MMSCF
Forecast Cumul CO2 Prod (MMSCF)
COCO22
Produced vs. Time Produced vs. Time

Monitoring Tools
29
Injection Profiles• Used to determine zone(s) of injection• Run once per year on each fluid
Step‐rate tests• Used to determine parting pressure• Run once per year on water injectors

Vertical Conformance
30
• Injector‐Producer cross section showing
dominant injection into one zone
• Significant amount of by‐passed pay
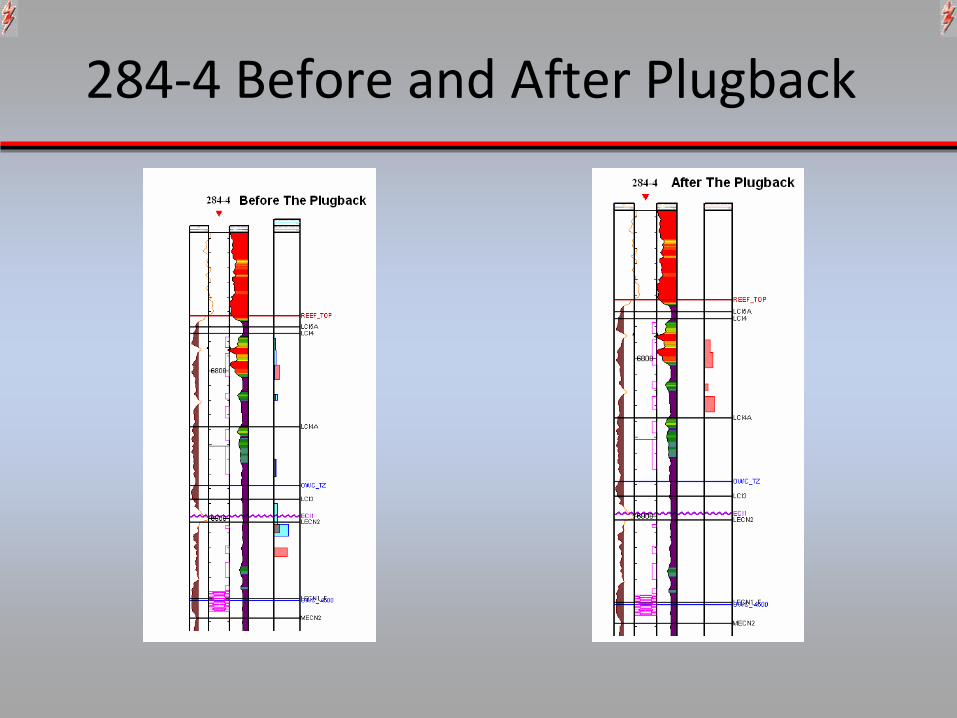
284‐4 Before and After Plugback

212‐2 Job cost: $185,025215‐2 Job cost: $405,173
Conformance Response (212‐2, 215‐2 Polymer Jobs)
209‐1 Production response
5 BOPD to 36 BOPD
212‐1 Production response
8 BOPD to 100 BOPD
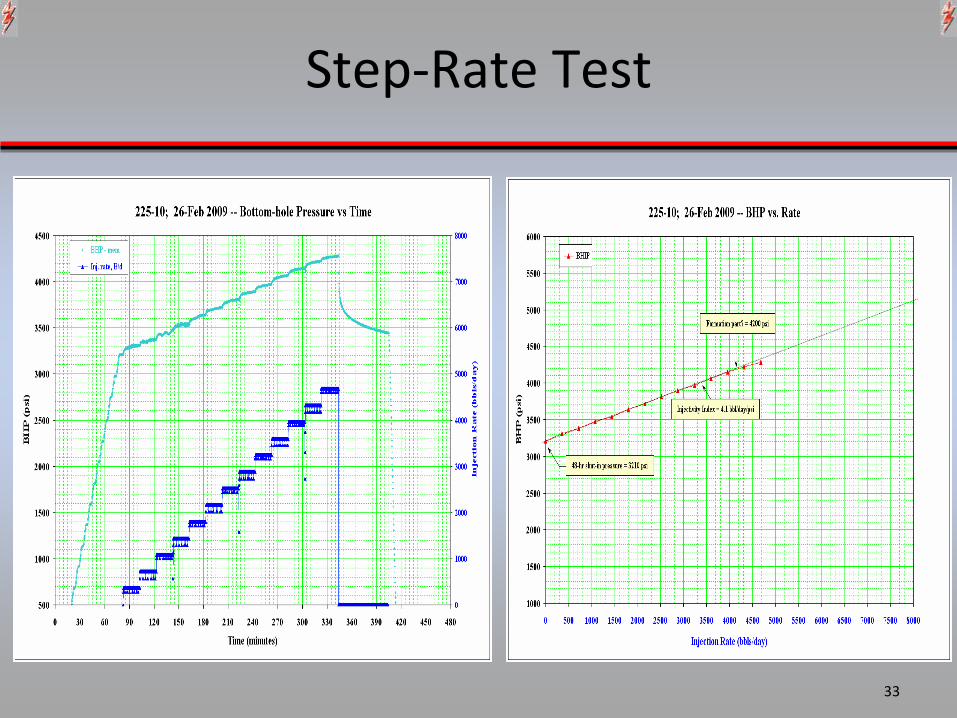
Step‐Rate Test
33

Areal
Conformance
34
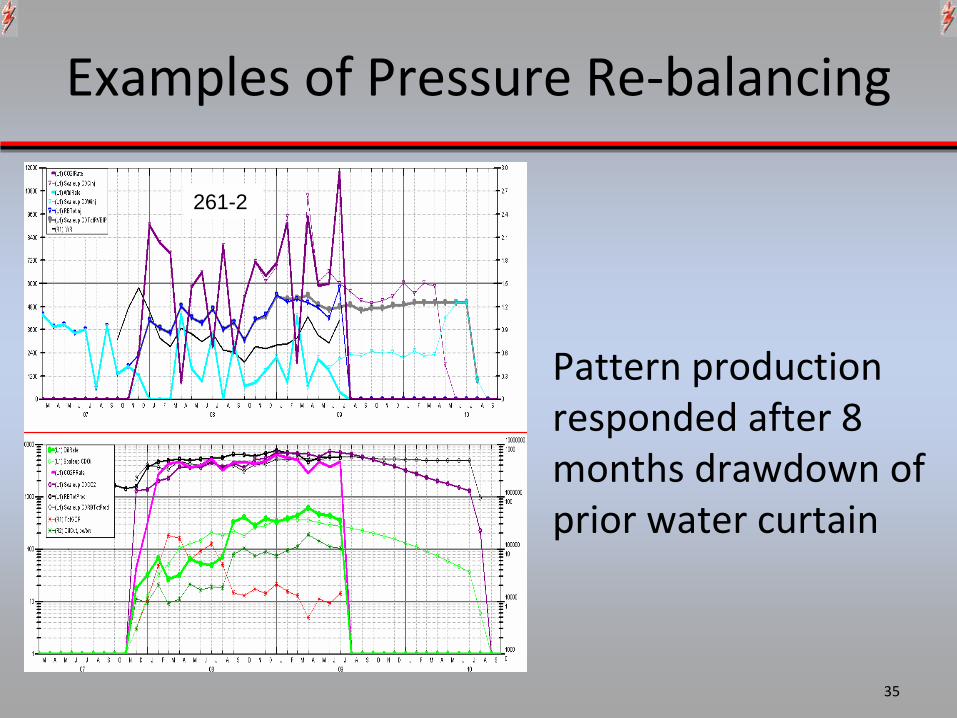
• Pressure & Rate re‐
balancing
• Attempts to viscosify
CO2
– Surfactant pilot project
Examples of Pressure Re‐balancing
35
Pattern production responded after 8
months drawdown of prior water curtain
261-2

November 2007
Note streamlines show no support to 261‐3

July 2008
Note streamlines now show 261‐3 receiving support

BHP Monitoring
38
All
ESP’s
are
equipped
to record
Pwf
and
motor temp.
This
data
is
available in real‐time
and
can
also
be
used
to
track
reservoir pressure

CTF Pressure & Rate Response in Offset Wells
PIP increase due to CTF in 288‐1
Production response 200 BOPD and lower GOR below 20,000

Pattern 210‐5 Rebalancing
Incremental Oil ResponseNeeds ESP UpsizeHigh GOR Well CTF/SI as Required

SACROC Unit Structure
41
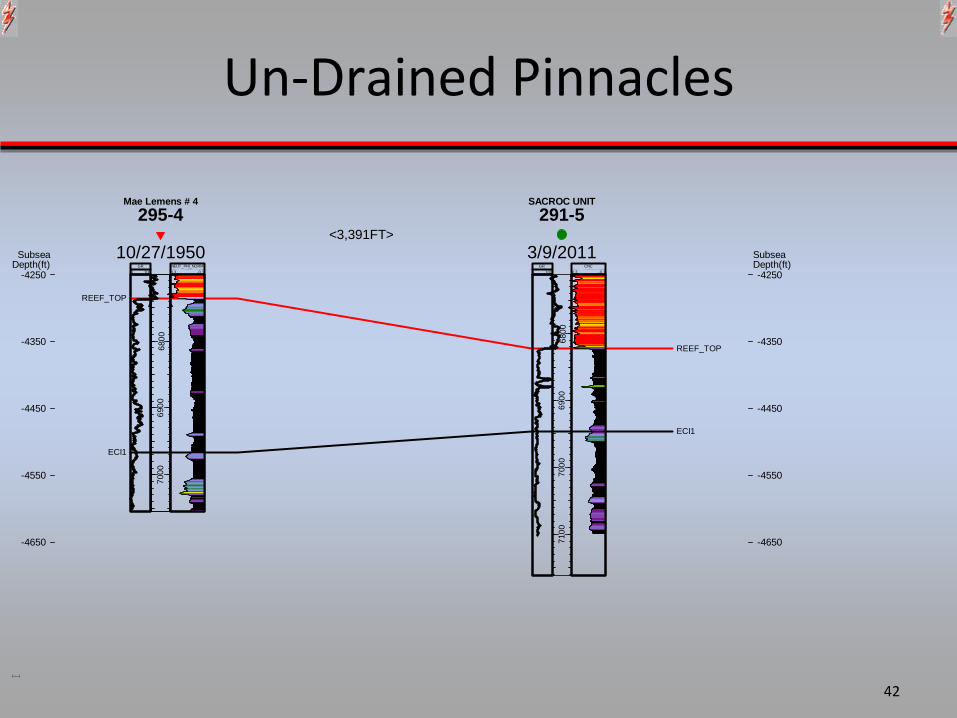
Un‐Drained Pinnacles
42
Mae Lemens # 4295-4
10/27/1950
SACROC UNIT291-5
3/9/2011<3,391FT>
0 100GR
0.3 -0.1NEUT_PHI_NORM
0 100GR
0.3 -0.1CNC
REEF_TOP
REEF_TOP
ECI1
ECI1
6800
690 0
700 0
6 800
6900
7000
7100
SubseaDepth(ft)
SubseaDepth(ft)
-4250 -4250
-4350 -4350
-4450 -4450
-4550 -4550
-4650 -4650
HS=57
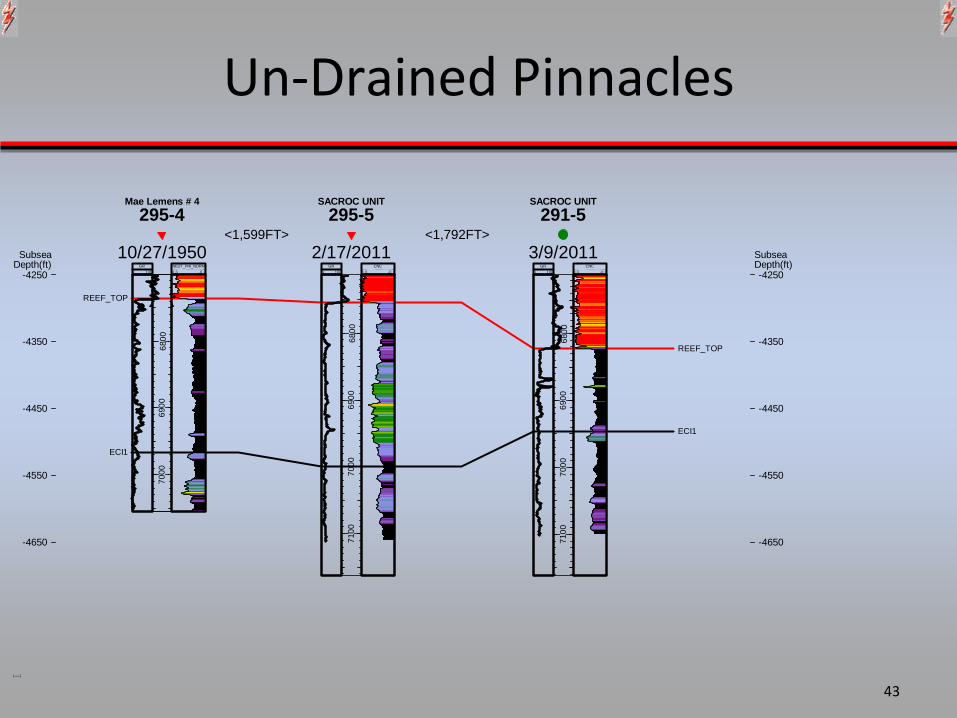
Un‐Drained Pinnacles
43
Mae Lemens # 4295-4
10/27/1950
SACROC UNIT295-5
2/17/2011
SACROC UNIT291-5
3/9/2011<1,599FT> <1,792FT>
0 100GR
0.3 -0.1NEUT_PHI_NORM
0 100GR
0.3 -0.1CNC
0 100GR
0.3 -0.1CNC
REEF_TOP
REEF_TOP
ECI1
ECI1
6800
690 0
700 0
6800
6900
7000
7100
6 800
6900
7000
7100
SubseaDepth(ft)
SubseaDepth(ft)
-4250 -4250
-4350 -4350
-4450 -4450
-4550 -4550
-4650 -4650
HS=57

44
CO2
“Harvest”
‐‐
RTP
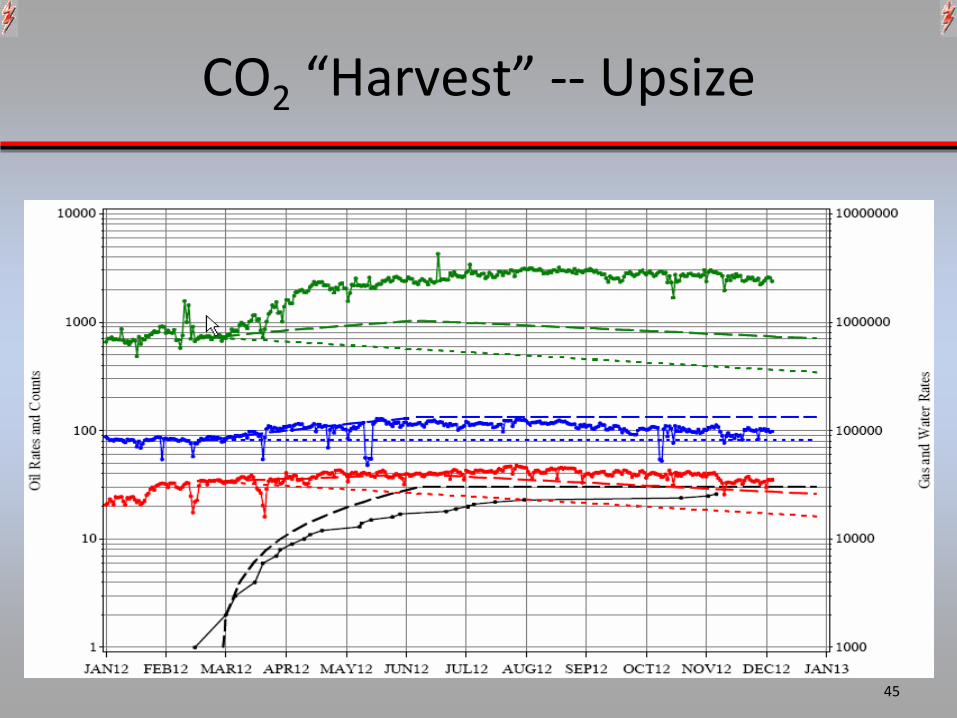
CO2
“Harvest”
‐‐
Upsize
45

46
Production Response
Oil
production
rate
has increased
from
8800
BOPD
to
the
current 30,000 BOBD.
Cumulative
incremental oil
production
since
year
2001
now
exceeds 110 MMSTBO

47
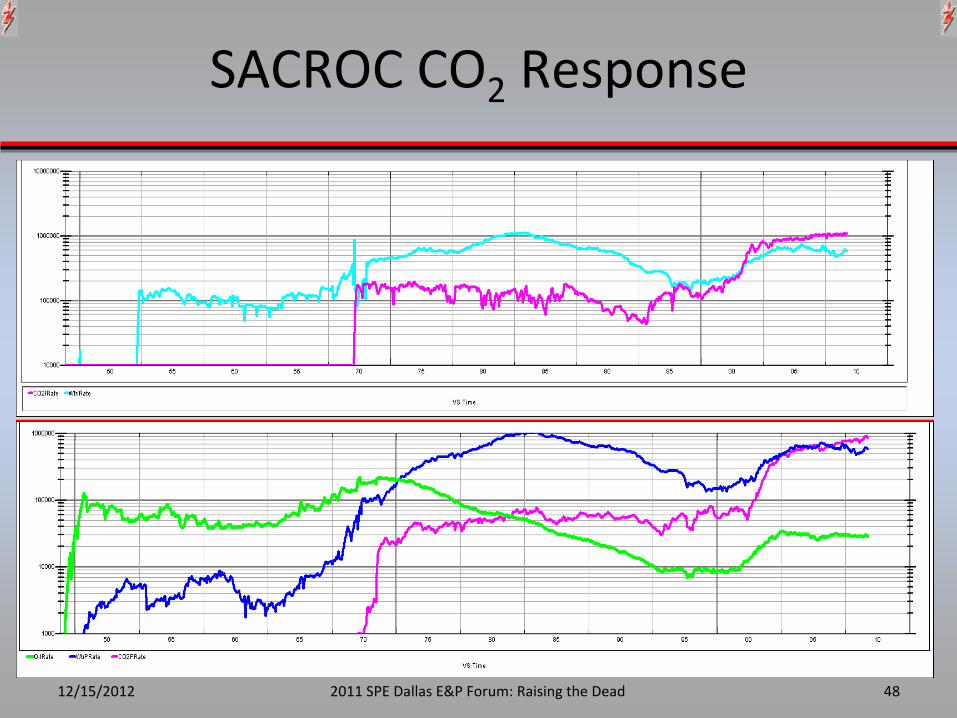
SACROC CO2
Response
12/15/2012 2011 SPE Dallas E&P Forum: Raising the Dead 48

X
49

X
50

X
51
Layer by Layer Forecasting ProcessLayer by Layer Forecasting Process•• Using the historical injection profiles determine the fraction oUsing the historical injection profiles determine the fraction of injected COf injected CO22
entering each layer, and from the injection rate determine the %entering each layer, and from the injection rate determine the %HCPV CO2 HCPV CO2
injection with time into each layer injection with time into each layer •• From the generalized dimensionless recovery curves we calculate From the generalized dimensionless recovery curves we calculate the the
dimensionless oil and COdimensionless oil and CO22
recoveries for each layerrecoveries for each layer•• The Oil recovery equation The Oil recovery equation ““AA””
value is set to 15% initially, but it value is set to 15% initially, but it
occasionally requires changing to occasionally requires changing to ““history matchhistory match””
performanceperformance•• Calculate the oil and CO2 production rates from the layer allocaCalculate the oil and CO2 production rates from the layer allocated COted CO22
injection rate and the oil & COinjection rate and the oil & CO22
recovery derivativesrecovery derivatives•• Sum the layer oil & COSum the layer oil & CO22
production rates to get the pattern oil & COproduction rates to get the pattern oil & CO22
production. Calculate the water production by material balanceproduction. Calculate the water production by material balance
52

Outline
• Field History– Geologic Setting– Key Statistics– Production History
• The Opportunity• The Challenge
– Operational Changes– Monitoring– Rate Re‐Balancing– Conformance
53


