Related Party Transactions By Haihao (Ross) Lu A thesis submitted in conformity with the requirements for the degree of Doctor of Philosophy Rotman School of Management University of Toronto Ó Copyright by Haihao Lu 2017
Transcript
Related Party Transactions
By
Haihao (Ross) Lu
A thesis submitted in conformity with the requirements for the degree of Doctor of Philosophy
Rotman School of Management University of Toronto
Ó Copyright by Haihao Lu 2017
ii
Related Party Transactions
Haihao (Ross) Lu
Doctor of Philosophy
Rotman School of Management University of Toronto
2017
Abstract
Related party transactions (hereafter RPTs) are common business practices. If misused,
however, they can result in significant losses for investors. This study attempts to examine
empirical issues pertaining to RPTs. Specifically, the paper has two goals. The main goal is
related to a 2006 Securities and Exchange Commission (SEC) regulation mandating public
firms to disclose their governance policies on RPTs. I intend to investigate whether firms
change their RPT behaviors in response to this mandated RPT governance disclosure and
whether investors update the implied cost of capital on these RPT behaviors accordingly.
Employing hand-collected RPT data for S&P 1500 firms, I find the initiation of RPT
governance disclosure significantly reduces the occurrence of RPTs, suggesting an ex-post
improvement in RPT governance. This reduction is more pronounced on firms with higher
agency costs. I also find the types of RPTs and the identities of related parties play a role in
the detected disclosure effect, suggesting certain types of RPTS could be more likely to be
used as expropriation. Furthermore, I document that the disclosure of RPT governance
reduces the implied costs of capital premium (ICC) associated with RPTs. Taken together, this
analysis provides initial evidence about the effects of the SEC’s 2006 regulation on RPT
governance disclosures, and shows how the disclosures on RPT governance can enhance firms’
iii
governance on RPT activities and whether investors could recognize the firm behavior change
by reducing firms’ implied cost of capital.
The second goal is to assess whether independent directors’ compensation is
associated with the occurrence of RPTs. Studying independent directors attracts my interest
because they are responsible for reviewing and approving RPTs in most companies. By
decomposing independent directors’ compensation into the market-level component and the
over-compensated component, I show that firms with over-compensated directors or with a
lower portion of equity-based compensation in contrast to cash-based compensation incur
more RPTs. These results suggest that independent directors’ overcompensation reduce
directors’ independence and equity-based compensation aligns directors’ interests with those
of shareholders, consistent with the private benefit theory. This study provides novel evidence
that appropriate directors’ compensation design can better control RPT behaviors.
iv
Acknowledgements
First and foremost, I would like to thank my supervisor, Ole-Kristian Hope, for his
valuable advices and unconditional support during the term of my Ph.D. study. His passion to
research, high standards to work, and excellent professionalism left a profound impact on me
that will keep motivating me for the rest of my life. He never hesitates to offer help and
always pushes me to strive for the next level. I couldn’t achieve what I have done without him.
I am also very much indebted to my mentor, Gus De Franco for his generous help in my
research. Since the very first year, he has encouraged me to discuss any topics with him, no
matter how immature it initially sounds like. I benefit a lot from his patience, kindness and
professional judgment. I would also like to thank the other two committee members, Ping
Zhang and Baohua Xin, for their invaluable suggestions and encouragements in developing
the dissertation. I would especially thank Mark Kohlbeck for donating his time to serve as my
external committee member and providing me with constructive and beneficial comments.
I also want to thank all Rotman professors who helped me during my Ph.D. study,
including Partha Mohanram, Jeff Callen, Gordon Richardson, Hai Lu, Franco Wong, Scott
Liao, Dushyant Vyas, Francesco Bova, Alex Edwards, Daehyun Kim, Aida Wahid and Feng
Chen. I also enjoyed my time with my fellow Ph.D. students Sasan Saiy, Yu Hou, Leila
Peyravan, Wuyang Zhao, Danqi Hu, Barbara Su, Stephanie Cheng, Mahfuz Chy, Muhammad
Azim and Mingyue Zhang.
v
Finally, I am very grateful to my beautiful wife and best friend, Stella Peng, and my
lovely kids, Dennis Lu and Deanna Lu, who supported me wholeheartedly throughout my
journey toward Ph.D. I would also like to acknowledge with great gratitude, the support and
love from my parents, sister, and parents-in-law. Their help and love were essential to my
achievement.
vi
Table of Content
Abstract ........................................................................................................................................... ii
Acknowledgement ……………………………………………………………………………….iv
Table of Contents ............................................................................................................................ v
Introduction .................................................................................................................................... xi
Chapter 1: Economic Consequences of Corporate Governance Disclosure: Evidence from the
2006 SEC Regulation on Related-Party Transactions ................................................................ 1
Table 7 for Chapter 2: Moderator of Director Compensation Effect on RPTs ................. 82
Table 8 for Chapter 2: Director compensation effect on RPTs at firm level .................... 83
Table 9 for Chapter 2: Alternative RPT measurement ..................................................... 84
x
Introduction
Related party transactions are common business practices. If properly used, they can be
beneficial for firms. However, misused related party transactions can cause significant losses for
investors, as in the case of Enron and Adelphia. Even though the transaction amount could be
small, misused RPTs could signal serious governance problem. Given that RPTs represent
potential means for insiders to expropriate wealth from other investors via self-dealing, both the
Financial Accounting Standards Board (FASB) and the Securities and Exchange Commission
(SEC) require detailed disclosure of material RPTs in annual reports and proxy statements. In
2006, the SEC amended its rule and regulation for RPT disclosure, which includes an entirely
new requirement to disclose a description of a company’s policies and procedures for the review,
approval, and ratification of RPTs.
Chapter 1 shows how a 2006 SEC regulation mandating RPT governance disclosure
affects the firm’s RPT behavior and the investors’ risk perception on firm’s RPTs. Before 2006,
only a few firms voluntarily disclosed their RPT governance procedures. After 2006, the RPT
governance disclosure becomes mandatory. I expect this mandatory disclosure of RPT
governance reduce the occurrence of RPTs because it enhances the RPT governance. For firms
that did not have a formal RPT governance policy before the regulation, this mandatory
disclosure requirement would encourage them to establish formal RPT policies to avoid bad
signals to investors. For firms that had an RPT policy but did not disclose before the regulation,
public RPT governance disclosure would enhance the monitoring effects as the disclosure
increases the litigation risk of responsible directors, mitigates the opportunistic behaviors of
insiders, and hence reduces agency problems arising from RPTs. Consistent with my expectation,
xi
I find when firms initiate their RPT governance disclosures following the mandatory requirement,
they significantly reduce their RPT behaviors.
Chapter 1 also examines whether investors alter their risk perceptions on those firm’s
RPT behaviors following the 2006 regulation, using implied cost of capital as risk perception
proxy. I expect this mandatory disclosure will reduce implied cost of capital premium on firms
RPTs as this mandatory disclosure reduces the information asymmetry between investors and
firms and brings better controls on RPTs. I do find affirmative results.
Chapter 2 investigates how independent directors’ compensation can affect firm’s RPT
behaviors. As independent directors are responsible for RPT governance in most U.S. companies,
the way in which they are compensated is likely to affect their incentives to effectively govern
firms’ behaviors. On the one hand, their compensation has to be high enough to attract capable
candidates; on the other hand, over-compensation may impair the independence of directors,
making them more subject to managers’ influences. By decomposing independent directors’
compensation into the market level component and the over-compensated component, I find that
firms with over-compensated directors or with a lower portion of equity-based compensation in
contrast to cash-based compensation incur more RPTs. These results suggest that independent
directors’ overcompensation reduces directors’ independence and equity-based compensation
aligns director interests with those of shareholders.
1
Chapter 1
Economic Consequences of Corporate Governance Disclosure: Evidence from the 2006
SEC Regulation on Related-Party Transactions
1. Introduction
A related-party transaction (hereafter RPT) is a transfer of resources, service, or
obligations between a reporting entity and a related party, which usually refers to executives, the
board of directors, and primary shareholders.1 RPTs can be beneficial to firms’ daily operations
because appropriate RPTs can reduce transaction costs, improve operating efficiency, and share
financial and intangible resources. However, if misused, they can result in significant losses for
investors, as in the case of Enron and Adelphia.2 Even though the transaction amounts could be
small, misused RPTs could signal serious governance problems. Given that RPTs represent
potential means for insiders to expropriate wealth from other investors via self-dealing, both the
Financial Accounting Standards Board (FASB) and the Securities and Exchange Commission
(SEC) require detailed disclosure of material RPTs in annual reports and proxy statements. To
facilitate investors’ assessment of the potential conflict of interests arising from RPTs, the SEC
amended its rules and regulations for RPT disclosure in 2006.3 The revised SEC regulation
includes an entirely new requirement to disclose a description of a company’s policies and
procedures for the review, approval, and ratification of RPTs.
In this paper, I investigate economic consequences of this mandatory RPT governance
disclosure. Specifically, I ask two questions: (1) does the disclosure of firms’ RPT governance
1 Related parties also include their immediate family members. 2For example, the top management team of Enron used special purpose entities to manipulate profit. Adelphia Communications Corp guaranteed related party debts and provided extensive loans to its top executives.3https://www.sec.gov/rules/final/2006/33-8732a.pdf, retrieved on July 25, 2017
2
lead to a lower level of RPT activities? (2) does the disclosure of firms’ RPT governance lead to
a lower implied cost of capital?
Before 2006, only a few firms voluntarily disclosed how they govern their RPTs.4 The
2006 SEC regulation requires that all firms to disclose their RPT review policy, representing an
exogenous increase in RPT governance disclosure. For the convenience of presentation, I define
firms that voluntarily disclosed their RPT governance before the 2006 regulation as “Already-
Disclosed” firms and firms that initiated RPT governance disclosure after the 2006 regulation as
“Newly-Disclosed” firms. Since the Already-Disclosed firms have voluntarily disclosed their
RPT governance prior to 2006, the impact of 2006 regulation on the Already-Disclosed firms, on
average, is expected to be significantly less than that on the Newly-Disclosed firms.
As discussed in Section 2, this study predicts that the mandatory disclosure of RPT
governance leads to a lower level of RPTs and lower cost of capital, both involving real impacts
on firms’ operating activities. This prediction is consistent with the conflict-of-interest view
(Kohlbeck and Mayhew 2010, 2017), which considers RPTs as a potentially harmful form of
expropriating wealth from shareholders. For firms that did not have a formal RPT governance
policy before the regulation, this mandatory disclosure requirement encourages them to establish
a formal policy to avoid being scrutinized by investors and regulators. For firms that had RPT
policies but had not disclosed their existing RPT policies before the regulation, public RPT
governance disclosure potentially enhances the monitoring as the disclosure increases the
litigation risk of responsible directors, mitigates the opportunistic behaviors of insiders, and
hence reduces agency problems arising from RPTs. To test these hypotheses, I hand-collect
4 Approximately 20% of S&P 1500 firms in my sample voluntarily disclosed RPT governance in the fiscal year 2004.
3
information regarding RPTs and RPT governance for all S&P 1500 non-financial firms from
annual proxy statements for fiscal years 2004, 2007, and 2010.5
For the first research question, I find that after the 2006 regulation, Newly-Disclosed
firms significantly reduce their RPT activities relative to Already-Disclosed firms. This result is
robust to controlling for several determinants of RPT occurrence, suggesting that (1) the
disclosure of RPT governance enhances firms’ governance on RPTs and (2) the 2006 SEC
regulation affects firms’ RPT activities. The conclusions also hold for a propensity-score
matched sample between Already-Disclosed firms and Newly-Disclosed firms.
Next, I examine whether such RPT governance disclosure effects on RPTs are
conditional on mechanisms that can reduce agency problems. Previous literature shows that
external monitoring helps reduce the opportunistic behaviors of insiders and hence reduce
agency costs (Jensen and Meckling 1976; Huddart 1993; Giroud and Mueller 2011). When
external monitoring is relatively weak, potential agency costs are high, and thus managers are
more likely to be involved in self-dealing. I expect that the RPT governance disclosure effects on
RPTs should be more pronounced when the external monitoring is less effective, because these
RPT activities are more likely to be harmful ex ante. Consistent with my expectation, I find that
the disclosure effects of RPT governance are stronger when there is lower institutional
ownership, lower analyst following, and less severe industry competition.
In the second research question, I investigate whether this mandatory disclosure alters the
implied cost of capital. Prior literature finds that RPT firms are associated with poor corporate
governance and lower accounting quality (Kohlbeck and Mayhew 2017; Gordon and Henry
2005). While not all RPTs are misused, there is a view that RPTs represent a high-risk factor for 5Following Kohlbeck and Mayhew (2017), I do not collect RPTs data in consecutive years because many RPTs are sticky transactions that either have multiple-year terms or appear every year with similar contract terms. Collecting data every three years allows for changes in RPTs and is more efficient.
4
investors to consider before investing (Cheung, Rau, and Stouraitis 2006). There is evidence that
insiders may use RPTs to directly expropriate wealth from other investors (Cheung, Qi, Rau and
Stouraitis 2009; Kohle and Shastri 2004). High information asymmetry and high expropriation
risk suggest that RPTs firms could be associated with high implied costs of capital. I argue that
this mandatory disclosure can reduce the implied costs of capital associated with RPTs.
Consistent with this expectation, my empirical analyses show that when Newly-Disclosed firms
disclose their RPT governance, investors reduce the implied cost of capital associated with RPTs
of these firms. The implied cost of capital associated with RPTs of Already-Disclosed firms, on
the other hand, does not change significantly from the pre-regulation to the post-regulation
periods.
Previous literature shows that the effects of disclosures on firms’ implied cost of capital
could be through two possible channels: an information channel or a governance channel
(Cheynel 2013; Verrecchia 2007; La Porta et al. 2000). The information channel implies that the
disclosure provides more information regarding how firms control their RPTs, reducing the
information asymmetry between firms and investors. Through the governance channel, the
disclosure improves firms’ governance on RPTs and reduces harmful RPTs, which leads to fewer
self-dealing activities and lower litigation risks. My analysis shows that, between these two
channels, the governance channel is the main contributing factor to the reduction of implied cost
of capital associated with RPTs. The empirical results show that for firms that only improved
their disclosure but that did not change their RPT behaviors in the post period, their implied cost
of capital associated with RPTs did not decrease. By contrast, for firms that reduce their RPTs in
the post period, their implied cost of capital associated with RPTs significantly reduced.
5
The SEC requires, among other disclosures, a disclosure of (1) whether the policies and
procedures are in writing, and (2) the persons or groups of persons who are responsible for the
review, approval, and ratification of RPTs. Hence I further test if these particular disclosure
requirements affect the frequency of RPTs and the implied cost of capital associated with RPTs.
My results show that whether firms have a written policy does not affect the occurrence of RPTs
nor the implied cost of capital. The group responsible for approving RPTs, however, is
associated with outcomes of RPTs. Specifically, when an Audit Committee is responsible for
reviewing and approving RPTs, firms have fewer RPTs and lower implied cost of capital
associated with RPTs than firms that do not assign a specific committee to review RPTs.
This research contributes to the existing literature in several aspects. My study shows that
disclosure of RPT governance effectively increases firms’ monitoring of RPTs, reducing both
RPT activities and the implied cost of capital, suggesting that the disclosure of governance
enhances firms’ real governance on RPTs. Such outcomes add to literature studying real
disclosure effects (Leuz and Wysocki 2016), showing that mandatory disclosure requirements have
economic consequences on firms’ operating activities besides financial reporting.
I also find that the effects of RPT governance disclosure on RPTs are more pronounced
when industry competition is weak, when institution holding is low, and when analyst following
is low. These findings provide evidence that the effects of disclosure on governance are
contingent on potential agency costs. In addition, I find that the disclosure effects depend on the
transaction types and identities of related parties, suggesting that some types of RPTs are more
likely to be used as expropriation and that it is advisable to recognize the heterogeneity and treat
them differently.
6
This is one of the few papers investigating the economic consequences of the SEC’s 2006
regulation related to RPT governance disclosure. This mandatory requirement reflects the
continuous efforts of the SEC to encourage firms to provide more transparent disclosure about
RPTs. Studying how firms react to this new regulation and whether investors benefit from such
mandatory requirements can provide evidence on the effectiveness of the disclosure regulation
and should be relevant to future regulations.
Balsam, Gifford, and Puthenpurackal (2017) also find a change of RPTs around this 2006
SEC RPT disclosure change. My paper differs from theirs in several ways. First, this article
investigates a governance effect of a mandatory disclosure using a difference-in-differences
model around the 2006 SEC disclosure change, while their focus is on the association between
RPTs and CEO compensation. Recognizing their findings, I also control for CEO compensation
in my research design. Second, my sample includes a broader scope of companies. Specifically,
my sample consists of S&P 1500 composite firms while Balsam et al. (2017) randomly select
500 firms. Third, my paper examines more detailed RPT categories based on the identity of
related parties and transaction types. Such analysis helps to better understand the nature of RPTs
and how various types of RPTs can reflect conflict of interests differently.
Furthermore, among the several RPT disclosures required by the SEC in 2006, I provide
evidence on which particular disclosures affect investors' implied cost of capital. Such findings
can provide further guidance to regulators, and firms as well, to adopt the best practices in RPT
monitoring.
Finally, my research contributes to the limited empirical literature on RPTs in the U.S.
setting. Existing RPTs research focuses mainly on developing countries because firms are more
likely to have self-dealing problems when legal protection for investors is weak. In contrast,
7
there are few studies in more developed countries such as the U.S. My study shows that even in
the U.S., where strong minority shareholder protection is in place, RPTs can still imply risks to
investors, adding to the findings of Kohlbeck and Mayhew (2010, 2017) and Ryngaert and
Thomas (2012).
2. Hypotheses Development
2.1 Background RPT Regulations in the U.S.
RPTs represent potential “self-dealing” between the company and its executives,
directors, major shareholders, and other related parties. Such transactions usually require
additional monitoring from shareholders. In the U.S., regulators do not require shareholders’
approval of RPTs and instead rely on disclosure regulation and ex-post litigation to protect
minority shareholders.6 The FASB and the SEC set the main RPT disclosure requirements. The
FASB ASC Topic 850 requires disclosure of material RPTs in the financial statements. The SEC
regulation S-K 404(a) requires disclosure of RPTs in both 10-Ks and proxy statements. Required
disclosures by SEC include (1) the nature of the relationship, (2) a description of the transaction,
(3) the dollar amount of the transaction, and (4) the amount due to or from related parties at the
balance sheet date.
In August 2006, the SEC amended its regulations for RPT disclosure. The revised SEC
regulation includes an entirely new requirement to describe a company’s policies and procedures
for the review, approval, and ratification of RPTs. The regulation states that the description
should include: (a) the types of transactions that are covered by such policies and procedures; (b)
the standards to be applied pursuant to such policies and procedures; (c) the persons or groups of
6 Before 2002, loans to executives were prevalent RPTs in public companies. The Sarbanes-Oxley Act of 2002, however, prohibits any public company from providing loans to its executive officers and directors.
8
persons on the board of directors or otherwise who are responsible; and, (d) a statement of
whether such policies and procedures are in writing and, if not, how such policies and procedures
are evidenced.
2.2 Literature Review and Hypotheses Development
Prior literature has established two prevailing theories regarding RPTs: the conflict of
interests theory and the efficient transaction theory. The former views RPTs as a potentially
harmful form of expropriating wealth from shareholders, while the latter describes RPTs as an
efficient economic exchange.
Existing RPTs studies are more consistent with the conflict of interests theory. For
example, research finds that RPTs are associated with poorer financial reporting quality and
lower operating performance (Berkman, Cole, and Fu 2009; Ryngaert and Thomas 2012).
Research also shows that RPTs relate to weak corporate governance. Denis and Sarin (1999) and
Klein (2002) document that RPTs may undermine non-executive directors’ functions, turning
them into affiliated or gray directors who are not independent anymore, and hence are associated
with weaker corporate governance. Similarly, Kohlbeck and Mayhew (2010) and Gordon, Henry,
and Palia (2004) provide evidence that weaker corporate governance makes RPTs more likely to
occur.7 If RPTs represent the conflict of interests between investors and insiders, then effective
corporate governance should mitigate this conflict.
When studying the corporate governance effects on RPTs, prior literature uses traditional
governance proxies such as the percentage of independent directors on the board. In my study, I
7Nekhili and Cherif (2011) and Lo, Wong, and Firth (2010) find similar associations in France and China, respectively.
9
focus on a more directly relevant measure of RPTs’ governance, namely, the presence of an RPT
governance policy.
Before the 2006 SEC RPT regulation, approximately one fifth of firms voluntarily
disclosed their RPT governance policy. Following the 2006 RPT regulation, all public firms in
the U.S. are required by the SEC to disclose their RPT governance policies. I posit that this
mandatory disclosure has real effects on firms’ behavior and reduces the occurrence of RPTs.
First, under this new regulation, firms are likely to establish formal RPT governance
policies if they did not have one yet, given that the absence of formal RPT governance policies
could lead to scrutiny from investors and regulators. Another benefit for such firms to establish a
new RPT governance policy is the signaling effects. Firms with newly-created RPT policies
could signal to the market of their RPT governance, as compared to those firms that do not have
ex-ante RPT policies and choose not to establish one ex-post. Under the mandatory disclosure
requirement, these latter firms will have to disclose the fact that they do not have a formal RPT
governance policy, making them less desirable in the eyes of investors.
When firms do not have formal RPT governance policy, theoretically they could conduct
any RPTs as long as these transactions are disclosed. If the related parties are able to self-
approve their own transactions, it is likely that they benefit themselves at the cost of other
stakeholders. When a firm has an effective RPT governance policy, the policy potentially aligns
management interests with shareholders’ interests by minimizing harmful RPTs. Hence a more
transparent disclosure of governance policy may constrain the occurrence of harmful RPTs and
mitigate investor concerns regarding the self-dealing effects.
If firms had RPT governance policies but choose not to disclose them before the adoption
of the 2006 SEC regulation, this public disclosure requirement can still enhance their RPT
10
control as it decreases the monitoring cost of investors, increases the litigation risk of responsible
authorities, and therefore encourages the firm to improve the effectiveness of their RPT control,
also leading to a reduction of RPTs.
In sum, a formal RPT governance policy, no matter whether it is newly established or
already in place, could help ex-ante no-disclosure firms (i.e. Newly-Disclosed firms) to reduce
harmful RPTs when the SEC’s new mandatory disclosure requirement is in place, since it
reduces information asymmetry and aligns more with investors’ interests.
On the other hand, it is also possible that RPT governance policies are just window
dressing and do not have any practical impact on the occurrence of RPTs. For example, Enron
had set up a formal procedure to examine the fairness of transactions, yet this procedure did not
prevent Enron from its RPT wrongdoings. In such case, the disclosure of RPT governance policy
would not help firms reduce harmful RPT activities.
Taken together, I expect that, on average, the disclosure of RPT governance policy
reduces the occurrence of RPTs given the potential conflict of interests associated with RPTs.
Therefore, I construct my first hypothesis as follows (all hypotheses are stated in the alternative
form):
H1: The disclosure of RPT governance policy is associated with a lower level of RPTs.
If RPTs represent opportunistic behaviors of insiders, then RPTs are more likely to be
harmful when agency problems are more severe. As agency problems are not only constrained
by corporate governance but also affected by other factors such as industry competition,
ownership structure, and analyst following, I expect that the pressures faced by firms from these
11
external factors can also affect the nature of RPTs. Consequently, I expect the disclosure effects
to be conditional on the environment in which firms operate.
Prior research shows that ownership structure is a factor affecting firms’ behavior. With a
diffused ownership structure, there is a reduced incentive for any individual owner to monitor
corporate management, because the individual owner would bear the entire monitoring cost, yet
all shareholders benefit. As a result, only large non-controlling shareholders, such as institutional
investors, have sufficient incentives and means to monitor firms and limit agency problems
(Shleifer and Vishny 1986; Huddart 1993). Accordingly, firms with low institutional ownership
face lower monitoring pressures and are more likely to involve in harmful RPTs ex-ante.
Consequently, I expect that the ex-post reduction in RPTs is more pronounced for these firms.
H2a: The reduction of RPT occurrence following the initial disclosure of RPT governance is
more pronounced when the proportion of institutional ownership is low.
Equity analysts provide another monitoring mechanism to align insiders’ and
shareholders’ interests (Jensen and Meckling 1976). To increase their market influence and
reputation through timely and reasonable recommendations, analysts exert significant efforts in
examining firms’ strategy, governance, and activities. With scrutiny and attention from more
analysts, insiders face greater risks of negative market reactions or personal reputation damage
when involved in self-dealing transactions. Consequently, I expect that the reduction of RPTs
following disclosure of RPT governance be more pronounced when analyst following is low.
12
H2b: The reduction of RPT occurrence following the initial disclosure of RPT governance is
more pronounced when analyst following is low.
Research also shows that industry competition can put direct pressure on firms and
reduce agency costs (Giroud and Mueller 2011; Baggs and De Bettignies 2007; Jagannathan and
Srinivasan 1999). This is because firms in highly competitive industries are more likely to go
bankruptcy than other firms. This high bankruptcy risk gives managers strong incentives to work
hard to remain competitive, aligning their interests more with shareholders. With respect to RPTs,
these firms are more likely to forgo harmful RPTs and take beneficial RPTs to reduce transaction
costs and improve efficiency, mitigating expected bankruptcy costs. As a result, I expect that
reduction in RPTs following disclosure of RPT governance be more pronounced when industry
competition is weak.
H2c: The reduction of RPT occurrence following the initial disclosure of RPT governance is
more pronounced when industry competition is weak.
The conflict of interests theory suggests that RPTs firms could have higher implied costs
of equity capital for at least two reasons. First, RPTs are associated with poor accounting quality,
increasing information risks. Jian and Wong (2010) find that Chinese listed firms use abnormal
related sales to their controlling owners to prop up earnings. Chen, Cheng, and Xiao (2010) find
that controlling shareholders in China structure RPTs in the pre-IPO period to affect IPO
performance. Using a sample of 360 companies in the U.S., Gordon and Henry (2005) find that
some types of RPTs are associated with higher abnormal accruals. Kohlbeck and Mayhew (2017)
13
show that RPT firms are more likely to restate their financial reports. Similarly, Cullinan, Du,
and Wright (2006) document a significant association between executive loans and financial
misstatements. The literature shows that information risks are associated with higher cost of
equity both theoretically (Easley and O’Hara 2004; Lambert et al. 2007) and empirically (e.g.,
Francis et al. 2005).
Second, many RPTs are associated with poor corporate governance (Denis and Sarin
1999; Klein 2002; Gordon, Henry and Palia 2004). There is also evidence that insiders can use
RPTs to directly expropriate wealth from other investors. For example, Cheung, Qi, Rau, and
Stouraitis (2009) examine 254 related-party acquisitions and sales of assets in Hong Kong and
find that firms pay higher prices when purchasing from related parties and receive lower prices
when selling to related parties. Kahle and Shastri (2004) show that the loans made to executives
are usually issued at below-market interest rates. Consistent with these studies, the stock market
reacts negatively to RPTs (Cheung, Rau, and Stouraitis 2006; Ryngaert and Thomas 2012;
Kohlbeck and Mayhew 2010). This concern of expropriation could also increase the
investigation risk from SEC and litigation risk through conflict of interests lawsuits.8,9
Disclosure of RPT governance policy could mitigate the relation between RPTs and the
implied cost of capital. When firms withhold information, rational investors tend to assume the
worst scenario and increase the risk premium (Grossman 1981). Cheynel’s (2013) model
predicates that firms that voluntarily disclose their information have lower cost of equity capital
than firms that do not disclose. Lambert, Leuz, and Verrecchia’s (2007) model demonstrates that
8 For example, in October of 2015, the SEC charged Home Loan Servicing Solutions Ltd. (HLSS) with making material misstatements about its handling of related party transactions and for having inadequate internal accounting controls. HLSS agreed to pay a $1.5 million penalty to settle the SEC’s charges. 9 For example, in June 2016, Tesla Motors Inc. proposed a $2.6 billion merger with a related party, SolarCity Corp. Two individuals and two institutional shareholders of Tesla filled four lawsuits alleging board members breached their fiduciary duty.
14
disclosure can affect the cost of capital because higher quality disclosures affect the firm’s
assessed covariance with other firms’ cash flows, which is non-diversifiable. In addition, they
show that disclosure can affect a firm’s real decisions, which likely changes the firm’s ratio of
the expected future cash flows to the covariance of these cash flows with the sum of all the cash
flows in the market. Numerous empirical studies support such predictions (Botosan 1997; Lang,
Lins, and Maffett 2012).
When firms disclose their RPT governance policies, I expect that this behavior affects the
implied cost of capital through two channels: an information channel and a governance channel.
Through the information channel, a disclosure of RPT policy can provide investors with more
information regarding how firms control their RPTs, reducing the information asymmetry
premium between firms and investors. In such a case, investors are able to assess the
consequence of RPTs with less uncertainty.
Through the governance channel, a disclosure of RPT governance could improve firms’
governance and reduce harmful RPTs, mitigating the conflict of interests between insiders and
outsiders. Less risk of both expropriation and consequent litigation could also reduce the cost of
capital associated with RPTs. Therefore, my third hypothesis is:
H3: The initial disclosure of RPT governance policy is associated with lower implied costs of
capital associated with RPTs.
15
3. Data and Research Design
3.1 Related-party transaction data
I hand-collect RPT data and RPT governance data from S&P 1500 firms’ proxy
statements on the SEC’s website for 2004, 2007, and 2010. Following Kohlbeck and Mayhew
(2017), I choose every three years rather than consecutive years because this design allows for
changes in RPTs to occur, as many RPTs are sticky transactions that involve multiple years. I
start from 2004 because post-SOX period data can mitigate the SOX impact on corporate
governance and RPT disclosures. I choose 2010 as the last year of data collection, believing that
the three-year data are sufficient to study the effects of RPT policy disclosures. I focus on S&P
1500 because these firms cover approximately 90% of the U.S. market capitalization.
Out of the 1500 S&P composite firms, I exclude 430 financial firms, resulting in 3,210
firm-year observations for which proxy statements are available to identify whether or not the
firm reported RPTs. After removing firms with missing data, my final sample includes 2,850
firm-year observations.
RPTs can be measured by either the number of transactions or the amount of transactions.
In my main analyses, I adopt the number of RPTs as I consider that several small RPT
transactions likely reflect more severe agency problems than a single larger transaction if the
aggregate transaction amounts are similar. However, in additional analyses I use the transaction
amount of RPTs as an alternative measurement.
3.2 Regression model
The objective of this paper is to examine whether firms change their RPT behavior in
response to the mandated RPT governance disclosure and whether investors update the implied
16
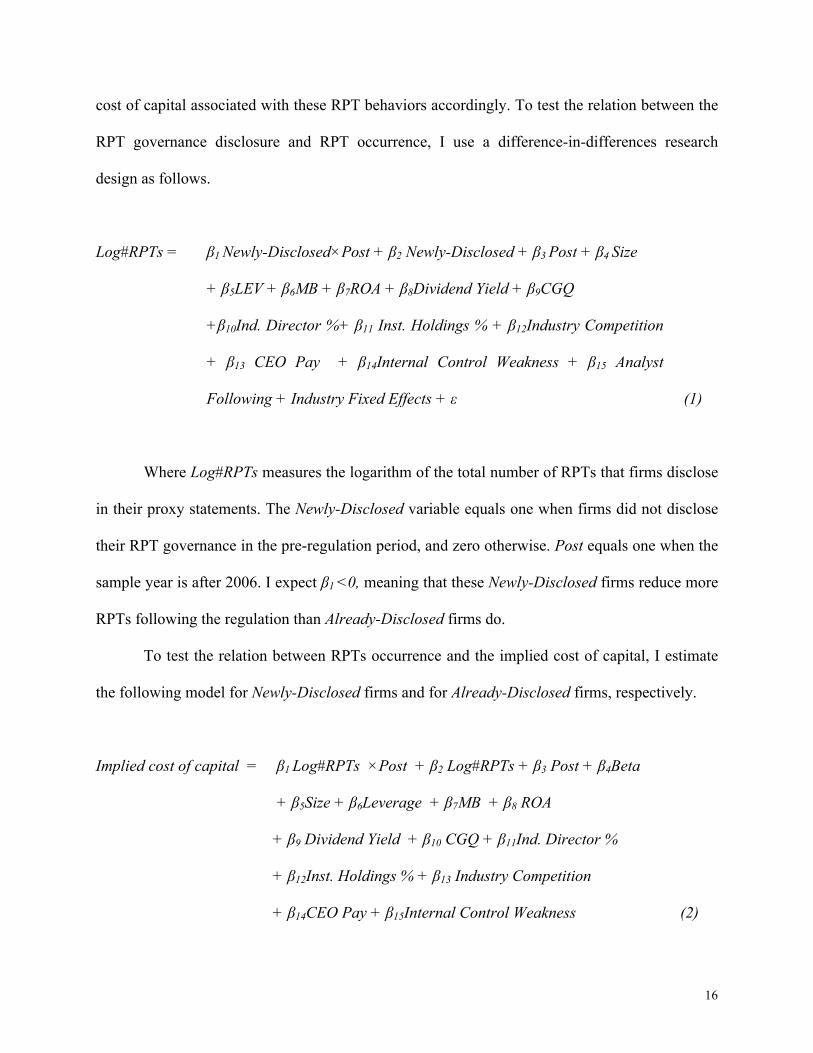
cost of capital associated with these RPT behaviors accordingly. To test the relation between the
RPT governance disclosure and RPT occurrence, I use a difference-in-differences research
+ β16 Analyst Following +Industry Fixed Effects + ε
To measure the implied cost of capital, I follow Hail and Leuz (2006) and estimate the
cost of equity using four different models: the Claus and Thomas (2001) model, the Gebhardt et
al. (2001) model, the Ohlson and Juettner-Nauroth (2005) model, and the Easton (2004) model.
Because there is little consensus in the literature regarding which model works best, I use an
average value of the four models to reduce the idiosyncratic measurement error across various
models following prior literature (Ghoul et al 2011; Hou 2015).
I run this regression separately for Newly-Disclosed firms and Already-Disclosed firms to
avoid inconvenient interpretation of triple interaction terms. I expect β1 to be significantly more
negative for Newly-Disclosed firms than for Already-Disclosed firms.
3.3 Control variables
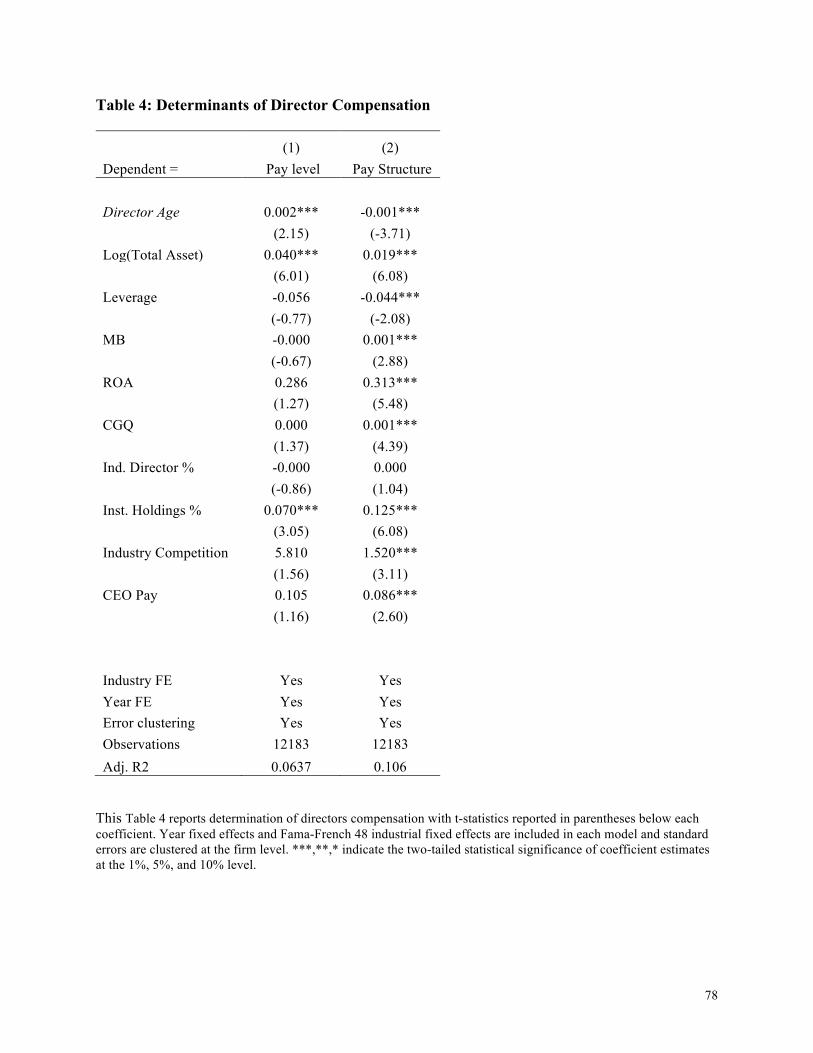
In the multivariate analyses, my control variables include firm size (Size), measured as
the natural logarithm of total revenue; market-to-book ratio (MB), measured as the ratio of
market value of equity to the book value of equity; return on assets (ROA), measured as net
income before extraordinary items scaled by total asset; leverage (Leverage), measured as the
ratio of total debt to the book value of equity; and dividend yield (Dividend Yield), measured as
the ratio of total dividends to the book value of equity. As prior research shows that overall
corporate governance affects the occurrence of RPTs, I also control for general governance,
including the percentage of independent director on the Board (Ind. Director %), presence of
internal control weakness (Internal Control Weakness), and the Corporate Governance Quotient
(CGQ) index, a rating developed by Institutional Shareholder Services (ISS) that rates publicly
18
traded companies in terms of the quality of their corporate governance.10 A higher CGQ implies
stronger corporate governance. To control for external monitoring factors affecting opportunistic
behaviors, I include institutional ownership (Inst. Holdings %), measured as percentage of shares
owned by institutional investors, industry competition (Industry Competition), measured as the
Herfindahl-Hirschman Index of industry market share, and analyst following (Analyst following),
measured as the number of analysts following the firm. I also control for CEO compensation
(CEO PAY), measured as the natural logarithm of total CEO annual compensation scaled by firm
size. In addition, I control for Beta in the analysis of risk associated with RPT. Finally, all
regressions include Fama-French 48 industry fixed effects to control for heterogeneity at the
industry level and error clustering at the firm level.
10 This CGQ index measures the overall corporate governance relative to a firm’s industry group. Ratings are calculated on the basis of 61 data points from eight core categories: (1) Board of directors, (2) audit, (3) charter and bylaw provision, (4) laws of the state of incorporation, (5) executive and director compensation, (6) qualitative factors, (7) ownership, and (8) director education.
19
4. Empirical Results
4.1 Descriptive statistics
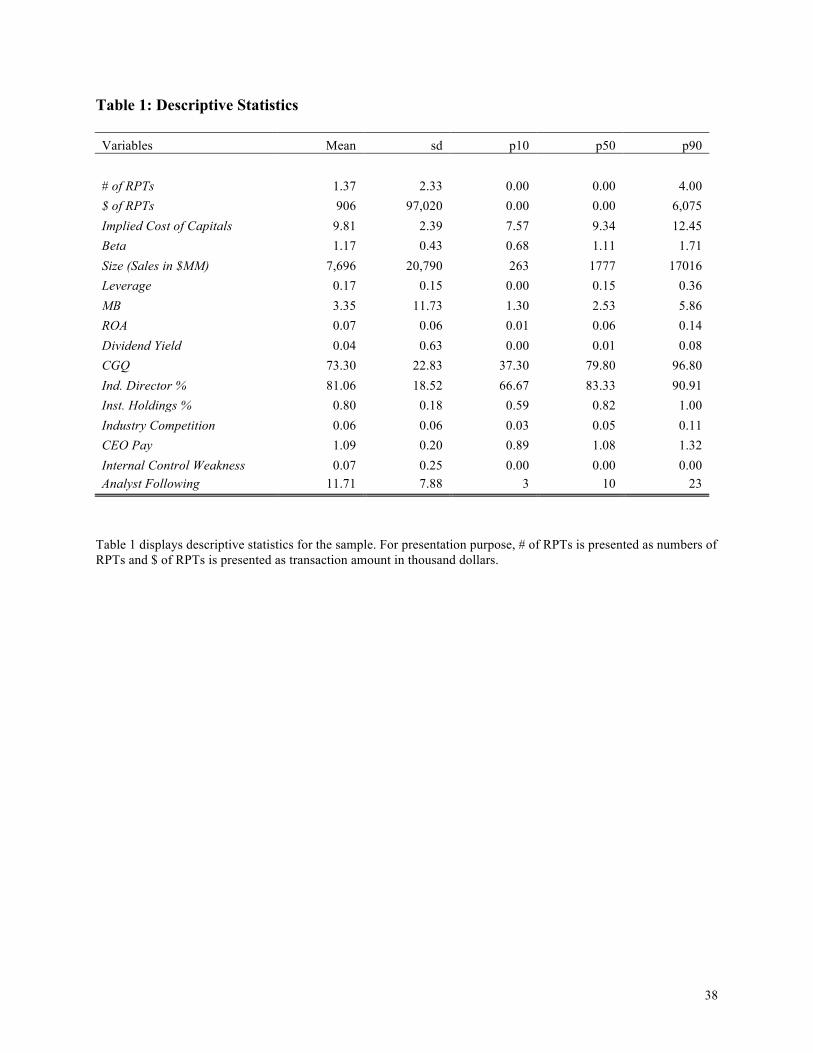
Table 1 provides descriptive statistics. On average each firm-year observation reports
1.37 related-party transactions. The mean implied cost of capital is 9.8% and the average beta is
1.17, slightly above the market average. The average revenue is $7.5 billion and the average
leverage is 0.17. The mean of the governance score (CGQ) is 73 compared to an industry
average score of 50, reflecting that my sample firms are better governed than their industry peers.
The percentage of independent directors is 81% and the percentage of average institutional
holdings is 80%, showing that both internal and external monitoring in my sample firms are
relatively strong.
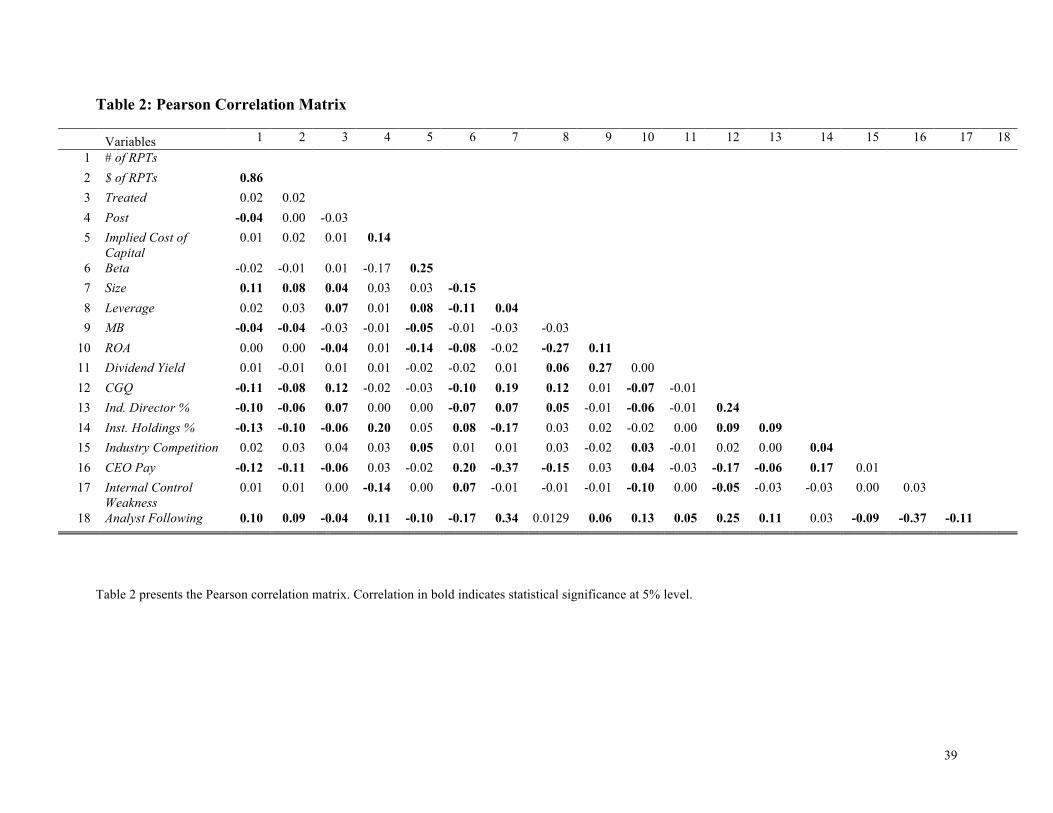
Table 2 reports the Pearson correlations and shows that firms that are larger, have higher
leverage, have lower market-to-book ratios, and are poorly governed tend to report more RPTs.
In addition, I do not find high correlations between the explanatory variables, suggesting
multicollinearity is not a serious concern in my analyses.
4.2 Primary Analyses
4.2.1 RPT governance disclosure and occurrence of RPTs
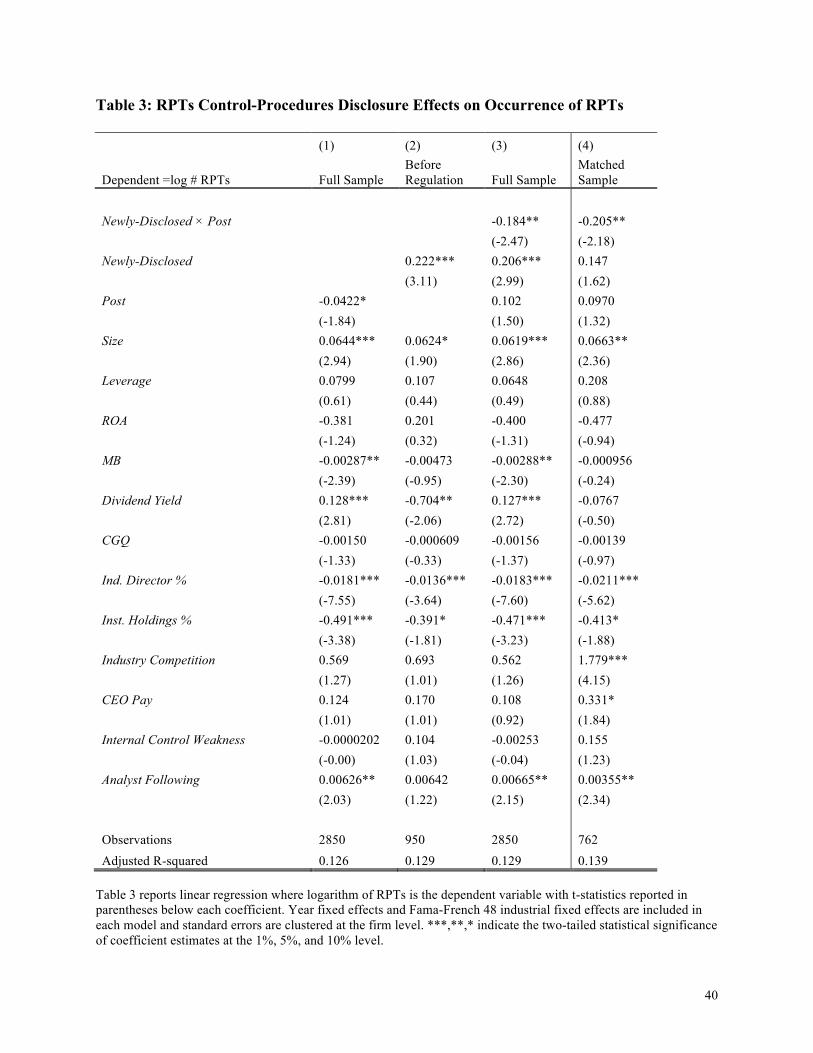
I begin my empirical analysis by examining whether disclosures of RPT governance
affect the occurrence of RPTs in Table 3. In Column 1, I regress the number of RPTs on Post
while controlling for other firm characteristics and fixed effects. The coefficient on Post is -0.04
(significant at the 10% level using a two-sided test), providing preliminary support for the 2006
SEC regulation effectively reducing the occurrence of RPTs.
20
In Column 2, I examine whether RPT governance disclosure is associated with fewer
RPTs in the pre-regulation period. The coefficient on Newly-Disclosed firms is 0.22 and is
significant at the 1% level, showing that Newly-Disclosed firms have more RPTs than Already-
Disclosed firms in the pre-regulation period. When RPT governance disclosure is voluntary, the
Newly-Disclosed firms report significantly more RPTs than Already-Disclosed firms.
In Column 3, I conduct a difference-in-differences analysis around the 2006 SEC
regulation. The interaction term of Newly-Disclosed and Post is negative and significant at the 5%
level, implying that compared with Already-Disclosed firms, the reduction of RPTs is more
salient for Newly-Disclosed firms.
The above analysis suggests that the RPT governance disclosure affects the occurrences
of RPTs, consistent with H1. One possible concern is that Already-Disclosed firms may be
fundamentally different from Newly-Disclosed firms. Including numerous firm characteristics
and fixed effects in the regression may not be sufficient to control for such pre-existing
differences. To better separate out the treatment effects, I use propensity-score matching to
match samples by firm characteristics and redo the analysis in Column 4.11 Using this balanced
panel, I continue to find that Newly-Disclosed firms reduce more RPTs than Already-Disclosed
firms in the post-regulation period, consistent with prior findings.
The signs of control variables are consistent with expectations. Larger firms tend to have
more RPTs than small firms, because larger firms tend to have more related parties and their
business is more complicated. The coefficient on MB is negative, consistent with the perception
that related-party firms are valued lower by the market. Finally, the corporate governance
measurements are negatively related to RPTs.
11 In this PSM, I first run a logistic regression of RPT governance disclosure on all control variables to obtain the propensity score. Then I match the treatment group sample (i.e. Newly-Disclosed Firms) with the control group sample (i.e. Already-Disclosed Firms) with a caliper matching set at 0.1.
21
In sum, the analyses show that the disclosure of RPT governance significantly reduces
the occurrence of RPTs even after controlling for traditional internal and external monitoring
mechanisms.
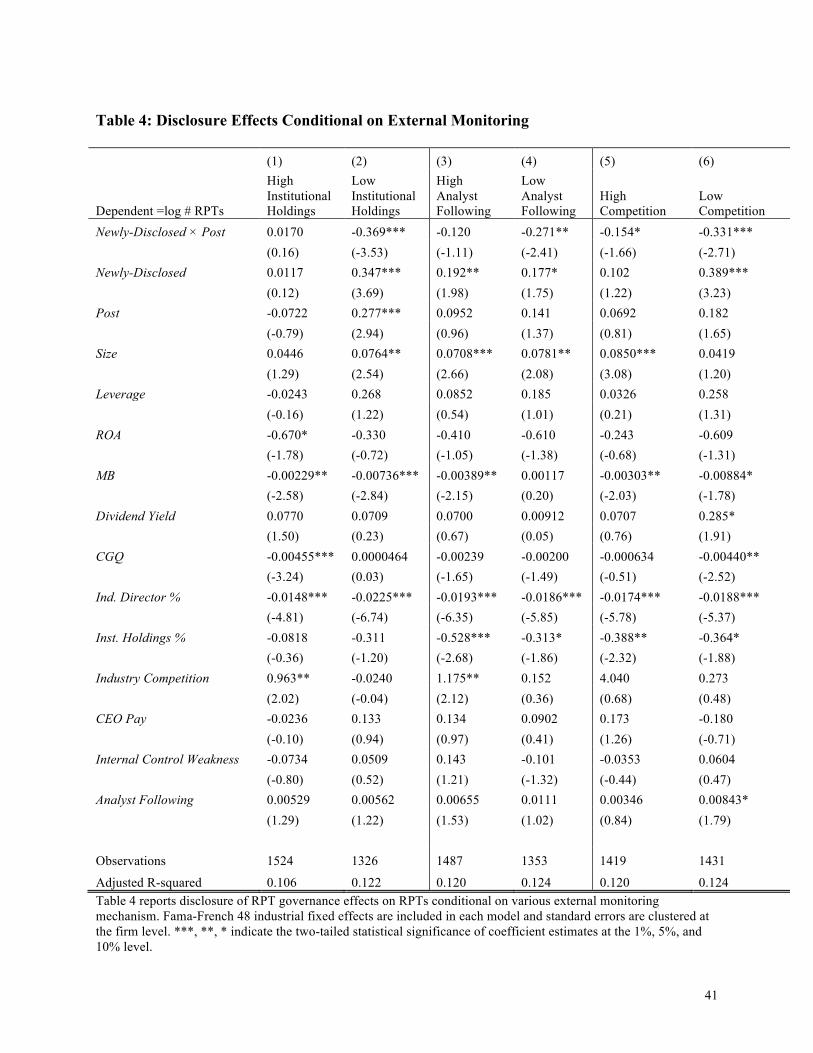
4.2.2 RPT governance disclosure effects conditional on potential agency costs
In this section, I examine under which conditions the regulation effects are more
pronounced. Because RPTs can reflect a conflict of interests, and the disclosure of RPT
governance potentially mitigates the potential risks associated with RPTs, I expect that the
effects of RPT governance disclosure are conditional on agency costs. I choose three
In Columns 1 and 2 of Table 4, I partition sample firms into high and low institutional
ownership by the median of the sample and rerun model (1) for each group. The estimated
coefficients on Newly-Disclosed and Post and the interaction of Newly-Disclosed and Post are
not significant in Column 1, suggesting that the disclosure of RPT governance has little effect on
the occurrence of RPTs when institutional holdings are high. In Column 2 where the outcomes
for low institutional ownership group is presented, I find that the coefficients on the interaction
of Newly-Disclosed and Post are significant and negative, suggesting the effects of RPT
disclosure governance concentrate on firms with low institutional ownership. The coefficient
difference between high and low institutional holding firms (using a fully-interacted model) is
significant at the 5% level.
In Columns 3 and 4 of Table 4, I partition the sample by the median of the number of
analysts following the firm. Columns 3 and 4 represent the analysis for firms with high and low
analyst following, respectively. The results show that the coefficients on the interaction of
22
Newly-Disclosed and Post are negative and significant for the low analyst following group but
not for the high analyst following group, and that the difference between the two is statistically
different. Comparing the results between the two groups, I find that when there are fewer
analysts following the firm, the mandatory disclosure of RPT governance is more likely to affect
the occurrence of RPTs.
In Columns 5 and 6, I examine whether these disclosure effects are influenced by
industry competition.12 The results show that the association between mandatory disclosure of
RPT governance and reduction of RPTs is stronger when there is less competition, consistent
with the argument that potential agency costs can alter RPT governance disclosure effects on
RPTs.
In sum, Table 4 shows the effects of RPT governance disclosure are more pronounced
when institutional holdings and analyst following are low, and when industry competition is
weak. The findings are consistent with the H2 that the disclosure effects are stronger in situations
with potentially high agency costs.
12 Industry competition is measured by the Herfindahl index using revenues in each Fama-French 48 industry.
23
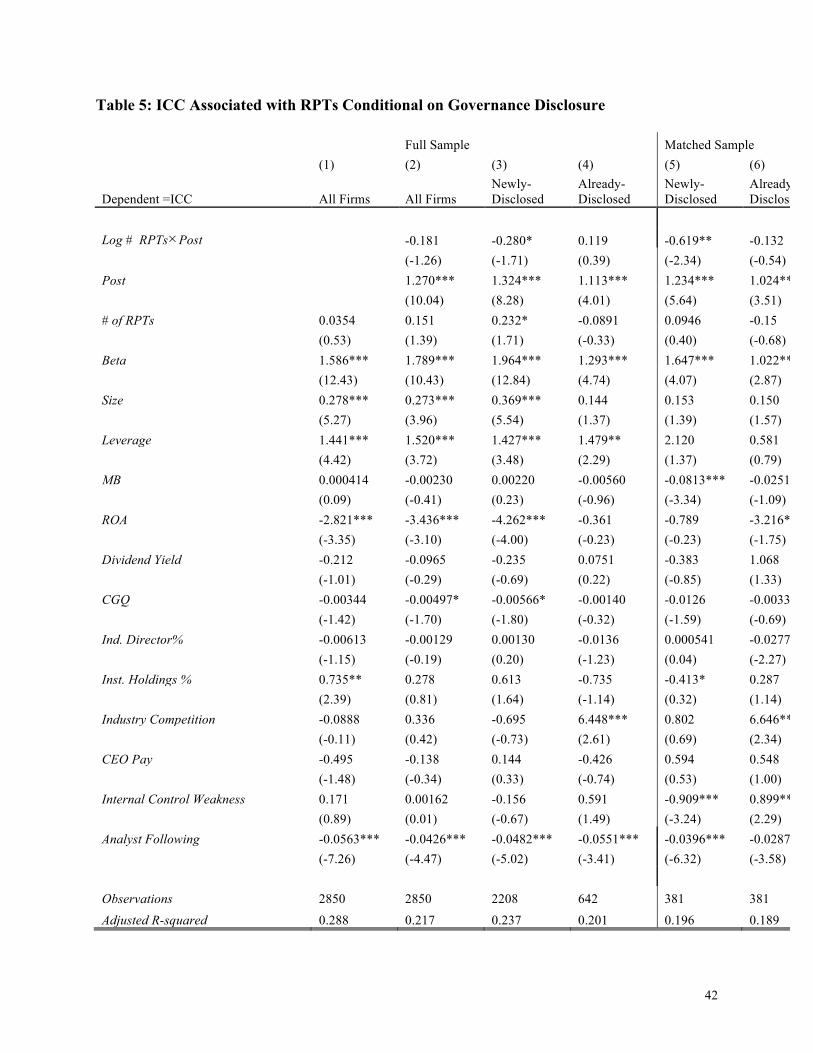
4.2.3 RPT governance disclosure and the implied cost of capital
Having shown that firms change their RPT behaviors following the 2006 regulation, I
next examine whether investors recognize this change. To examine the impact of the regulation
on the implied cost of capital associated with RPTs, I regress the average implied cost of capital
on the log number of RPTs. In Columns 1 and 2 of Table 5, I run a cross-sectional regression
using pooled data, and find that the occurrence of RPTs does not have a significant impact on
firms’ implied cost of equity capital either before or after the 2006 regulation, suggesting that on
average, the investors do not put an implied costs of capital associated with RPTs.
Investors, however, may have different RPT perceptions on Newly-Disclosed and
Already-Disclosed firms. In Columns 3 and 4, I partition the sample into Newly-Disclosed and
Already-Disclosed firms to compare the regulation effects between the two groups. In Column 3,
the coefficient on log#RPTs×Post is significantly negative, consistent with a decrease in RPT
risk premium for Newly-Disclosed firms in the post-regulation period. In Column 4, I find that
for Already-Disclosed firms, the risk premium does not significantly change in the post-
regulation period, suggesting the regulation does not have a significant impact on this group. The
results in Columns 3 and 4 are statistically different at the 10% level using two-sided tests,
supporting the argument that disclosure of RPT governance does affect the risk premium that
investors attach to RPTs. The 2006 mandatory disclosure regulation has virtually no impact on
Already-Disclosed firms, yet has a significant impact on Newly-Disclosed firms, suggesting that
investors perceive reduced risk when more risk-related information of RPTs is disclosed.
Analysis using the propensity-score matched sample in Columns 5 and 6 affirm and strengthen
the findings.
24
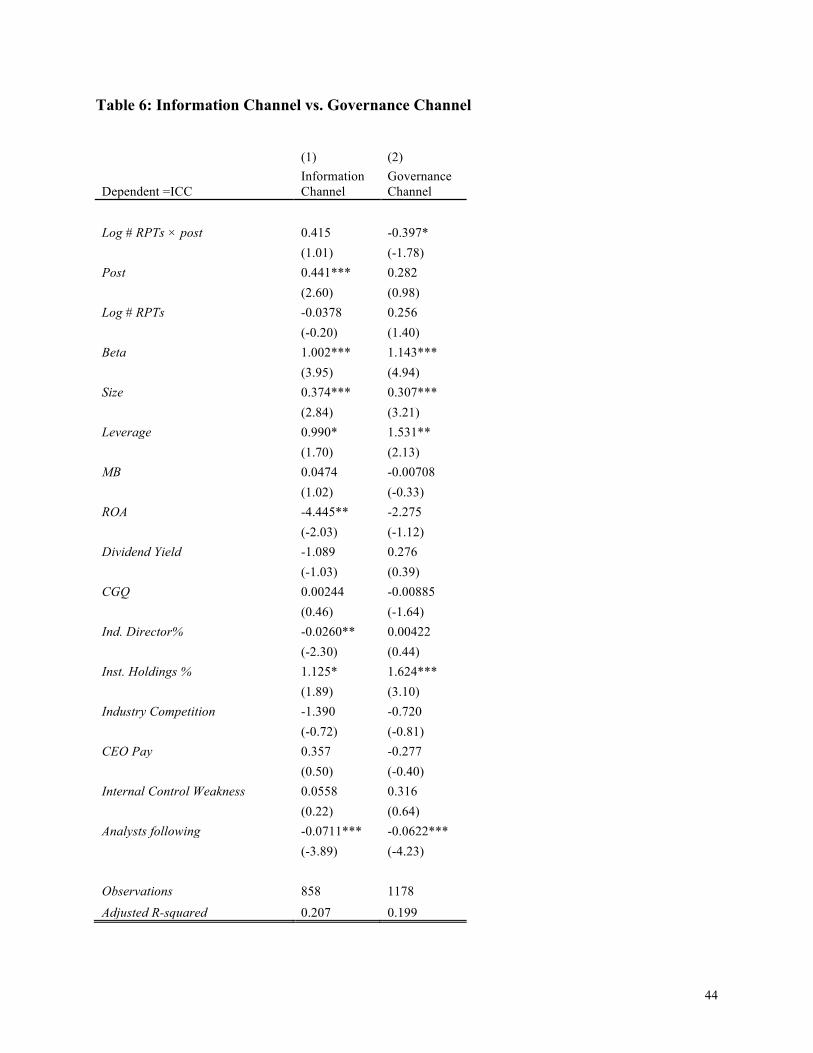
As argued in hypothesis development section, the reduction of implied cost of capital
associated with RPTs can be achieved through an information channel, that is, reducing
information asymmetry, or a governance channel, that is, reducing harmful RPTs. To distinguish
the information channel from the governance channel, I separate Newly-Disclosed firms that did
not change their RPT behaviors in 2007 from those Newly-Disclosed firms that changed their
RPT behaviors in 2007. I argue that for those Newly-Disclosed firms that did not change their
RPT behaviors, reduction in the implied cost of capital, if any, can be mainly attributed to the
effect of the information channel. For those Newly-Disclosed firms that change their RPT
behavior, reduction in the implied cost of capital can be attributed to a joint effect of the
information channel and the governance channel.
Approximately 55% of Newly-Disclosed firms changed their RPT behaviors after the
SEC regulation. For firms that do not change their RPT behavior, Column 1 in Table 6 shows
that the implied cost of capital associated with RPTs does not change, suggesting that the
information channel is likely not the main channel through which RPT policy disclosure affects
the implied cost of capital. By contrast, Column 2 shows that for firms that change their RPT
behaviors, the implied cost of capital associated with RPTs drops significantly. Thus� the
analyses in Table 6 suggest that the governance channel is likely to be the main channel leading
to a lower cost of capital associated with RPTs after the regulation.
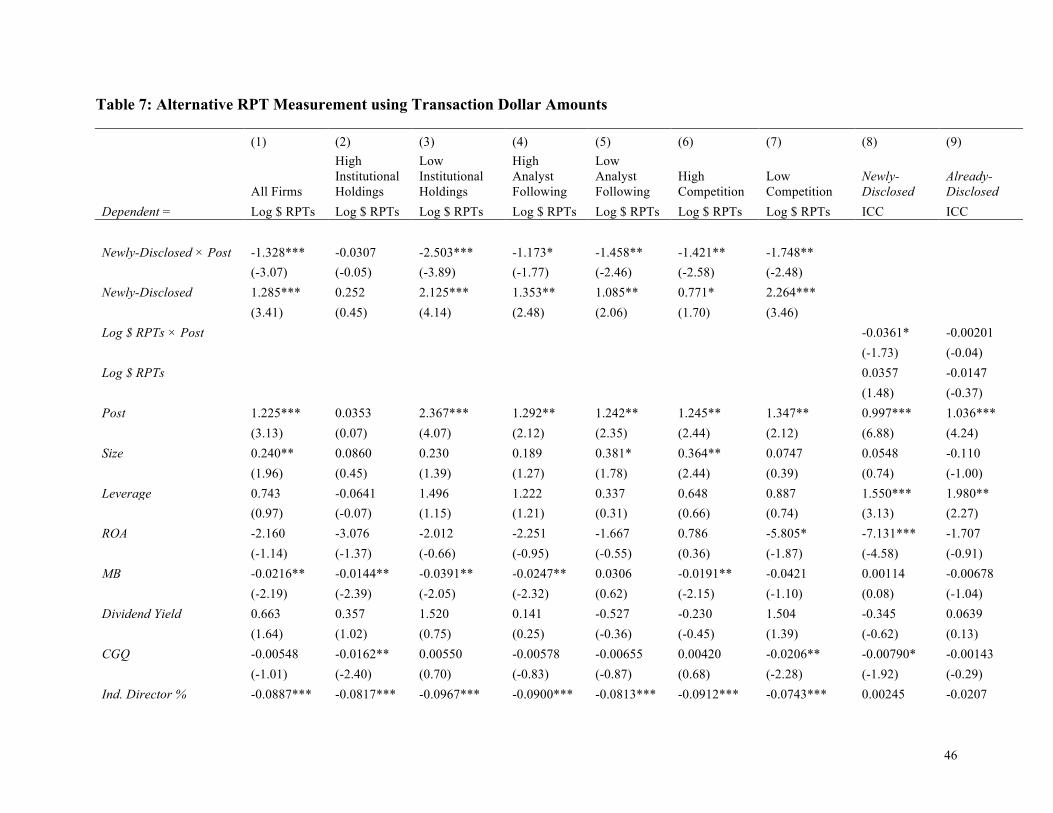
4. 3 Robustness Tests
4.3.1 Alternative measure of RPTs
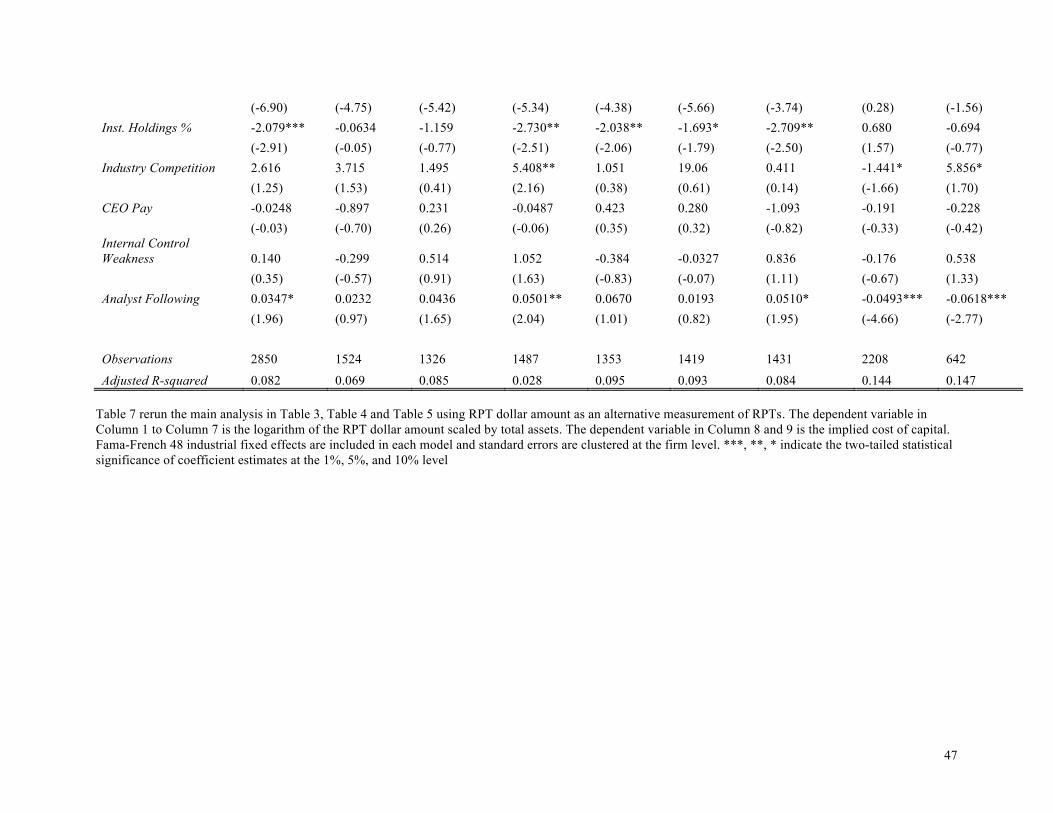
RPTs can alternatively be measured by transaction amount. In Table 7, I test my main
hypothesis using transaction amount. In Columns 1 to 7, the dependent variable is the logarithm
25
of the total transaction amount. The analyses show that the interaction of Newly-Disclosed and
Post is negative and significant, suggesting that this mandatory disclosure significantly reduces
Newly-Disclosed firms’ RPT transaction amount relative to Already-Disclosed firms. The results
of cross-sectional analyses are consistent with prior findings that the disclosure effects are more
pronounced when potential agency costs are high. In Columns 8 and 9, the dependent variable is
the implied cost of capital. Results indicate that Newly-Disclosed firms significantly reduce the
implied costs of capital associated with RPTs in the post-regulation period compared to Already-
Disclosed firms.
4.3.2 Regulation effects on Already-Disclosed firms
One potential concern of the difference-in-differences tests is that the 2006 regulation
could also affect the Already-Disclosed firms, disqualifying them as valid control firms. That is,
some Already-Disclosed firms may increase the disclosure level of their RPT governance
following the regulation. To mitigate this concern, I measure the disclosure level of RPT
governance based on information that firms provide in their RPT governance disclosure.
Specifically, for each RPT governance disclosure, I identify whether and how the company
discloses each of the following seven items: (1) a written RPT policy; (2) a specified RPT review
and approval committee; (3) involvement of General Counsel or legal department; (4) annual
questionnaire to Director and Officer; (5) types of transactions covered by such policy; (6)
transaction threshold submitting to approval authority; and (7) exemptions of any transactions.
Based on this information, I identify 52 Already-Disclosed firms that disclosed the same level of
RPT governance in the post period as in the pre-period, and use these 52 Already-Disclosed
firms as an alternative control sample. Table 8 reports the results. Column 1 is for the Already-
Disclosed firms that do not change their disclosure on RPT governance after the regulation.
26
Column 2 is for the Already-Disclosed firms that change their disclosure on RPT governance
following regulation. Column 3 is for the firms that initiate RPT governance disclosure following
regulation (i.e., Newly-Disclosed firms). Consistent with my main analyses in Table 3, the
coefficients on Post in Column1 and Column 2 are not significant, showing that the regulation
has little effects on RPT behavior of Already-Disclosed firms. In contrast, the coefficient in
Column 3 is negative and significant, indicating that the regulation a has a significant impact on
RPT behaviors of Newly-Disclosed firms. Additionally, the coefficients between Column 3 and
Column 1 are significantly different, suggesting that initiation of RPT governance disclosure
leads to significantly lower levels of RPTs.
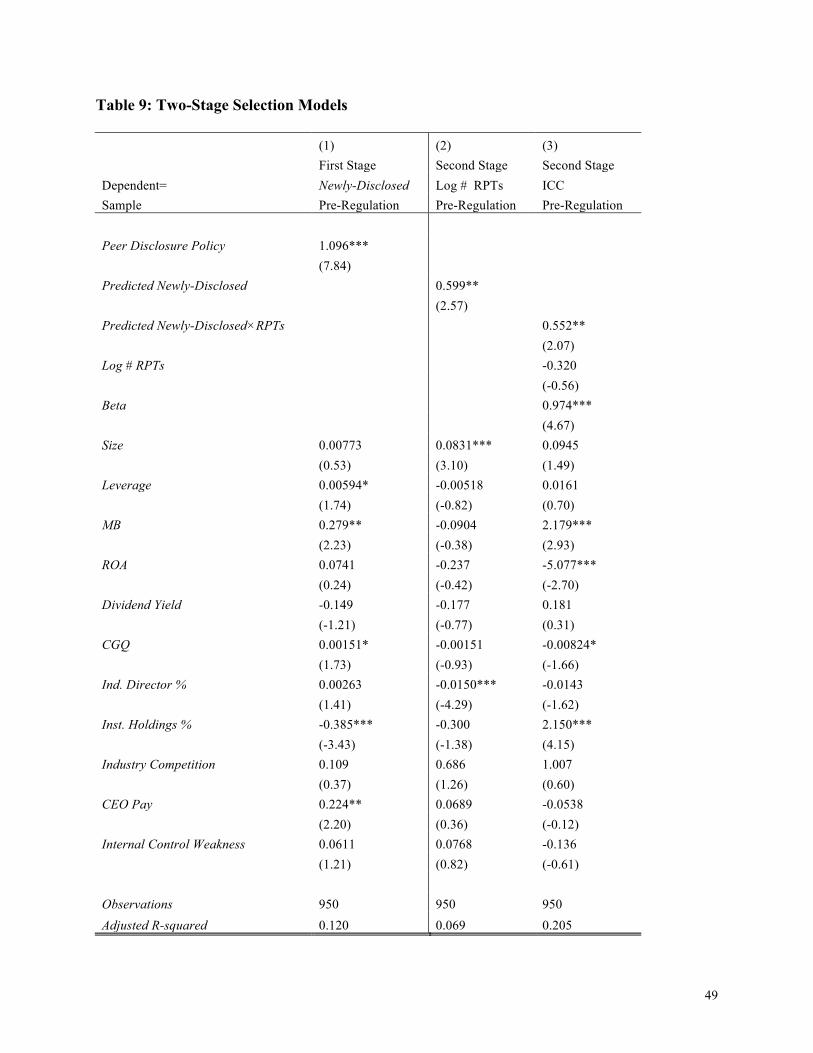
4.3.3 Two-stage selection model
In the pre-regulation period, the decision to disclose RPT governance could be
endogenous and driven by unobservable variables. As a result, the analysis in the Column 2
Table 3 could suffer from self-selection bias. To address this possibility, I use a two-stage
selection model (2SLS). The approach involves a two-stage estimation: the first stage predicts
the decision on whether to voluntarily disclose RPT governance, and the second stage explains
the disclosure of RPT governance and its economic consequences.
The validity of the selection model depends on the validity of exogenous independent
variables from the first-stage choice model that are excluded from the set of independent
variables in the second-stage regression. To effectively control a firm’s decision on whether or
not to disclose RPT governance, I identify its peers’ RPT governance disclosure decision as the
exclusion restriction.13 Specifically, I expect that whether a firm discloses its RPT governance is
partially affected by its peers’ decisions. If its peers have disclosed their RPT governance, the
13 Previous papers have also used as instruments the industry median/mean of the independent variable (Nevo 2000; Friedberg 2003; Hanlon, Rajgopal, and Shevlin 2003; Cheng, Ioannou and Serafeim 2014).
27
firm is more likely to disclose its RPT governance. The peer decisions, however, is not likely to
affect the firm’s occurrence of RPTs if the incurred RPTs are not with these peers.
To capture peer firms’ RPT governance disclosure decision, I use the industry average of
RPT governance disclosure, excluding the firm itself. Table 9 reports this 2SLS analysis before
2006. In Column 1, I regress a firm’s own RPT governance disclosure on its peers’ RPT
governance disclosure, controlling for other firm characteristics and industry fixed effects. The
analysis shows that the likelihood of a firm’s RPT governance disclosure is highly associated
with its peers’ decisions. In Columns 2 and 3, I regress the log number of RPTs and the implied
cost of capital using the predicted value of RPT governance disclosure from the selection model
(Column 1), respectively. I find a positive and significant coefficient on Newly-Disclosed firms,
suggesting an association between RPT governance disclosure and both the occurrence of RPTs
and the cost of capital associated with RPTs.
Overall, the 2SLS analysis suggests that firms voluntarily disclosing RPT governance in
the pre-regulation period report fewer RPTs and that these RPTs are associated with a lower
implied cost of capital, after controlling for self-selection bias.
28
4.3.4 News coverage effects on RPTs
Another factor that may influence the regulation effects is news coverage, as firms face
external monitoring from the media. It is possible that after the 2006 SEC regulation, the media
reports RPTs unevenly for Already-Disclosed firms and for Newly-Disclosed firms, leading to
different levels of monitoring for the two groups. To rule out this alternative explanation, I
search newspapers from 2003 to 2011 in LexisNexis and find 192 RPT news reports covering 82
firms in total�15 of which are S&P1500 composite firms. Excluding these 15 firms from my
sample, I find that no inferences are affected.
4.3.5 Measurement of CGQ on regulation effects
CGQ is a governance rating measurement developed by Institutional Shareholder
Services for public companies. Related-party transactions are one of the 61 rating factors.
Including CGQ as a control variable may affect the estimate of regulation effects on firms’ RPT
behavior. Therefore, I run my analyses excluding CGQ. Results still hold.
4.3.6 Effect of increased disclosure threshold of RPT
Besides the mandatory disclosure requirement of RPT policy and procedure, the SEC
2006 regulation also increases the reporting threshold of RPT from $60,000 to $120,000 to
reflect the inflation. Many firms, however, still report RPTs below the threshold. In 2007, for
example, approximately 18% of reported RPTs was below $120,000. To mitigate the concern
that a higher threshold leads to a drop of reported RPT, in untabulated analyses I exclude these
RPTs below $120,000 for the whole testing period (i.e. from 2004 to 2010) and redo the analyses.
Results sill hold.
29
4.4 Additional Analyses
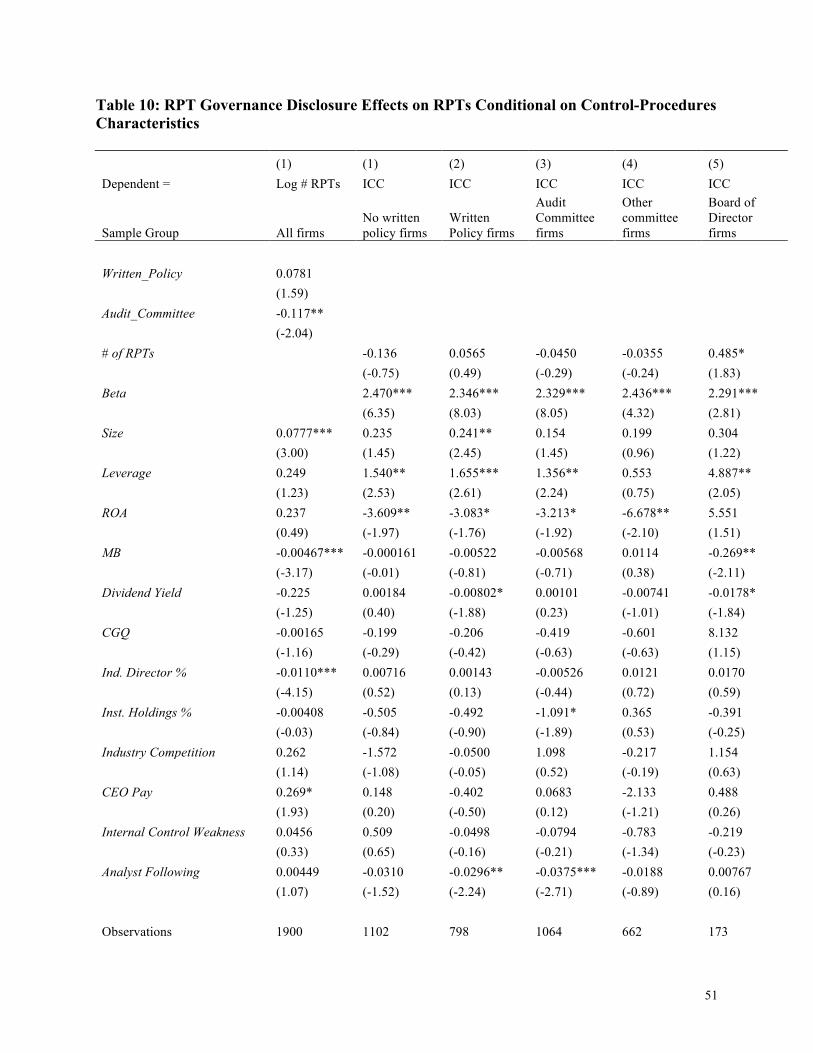
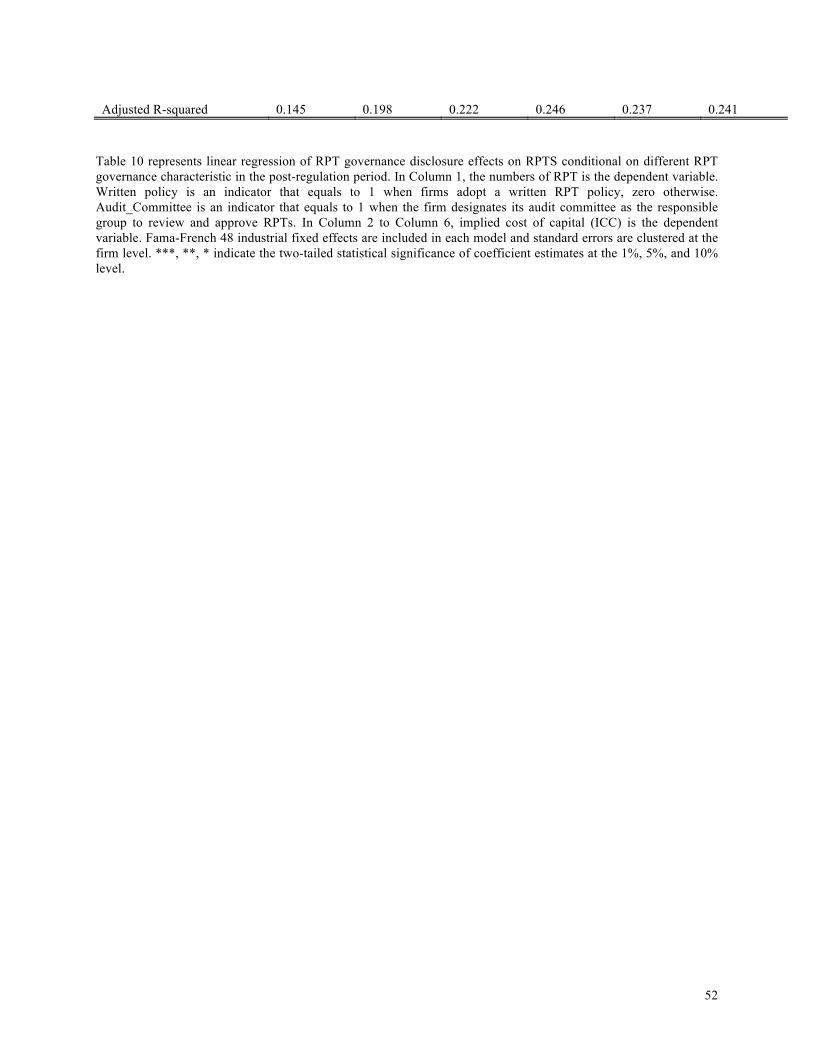
4.4.1 Policy characteristics and RPTs
RPT governance differs among companies along two main dimensions. The first is
whether firms adopt formal written RPT governance policies. In my sample, 42% of firms
explicitly state that they have adopted written policies. The second is who is responsible for the
review and approval of RPTs. In my sample, 56% of firms delegate the Audit Committee to
review and approve RPTs, 35% use other committees such as the Compensation, Governance, or
Risk Committees, and 9% simply say that the Board of Directors is responsible for reviewing
and approving RPTs.
Table 10 reports the breakdown analysis on the above two distinctive RPT governance
characteristics/dimensions. In Column 1, I regress the number of RPTs on whether the firm
adopts a formal written RPT policy and whether an audit committee is used to review and
approve RPTs. Related to the first distinction, I find that the presence of an RPT written policy
does not affect the occurrence of RPTs. A plausible explanation is that for firms without a
separate written RPT governance policy, they usually specify their RPT governance in the Code
of Conduct or in the Charter of responsible committees. Related to the second distinction,
however, I find that when the Audit Committee is responsible for the review and approval of
RPTs, firms report significantly fewer RPTs than firms in which other committees or the board
are responsible for RPT approval.
In Columns 2 to 6, I regress the implied cost of capital on these two distinctions,
respectively. Columns 2 and 3 indicate that the adoption of written RPT governance policies is
not associated with the implied cost of capital. Columns 4 to 6 show that the implied cost of
capital is higher for firms with no designated committee to review RPTs.
30
Taken together, the above findings provide certain evidence that firms benefit to have a
designated committee for RPT review and approval, but do not justify the implied cost of capital
benefit of having a separate written RPT governance policy.
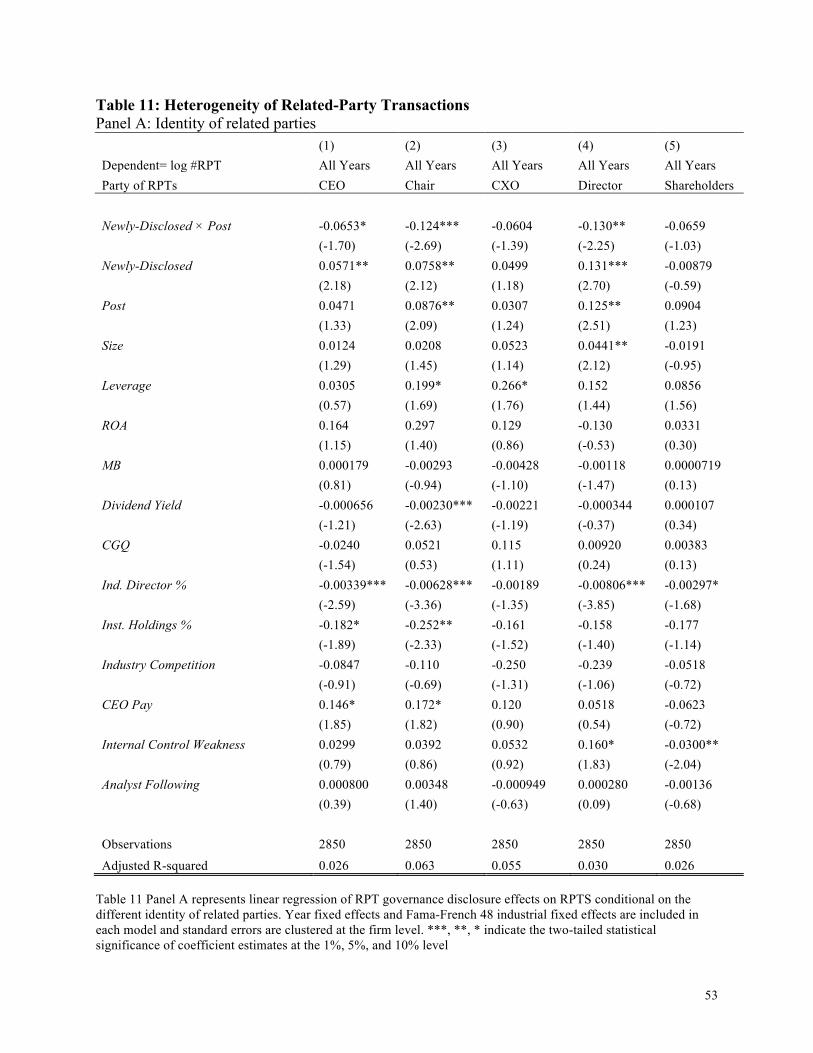
4.4.2 Heterogeneity in RPTs
RPTs differ in the identity of related parties and in the types of transactions. To better
understand whether the 2006 SEC regulation affects different types of transactions differently, I
decompose firms’ RPTs into five categories in terms of the identity of related parties, including
the CEO, other executives, the chairman of the Board, directors, and major shareholders. Panel A
of Table 11 shows that most firms reduce their RPTs in the post-regulation period for all
categories. However, the impact of RPT governance disclosure is more salient when related
parties are CEOs, Chairs of the Board, or Board directors than when related parties are other
executives or shareholders.
I also decompose RPTs based on the nature of transactions, by grouping transactions into
nine categories: buy, sell, lease, consulting, legal, hire, loan, pay, and others.14 I find in Panel B
of Table 11 that the RPT governance disclosure effects concentrate on sell, lease, and loan types
of RPTs.
The empirical evidence in Table 11 could suggest an important implication. In section
4.2.1, I posit that RPT governance disclosure has the potential to reduce harmful RPTs through
increased monitoring and control. In section 4.2.2, I find that the RPT governance disclosure
effects are more pronounced when potential agency costs are high, consistent with the perception
that the RPT governance disclosure regulation reduces these RPTs that are more likely to be used
as expropriation. Based on these arguments, the findings in Table 11 may suggest that RPTs with
CEO, Chairs, or directors are more likely to be harmful than RPTs with other executives or 14 Please refer to Appendix B for detailed RPT category definitions.
31
major shareholders. Similarly, RPTs involving sell, lease, or loans are more likely to be harmful
than RPTs involving other types of transactions.
5. Conclusion
Using the 2006 SEC’s related-party transaction governance disclosure regulation as a
quasi-experimental setting, I find that the disclosure of RPT governance has a significant impact
on the occurrence of RPTs, and that the implied cost of capital associated with RPTs is
negatively associated with the disclosure of RPT governance. Specifically, I find that both the
occurrence of RPTs and the implied costs of capital associated with RPTs decrease for these
firms that initiated RPT policy disclosure, suggesting that the initiation of RPT governance
disclosure by the 2006 SEC regulation significantly enhances the RPT governance. I also find
that the disclosure effects are contingent on external monitoring environment.
Some caveats exist. My study cannot distinguish the Newly-Disclosed firms that initiate
new RPT controls from the Newly-Disclosed firms that disclose existing controls. The mandatory
RPT governance disclosure potentially has different implications for these two types of Newly-
Disclosed firms. Another limitation is the potential confounding effect of the financial crisis
starting in 2007. The post-period in my sample, which includes 2007 and 2010, coincides with
the occurrence of the financial crisis. It is unclear whether the financial crisis has a different
influence on Newly-Disclosed firms and Already-Disclosed firms.
My paper provides empirical support for regulators’ guidance by documenting the
economic consequences of the 2006 SEC related-party transaction regulation and contributes to
the literature by showing disclosure on governance can enhance real governance. It also extends
the existing RPT literature by examining the relation between the RPT governance disclosure
32
and the implied cost of capital associated with RPTs, and by studying how this association varies
with different control procedures and different related parties.
33
References Baggs, J., and J.E. De Bettignies. 2007. “Product-market competition and agency costs.” Journal of
Industrial Economics 55 (2): 289–323. Balsam, Steven, Richard H. Gifford, and John Puthenpurackal. “Related Party Transactions, Corporate
Governance and CEO Compensation” Journal of Business Finance & Accounting 44, no. 5–6 (May 2017): 854–94.
Berkman, Henk, Rebel A. Cole, and Lawrence J. Fu. 2009. “Expropriation through Loan Guarantees to Related Parties: Evidence from China.” Journal of Banking & Finance 33 (1): 141–56.
Botosan, Christine A. 1997. “Disclosure Level and the Cost of Equity Capital.” The Accounting Review, 323–49.
Brick, Ivan E., Oded Palmon, and John K. Wald. 2006. “CEO Compensation, Director Compensation, and Firm Performance: Evidence of Cronyism?” Journal of Corporate Finance 12 (3): 403–23.
Chen, Jean Jinghan, Peng Cheng, and Xinrong Xiao. 2010. “Related Party Transactions as a Source of Earnings Management.” Applied Financial Economics 21 (3): 165–81.
Cheng, Beiting, Ioannis Ioannou, and George Serafeim. 2014. “Corporate Social Responsibility and Access to Finance.” Strategic Management Journal 35 (1): 1–23.
Cheung, Yan-Leung, Yuehua Qi, P. Raghavendra Rau, and Aris Stouraitis. 2009. “Buy High, Sell Low: How Listed Firms Price Asset Transfers in Related Party Transactions.” Journal of Banking & Finance 33 (5): 914–24.
Cheung, Yan-Leung, P. Raghavendra Rau, and Aris Stouraitis. 2006. “Tunneling, Propping, and Expropriation: Evidence from Connected Party Transactions in Hong Kong.” Journal of Financial Economics 82 (2): 343–86.
Cheynel, Edwige. 2013. “A Theory of Voluntary Disclosure and Cost of Capital.” Review of Accounting Studies 18 (4): 987–1020.
Claus, James, and Jacob Thomas. 2001. “Equity Premia as Low as Three Percent? Evidence from Analysts’ Earnings Forecasts for Domestic and International Stock Markets.” The Journal of Finance 56 (5): 1629–66.
Cullinan, Charles P., Hui Du, and Gail B. Wright. 2006. “A Test of the Loan Prohibition of the Sarbanes-Oxley Act: Are Firms That Grant Loans to Executives More Likely to Misstate Their Financial Results?” Journal of Accounting and Public Policy 25 (4): 485–97.
Denis, David J, and Atulya Sarin. 1999. “Ownership and Board Structures in Publicly Traded Corporations.” Journal of Financial Economics 52 (2): 187–223.
Easton, Peter D. 2004. “PE Ratios, PEG Ratios, and Estimating the Implied Expected Rate of Return on Equity Capital.” The Accounting Review 79 (1): 73–95.
Friedberg, L., 2003. The impact of technological change on older workers: evidence from data on computers. Industrial and Labor Relations Review, 56 (3): 511-529.
Gebhardt, William R., Charles M. C. Lee, and Bhaskaran Swaminathan. 2001. “Toward an Implied Cost of Capital.” Journal of Accounting Research 39 (1): 135–76.
Ghoul, Sadok El, Omrane Guedhami, Chuck C. Y. Kwok, and Dev R. Mishra. 2011. “Does Corporate Social Responsibility Affect the Cost of Capital?” Journal of Banking & Finance 35 (9): 2388–2406.
Giroud, X., and H. Mueller. 2011. “Corporate governance, product-market competition, and equity prices.” Journal of Finance 66 (2): 563–600.
Gode, Dan, and Partha Mohanram. 2003. “Inferring the Cost of Capital Using the Ohlson–Juettner Model.” Review of Accounting Studies 8 (4): 399–431.
Gordon, Elizabeth A., Elaine Henry, and Darius Palia. 2004. “Related party transaction and corporate governance.” In Corporate Governance, 9:1–27. Advances in Financial Economics 9. Emerald Group Publishing Limited.
Gordon, Elizabeth A., and Elaine Henry. 2005. “Related Party Transactions and Earnings Management.” SSRN Scholarly Paper ID 612234. Rochester, NY
34
Grossman, Sanford J. 1981. “The Informational Role of Warranties and Private Disclosure about Product Quality.” The Journal of Law & Economics 24 (3): 461–83.
Hail, Luzi, and Christian Leuz. 2006 "International differences in the cost of equity capital: Do legal institutions and securities regulation matter?" Journal of accounting research 44 (3) 485-531.
Hanlon, M., Rajgopal, S., and Shevlin, T., 2003. “Are executive stock options associated with future earnings?” Journal of Accounting and Economics, 36: 3-43.
Hou, Y., 2015. The role of diversification in the pricing of accruals quality. Review of Accounting Studies, 20(3), pp.1059-1092.
Huddart, Steven, 1993, “The Effect of a Large Shareholder on Corporate Value” Management Science 39 (No. 4, Aug.), 1407-1421.
Jagannathan, R., and S. B. Srinivasan. 1999. “Does product-market competition reduce agency costs?” North American Journal of Economics and Finance 10 (2): 387–400.
Jensen, M.C., and W.H. Meckling 1976. “Theory of the firm: Managerial Behavior, Agency costs, and Ownership Structure.” Journal of financial Economics 3, 305-360
Jian, Ming, and T. J. Wong. 2010. “Propping through Related Party Transactions.” Review of Accounting Studies 15 (1): 70–105.
Kahle, Kathleen M., and Kuldeep Shastri. 2004. “Executive Loans.” Journal of Financial and Quantitative Analysis 39 (04): 791–811.
Klein, April. 2002. “Audit Committee, Board of Director Characteristics, and Earnings Management.” Journal of Accounting and Economics 33 (3): 375–400.
Kohlbeck, Mark, and Brian W. Mayhew. 2010. “Valuation of Firms That Disclose Related Party Transactions.” Journal of Accounting and Public Policy 29 (2): 115–37.
Kohlbeck, Mark, and Brian W. Mayhew. “Are Related Party Transactions Red Flags?” Contemporary Accounting Research 34, no. 2 (June 1, 2017): 900–928.
La Porta, Rafael, Florencio Lopez-de-Silanes, Andrei Shleifer, and Robert Vishny. “Investor Protection and Corporate Governance.” Journal of Financial Economics, Special Issue on International Corporate Governance, 58, no. 1 (January 1, 2000): 3–27.
Lambert, Richard, Christian Leuz, and Robert E. Verrecchia. 2007. “Accounting Information, Disclosure, and the Cost of Capital.” Journal of Accounting Research 45 (2): 385–420.
Lang, Mark, Karl V. Lins, and Mark Maffett. 2012. “Transparency, Liquidity, and Valuation: International Evidence on When Transparency Matters Most.” Journal of Accounting Research 50 (3): 729–74.
Leuz, Christian, and Peter D. Wysocki. “The Economics of Disclosure and Financial Reporting Regulation: Evidence and Suggestions for Future Research.” Journal of Accounting Research 54, no. 2 (May 1, 2016): 525–622.
Lo, Agnes W. Y., Raymond M. K. Wong, and Michael Firth. 2010. “Can Corporate Governance Deter Management from Manipulating Earnings? Evidence from Related-Party Sales Transactions in China.” Journal of Corporate Finance 16 (2): 225–35.
Nekhili, Mehdi, and Moêz Cherif. 2011. “Related Parties Transactions and Firm’s Market Value: The French Case.” Review of Accounting and Finance 10 (3): 291–315.
Nevo, A., 2000. “Mergers with differentiated products: the case of the ready-to-eat cereal industry.” RAND Journal of Economics, 31 (3): 395-421.
Ohlson, J.A. and Juettner-Nauroth, B.E., 2005. “Expected EPS and EPS growth as determinants of value.” Review of accounting studies, 10(2-3), pp.349-365.
Pizzo, Michele. 2013. “Related Party Transactions under a Contingency Perspective.” Journal of Management & Governance 17 (2): 309–30.
Ryngaert, Michael, and Shawn Thomas. 2012. “Not All Related Party Transactions (RPTs) Are the Same: Ex Ante versus Ex Post RPTs.” Journal of Accounting Research 50 (3): 845–82.
Shleifer, A. and R. Vishny, 1986, “Large Shareholders and Corporate Control” Journal of Political Economy 94 (No. 3, June), 461-48.
35
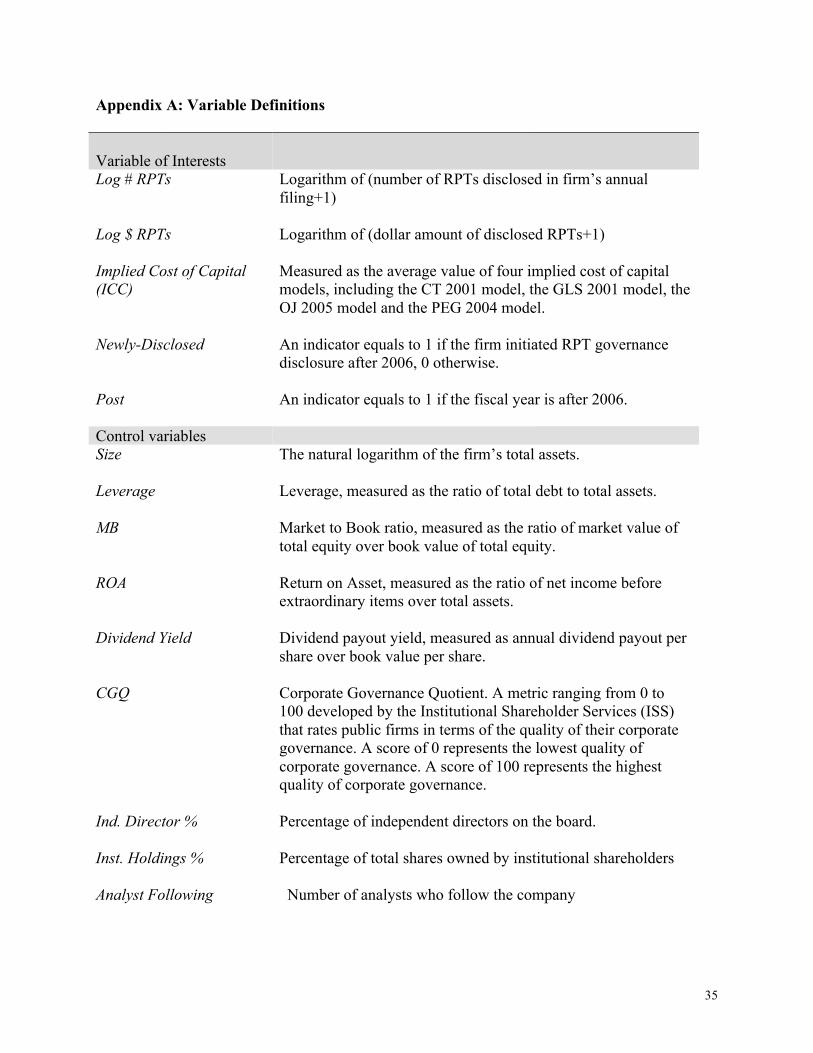
Appendix A: Variable Definitions Variable of Interests
Log # RPTs Logarithm of (number of RPTs disclosed in firm’s annual filing+1)
Log $ RPTs Logarithm of (dollar amount of disclosed RPTs+1)
Implied Cost of Capital (ICC)
Measured as the average value of four implied cost of capital models, including the CT 2001 model, the GLS 2001 model, the OJ 2005 model and the PEG 2004 model.
Newly-Disclosed An indicator equals to 1 if the firm initiated RPT governance disclosure after 2006, 0 otherwise.
Post An indicator equals to 1 if the fiscal year is after 2006. Control variables Size The natural logarithm of the firm’s total assets.
Leverage Leverage, measured as the ratio of total debt to total assets.
MB Market to Book ratio, measured as the ratio of market value of
total equity over book value of total equity.
ROA Return on Asset, measured as the ratio of net income before extraordinary items over total assets.
Dividend Yield Dividend payout yield, measured as annual dividend payout per share over book value per share.
CGQ Corporate Governance Quotient. A metric ranging from 0 to 100 developed by the Institutional Shareholder Services (ISS) that rates public firms in terms of the quality of their corporate governance. A score of 0 represents the lowest quality of corporate governance. A score of 100 represents the highest quality of corporate governance.
Ind. Director % Percentage of independent directors on the board.
Inst. Holdings % Percentage of total shares owned by institutional shareholders Analyst Following Number of analysts who follow the company
36
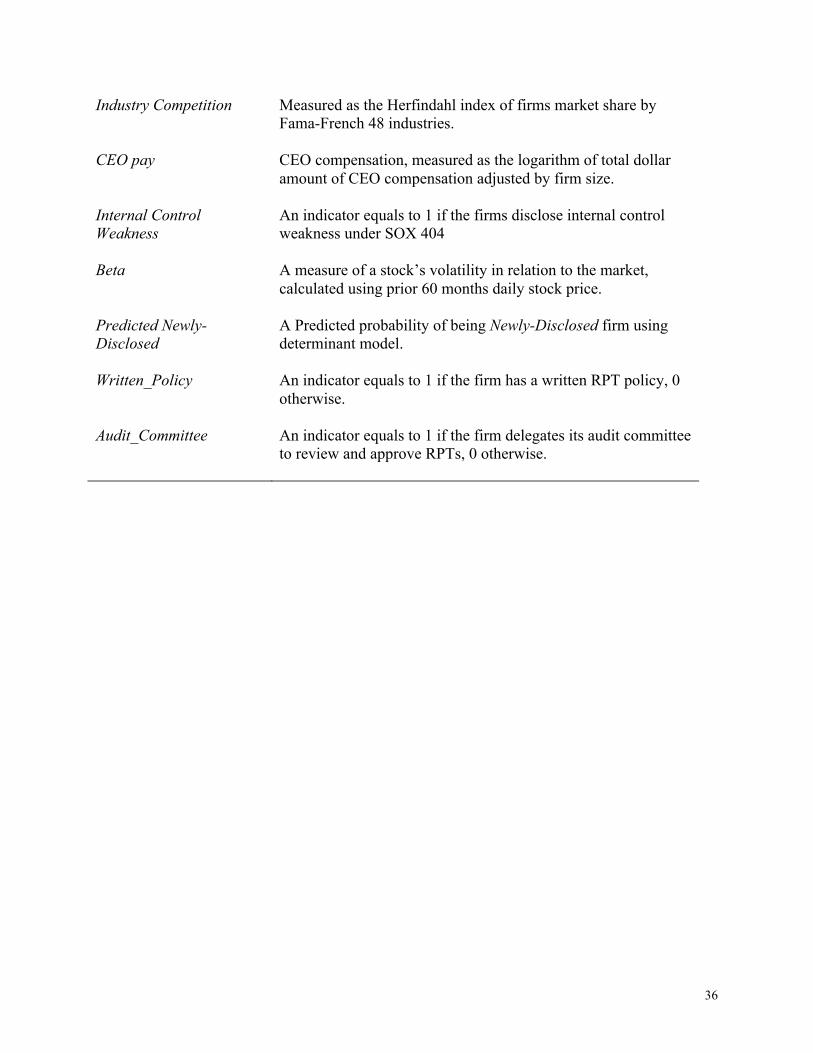
Industry Competition Measured as the Herfindahl index of firms market share by Fama-French 48 industries.
CEO pay CEO compensation, measured as the logarithm of total dollar amount of CEO compensation adjusted by firm size.
Internal Control Weakness
An indicator equals to 1 if the firms disclose internal control weakness under SOX 404
Beta A measure of a stock’s volatility in relation to the market,
calculated using prior 60 months daily stock price.
Predicted Newly-Disclosed
A Predicted probability of being Newly-Disclosed firm using determinant model.
Written_Policy An indicator equals to 1 if the firm has a written RPT policy, 0 otherwise.
Audit_Committee An indicator equals to 1 if the firm delegates its audit committee to review and approve RPTs, 0 otherwise.
37
Appendix B: Categories of Related-Party Transactions RPT categories in terms of transaction party CEO The related party is CEO or relatives of CEO
CXO The related party is a non-CEO executive or relatives of a non-CEO executive Chair The related party is the Chairman of Board of Director or relatives of the
Chairman Directors The related party is a director or relatives of a director Shareholders The related party is a block shareholder. Block shareholder is defined as
having > = 5% of shares RPT categories in terms of transaction nature Buy The firm buys products/service from the related party and make the payment
(i.e. cash transaction) or promises to make the payment (i.e. payable) during the year
Sell The firm sells products/service to the related party and receives cash payment or
A/R (Accounts Receivable) during the year Pay The RPT is to cover the related party (e.g. CEO)'s insurance, indemnification,
relocation, or pension costs. Lease The firm leases properties or a jet from the related party Consulting The related party provides consulting or investment service to the firm. Legal The related party provides legal service to the firm Hire The firm hires relatives of the related party, such as son-in-law of a director Loan The firm borrows or lends money to the related party M&A The RPT transaction involves M&A (mergers and acquisitions) or a creation of
joint venture Other Any other transactions which cannot be classified into above categories
38
Table 1: Descriptive Statistics Variables Mean sd p10 p50 p90
Table 1 displays descriptive statistics for the sample. For presentation purpose, # of RPTs is presented as numbers of RPTs and $ of RPTs is presented as transaction amount in thousand dollars.
Table 3 reports linear regression where logarithm of RPTs is the dependent variable with t-statistics reported in parentheses below each coefficient. Year fixed effects and Fama-French 48 industrial fixed effects are included in each model and standard errors are clustered at the firm level. ***,**,* indicate the two-tailed statistical significance of coefficient estimates at the 1%, 5%, and 10% level.
Industry Competition 0.963** -0.0240 1.175** 0.152 4.040 0.273
(2.02) (-0.04) (2.12) (0.36) (0.68) (0.48)
CEO Pay -0.0236 0.133 0.134 0.0902 0.173 -0.180
(-0.10) (0.94) (0.97) (0.41) (1.26) (-0.71)
Internal Control Weakness -0.0734 0.0509 0.143 -0.101 -0.0353 0.0604
(-0.80) (0.52) (1.21) (-1.32) (-0.44) (0.47)
Analyst Following 0.00529 0.00562 0.00655 0.0111 0.00346 0.00843*
(1.29) (1.22) (1.53) (1.02) (0.84) (1.79)
Observations 1524 1326 1487 1353 1419 1431
Adjusted R-squared 0.106 0.122 0.120 0.124 0.120 0.124 Table 4 reports disclosure of RPT governance effects on RPTs conditional on various external monitoring mechanism. Fama-French 48 industrial fixed effects are included in each model and standard errors are clustered at the firm level. ***, **, * indicate the two-tailed statistical significance of coefficient estimates at the 1%, 5%, and 10% level.
42
Table 5: ICC Associated with RPTs Conditional on Governance Disclosure Full Sample Matched Sample
(1) (2) (3) (4) (5) (6)
Dependent =ICC All Firms All Firms Newly-Disclosed
Already-Disclosed
Newly-Disclosed
Already-Disclosed
Log # RPTs×Post
-0.181 -0.280* 0.119 -0.619** -0.132
(-1.26) (-1.71) (0.39) (-2.34) (-0.54)
Post
1.270*** 1.324*** 1.113*** 1.234*** 1.024***
(10.04) (8.28) (4.01) (5.64) (3.51)
# of RPTs 0.0354 0.151 0.232* -0.0891 0.0946 -0.15
Table 5 presents linear regression where implied cost of capital is the dependent variable with t-statistics reported in parentheses below each coefficient. ICC is the average implied cost of capital of four models including CT 2001 model, GLS 2001 model, OJ 2005 model, and PEG model. Fama-French 48 industrial fixed effects are included in each model and standard errors are clustered at the firm level. ***, **, * indicate the two-tailed statistical significance of coefficient estimates at the 1%, 5%, and 10% level.
44
Table 6: Information Channel vs. Governance Channel
Table 6 presents the analyses on information channel and governance channel. The sample period includes FY 2004 and FY 2007. Column 1 is for Newly-Disclosed firms that do not change their RPT behavior during this period. Column 2 is for Newly-Disclosed firm that change their RPT behavior during this period. Fama-French 48 industrial fixed effects are included in each model and standard errors are clustered at the firm level. ***, **, * indicate the two-tailed statistical significance of coefficient estimates at the 1%, 5%, and 10% level.
46
Table 7: Alternative RPT Measurement using Transaction Dollar Amounts (1) (2) (3) (4) (5) (6) (7) (8) (9)
Adjusted R-squared 0.082 0.069 0.085 0.028 0.095 0.093 0.084 0.144 0.147 Table 7 rerun the main analysis in Table 3, Table 4 and Table 5 using RPT dollar amount as an alternative measurement of RPTs. The dependent variable in Column 1 to Column 7 is the logarithm of the RPT dollar amount scaled by total assets. The dependent variable in Column 8 and 9 is the implied cost of capital. Fama-French 48 industrial fixed effects are included in each model and standard errors are clustered at the firm level. ***, **, * indicate the two-tailed statistical significance of coefficient estimates at the 1%, 5%, and 10% level
48
Table 8: Alternative Measurement of RPT Governance Disclosure (1) (2) (3)
Table 8 shows the analyses controlling for disclosure change in Already-Disclosed firms. The dependent variable is the number of RPTs. Column 1 is for the firms that do not change their existing RPT governance disclosure following regulation. Column 2 is for the firms that change their RPT governance disclosure following regulation. Column 3 is for the firms that initiate RPT governance disclosure following regulation. Industrial fixed effects are controlled for each model. Error are clustered at the firm level. ***, **, * indicate the two-tailed statistical significance of coefficient estimates at the 1%, 5%, and 10% level
Table 9 reports the two-stage regression model results in the pre-regulation period. In the first stage, "Newly-Disclosed" is the dependent variable that equals to 1 when the firm did not disclose RPT governance in the pre-regulation period, zero otherwise. Peers Disclosure Policy is the instrument variable that is the industry average of RPT governance disclosure excluding the firm itself. In the second stage, the numbers of RPT and ICC are dependent variables in Column 2 and Column 3, respectively. Industrial fixed effects are included in each model and standard errors are clustered at the firm level. ***, **, * indicate the two-tailed statistical significance of coefficient estimates at the 1%, 5%, and 10% level.
Industry Competition 0.262 -1.572 -0.0500 1.098 -0.217 1.154
(1.14) (-1.08) (-0.05) (0.52) (-0.19) (0.63)
CEO Pay 0.269* 0.148 -0.402 0.0683 -2.133 0.488
(1.93) (0.20) (-0.50) (0.12) (-1.21) (0.26)
Internal Control Weakness 0.0456 0.509 -0.0498 -0.0794 -0.783 -0.219
(0.33) (0.65) (-0.16) (-0.21) (-1.34) (-0.23)
Analyst Following 0.00449 -0.0310 -0.0296** -0.0375*** -0.0188 0.00767
(1.07) (-1.52) (-2.24) (-2.71) (-0.89) (0.16)
Observations 1900 1102 798 1064 662 173
52
Adjusted R-squared 0.145 0.198 0.222 0.246 0.237 0.241 Table 10 represents linear regression of RPT governance disclosure effects on RPTS conditional on different RPT governance characteristic in the post-regulation period. In Column 1, the numbers of RPT is the dependent variable. Written policy is an indicator that equals to 1 when firms adopt a written RPT policy, zero otherwise. Audit_Committee is an indicator that equals to 1 when the firm designates its audit committee as the responsible group to review and approve RPTs. In Column 2 to Column 6, implied cost of capital (ICC) is the dependent variable. Fama-French 48 industrial fixed effects are included in each model and standard errors are clustered at the firm level. ***, **, * indicate the two-tailed statistical significance of coefficient estimates at the 1%, 5%, and 10% level.
53
Table 11: Heterogeneity of Related-Party Transactions Panel A: Identity of related parties (1) (2) (3) (4) (5) Dependent= log #RPT All Years All Years All Years All Years All Years Party of RPTs CEO Chair CXO Director Shareholders
Newly-Disclosed × Post -0.0653* -0.124*** -0.0604 -0.130** -0.0659
Table 11 Panel A represents linear regression of RPT governance disclosure effects on RPTS conditional on the different identity of related parties. Year fixed effects and Fama-French 48 industrial fixed effects are included in each model and standard errors are clustered at the firm level. ***, **, * indicate the two-tailed statistical significance of coefficient estimates at the 1%, 5%, and 10% level
54
Panel B: Transaction type of related-party transactions (1) (2) (3) (4) (5) (6) (7) (8) (9) Dependent=log #RPT All Years All Years All Years All Years All Years All Years All Years All Years All Years
Type of RPTs Buy Sell Lease Consulting Legal Hire Loan M&A Other
Table 11 Panel B represents linear regression of RPT governance disclosure effects on RPTs conditional on different types of related party transactions. Fama-French 48 industrial fixed effects are included in each model and standard errors are clustered at the firm level. ***, **, * indicate the two-tailed statistical significance of coefficient estimates at the 1%, 5%, and 10% level.
56
Chapter 2:
Director Compensation and Related Party Transactions
1. Introduction
In this paper, I examine the effect of independent directors’ compensation on the
occurrence of related party transactions. Related party transaction (hereafter RPT) is a
transfer of resources, services, or obligations between a reporting entity and a related
party (IFRS 24). It can be potentially used by insiders to expropriate wealth from other
investors via self-dealing. To comply with listing requirements from the SEC and stock
exchanges, the U.S. public firms generally designate a specific committee or the Board of
Director to review and approve RPTs. One important way to motivate directors to fulfill
their board responsibility is through appropriate director compensation design (Sengupta
and Zhang 2015) Consequently, I expect there exists a link between directors’
compensation and occurrence of RPT, an association that has not yet examined by
existing studies.
Whether director compensation affects the occurrence of RPTs is an empirical
question. On the one hand, private benefit theory predicts that higher compensation level
is associated with more RPTs, because over-compensation may impair the independence
of directors, making them more subject to managers’ influences. In this case, over-
compensated directors may assert less prudential behaviors when reviewing RPTs. On the
other hand, effective monitoring theory suggests that higher compensation level can
attract more capable directors, providing more effective monitoring and thus leading to
fewer RPTs.
57
In this study I focus on two dimensions of compensation: (i)Director
Compensation Level (DCL), and (ii) the Director Compensation Structure (DCS).
Directors are usually compensated by a combination of cash, stocks and options. DCL
measures how much directors are compensated annually in total; DCS measures the
proportion of equity-based compensation to total compensation. To measure the
occurrence of RPTs, I use the numbers of RPTs in the main analyses, and the dollar
amount of RPTs in my robustness test.
RPT information is hand-collected from annual proxy statements from 2007 to
2010. I collect director compensation data from Execucomp and directors’ personal
characteristics information from Capital IQ. After matching with financial information
from Compustat, my final sample includes 12,183 director-year observations. Consistent
with private benefit theory, I find that DCL is positively associated with the occurrence
of RPTs, suggesting that when directors’ pay levels are high, they are more likely to be
influenced by managers and hence less independent, leading to more RPTs. I also find
that higher portion of equity based compensation is associated with fewer RPTs,
suggesting that equity-based compensation aligns directors’ interests with stockholder
interests. Results hold for both RPT measurements, after controlling for firms
characteristics and other variables.
The above findings provide preliminary evidence supporting the private benefit
theory. Nevertheless, director compensation should be high enough to attract qualified
candidates and provide sufficient incentives for directors to fulfill their board
responsibility. As a result, there should exist an optimal level or mix of compensation.
Accordingly, I decompose director’s compensation into market level compensation
58
component and excessive compensation component. I find that it is the excessive
compensation that is associated with higher occurrence of RPTs, consistent with the
private benefit hypothesis.
When independent directors are responsible for the approval of RPTs, director
compensation could affect directors’ incentive to provide appropriate judgments in
dealing with RPTs. Consequently, I expect that these associations between directors’
compensation and RPTs should be more pronounced for directors who have the authority
to approve RPTs than for directors who do not have the authority. Consistent with my
expectation, I find that when firms designate audit committee to approve RPTs,
compensations of audit committee members have a bigger impact on the occurrence of
RPTs than those of non-audit committee members.
A growing body of research (Cordeiro et al. 2007, Agrawal and Knoeber 1996)
document that different endogenously determined governance and incentive mechanisms
substitute for each other in reducing the primary agency costs that arise when managers
and shareholders’ interests diverge. I then examine how agency costs between directors
and stockholders vary depending on the firm’s external monitoring environment. Using
analyst following, institutional shareholding and debt leverage as proxies for external
monitoring from analysts, institutional investors and lenders, respectively, I find that the
association between directors’ equity-based compensation and RPTs concentrates on
firms with weak external governance, consistent with agency theory.
The prior analysis is based on individual director observation. As a robustness
check, I also conduct analysis using firm-level observations. The firm-level director
59
compensation is measured using the average compensation of all independent directors.
Main results continue to hold.
My study contributes to two streams of literature. First, it contributes to the
literature that examines the consequences of director compensation. Prior studies find that
director compensation is associated with firm value, R&D, institutional following, and
financial disclosure quality (e.g., Perry 1999; Vafeas 1999; Bryan et al. 2000; Yermack
2004; Ryan and Wiggins 2004; Fich and Shivdasani 2005; Engel, Hayes, and Wang 2010
Archambeault, DeZoort, and Hermanson 2008). My study contributes to this literature by
showing that director compensation has associated with the occurrence of related party
transactions.
Second, my paper contributes to the literature exploring the determinants of
related party transactions. Berkman, Cole, and Fu (2009) find that firm characteristics
such as size, ROA, and growth opportunities affect the propensity of RPTs. Nekhili and
Cherif (2011) find that size of board and presence of independent directors affect the
occurrence of different types of RPTs. In my paper, I focus on the incentive of directors
who are directly responsible for approving RPTs. By documenting a consistent link
between director’s compensation and the occurrence of RPTs, my results suggest that
director’s pay could have an significant impacts on RPTs.
My paper differs with Balsam, Gifford and Puthenpurackal (2017) in several ways.
First, my paper focus on the directors’ compensation while their paper focus on CEO’s
compensation. Recognizing their findings, I also control for CEO compensation in my
research design. Second, my sample includes a much broader scope of companies.
Specifically, my sample consists of S&P 1500 composite firms while Balsam et al. (2017)
60
randomly select 500 firms. And my paper studies the compensation at both director’s
individual level and firm level.
The rest of the paper is organized as follows. Section 2 provides a literature
review and develops the hypotheses. Section 3 describes the research design. Section 4
reports the empirical results. Section 5 concludes the paper.
2. Literature Review and Hypothesis Development
Compared to executive compensation, director compensation has received
relatively little academic attention. The core principle of good governance in director
compensation is simple: corporate directors should be paid in a fair and reasonable way,
with a mix of cash and equity (as appropriate), to a level that attracts high-quality
candidates to serve the board, but not in such forms or amounts as to impair director
independence or raise questions of self-dealing.
A couple of studies provide evidence that may imply self-dealing. For example,
Brick et al. (2006) show that excessive director compensation is associated with
underperformance. Ye (2014) find that high cash compensation to directors is associated
with high level of earnings management in China. Similarly, high-level compensation
may impair director independence, making them yield under management pressure and
approve harmful RPTs with managers. If RPTs are with directors, overcompensated
directors seeking private benefits are more likely to use RPTs to enrich themselves
instead of maximizing shareholders value, also leading to more RPTs. As a result, higher
61
compensation is associated with higher incidences of RPTs if RPTs are considered as
self-dealing activities.
The above implies the private benefit hypothesis of director compensation. An
argument can also be made for the efficient monitoring hypothesis of director
compensation. For example, when directors are less compensated, firms may use
director-related RPTs to provide additional compensation to directors. In this case, lower
director compensation could lead to more RPTs. As another example, better-performed
firms can provide high compensation to directors. High compensation enables firms to
attract high-quality directors to assert monitoring responsibilities. In such cases, high
director compensation could be associated with lower incidences of RPTs. Both examples
suggest an inverse association between director compensation and the occurrence of
RPTs.
Given the conflicting arguments presented above, the ultimate association
between the director compensation and the occurrence of RPTs remains an empirical
question. Therefore, I present my first hypothesis in a null form as follows:
H1: There is no relation between the independent directors’ compensation level
and the occurrence of related party transactions.
Directors are mainly compensated using a combination of cash, stock, and stock
options. When directors have more equity-based compensation, they could act more like
shareholders, enhancing their monitoring incentives. Jensen (1993) argues that outside
directors who receive direct stock or stock options can better appreciate how their
62
decisions affect the wealth of shareholders. Hermalin and Weisbach (1998) show that the
intensity with which directors will monitor the CEO of a firm is positively associated
with the benefits accruing to them from the company’s profits. Since greater equity-based
compensation ties the directors’ benefits to the performance of the firm, their model
suggests that directors who receive a larger fraction of compensation in the form of
equity will be more diligent in their monitoring duties. Following this line of reasoning,
the National Association of Corporate Directors, and shareholder activist groups such as
CALPERS have encouraged firms to pay directors more in the form of equity (Blue
Ribbon Report 1995). Recent studies find that director equity compensation is associated
with various positive firm characteristics and outcomes, including more independent
directors, more investment opportunities, higher PB ratios or higher profitability
(Yermack 2004, Perry 1999, Fich and Shivdasani 2005, Linn and Park 2005), lower
implied cost of capital (Sengupta and Zhang 2015), and high performance ( Feng 2007,
Cordeiro et al, 2007). When firms adopt the stock option plan to directors, management
issue better earnings guidance (Sengupta and Zhang 2015), the market reacts positively
(Fich and Shivdasani 2005), and analysts revise their forecast favorably (Fich and
Shivdasani 2005). Taken together, the increased monitoring incentive hypothesis
suggests that greater equity-based compensation can provide outside directors stronger
incentives to monitor the firm, and hence improve firms’ governance and performance by
aligning directors’ interests with those of shareholders.
If the equity-based compensation enhances directors’ monitoring incentives (i.e.
the efficient hypothesis), one could expect that high equity-based compensation is
associated with lower incidences of RPTs. On the other hand, some prior studies
63
provided evidence on the private benefit hypothesis of directors’ equity compensation.
The directors’ compensation is associated with high accruals (Boumosleh 2009) and a
high likelihood of restatements (Archambeault et al. 2008). It is also related to lower
dividend distribution (Boumosleh and Cline 2013, Sharma 2011). Therefore, how equity-
based compensation affects RPTs is still an empirical question. Accordingly, I propose
my second hypothesis stated in the null form as follows:
H2: There is no relation between the independent directors’ equity-based
compensation mix and the occurrence of related party transactions.
3. Sample Selection and Research Design
3.1 Sample Collection
RPT data is hand-collected from annual proxy statements from 2007 to 2010.
Director compensation data is extracted from Execucomp, and directors’ personal
characteristic data is obtained from Capital IQ. After matching with financial
information from Compustat, the final sample includes 12,183 director-year observations.
3.2 Research Design
The base model regresses the occurrence of RPTs on director compensation,
RPT is measured in two ways. I use the total number of reported RPT in the main
analysis, and the log form of transaction dollar amount scaled by total assets in any given
year in the robustness test; Director pay Level is measured using the log form of total
director’s compensation; Director Pay Structure is the ratio of equity-based
compensation over total compensation. I don’t have an expectation on the direction of β1
as director’s compensation level can have either a positive or a negative impact on RPT
governance. I expect β2 < 0, suggesting that the higher equity-based compensation aligns
directors’ interests more with shareholders’ interests.
Following prior literature (Farrell et al. 2008), I control for firm size using log of
revenue. Bryan et al. (2000), Ryan and Wiggins (2004) and Brick et al. (2006) identify
firm size as an important determinant of director compensation, because larger, more
complex firms are more difficult to monitor. Thus, larger firms are more likely to pay
high levels of compensation and more equity-based compensation.
Linn and Park (2005) find that the structure of director compensation depends on
the growth opportunities of the firm. Directors of firms with greater growth opportunities
receive greater levels of total director compensation and derive a significantly greater
proportion of equity-based compensation than low growth firms. As a result, I control for
growth opportunities. Following prior studies (Ryan and Wiggins 2004, Bryan et al. 2000,
and Linck et al. 2006), I control for growth opportunities using the PB ratio, which is
measured as the market value of equity divided by book value of the equity.
I also control for other firm characteristics such as firm performance, leverage,
corporate governance, and firms’ cash flow volatility. ROA is used as a proxy for firm
65
performance and is defined as net income to total assets (Becher et al., 2005). Leverage is
defined as total debt to total assets, as a proxy for agency costs of debt (Bryan et al. 2000
and Brick et al. 2006). As prior research shows that overall corporate governance affects
the occurrence of RPTs, I also control for general governance, including the percentage
of independent director on the Board (Ind. Director %), and the Corporate Governance
Quotient (CGQ) index, a rating developed by Institutional Shareholder Services (ISS)
that rates publicly traded companies in terms of the quality of their corporate governance.
A higher CGQ implies stronger corporate governance. To control for external monitoring
factors affecting opportunistic behaviors, I include institutional ownership (Inst.
Holdings %), measured as percentage of shares owned by institutional investors, industry
competition (Industry Competition), measured as the Herfindahl-Hirschman Index of
industry market share, and analyst following (Analyst following), measured as the number
of analysts following the firm. I also control for CEO compensation (CEO PAY),
measured as the natural logarithm of total CEO annual compensation scaled by firm size.
Finally, I also control for industry and year fixed effects. All errors are clustered at
directors’ level.
There exists a market level of compensation to attract qualified candidates. It is
possible that when directors are paid at market level, their responsibility matches their
compensation. When directors’ compensation deviates from market level, the deviation
intensifies agency problems between directors and shareholders. To better investigate
how compensation affects the occurrence of RPTs, I use a two-stage model to decompose
director compensation into market level compensation and excessive compensation. The
first stage is to find a firm’s market level of director compensation. To do so, I specify an
66
empirical determinant model that predicts the director’s compensation based on a number
of firm characteristics that have been shown to affect director compensation. The error
term in the model represents the excessive compensation from the predicted market level
of director compensation.
Director pay = Β1Director age+ β2 Size + β3Leverage + β4PB + β5ROA + β6CGQ + β7Ind.Director %+ β8 Inst. Holdings % + β9 Analyst Following+β10 Industry Competition + β11CEOPay+Industry FE + Year FE + ε
(2)
I expect directors’ age is an important determinant for directors’ compensation.
From the pay level perspective, more experienced directors are more likely to receive a
higher level of compensation. From the pay structure perspective, as directors become
aged, they become more conservative and more likely to prefer cash-based compensation
over equity-based compensation.
In the second stage, I regress RPT on Predicted Pay ( Level or Structure) and
Excessive Pay ( Level or Structure), controlling for all other factors, as follows:
RPT = β1Predicted Director Pay + β2Excessive Director Pay + β3 Size + β4Leverage + β5PB + β6ROA + β7CGQ + β8Ind.Director %+ β9 Inst. Holdings % + β10 Analyst Following+β11 Industry Competition + β12CEOPay+Industry FE + Year FE + ε
(3)
4 Empirical Results
4.1 Descriptive Statistics
67
Table 1 provides descriptive statistics. On average each director-year observation
reports 1.38 related-party transactions.15 The average director pay is about $0.2 MM and
average pay includes 56% equity based compensation. The mean of the governance score
(CGQ) is 75 compared to an industry average score of 50, reflecting that my sample firms
are better governed than their industry peers. The percentage of independent directors is
82% and the percentage of average institutional holdings is 82%, showing that both
internal and external monitoring in my sample firms are relatively strong.
Table 2 reports the Pearson correlations and shows that Director’s pay level is
positively correlated with numbers of RPTs and transaction amount of RPTs. Firms that
are larger, more profitable, having lower leverage and high growth potential tend to pay
directors with more equity based compensation. In addition, I do not find high
correlations between the explanatory variables, suggesting multicollinearity is not a
serious concern in my analyses.
4.2 Main Analysis
Table 3 reports the regression results of director compensation on the occurrence
of RPTs from the model (1). Standard errors are clustered at director level, with year and
industry fixed effects included. In Column 1, I regress the numbers of RPT on the total
director compensation level. In Column 2, I regress the numbers of RPT on the Director
Pay Structure, which is measured as the ratio of equity-based compensation over total
compensation. In Column 3, I regress RPTs on two dimensions of compensation at the
same time. The table shows that the coefficients of Director Pay level and Director Pay
Structure are statistically significant in all three regressions. The marginal effect of
15 This director-year observation is different than the firm-year observation. The sample averages skew toward large firms as large firms tend to have more directors on their boards.
68
Director Pay level is 0.16, suggesting that when director’s total compensation increases
$0.16MM, the numbers of RPT increase by one more transaction on average, which is
almost a 75% increase. The marginal effect of Director Pay Mix is -0.23, suggesting that
if the equity-based compensation ratio increases 23%, the total RPT amount will decrease
by one unit.
In Table 4, I decompose director compensation into market level compensation
and excessive compensation. In Column 1, the coefficient on Director Age is positive and
significant, suggesting that firms generally pay more to more experienced directors. In
Column 2, the coefficient on Director Age is negative and significant, suggesting that
with the increase of age, directors are more conservative and prefer more to cash
compensation than to equity compensation. Coefficients on other factors show that large,
profitable and better-governed firms are more likely to pay directors higher compensation
and to use more equity-based compensation than other firms.
In Table 5, I investigate the different effects of market level compensation and
excessive compensation. In Column 1, the coefficient on Predicted Directors’ Pay Level
is not significant, but the coefficient on Excessive Director Pay Level is positively
significant, suggesting that excessive director compensation is associated with the
occurrence of RPT, but market level compensation isn’t. Column 2 shows that the
Predicted Director’s Pay Structure is not significant but the Excessive Director Pay
Structure is negatively significant, suggesting that excessive equity-based ratio
significantly reduce the amount of RPTs. In Column 3, I put excessive pay level and
excessive pay structure in the same regression and results still hold.
69
Overall, the analyses above show that both director’s compensation level and
structure are associated with the occurrence of RPTs. Consistent with Private benefit
hypothesis, directors with higher compensation level and lower equity-based ratio are
more likely to approve more RPTs.
4.3 Additional Analysis and Robustness Tests
4.3.1. Audit committee members vs. Non Audit Committee members
For better identification, I then investigate this association in a sub-sample where
firms use Audit Committee as approving authority of RPTs. This test is important
because one fundamental argument regarding the compensation link is that directors have
the ability to affect the occurrence of RPT. In firms who delegate Audit Committee as
RPT reviewing authority, the Audit Committee members should have a stronger impact
on RPT approval than non-Audit Committee members. Depending on whether the
director is serving on Audit Committee, in Table 6, I regress RPT on directors’ excessive
pay conditional on their Audit Committee membership. In Column 1, I focus on the
group where RPT is approved by the Audit Committee and director is a member of the
Audit Committee. I find that coefficients on pay size of director compensation is
significant, suggesting when the Audit Committee is the authority to approve RPTs, and
the director serves on the Audit Committee, director compensation have a stronger effect
on firm's RPT behavior. Column 2 focuses on the group where RPT is approved by the
Audit Committee while the director is not a member of the Audit Committee. The
coefficients of excessive pay size is no longer significant, suggesting that the association
70
between non-audit committee director compensation and the RPT activities is weak when
directors don’t have official authority to approve RPTs.
4.3.2. External monitoring as a moderator
Having found that directors’ compensation affects RPT activities, I then
investigate how this association may vary in external monitoring. In Table 7, I test the
moderating effect using three settings, institutional holdings, analyst following and debt
leverage to proxy for monitoring from institutional shareholders, analysts and creditors.
The results show that pay level effect is more pronounced for firms with higher
institutional holding, which is a proxy for stronger external monitoring, but with lower
analyst following and less leverage which are proxies for weak external monitoring,
suggesting external monitoring is not an effective moderator for pay level effect. Results
show that the excessive pay structure effect concentrates on firms with lower institutional
holding, lower leverage, or fewer analyst following, suggesting external monitoring is an
effective moderator for pay structure effect.
4.3.3. Firm level analysis
The main analysis tests the director compensation effect at director level. As an
additional test, the director compensation effect at the firm level is also examined. For
each firm, I calculate the average of excess pay level and the average of excess pay mix
for all independent directors and regress RPT on the average pay excess on the firm level.
The results in Table 8 show that the association between director compensation and the
occurrence of RPTs still hold at the firm level.
4.3.4. Alternative RPT measurement
71
In the main analysis, I use number of RPT as the measurement of RPTs. In Table
9, I redo all major analysis using the log form of transaction dollar amount as the
measurement of RPTs. Results still hold.
5. Conclusion
In most U.S. firms, independent directors are directly responsible for the review
and approval RPTs. Their incentives to effectively monitor firms’ RPT behavior are
subject to their compensation packages. Private benefit theory predicts that director
compensation is positively associated with the occurrence of RPT, given that directors
become less independent when they are over compensated. Effective monitoring theory
predicts that director compensation is negatively associated with the occurrence of RPT,
given that directors become more motivated when they receive higher compensation.
Using S&P 1500 non-financial firms annual data from 2007 to 2010, I find that higher
director compensation level is associated with high occurrence of RPTs, consistent with
Private Benefit Theory. I also find that the director compensation structure, i.e. how much
compensation is equity based, plays a significant role to motivate directors to monitor
RPT activities, consistent with Effective Monitoring Theory. I find that high equity-based
compensation is associated with lower occurrence of RPTs, suggesting that equity-based
compensation effectively aligns directors’ interests with shareholders’ interests. Further
analysis shows that external monitoring can be an effective moderator to these
associations. My finding is robust at both director level and firm level and both Board of
Director level and Audit Committee level.
72
This study contributes to academia, regulators, and market participants by
showing the direct association between director’s compensation and firm’s RPT behavior,
and how external environment and internal firm characteristics can moderate this
association. It fills the academic gap in RPT literature and director compensation
literature. It provides firms and investors new evidence that appropriate director
compensation design can enhance internal monitoring and better control RPT behaviors.
73
References
Ajinkya, Bipin, Sanjeev Bhojraj, and Partha Sengupta. “The Association between Outside Directors, Institutional Investors and the Properties of Management Earnings Forecasts.” Journal of Accounting Research 43, no. 3 (June 1, 2005): 343–76.
Archambeault, Deborah S., F. Todd Dezoort, and Dana R. Hermanson. “Audit Committee Incentive Compensation and Accounting Restatements*.” Contemporary Accounting Research 25, no. 4 (December 1, 2008): 965–92.
Armstrong, Christopher S., John E. Core, and Wayne R. Guay. “Do Independent Directors Cause Improvements in Firm Transparency?” Journal of Financial Economics 113, no. 3 (September 2014): 383–403.
Boumosleh, Anwar. 2009. “Director Compensation and the Reliability of Accounting Information.” Financial Review 44 (4): 525–39.
Boumosleh, Anwar, and Brandon N. Cline. 2013. “Outside Director Stock Options and Dividend Policy.” Journal of Financial Services Research 47 (3): 381–410.
Brick, Ivan E., Oded Palmon, and John K. Wald. 2006. “CEO Compensation, Director Compensation, and Firm Performance: Evidence of Cronyism?” Journal of Corporate Finance 12 (3): 403–23.
Cordeiro, James J., Rajaram Veliyath, and Jane B. Romal. 2007. “Moderators of the Relationship Between Director Stock-Based Compensation and Firm Performance.” Corporate Governance: An International Review 15 (6): 1384–93.
Engel, Ellen, Rachel M. Hayes, and Xue Wang. “Audit Committee Compensation and the Demand for Monitoring of the Financial Reporting Process.” Journal of Accounting and Economics 49, no. 1 (2010): 136–154.
Farrell, Kathleen A., Geoffrey C. Friesen, and Philip L. Hersch. “How Do Firms Adjust Director Compensation?” Journal of Corporate Finance 14, no. 2 (2008): 153–162.
Feng, Zhilan, Chinmoy Ghosh, and C. F. Sirmans. 2007. “Director Compensation and CEO Bargaining Power in REITs.” The Journal of Real Estate Finance and Economics 35 (3): 225–51.
Goh, Lisa, and Aditi Gupta. “Remuneration of Non-Executive Directors: Evidence from the UK.” The British Accounting Review. Accessed February 17, 2016.
Hempel, Paul, and Charles Fay. “Outside Director Compensation and Firm Performance.” Human Resource Management 33, no. 1 (1994): 111–133.
Hermalin, Benjamin E., and Michael S. Weisbach. “Endogenously Chosen Boards of Directors and Their Monitoring of the CEO.” The American Economic Review 88, no. 1 (1998): 96–118.
Kaplan, Steven N., and David Reishus. “Outside Directorships and Corporate Performance.” Journal of Financial Economics 27, no. 2 (October 1, 1990): 389–410.
Klein, April. “Audit Committee, Board of Director Characteristics, and Earnings Management.” Journal of Accounting and Economics 33, no. 3 (August 2002): 375–400.
Fich, Eliezer M., and Anil Shivdasani. 2005. “The Impact of Stock-Option Compensation for Outside Directors on Firm Value.” The Journal of Business 78 (6): 2229–54.
Linn, Scott C., and Daniel Park. 2005. “Outside Director Compensation Policy and the Investment Opportunity Set.” Journal of Corporate Finance 11 (4): 680–715.
Ryan, Harley E., and Roy A. Wiggins. 2004. “Who Is in Whose Pocket? Director Compensation, Board Independence, and Barriers to Effective Monitoring.” Journal of Financial Economics 73 (3): 497–524.
Sengupta, Partha, and Suning Zhang. 2015. “Equity-Based Compensation of Outside Directors and Corporate Disclosure Quality.” Contemporary Accounting Research 32 (3): 1073–98.
74
Sharma, Vineeta. 2011. “Independent Directors and the Propensity to Pay Dividends.” Journal of Corporate Finance, Special Section: Managerial Compensation, 17 (4): 1001–15.
Ye, Kangtao. 2014. “Independent Director Cash Compensation and Earnings Management.” Journal of Accounting and Public Policy 33 (4): 391–400.
75
Table 1: Descriptive Summary Variable N Mean Std. Dev P10 P50 P90
# of RPT 12183 1.38 2.39 - 1.00 4.00
$ of RPT (log) 12183 0.43 0.99 - - 1.43
Director pay level in $MM 12183 0.20 0.38 0.06 0.17 0.30
13 CEO Pay -0.07 0.11 -0.05 0.02 -0.63 -0.15 0.01 0.01 -0.19 -0.08 0.19 0.02 1.00 Table 2 presents the Pearson correlation matrix. Correlation in bold indicates statistical significance at 5% level.
77
Table 3: Director Compensation effect on the occurrence of RPTs –OLS (1) (2) (3)
Dependent = # of RPT Pay Level Pay Structure Pay Level and
Structure Director Pay Level in $MM 0.164***
0.199***
(2.00)
(2.67)
Director Pay Structure (equity based pay ratio)
-0.237*** -0.303***
(-2.07) (-2.65)
Log(Total Asset) 0.336*** 0.363*** 0.357***
(11.58) (14.41) (14.17)
Leverage 1.040*** 0.966*** 0.976***
(2.70) (2.49) (2.51)
MB -0.012*** -0.012*** -0.012***
(-5.25) (-5.35) (-5.31)
ROA 0.774*** 1.005*** 0.989***
(1.81) (2.35) (2.28)
CGQ -0.015*** -0.014*** -0.014***
(-6.99) (-6.78) (-6.79)
Ind. Director % -0.067*** -0.065*** -0.065***
(-17.19) (-17.39) (-17.35)
Inst. Holdings % -0.913*** -0.733*** -0.737***
(-3.90) (-3.91) (-3.92)
Industry Competition 27.075*** 24.811*** 23.785***
(4.56) (4.35) (4.18)
CEO Pay 0.444*** 0.558*** 0.542***
(3.27) (4.09) (4.04)
Industry FE Yes Yes Yes Year FE Yes Yes Yes Error clustering Yes Yes Yes N 12183 12183 12183 Adj. R2 0.224 0.225 0.226
This Table 3 reports linear regression where numbers of RPTs is the dependent variable with t-statistics reported in parentheses below each coefficient. Year fixed effects and Fama-French 48 industrial fixed effects are included in each model and standard errors are clustered at the firm level. ***,**,* indicate the two-tailed statistical significance of coefficient estimates at the 1%, 5%, and 10% level.
78
Table 4: Determinants of Director Compensation
(1) (2) Dependent = Pay level Pay Structure Director Age 0.002*** -0.001***
(2.15) (-3.71)
Log(Total Asset) 0.040*** 0.019***
(6.01) (6.08)
Leverage -0.056 -0.044***
(-0.77) (-2.08)
MB -0.000 0.001***
(-0.67) (2.88)
ROA 0.286 0.313***
(1.27) (5.48)
CGQ 0.000 0.001***
(1.37) (4.39)
Ind. Director % -0.000 0.000
(-0.86) (1.04)
Inst. Holdings % 0.070*** 0.125***
(3.05) (6.08)
Industry Competition 5.810 1.520***
(1.56) (3.11)
CEO Pay 0.105 0.086***
(1.16) (2.60)
Industry FE Yes Yes
Year FE Yes Yes Error clustering Yes Yes Observations 12183 12183 Adj. R2 0.0637 0.106
This Table 4 reports determination of directors compensation with t-statistics reported in parentheses below each coefficient. Year fixed effects and Fama-French 48 industrial fixed effects are included in each model and standard errors are clustered at the firm level. ***,**,* indicate the two-tailed statistical significance of coefficient estimates at the 1%, 5%, and 10% level.
79
Table 5: Excessive Director Compensation Effects on The occurrence of RPTs (1) (2) (3) Dependent = # of RPTs
Predicted Director's Pay Level 0.270
(0.12) Excessive Director's Pay Level 0.164***
0.200***
(2.00)
(2.70)
Predicted Director's Pay Structure
0.189
(0.07)
Excessive Director's Pay Structure
-0.237*** -0.305***
(-2.07) (-2.65)
Log(Total Asset) 0.331*** 0.355*** 0.359***
(3.54) (6.03) (14.35)
Leverage 1.046*** 0.985*** 0.978***
(2.44) (2.57) (2.52)
MB -0.012*** -0.013*** -0.013***
(-5.32) (-3.69) (-5.46)
ROA 0.744 0.871 0.950***
(0.98) (0.92) (2.23)
CGQ -0.015*** -0.014*** -0.014***
(-6.21) (-5.55) (-6.85)
Ind. Director % -0.067*** -0.065*** -0.065***
(-15.84) (-16.30) (-17.43)
Inst. Holdings % -0.920*** -0.787*** -0.762***
(-3.56) (-1.94) (-4.01)
Industry Competition 26.459*** 24.170*** 24.489***
(1.76) (3.59) (4.29)
CEO Pay 0.433 0.521*** 0.537***
(1.64) (1.92) (4.02)
Industry FE Yes Yes Yes Year FE Yes Yes Yes Error clustering Yes Yes Yes Observations 12183 12183 12183 Adj. R2 0.224 0.225 0.226
80
This Table 5 decomposes director’s compensation into predicted portion and excessive portion to investigate which affects RPT activities with t-statistics reported in parentheses below each coefficient. Year fixed effects and Fama-French 48 industrial fixed effects are included in each model and standard errors are clustered at the firm level. ***,**,* indicate the two-tailed statistical significance of coefficient estimates at the 1%, 5%, and 10% level.
81
Table 6: Effect of Director Compensation on RPT Conditional on Approval Authority
(1) (2)
Sample = Audit Committee is responsible
Director in Audit Committee
Director NOT in Audit Committee
Dependent = # of RPTs
Excessive Pay Level 1.274*** 0.093
(2.30) (0.46)
Excessive Pay Structure 0.102 0.207
(0.48) (1.18)
Log(Total Asset) 0.242*** 0.551***
(5.57) (4.65)
Leverage -0.360 -0.903***
(-1.02) (-2.42)
MB 0.001 0.004
(0.78) (1.07)
ROA -0.630 -0.976
(-0.95) (-1.30)
CGQ -0.002 -0.015***
(-0.68) (-6.85)
Inst. Holdings % -0.167 -0.320
(-0.56) (-1.12)
Industry Competition -1.165 -0.432
(-0.10) (-0.04)
CEO Pay 0.270 -0.564***
(1.18) (-1.68)
Industry FE Yes Yes Year FE Yes Yes Error clustering Yes Yes N 2446 2985 Adj. R2 0.226 0.282
This table investigate whether the directors compensation effect is condition on directors’ role. The sample includes firms which assign audit committee as the responsible RPT review person. Column 1 uses subsample when the director is in the audit committee; Column 2 uses the subsample when the director is not in the audit committee. Year fixed effects and Fama-French 48 industrial fixed effects are included in each model and standard errors are clustered at the firm level. ***,**,* indicate the two-tailed statistical significance of coefficient estimates at the 1%, 5%, and 10% level.
82
Table 7: Moderator of Director Compensation Effect on RPTs (1) (2) (3) (4) (5) (6)
Industry Competition 22.208*** 22.501*** 12.757*** 20.286*** 76.234*** -2.004
(2.55) (3.47) (1.86) (2.14) (8.84) (-0.24)
CEO Pay 0.015 1.494*** 0.183 0.625*** -0.408*** 2.959***
(0.07) (4.15) (0.69) (3.38) (-2.00) (5.67)
Industry FE Yes Yes Yes Yes Yes Yes Year FE Yes Yes Yes Yes Yes Yes Error clustering Yes Yes Yes Yes Yes Yes N 5908 5429 4810 6476 5550 5787 Adj. R2 0.263 0.251 0.260 0.260 0.255 0.292
This Table 7 partitions the samples into two groups using the median of institutional holdings, analyst following and debt leverage, respectively. ***,**,* indicate the two-tailed statistical significance of coefficient estimates at the 1%, 5%, and 10% level.
83
Table 8: Director compensation effect on RPTs at firm level (1) (2) (3) Variable = # of RPTs Firm Level Firm Level Firm Level Excessive Director Pay Level 0.638***
0.705***
(3.41)
(3.71)
Excessive Director Pay Structure
-0.226 -0.346***
(-1.31) (-1.98)
Log(Total Asset) 0.070*** 0.076*** 0.076***
(2.33) (2.48) (2.51)
Leverage 0.673*** 0.647*** 0.670***
(2.80) (2.67) (2.78)
MB -0.006 -0.005 -0.005
(-1.28) (-1.23) (-1.21)
ROA 0.808 0.864 0.897
(1.36) (1.44) (1.50)
CGQ -0.005*** -0.005*** -0.005***
(-3.17) (-3.09) (-3.07)
Ind. Director % -0.021*** -0.021*** -0.020***
(-5.57) (-5.61) (-5.47)
Inst. Holdings % -0.572*** -0.540*** -0.533***
(-2.78) (-2.58) (-2.56)
Industry Competition -2.165 -1.454 -2.021
(-0.28) (-0.19) (-0.26)
CEO Pay 0.099 0.093 0.129
(0.42) (0.39) (0.55)
Industry FE Yes Yes Yes Year FE Yes Yes Yes Error clustering Yes Yes Yes N 1385 1385 1385 Adj. R2 0.0970 0.0911 0.0997
This Table 8 reports the analysis of director compensation’s effect on RPTs at the firm level. Year fixed effects and Fama-French 48 industrial fixed effects are included in each model and standard errors are clustered at the firm level. ***,**,* indicate the two-tailed statistical significance of coefficient estimates at the 1%, 5%, and 10% level.
Industry Competition 7.850 23.599*** 33.767*** 15.268*** 16.466
(1.12) (5.87) (8.30) (2.88) (1.62)
CEO Pay -0.534 0.166*** 0.000 0.363*** 0.091
(-1.45) (3.10) (0.01) (2.14) (0.59)
Industry FE Yes Yes Yes Yes Yes Year FE Yes Yes Yes Yes Yes Error clustering Yes Yes Yes Yes Yes N 4810 6476 5550 5787 1407 Adj. R2 0.360 0.178 0.222 0.199 0.143
This Table 9 repeats all analysis using log form of RPT transaction amount as an alternative RPT measurement. ***,**,* indicate the two-tailed statistical significance of coefficient estimates at the 1%, 5%, and 10% level.