Relational browser: A fast and contextualized searching and browsing tool Junliang Zhang, Gary Marchionini, Tim Shear, Chang Su Interaction Design Lab University of North Carolina, Chapel Hill January 31, 2004 Abstract The Relation Browser is a user interface for searching and browsing that supports visual exploration of relationships in datasets. This report describes the latest version of this interface, named RB++. It discusses improvements over previous versions and outlines a user study to test its effectiveness. RB++ uses an improved database scheme, supports arbitrary n-wise exploration within collection facets, closely couples collection overviews with results sets, and adds string search within results sets that are also coupled to the overviews. The system is illustrated with data from the UNC film collection and webpages from the U.S. Energy Information Administration website. 1. Introduction A multitude of information collections are available on the web. How to help people find information useful to their needs is a central problem of the information retrieval (IR) community. Interfaces for the searching and browsing these collections are one of the most important issues in the IR field because they serve to help people understand what the collections contain and determine how they articulate their needs and interact with the information retrieved. Various efforts have been made to design usable interfaces to help users find the information they want. The Relation Browser (RB) is yet another tool following this theme. It has been undergoing development and revision for several years and this report described the functionality and design process for the most recent version, named RB++. The RB++ provides several interface features to facilitate this process, among which are: 1. provides a global overview of the collection and various partitions within it 2. provides a highly interactive mechanism for exploring the collection and items within it 3. provides a highly interactive and flexible searching utility 4. tightly couples these searching and browsinging cababilities The next section describes the RB++ interface, followed by a review of previous work. The fourth section describes the design process. The report concludes with the user study plan. 2. Description of the RB++ interface The RB++ allows users to begin exploring a dataset in direct manipulation fashion or to type in queries for specified fields of the dataset. When the applet is loaded, the RB++ presents the initial interface (Figure 1), which consists of three components. The first component is the overview panel (or browsing panel), which displays different facets (or categories) and facet values (subcategories) for the current dataset. For the UNC movie collection application illustrated here, the different facets about the movie collection are: genre, decade, and format. Each facet occupies a column on the overview panel and 1
Transcript
Relational browser: A fast and contextualized searching and browsing tool Junliang Zhang, Gary Marchionini, Tim Shear, Chang Su
Interaction Design Lab University of North Carolina, Chapel Hill
January 31, 2004 Abstract The Relation Browser is a user interface for searching and browsing that supports visual exploration of relationships in datasets. This report describes the latest version of this interface, named RB++. It discusses improvements over previous versions and outlines a user study to test its effectiveness. RB++ uses an improved database scheme, supports arbitrary n-wise exploration within collection facets, closely couples collection overviews with results sets, and adds string search within results sets that are also coupled to the overviews. The system is illustrated with data from the UNC film collection and webpages from the U.S. Energy Information Administration website. 1. Introduction A multitude of information collections are available on the web. How to help people find information useful to their needs is a central problem of the information retrieval (IR) community. Interfaces for the searching and browsing these collections are one of the most important issues in the IR field because they serve to help people understand what the collections contain and determine how they articulate their needs and interact with the information retrieved. Various efforts have been made to design usable interfaces to help users find the information they want. The Relation Browser (RB) is yet another tool following this theme. It has been undergoing development and revision for several years and this report described the functionality and design process for the most recent version, named RB++. The RB++ provides several interface features to facilitate this process, among which are:
1. provides a global overview of the collection and various partitions within it 2. provides a highly interactive mechanism for exploring the collection and items
within it 3. provides a highly interactive and flexible searching utility 4. tightly couples these searching and browsinging cababilities
The next section describes the RB++ interface, followed by a review of previous work. The fourth section describes the design process. The report concludes with the user study plan. 2. Description of the RB++ interface The RB++ allows users to begin exploring a dataset in direct manipulation fashion or to type in queries for specified fields of the dataset. When the applet is loaded, the RB++ presents the initial interface (Figure 1), which consists of three components. The first component is the overview panel (or browsing panel), which displays different facets (or categories) and facet values (subcategories) for the current dataset. For the UNC movie collection application illustrated here, the different facets about the movie collection are: genre, decade, and format. Each facet occupies a column on the overview panel and
1
values of the facets are labeled and represented by bars with different lengths. The lengths of the bars visualize the number of movies associated with the facet values so that the user can gain the insight on distributions immediately. For example, in Figure 1, it is obvious that the number of drama movies is far larger than the number of sci-fi movies in the UNC library collection. When mousing over the bars, users get the exact numbers in the pop up tooltip. Each column has a drop down menu labeled with the currently displayed facet. The column can display any available facet by choosing it from the drop down menu. If the chosen facet is currently displayed in another column, then interface simply switches two facets. One of the most important features about the overview panel is that it facilitates direct manipulation exploration of the relationships between different facets. This feature is realized by simply employing the mouse over mechanism. When the users moves the mouse over a bar (we then call it the focused bar) for a specific facet, bars for other facets are updated instantly with the portion of the bar highlighted that reflects how many of the total films in that subcategory fall into the selected subcategory in the selected facet value. The highlighted portion of bars visualize the conditional distribution of the focused bar on other facets (Figure 2). Notice that numbers are also displayed beside the bars to show the exact numbers of the highlighted portion of the bars. The bars can also be clicked so that multiple bars can be focused. The focused bars actually form a query statement. The RB++ interface considers the relationship between the focused bar under same facet as“OR” and those under different facets as “AND”. This feature not only gives the users the power to gain deeper understanding of the collection but also provides query preview abilities to the users so that they can look ahead to result set properties before they commit to the search operation.
2
Figure 1. Initial interface
Figure 2. Mouse over “Drama” under the Genre category reveals the distribution of Drama movies on other categories
The second component , the control panel, occupies the middle part of the interface. Several functionalities are included on the control panel. Two buttons on the right enable the users to show more or less facets (or categories) in the overview panel. The search button in the middle of the panel enables the users to do the actual query on the focused bars and also on any words typed in the search boxes (described below). The retrieved result set is displayed as a table format at the bottom of the interface (described below). Note that if there are no bars focused and no words typed in search boxes, clicking the search button returns the complete dataset in the movie collection. On the left is a progress bar component which is employed to visualize the number of results in the table. In the initial interface, the number in the progress bar is zero. The third component is the results panel which resides at the bottom of the interface. There are several searching boxes on the upper part of the results panel, which allow users type textual queries on other metadata of the dataset, such as movie title, release date, and director.
3
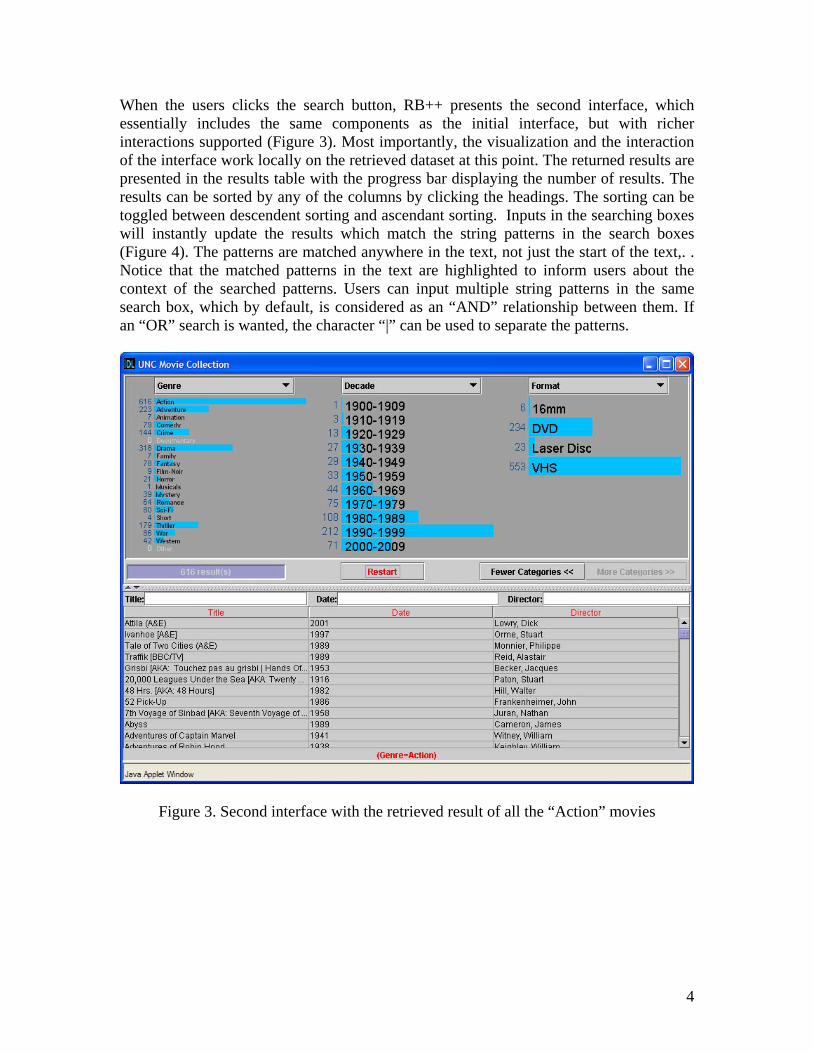
When the users clicks the search button, RB++ presents the second interface, which essentially includes the same components as the initial interface, but with richer interactions supported (Figure 3). Most importantly, the visualization and the interaction of the interface work locally on the retrieved dataset at this point. The returned results are presented in the results table with the progress bar displaying the number of results. The results can be sorted by any of the columns by clicking the headings. The sorting can be toggled between descendent sorting and ascendant sorting. Inputs in the searching boxes will instantly update the results which match the string patterns in the search boxes (Figure 4). The patterns are matched anywhere in the text, not just the start of the text,. . Notice that the matched patterns in the text are highlighted to inform users about the context of the searched patterns. Users can input multiple string patterns in the same search box, which by default, is considered as an “AND” relationship between them. If an “OR” search is wanted, the character “|” can be used to separate the patterns.
Figure 3. Second interface with the retrieved result of all the “Action” movies
4
Figure 4. Input “se” pattern in the title search box makes the result table only display the
movies whose titles matches the pattern. In the mean time the bars are proportionally highlighted.
Concurrent with the initial retrieval results presented in the result table, the overview panel also gets updated. The lengths of the bars reflect the retrieved results, thus, the overview becomes an overview of the retrieved dataset. This demonstrates that the different components of the interface are tightly coupled. The search box and the search results are tightly coupled (as described in the last paragraph) and the bars and the search results are also tightly coupled, which means two things: 1. Any actions on the bars such as clicking and/or mousing over also filters the results and dynamically update them; (Figure 5) 2. Whenever the results get updated, the bars also are proportionally highlighted to provide an overview of the updated results, which could expose relationships between the updated results and initially retrieved results. If there is only one updated result in the table, the bars inform the user about the exact metadata information such as genre, decade and format resulting the example shown in the figures. So the bars in the second interface serve both as browsing components and as searching components. Notice that after clicking the search button at the initial interface, the search button becomes the “restart” button, which takes the user to the initial interface upon clicking,
5
There is a fourth component for the second interface, which is the feedback panel at the very bottom of the interface. Feedback is composed of two parts. The first part of the feedback displays the textual query from the initial interface and the second part displays the textual query from the second interface. These two parts are separated by the symbols “****”. The feedback panel can help users realize where they are and how they got to those results.
Figure 5. Mouse over the “1990-1999” also filter the results instantly with proportionally
highlighted bars In short, some of the important features of the RB++ interface are:
1. Uniform dynamic global and local overviews • The labeled faceted classification on the information items serves as one kind
of overview • Global overview of the whole collection: what is and is not in the collection. • Dynamic local overview of the retrieved results set. • Explore the relationships between different facets to gain more comprehensive
understanding of the information items. 2. Dynamic and flexible string search box
• Instant update of the matching results following the string pattern input to the search boxes
• Patterns match anywhere in the text
6
• Matching patters are highlighted in the results 3. Tightly coupled search, overview, and results
• The searching box and the results table are tightly coupled • The overview and the results table are tightly coupled
With the RB++ interface, a common use scenario would consist of four stages:
1. Users could get an overview of the dataset and explore the relationship between different facets within the initial interface.
2. Users employ the bars and/or search boxes to form the query and click the search button to get the initial results
3. Users refine the results within the second interface by browsing and/or searching the initial returned results
4. Users select from among the results those items they wish to display in a new window
3. Previous work Many information access interfaces aim to provide a starting point for information seekers by presenting overviews of the collection (Hearst, 1999; Greene et al., 1999). Overviews can help users understand the whole collections and select or eliminate sources from consideration. Overviews can direct information seekers to specific subcollections quickly, where they can explore details. Usually two types of overviews are employed: category overview and graphical overview. Categories on Yahoo are a familiar example of category overviews. The HiBrowse interface for viewing category labels hierarchically based on facets is another example. Another interface using category overviews as faceted metadata is the Flamenco interface (Yee, Swearingen, Li, and Hearst, 2003). The last two interfaces not only present the category labels to users but also inform the users about the number of documents in each category. However, none of these interfaces allow the users to employ simple mouse over operations to quickly explore the relationships between different categories (or facets). The Flamenco interface could do this as part of the browsing and searching efforts, but it requires a lot of commitment from the user such as clicking the category and waiting. The previous Rave versions (Marchionini, Brunk, 2003) presented various categories and allowed users to explore the relations by mouseover operations, but it only allowed the users to mouse over the main category. Graphical overviews represent another class of overview, which usually employs various information visualization techniques. Lin (1997) used the Kohenen feature map to visually present a topical overview of the collection. Each block on the map represented a subcollection with similar topics which was labeled by one or two salient words extracted from the subcollection. The adjacent blocks show topic similarity between subcollections. Wise, et al. (1995) developed a three dimensional interface to visually present various topics. Zhang, Mostafa, and Hypathy (2002) extracted key concepts from the collection and visually presented the concepts in a spring-embeded graph. Similar concepts were clustered together and usually represented a subtopic. The graphical overview is visually appealing, but the usability of this kind of interface has yet to be proven and the 3-D interfaces are more problematic than 2-D interfaces in terms of ease of use and ease of
7
learning. It seems that textual category structure is more understandable than graphical interfaces, since the information is textually based. There has been considerable work on how to present retrieved results in context. Hearst (1996) used a clustering technique to cluster results on the fly and present the different clusters with labeled words to the users to help them understand the results. Chen and Dumais (2000) employed a classification technique to categorize the retrieved results based on the existing category structure and displayed them in hierarchical categories. These interfaces had to cluster or categorize the retrieval results on the fly, so scaling is problematic. RB++ categorizes the collection off line and uses a uniform category structure to present the overview and the retrieval results. Thus the RB++ can be scaled up easily and reduce waiting time for returning results. We have actually applied the interface to a data set with more than two million records. There also has been some work on fast lookups for specific information items. Sorting techniques are often used to help users locate the specific item. However, users still need to visually go through each of the items. The Alphaslider (Alhberg & Shneiderman, 1994) is a visual component to help users quickly locate known string items, but it is not very easy to use, especially for novices. Besides, the Alphaslider can only locate the information items based on the first letter alphabetically. RB++ provides an easy and flexible way to locate the information items by inputting the string patterns and the patterns are matched anywhere in the result set. A similar technique was used in the address box of internet browser, but still it strictly matches the pattern with the information items from the beginning. Dynamic query is a new style of interaction (Shenideman, 1993). It provides a visual interface for the information items and provides visual components to explore the information items by tightly coupling search and visual display of the results. The RB++ was inspired by this work, but instead of providing the visual interface, RB++ employs a more understandable (especially for topical overviews) category structure for the information items. Besides, the search box is a very effective and efficient component for the non-categorized attributes of the items, while the visual component such as sliders or check boxes can only be used for categorical attributes of the items. The Attribute Explorer (Spence, & Tweedie, 1998) and other similar interfaces (Lanning, Wittenbueg, etc, 2000, Wittenburg, Lanning, etc, 2001) provide similar ways to explore the relationships between different facets of the classification. These interfaces worked for structured information such as databases. We intend to make the interface work for semi-structured textual information. The search boxes were also provided to help users to put constraints on other types of metadata. 4. Design process 4.1 First design and implementation iteration:
8
The analysis and design of the RB++ began in November, 2002. The work built on the previous versions of the Relation Browser and subsequent RAVE. Two kinds of redesign went on simultaneously: the interface redesign and the backend database schema. The interface of the previous RAVE basically provided a subset of the functions in the new RB++. As in the earlier versions, RB++ displays different categories based on different facets with the distribution shown with visual cues. However, whereas the earlier version only displays one-way relationships, that is, you can mouse over the left most category and see the corresponding distribution on the other categories. (since the other categories were designed to be put in a tabbed pane, you can see the distribution on these categories one at a time). This kind of design makes sense in some situations when the left most category is the main category or mousing on other categories to learn the distribution on other categories does not make sense. However, in most situations, the relationship is reciprocal, meaning that the interface should allow users to mouse over any categories to explore the distribution on the others. In the mean time, displaying all the categories on one panel makes it easy for users to do efficient exploration without extra clicking operations. Redesign of the backend database scheme: The table storing the data in the previous versions basically was a non normalized table structure, which means that all the relevant attributes of a record are crunched into one table no matter what the relationship between attributes and the record. Thus, one record can appear multiple times in the table with major part of the attributes unchanged. Besides, non normalized table structure has several problems:
1. It is an inefficient storage scheme 2. it is very confusing for data structure comprehension (requires a lot of experience
before one can understand the underlying data structure) 3. it does not lend itself toward building extensible, evolving data entry tools
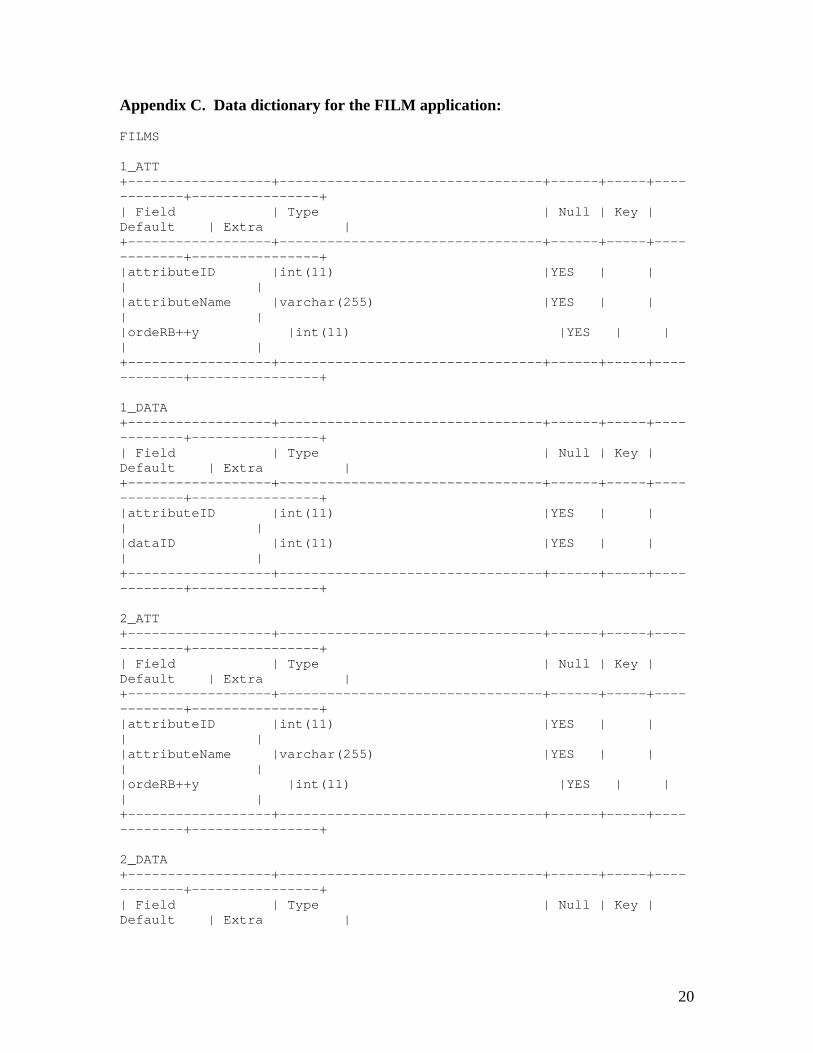
The current database scheme includes several kinds of normalized tables (the data dictionary for these tables can be seen at appendix II):
1. Table ATTRIBUTE_NAMES. This table basically stores heading labels of all the facets (categories) which will be displayed in the drop down menu in the overview panel.
2. Table DATA. This table stores the major pieces of information about the data, which are going to be displayed in the results table.
3. Table DATA_NAMES. This table stores the labels of the attributes in the DATA table and also the type of data such as number, string etc.
4. Tables named (ID)_ATT. These tables store the values for specific facets (or categories), which are displayed on the overview panel
5. Tables named (ID)_DATA. These are the bridge tables between the data and various attributes which are used as facets (categories).
Some of the principles for redesigning the database scheme were: 1. Abstract as much as possible.
• Use numbers for attribute tables • Store row names outside of the attribute tables
9
• Use numbers for data columns • Store data row names outside of the data table • .
2. All relationships between attributes and data will be stored as many-to-many, even if there is no need.
• We cannot know what data is going to be stored in this data structure, but we can assume that much of it will be many to many.
• Therefore, create many-to-many tables between each attribute and the data table. We thus insure that while storage may not be optimized for one-to-many and one-to-one relationships, we can handle all possible relationships.
3. We have to create some upper limits on the number of attributes ("main attribute" plus "tabs"), and the number of pieces of information we will store for a given piece of data (such as title, url, agency, etc.)
• We are storing every attribute and attribute_data relationship in arbitrarily numbered tables.
• We do not know how many attributes a user will wish to store • We are storing information about each data "point" in arbitrarily numbered
columns • We do not know how many pieces of information about a data point a user will
wish to store • There must, therefore, be limits on how many attributes/data pieces the
application will support. • If this number is higher than the user needs, there is not a huge performance hit.
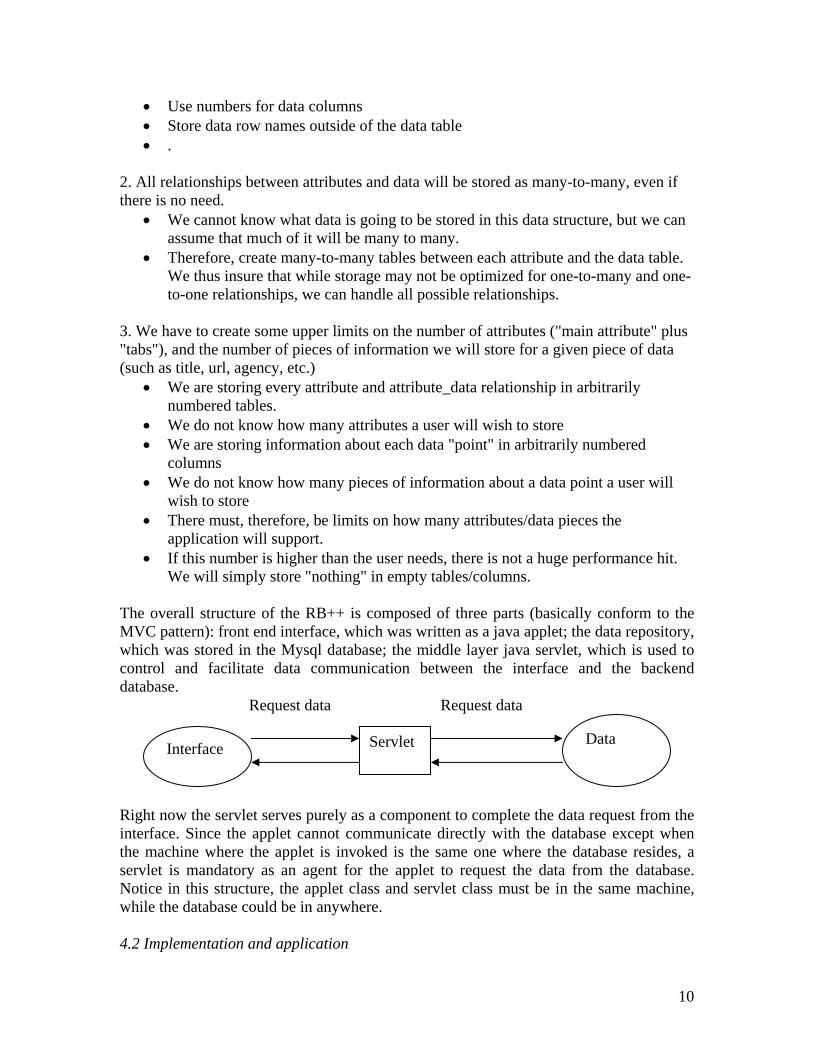
We will simply store "nothing" in empty tables/columns. The overall structure of the RB++ is composed of three parts (basically conform to the MVC pattern): front end interface, which was written as a java applet; the data repository, which was stored in the Mysql database; the middle layer java servlet, which is used to control and facilitate data communication between the interface and the backend database.
Servlet
Request data Request data
Data Interface
Right now the servlet serves purely as a component to complete the data request from the interface. Since the applet cannot communicate directly with the database except when the machine where the applet is invoked is the same one where the database resides, a servlet is mandatory as an agent for the applet to request the data from the database. Notice in this structure, the applet class and servlet class must be in the same machine, while the database could be in anywhere. 4.2 Implementation and application
10
The implementation of the first revised prototype was undertaken in early February of. 2003. It was written in the Java programming language and implemented as an applet which can be invoked from Internet browsers. The first design decision concerned how the mouse over mechanism should facilitate relationship exploration between different categories. Each mouse over action on a category value means doing set of queries on the database. For example, using the movie database above, if the user mouses over the “Action” value under the Genre category, queries need to be done to return the numeric distribution of the “Action” movies on other categories values. The queries normally can be done on the fly, but tests indicated that there was a 400 to 500 milliseconds delay between the mouse over action and the update of the distribution bar. Most of the delay was caused by the data transfer across the web. There are three strategies to handle the query process: 1. do it on the fly. 2. pre-compute the distribution data for all possible queries and preload them into the local memory. 3. A compromised way of first two strategies. The second strategy is not going to scale even for a small dataset, since the number of possible queries increases exponentially with the number of categories or the number of category values. While the first strategy defeats the dynamic query interaction style by causing cognitive interrupts, even though the delay is relatively short. So, the current strategy is to pre-compute the distribution of data for the most frequently used queries. During the initiation of the applet this pre-computed distribution data is also transferred and stored in the client-side memory. If the potential query is not present in the memory, the traditional way was used to get the distribution data, that is, to do it on the fly. This strategy has the advantage over the first two strategies in that it gives quick response most of time while keeping the preloaded data minimal. One disadvantage, though, is that users may feel some inconsistency in response times. The first prototype was first applied to the UNC movie collection, given the availability of the collection in a database. The movie collection is well structured information, which means it already has different attributes for each entity. In order to apply the RB++ to the structured information, a decision needed to be made in terms of which attributes were going to be put in the overview panel. Only after this decision, the relevant attributse and data could be imported into the RB++ backend database. Some important attributes used in the RB++ interface for the movie collection were: title, director, genre, decade, and format, but only those attributes which have a limited number of values (such as genre, format ) or the value of which can be collapsed meaningfully into a small number of intervals (such as publication year, which could be collapsed into decade). Other attributes can only be displayed in the results panel. RB++ was then also applied to a different domain: the EIA web page collection. This collection is different from the UNC movie collection in that web pages are unstructured information and there is no existing metadata (category) available. In order to make the RB++ for the EIA work, a classification scheme for the EIA website had to be generated. Under the classification scheme, the web pages were classified based on this scheme. The current classification scheme was manually generated by the Su and Fry (see the appendix for a summarization of the manual categorization for the EIA website). The classification of the web pages was then done by using Google keyword searches, which
11
was fast but not very accurate. In the mean time, another group was working on ways to generate the classification scheme automatically. One of the issues for the RB++ browser is the space issue for the display of the classification scheme in the overview panel when the number of attributes for facets become long. A divided panel was used in the interface to partially solve this problem so that users can chose to adjust the space ratio between the overview panel and the results panel. While the space of the overview panel gets smaller, the width of the value bar also shrinks. A so called fisheye RB++ was also tried to solve the space issue. The Fisheye interface basically is a focus + context interface, where the objects in the focus area are normal size, while other objects become smaller as the distance to the focus area becoming larger. The code was based on the fisheye menu code from the HCIL from university of Maryland (Bederson’s Jazz environment). The fisheye interface can handle perhaps a hundred values in any facet. However, the usability of the fisheye interface is not clear and bears investigation in future work. The search boxes were added latter in the first design iteration to help users quickly locate information items in long results tables. The search boxes were provided as a mechanism to manipulate the textual non-categorical attributes for the dataset such as title and director.. In the traditional dynamic query, one of the limits is that there is no component which can be effective and efficiently control the non categorical attributes. The search boxes provide at least a partial solution to this. Many string pattern matching algorithms exist. The search algorithm used in the RB++ interface was the simplest one: brute-force search algorithm, which basically compares the pattern and text from the beginning to the end, if the character doesn’t match then go for the next one until find the match or run out of the text. Some other search algorithms were also tried and these trials are discussed in a later section. 4.3. Discount usability test on the RB++ After the implementation of the newly designed RB++, an informal discount usability test was conducted on the movie application. This usability test was meant to find any usability issues on the interface. However, the usability test turned out to be more fruitful. Three people were invited to do the test at the usability workstation in the Interaction Design Laboratory (IDL). No video or audio information were recorded. No time were recorded. But the problems of using the interface to complete the tasks were recorded and a brief post-test interview was conducted. Three types of tasks were designed for the test (see the appendix for the example tasks):
1. Find a specific item, where the item could exist or not exist in the collection and the item could be a known item or known partially.
2. Find a subset of collections. Some tasks contained an exploration subtask. 3. Do exploration (information discovery)
Some important usability problems were found as follows: 1. Users tend to find counts by “over clicking.” For example: To find how many sci-
fi movies in VHS format, users only need to mouse over the sci-fi value under the genre facet and look at the count number beside the VHS value under the format facet. However, users sometimes tried to click both sci-fi and VHS.
12
2. Users had difficulty expressing the range value in the data search boxes 3. Users may not know the sorting function of the results table 4. The clear button beside the searching box is confusing: whether it meant clear the
results or clear the text data in the search boxes. 5. Users thought they could combine the bar selection & search box to do the initial
query 6. sUsers suggested adding another button called : “get all the results”
After this usability test, group members discussed improvement of the interface. It was suggested to combine the bar selection and search boxes to do the initial query. Also it was suggested to dynamically update the bar based on the new sets of the results. After this discussion, a second design and implementation iteration started. 4.4. Second design and implementation iteration Several interface improvement were implemented in this iteration.
1. In the initial interface, the searching box was allowed to do the search, either in combination with the bar or not.
2. The overview was dynamically changed when the new results set was retrieved from the initial interface
3. The overview panel was tightly coupled to the results table panel. Thus, the dynamically updated results caused by the searching boxes would also update the progress bar in the overview window. Besides, the mouse over action on the bar would also filter the results in the results table.
4.4.1 Technical issues: The fast search algorithm on the retrieved results is important for the dynamic characteristics of the interface. The results are updated based on either textual information put in the search boxes by users or the mouse over the bars. The representation of the bar is the numbers of postings for each category so an inverted index was done for each of the facets. The update of the results based on the constraint of the bars was done by the union or intersection of two sets. The results update based on the search boxes required fast string searching algorithm. The initial algorithm was the brute force algorithm, that is to compare the information with the pattern one by one until the pattern was found or the information string was run out. In the second iteration design, two new string searching algorithm were tried: the Boyer-Moore algorithm; and the fast searching algorithm. The former algorithm was widely considered to be the fastest searching algorithm. While the later one was considered to be fast with short patterns. Both algorithms were written in Java. The former one was downloaded from web, while the later algorithm was written by Zhang. An informal test was done on these two algorithms with the initial brute force algorithm. No significant difference were found between these algorithms in terms of the searching speed. Actually, the two new algorithms were even slower than the brute force one. So the initial algorithm was kept. This is likely due to the fact that the target search objects were fairly short records rather than full text documents where the improved algorithms leverage previous results in the overall string.
13
4.4.2 Multi-usage issues: The RB++ interface is a web application, which means that it should be capable of handling multiple users’ requests effectively and efficiently. It can be seen from Figure 3.1 that multiple requests become an issue whenever communication occurs between the applet and servlets. Servlets, in our case, essentially are the agents for the applet to request data from the backend database. The MySQL database itself is capable of dealing with multi requests at the same time, which is not something we are going to worry about at this point in terms of multi usage issue. However, we need to make the servlets capable of working with multiple user requests. Fortunately, the Java servlet supports multi user requests already. The Java servlet generates separate threads to serve user requests. But we need to be careful when we define global variables in the servlet, since these global variables are shared by all the user requests. There are three servlet agents working for the applet: 1.One servlet serves to read the preloaded data (such as category labels, minima set of counts data) for the applet during the initialization stage. The preloaded data were queried from the database offline and were written into a single file as an object. 2.One servlet serves to do the query on the fly for the distribution data when the queries on the bar don’t exist in the preloaded data. 3.One servlet serves to query the database to get the results set For the first servlet, we need to synchronize the file reading process in case that multiple users invoke the applet at the same time and the issue of reading the same file at the same time by multiple processes might arise. 5. Draft plan for the user study of the RB++ interface To evaluate the usability of the revised RB++, a user study is planned. Our hypotheses in this study are:
1. The RB++ Interface will yield faster performance on the retrieval tasks 2. The RB++ Interface will help users gain more comprehensive understanding of
the collection 3. Users will feel more satisfied and confident about the retrieved results with the
RB++ interface Experimental study: The study will use a within subjects design. It will be conducted at the IDL usability lab at UNC-Chapel Hill. Approximately 20 subjects will be recruited from the UNC-Chapel Hill campus. Subjects will be composed of undergraduate and graduate students across different schools and departments. The study will take about 1 hour and each subject will be paid participation. The study consists of two stages. The first stage is a comparison study with the RB++ interface and the traditional from-fillin interface of the UNC movie collection domain. The second stage is an exploratory study with the RB++ interface in the domain of the EIA website. First stage: Two interfaces will be compared: the RB++ interface and the UNC filmfinder web interface, which is basically a form fillin interface. Half of the users will use the RB++ interface first and half of the users will use the filmfinder interface first.. Each task will have two comparable versions for the two different interfaces.
14
There are three types of tasks designed for the study. They are: 1. Retrieval tasks:
Find known item(s): a. Find the movie titled “A Beautiful Mind” b. You want to find a movie which you once heard of, but can only remember the partial name “bridge”. c. Find all the movies which were directed by “some” director
Find unknown items (not exactly unknown items, but the tasks with some information discovery first)
a. Retrieve the latest (or earliest) movie available at UNC, which is directed by “some” director? b. Find in which year “some” director directed the most movies, and retrieve all these movies. c. Find what is the main genre of all the movies directed by “some” director and retrieve them. d. Find which genre has the least amount of movie titles in the year 1990 and retrieve all the movies of that genre in 1990.
2. Information discovery tasks (simple data analysis) a. Which genre of movie has the most films in the library? b. Which format of the movies dominated in the 1960’s, what about 1990’s.
3. 5 or 10 minute free exploration: a. For the RB++ interface: check out 5 or 10 of your favorite movies from the UNC library before 1999 b. For the Filmfinder interface: check out 5 or 10 of your favorite movies from UNC library after 1999
Second stage: This stage would only involve the RB++ interface applied to the EIA website. The reason that the comparison study would not be conducted in this domain is that:
1. The faceted classification scheme is not good enough. Some facets could be added such as time period and report format, however, some facets are not specific enough, such as region. 2. Most importantly, the categorization of the web pages under this scheme is not accurate enough. The categorization of the web pages was simply done by Google keyword search, which brought a somewhat high percentage error rate.
However, we would like to examine the users’ usage pattern with the RB++ interface applied to the unstructured information domain. (Notice that the movie collection in the last application is a structured data domain), and how the interface could possibly or could not support various tasks in this domain. The types of tasks are based on the taxonomy of user tasks/questions in the Hert and Marchionini 1997 BLS final report. The taxonomy in the report had several dimensions such as: pragmatic dimension, semantic dimension, and syntactic dimension. The design of tasks was based on the goal of the users under the pragmatic dimension.
1. Learn something new (fill gap, single to exhaustive) I want to learn the situation of nuclear energy usage in the China I want to find the statistics on the petroleum price in the latest week
15
2. Verify What was the electricity generation capability of the USA in the year 2002 Is the yearly production of natural gas in the USA higher than that of Russia? 3. Judge/evaluate/compare Compare the residential electricity usage across different states in the year 2002. Compare coal production in the USA across different years 4. Explore What kind of the information can I and can I not get from the website? 5. Referral/intermediate result 6. Ongoing 7. Planning/forecasting
The four possible tasks would be: 1. I want to learn the current status of Chinese nuclear energy. (Please think aloud) 2. Find the most recent weekly data on the petroleum price in the USA. (Please think aloud) 3. Find the statistical data on coal production across different states in the year 2001. (Please think aloud) 4. What kinds of information can I and can not I find from the website?
References: Ahlberg, C. and Shneiderman, B (1994). The alphaslider: a compact and rapid selector. CHI’94, Boston, Massachusetts.
Chen, H, and Dumais, S(2000). Bringing order to the web: Automatically categorizing searching results. CHI’00 The Hague, Amsterdam. Hearst, M. and Pedersen, P (1996). Reexamining the Cluster Hypothesis: Scatter/Gather on Retrieval Results, Proceedings of 19th Annual International ACM/SIGIR Conference, Zurich, Lanning, T, Wittenburg, K, Heinrichs, M, Fyock, C, and Li, G. (2000). Multidimensional information visualization through sliding rods. AVI’02 Palermo, Italy.
Lin, X (1997). Map displays for information retrieval. Journal of the American society for information science. 48(1); 40-54.
Marchionini, G, and Brunk, B (2003). Toward a general relation browser: A gui for information architects. Journal of Digital Information. 4(1), JoDI
Shneiderman, B. (1994). Dynamic queries for visual information seeking. Technical report. Human computer interaction Laboratory. University of Maryland, College Park. CS-TR-3022.
Spence, R, and Tweedie, L. (1998). The attribute explore: information synthesis via exploration. Interacting with Computers. 11, 137-146.
Tanin, E, Lotem, A, Haddadin, I, Shneiderman, B, Plaisant, C, and Slaughter, L (2000). Facilitating data exploration with quey previews: a study of user performance and preference. Behaviour & information technology. 19(6). 393-403.
Wittenburg, K, Lanning, T, Heinrichs, M, and Stanton, M (2001). Paraell bargrams for consumer-based information exploration and choice. UIST’ 01,Orlando FL.
Yee, K, Swearingen, K, Li, K, and Hearst, M (2003). Faceted metadata for image search and browsing. CHI’03, Ft. Lauderdale, FL. Zhang, J, Mostafa, J. Hypathy, H. (2002). Information retrieval by semantic analysis and visualization of concept space for the D-lib magazine. D-Lib Magazine. 10.
17
Appendix A: Tasks for the discount usability study
1. Find a specific item: (know the exact information, or know part information) Scenario I: I want to find a movie titled: “rush hour” Scenario II: I want to find a movie titled: “Matrix II” (This movie actually is not included in the collection yet) (May change to another one which is not familered by most of people) Scenario III: I want to find a movie, but only remember the title contains the word: arrow (The movie wanted is actually titled “broken arrow”)
2. Find a subset of the items: Scenario I: I want to find all the movies directed by the Spielberg Scenario II: I want to find the documentary type movies published between 1910 and 1919. Scenario III: I want to find the comedy movie published after 1990 and in DVD format Scenario IV: I want to find all the DVD movies published in the year as early as possible in the UNC movie collection
3. Do exploration: Such as: How many action movies we have. Do we have the movies published before 1970 which is in the DVD format. Which format is dominated in the 1960’s, what about 1990’s. In which time period was the number of movies in DVD format larger than that in VHS format. How many Sci-Fi movies in the UNC collection which were directed by John Woo
18
Appendix B. RB++ Database Scheme:
19
Appendix C. Data dictionary for the FILM application: FILMS 1_ATT +------------------+---------------------------------+------+-----+------------+----------------+ | Field | Type | Null | Key | Default | Extra | +------------------+---------------------------------+------+-----+------------+----------------+ |attributeID |int(11) |YES | | | | |attributeName |varchar(255) |YES | | | | |ordeRB++y |int(11) |YES | | | | +------------------+---------------------------------+------+-----+------------+----------------+ 1_DATA +------------------+---------------------------------+------+-----+------------+----------------+ | Field | Type | Null | Key | Default | Extra | +------------------+---------------------------------+------+-----+------------+----------------+ |attributeID |int(11) |YES | | | | |dataID |int(11) |YES | | | | +------------------+---------------------------------+------+-----+------------+----------------+ 2_ATT +------------------+---------------------------------+------+-----+------------+----------------+ | Field | Type | Null | Key | Default | Extra | +------------------+---------------------------------+------+-----+------------+----------------+ |attributeID |int(11) |YES | | | | |attributeName |varchar(255) |YES | | | | |ordeRB++y |int(11) |YES | | | | +------------------+---------------------------------+------+-----+------------+----------------+ 2_DATA +------------------+---------------------------------+------+-----+------------+----------------+ | Field | Type | Null | Key | Default | Extra |
Appendix D. Manual categorization of EIA website The provision of federal statistical information is spread across a wide range of government agencies. The diffuse delivery of statistical data places a significant intellectual burden on end users. The aim of this study is to re-conceptualize the varying web-based interfaces in order to develop a generic taxonomy of high-level concepts that is flexible and meaningful to be applied across diverse agencies. The study forms part of the NSF EIA0131824 funded GovStat Project. The starting point for this research was the examination and re-classification of Energy Information Administration (EIA) web site. EIA is a statistical agency of the U.S. Department of Energy. The EIA website has approximately 35,650 pages. Tables and analyses are the main forms for communicating statistical information. Its website provides information on eight fuel types. The data infrastructure is based on separate databases for each fuel type. The fuel specificity of each database problematises conceptual integration across the website for the end user. In this study, we adopted three approaches to re-categorize the website content: 1. bottom-up 2. top-down and 3. what we describe as an integrated approach.
Evaluation of Methodology The defining feature of our approach was that it was based on human indexing, rather than machine indexing. Our focus was analysis of the semantic relationships between data in the website. The research started with a ‘bottom-up’ approach using statistical tables as the unit of analysis. Due to the mass of data we decided to initially focus on the three major fuel types: coal, electricity, and natural gas. In order to gain an understanding of the conceptual relations within and between each type we deconstructed the website on the basis of categories, link titles, table titles and page URLs. From this data we developed an interim classification scheme, which was implemented into a relation browser, RAVE1. Using the ‘bottom up’ approach created a data management and analysis issue due to the large mass of data. In deconstructing the existing hierarchy it was difficult to maintain integrity with the agency’s application of higher-level concepts. Having experienced significant limitations with the ‘bottom-up’ approach, we adopted a ‘top-down’ approach. We analyzed the top-level categories on the EIA homepage and compared them with other national statistical websites, such as the U.S Environmental Protection Agency, in order to obtain generic concepts within the energy and statistical domains. This approach provided us with an effective overview of the existing EIA concept hierarchy. However, a limitation of the ‘top-down’ approach was that it was inherently biased by the existing EIA hierarchy and therefore integrity with the statistical tables was compromised. Consequently, we developed a third approach, which we have described as an ‘integrated approach’. We constructed a content inventory based upon five category levels, with level one being the fuel type main page and level five being the table links. The advantage of this approach is that it enabled the integrity of the existing hierarchy to be maintained, which we found to be a necessary component of the analysis, while also maintaining the connection between higher level subject concepts and the statistical data.
1 Available at, http://squash.ils.unc.edu/rave/suc.html