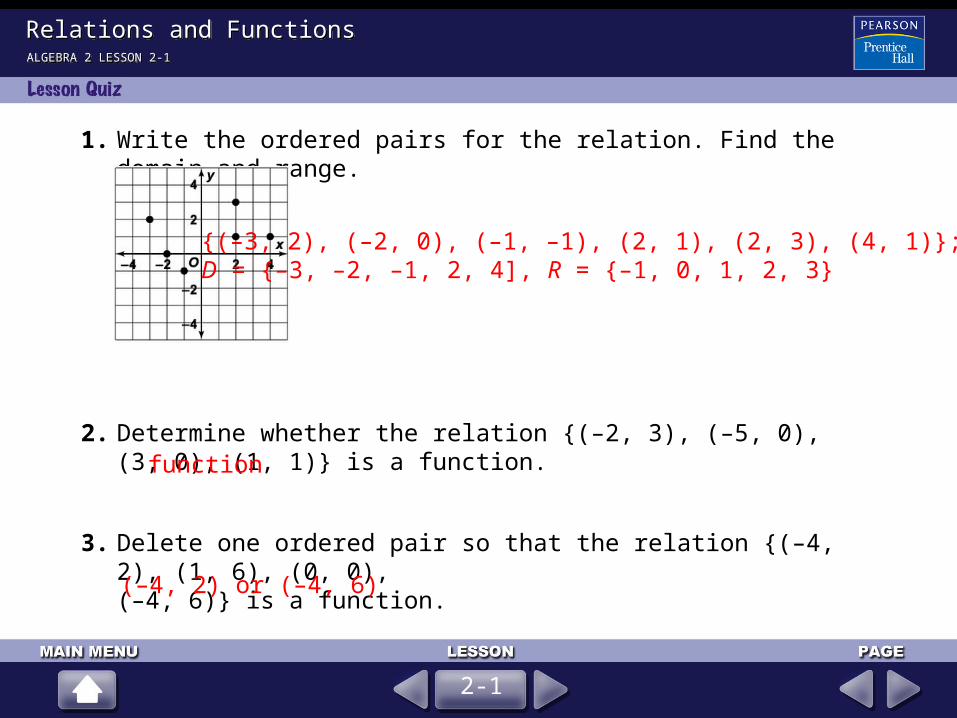
Write the ordered pairs for the relation. Find the domain
and range.
{(–4, 4), (–3, –2), (–2, 4), (2, –4), (3, 2)}
The domain is {–4, –3, –2, 2, 3}.
The range is {–4, –2, 2, 4}.
2-1
ALGEBRA 2 LESSON 2-1ALGEBRA 2 LESSON 2-1
Relations and FunctionsRelations and Functions
Make a mapping diagram for the relation {(–1, 7), (1, 3),
(1, 7), (–1, 3)}.
Pair the domain elements with the range elements.
2-1
ALGEBRA 2 LESSON 2-1ALGEBRA 2 LESSON 2-1
Relations and FunctionsRelations and Functions
Determine whether the relation is a function.
The element –3 of the domain is paired with both 4 and 5 of the range.
The relation is not a function.
2-1
ALGEBRA 2 LESSON 2-1ALGEBRA 2 LESSON 2-1
Relations and FunctionsRelations and Functions
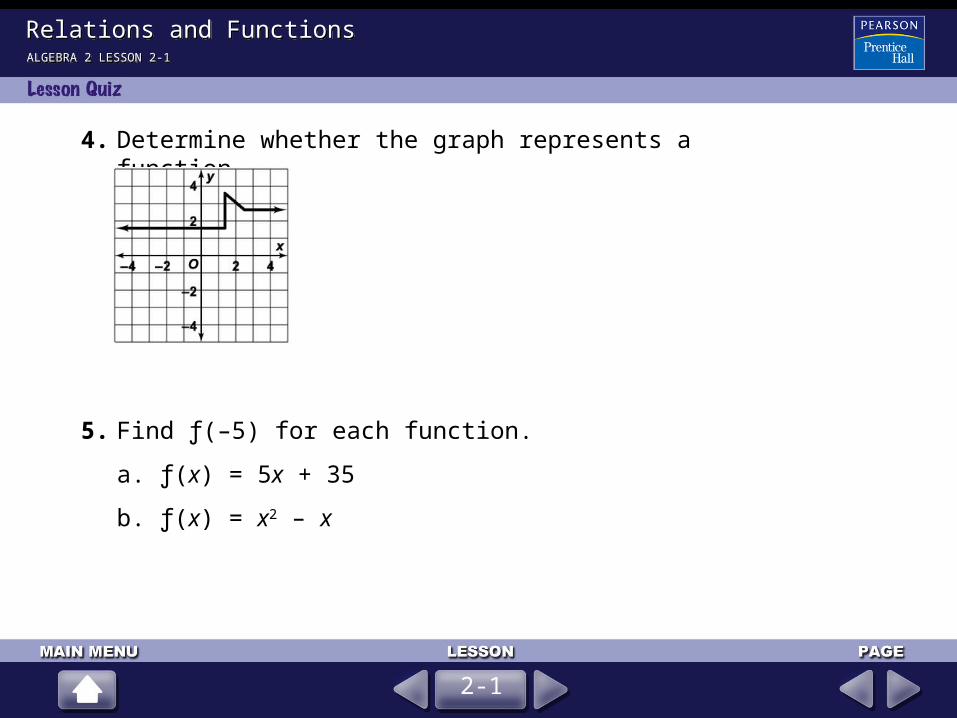
Use the vertical-line test to determine whether the graph
represents a function.
If you move an edge of a ruler from left to right across the graph, keeping the edge vertical as you do so, you see that the edge of the ruler never intersects the graph in more than one point in any position.
Therefore, the graph does represent a function.
2-1
ALGEBRA 2 LESSON 2-1ALGEBRA 2 LESSON 2-1
Relations and FunctionsRelations and Functions
Find ƒ(2) for each function.
a. ƒ(x) = –x2 + 1
ƒ(2) = –22 + 1 = –4 + 1 = –3
b. ƒ(x) = |3x|
ƒ(2) = |3 • 2| = |6| = 6
c. ƒ(x) = 9
1 – x
ƒ(2) = = = –99
1 – 29
–1
2-1
Relations and FunctionsRelations and FunctionsALGEBRA 2 LESSON 2-1ALGEBRA 2 LESSON 2-1
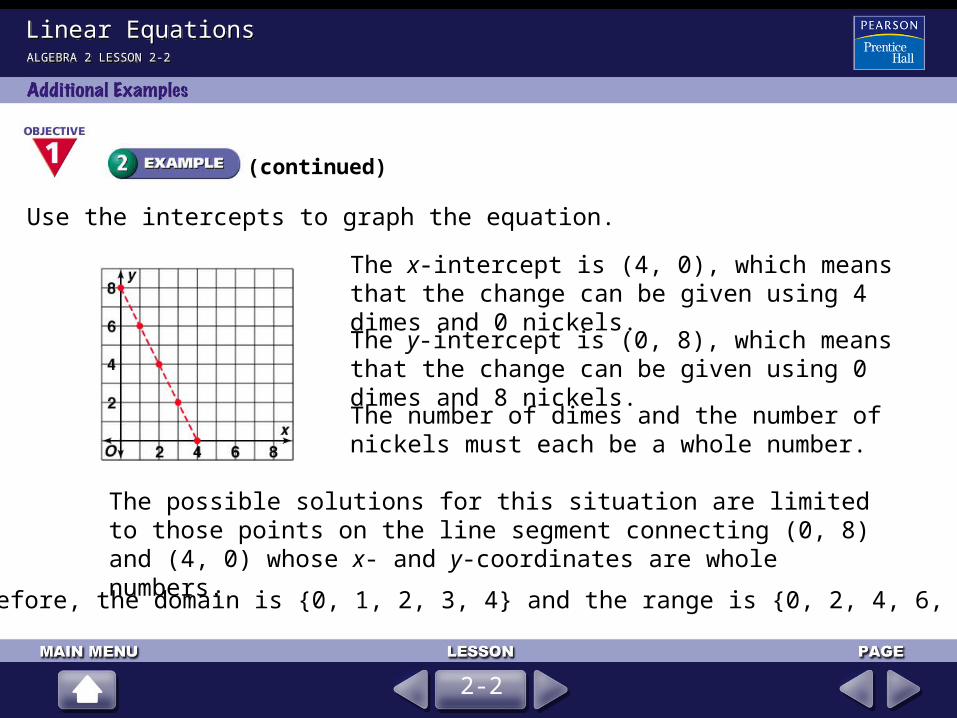
The x-intercept is (4, 0), which means that the change can be given using 4 dimes and 0 nickels.
The y-intercept is (0, 8), which means that the change can be given using 0 dimes and 8 nickels.
ALGEBRA 2 LESSON 2-2ALGEBRA 2 LESSON 2-2
Linear EquationsLinear Equations
(continued)
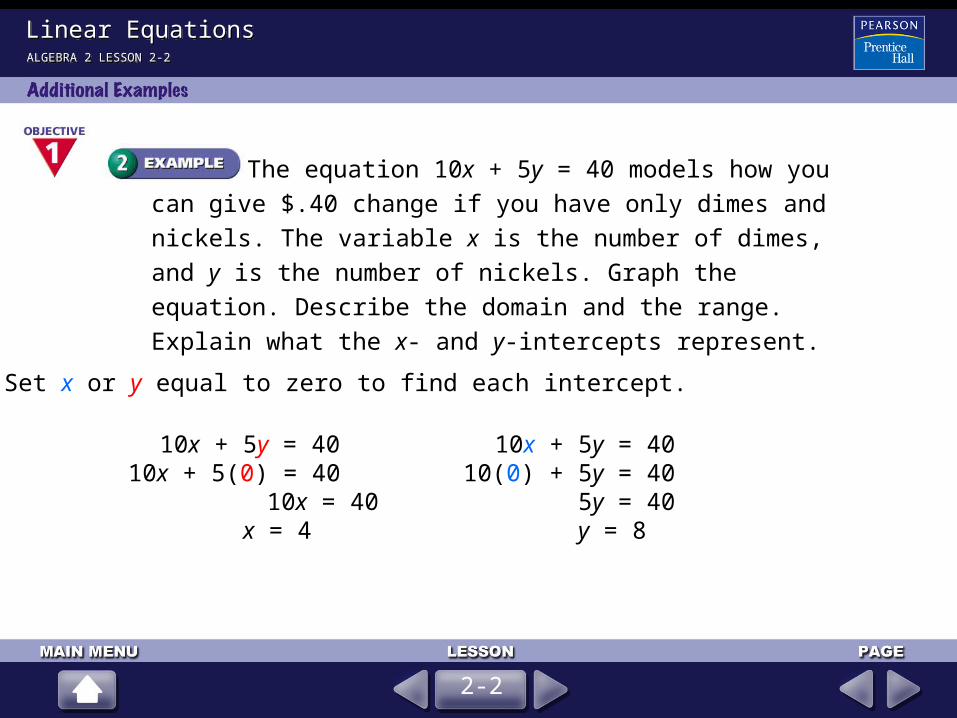
Use the intercepts to graph the equation.
The number of dimes and the number of nickels must each be a whole number.
The possible solutions for this situation are limited to those points on the line segment connecting (0, 8) and (4, 0) whose x- and y-coordinates are whole numbers.
Therefore, the domain is {0, 1, 2, 3, 4} and the range is {0, 2, 4, 6, 8}.
2-2
ALGEBRA 2 LESSON 2-2ALGEBRA 2 LESSON 2-2
Linear EquationsLinear Equations
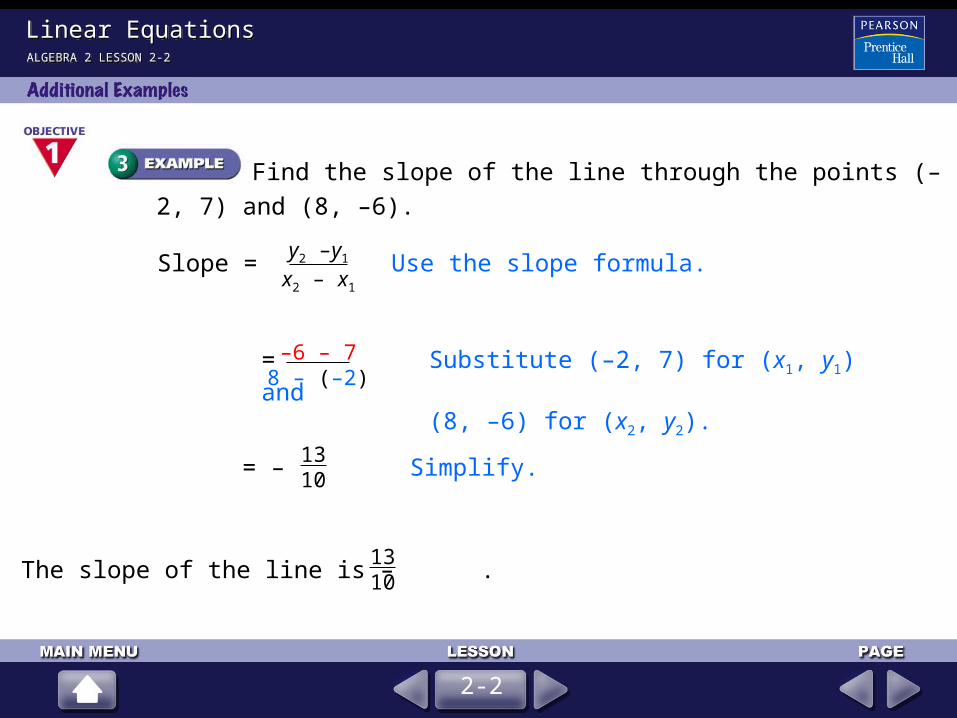
Find the slope of the line through the points (–2, 7) and (8, –6).
Slope = Use the slope formula.y2 –y1
x2 – x1
= Substitute (–2, 7) for (x1, y1) and (8, –6) for (x2, y2).
–6 – 78 – (–2)
2-2
= – Simplify.1310
The slope of the line is – .1310
ALGEBRA 2 LESSON 2-2ALGEBRA 2 LESSON 2-2
Linear EquationsLinear Equations
Write in standard form an equation of the line with slope 3
through the point (–1, 5).
y – y1 = m(x – x1) Use the point-slope equation.
y – 5 = 3[x – (–1)] Substitute 3 for m, 5 for y1, and –1 for x1.
y – 5 = 3[(x + 1)] Simplify.
y – 5 = 3x + 3 Distributive Property
3x – y = –8 Write in standard form.
2-2
ALGEBRA 2 LESSON 2-2ALGEBRA 2 LESSON 2-2
Linear EquationsLinear Equations
Write in point-slope form an equation of the line through
(4, –3) and (5, –1).
y – y1 = m(x – x1) Write the point-slope equation.
y + 3 = 2(x – 4) Simplify.
You can also use (5, –1) for (x1, y1) and (4, –3) for (x2, y2).
This gives the equation y + 1 = 2(x – 5). Both equations define the same line.
y – y1 = (x – x1) Substitute the slope formula for m.y2 – y1
Write an equation of the line through (5, –3) and perpendicular
to y = 4x + 1. Graph both lines.
2-2
m = – Find the negative reciprocal of 4.14
y = mx + b Use slope-intercept form.
y = – x + b Slope is – .14
14
14–3 = – (5) + b Substitute (5, –3) for (x, y).
–3 = – + b Simplify.54
– = b Solve for b.74
y = – x – Write the equation.14
74
Linear EquationsLinear EquationsALGEBRA 2 LESSON 2-2ALGEBRA 2 LESSON 2-2
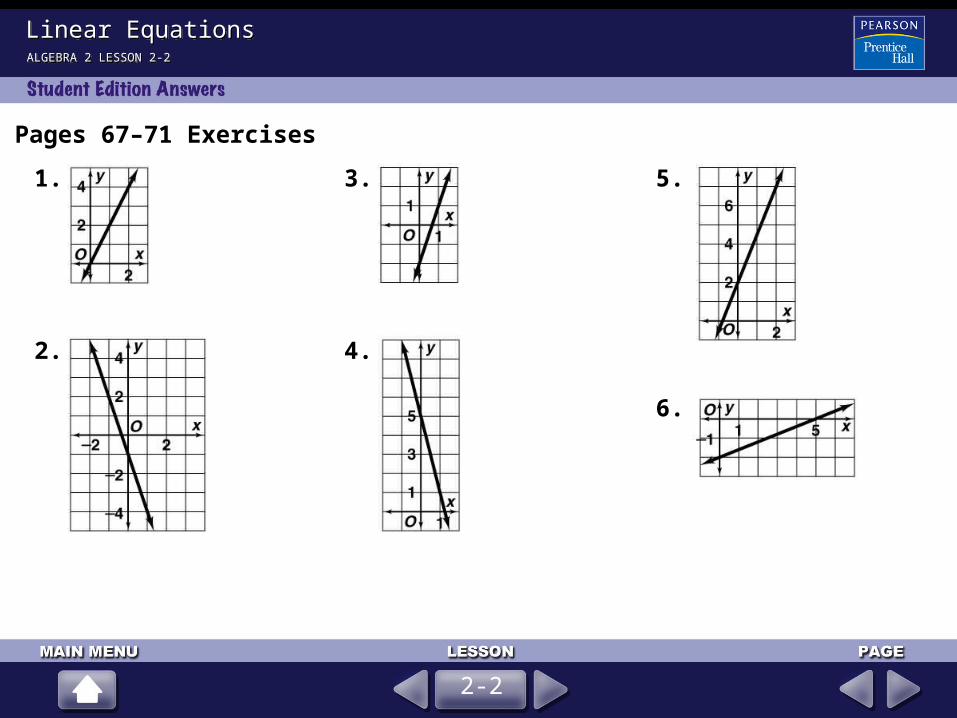
Pages 67–71 Exercises
1.
2.
3.
4.
5.
6.
2-2
Linear EquationsLinear EquationsALGEBRA 2 LESSON 2-2ALGEBRA 2 LESSON 2-2
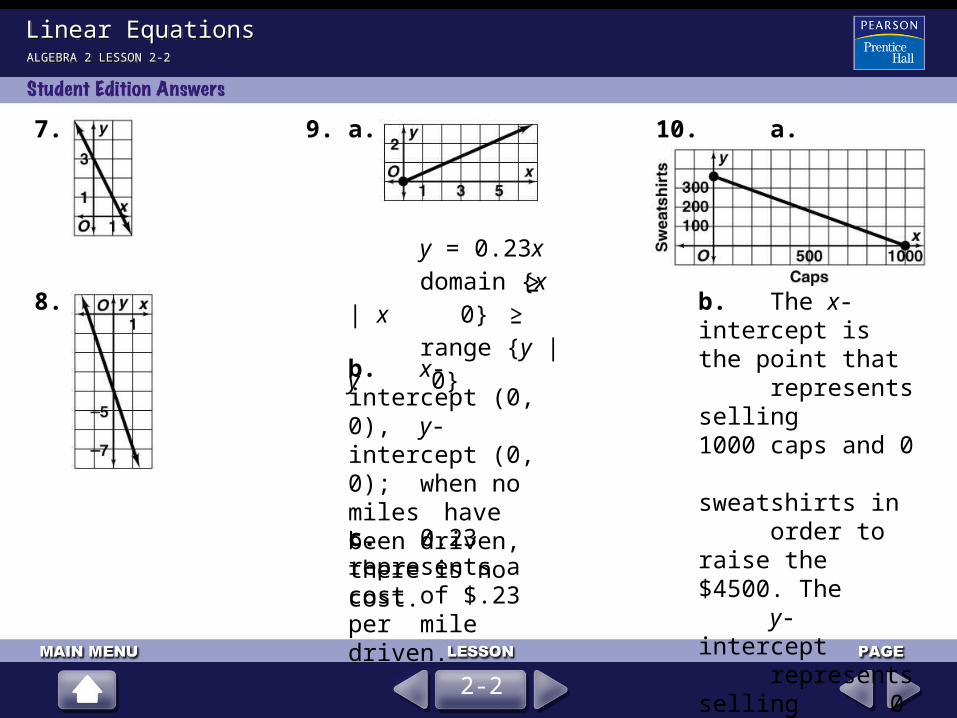
7.
8.
9. a.
y = 0.23xdomain {x | x
0}range {y | y
0}
10. a.
b. The x-intercept is the point that represents selling
1000 caps and 0 sweatshirts in
order to raise the $4500. The
y-intercept represents
selling 0 caps and 360 sweatshirts to
raise the $4500.2-2
>–>–
b. x-intercept (0, 0), y-intercept (0, 0); when no miles have been driven, there is no cost.c. 0.23 represents a cost of $.23 per mile driven.
Linear EquationsLinear EquationsALGEBRA 2 LESSON 2-2ALGEBRA 2 LESSON 2-2
11. –1
12. –2
13. 3
14.
15. –
16. 1
17. undefined
18. 0
19.
411
15
175
20. 3x – y = –2
21. x – y =
22. x + y = –
23. y = –2
24. x + y = 2
25. 5x – y = –2
26. y – 3 = –1(x + 10)27. y – 0 = (x – 1)
28. y – 10 = – (x + 4)
56
193
35
125
54
52
29. y + 1 = – (x – 0)
30. y – 11 = 1(x – 7)31. y – 9 = – (x – 1)
32. –5
33.
34. –
35. –
36.
37. 0
43
75
32
12
AB
AB
2-2
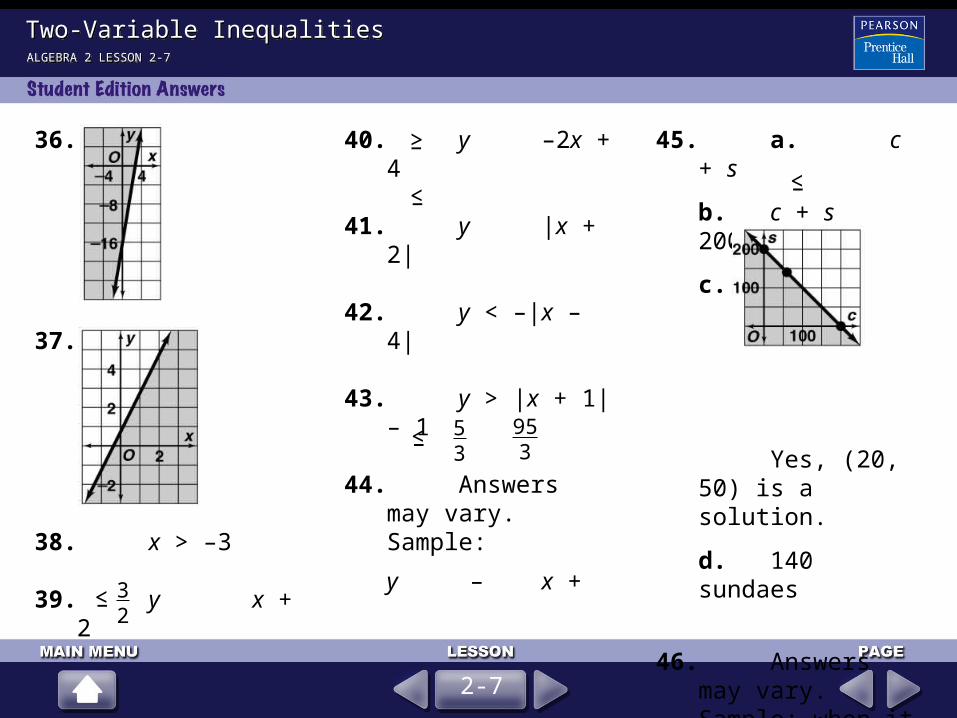
40. y = 10
41. x = 1
Linear EquationsLinear EquationsALGEBRA 2 LESSON 2-2ALGEBRA 2 LESSON 2-2
38. y = –3x – 5
39. y = x +52
132
42.
43.
44.
2-2
Linear EquationsLinear EquationsALGEBRA 2 LESSON 2-2ALGEBRA 2 LESSON 2-2
45.
46.
47.
48.
49.
50.
51.
52.
13
23
53. –
54. , (0, 4), (–6, 0)55. –1, (0, 1000),
(1000, 0)
56. , 0, – , , 0
57. 5, (0, –1), , 0
58. undefined slope, no y-intercept, (–3, 0)
59. 0, (0, 0), all pts. onx-axis
14
23
RS
TS
TR
15
2-2
Linear EquationsLinear EquationsALGEBRA 2 LESSON 2-2ALGEBRA 2 LESSON 2-2
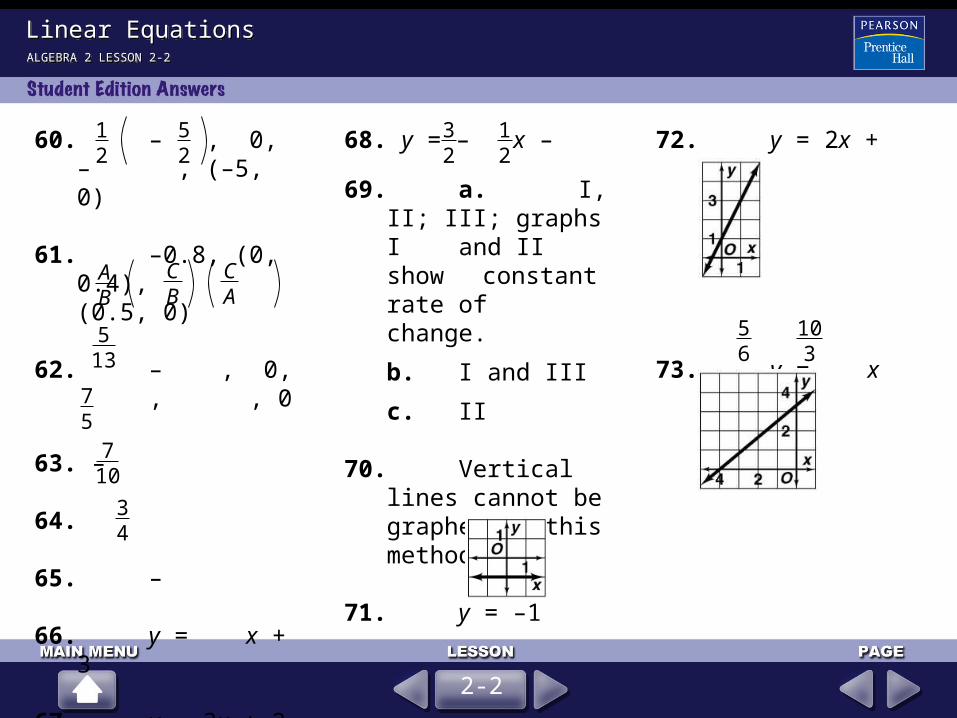
60. – , 0, – , (–5, 0)
61. –0.8, (0, 0.4), (0.5, 0)
62. – , 0, , , 0
63. –
64.
65. –
66. y = x + 3
67. y = 3x + 2
AB
CB
CA
12
52
513
75
710
34
68. y = – x –
69. a. I, II; III; graphs I and II show
constant rate of change.
b. I and III
c. II
70. Vertical lines cannot be graphed by this method.
71. y = –1
72. y = 2x + 1
73. y = x + 56
103
2-2
32
12
Linear EquationsLinear EquationsALGEBRA 2 LESSON 2-2ALGEBRA 2 LESSON 2-2
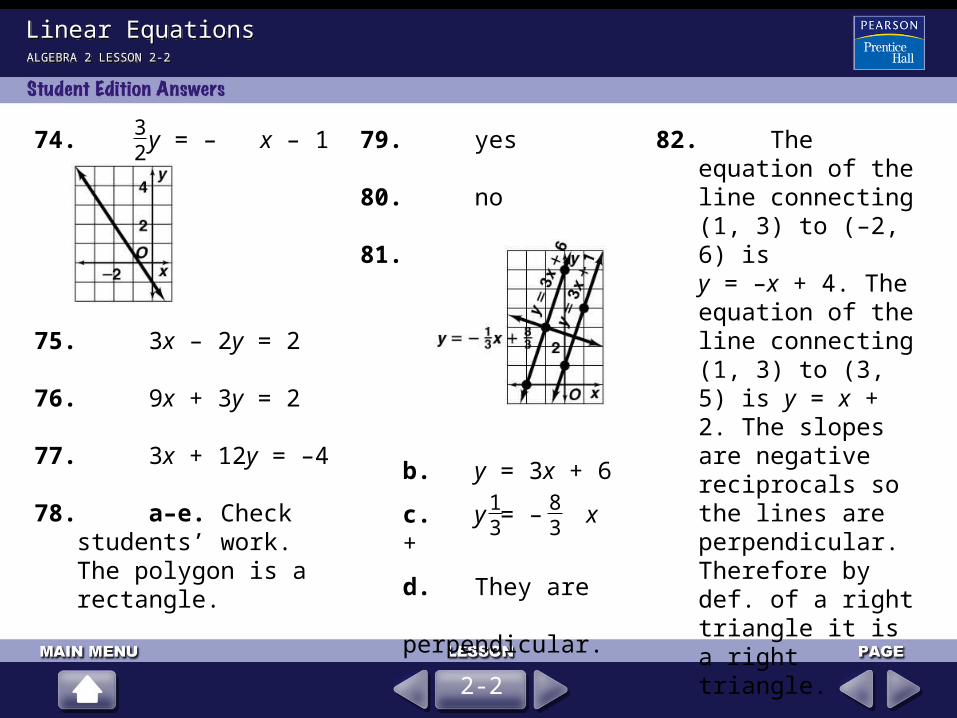
74. y = – x – 1
75. 3x – 2y = 2
76. 9x + 3y = 2
77. 3x + 12y = –4
78. a–e. Check students’ work. The polygon is a rectangle.
32
79. yes
80. no
81. a.
b. y = 3x + 6
c. y = – x +
d. They are perpendicular.
13
83
82. The equation of the line connecting (1, 3) to (–2, 6) is y = –x + 4. The equation of the line connecting (1, 3) to (3, 5) is y = x + 2. The slopes are negative reciprocals so the lines are perpendicular. Therefore by def. of a right triangle it is a right triangle.
2-2
Linear EquationsLinear EquationsALGEBRA 2 LESSON 2-2ALGEBRA 2 LESSON 2-2
83. The slope of the line connecting (2, 5) to
(4, 8) is , (2, 5) to
(5, 3) is – , (4, 8) to
(7, 6) is – , and
(5, 3) to (7, 6) is .
Since the adjacent sides’ slopes are negative reciprocals they are perpendicular. By the def. of a rectangle, it is a rectangle.
32
2323
32
84. p: y = 4x + 16
q: y = – x +
r : y = 4
85. A
86. G
87. C
88. B
14
134
89. C
90. B
91. domain {–2, 1, 2, 3, 4}, range {–2, –1, 2, 3}; not a function
92. domain {all reals}, range {all reals}; function
93. domain {–3, 0, 1, 7}, range {–10, –5, –1, 3}; not a function
2-2
Linear EquationsLinear EquationsALGEBRA 2 LESSON 2-2ALGEBRA 2 LESSON 2-2
94. Commutative Prop. of Add.
95. multiplicative inverses
96. Distributive Prop.
97. additive inverses, additive identity
98. studio: $6.26; designer: $9.39
2-2
ALGEBRA 2 LESSON 2-2ALGEBRA 2 LESSON 2-2
Linear EquationsLinear Equations
1. Find the slope of the line through the points (–5, –1) and (2, 3).
2. Write an equation in standard form for the line with slope 3 through (9, –4).
3. Write in point-slope form an equation of the line through the points (–3, 8) and (7, 6). Use (–3, 8) as the point for the equation.
4. Write the equation 3x – 12y = 6 in slope-intercept form.
5. What is the slope of a line perpendicular to y = x – 7? What is the slope of a line parallel to y = x – 7?
3x – y = 31
232
3
2-2
47
y – 8 = – (x + 3)15
y = x –14
12
32
23;–
Direct VariationDirect Variation
(For help, go to Lesson 1-3 and Skills Handbook page 844.)
ALGEBRA 2 LESSON 2-3ALGEBRA 2 LESSON 2-3
Solve each equation for y.
1. 12y = 3x 2. 12y = 5x 3. y = 15
4. 0.9y = 27x 5. 5y = 35
6. 7. 8. 9. 14
28
25
1236
2024
3036
615
924
Tell whether each equation is true.
2-3
34
Direct VariationDirect VariationALGEBRA 2 LESSON 2-3ALGEBRA 2 LESSON 2-3
Solutions
1. 12y = 3x
y = = =3x12
3 • x3 • 4
x4
2. 12y = 5x
y = = x5x12
512
5. 5y = 35
y = 7
3. y = 15
y = 15 = = 20
34
43
603
4. 0.9y = 27x
y = = 30x27x0.9
6.
1(8) 4(2)
8 = 8
true
14
28
2-3
Direct VariationDirect VariationALGEBRA 2 LESSON 2-3ALGEBRA 2 LESSON 2-3
2-3
Solutions (continued)
7.
2(15) 5(6)
30 = 30
true
25
615 8.
9(36) 24(12)
324 288
false
1236
924
9.
20(36) 24(30)
720 = 720
true
2024
3036
=/
Direct VariationDirect VariationALGEBRA 2 LESSON 2-3ALGEBRA 2 LESSON 2-3
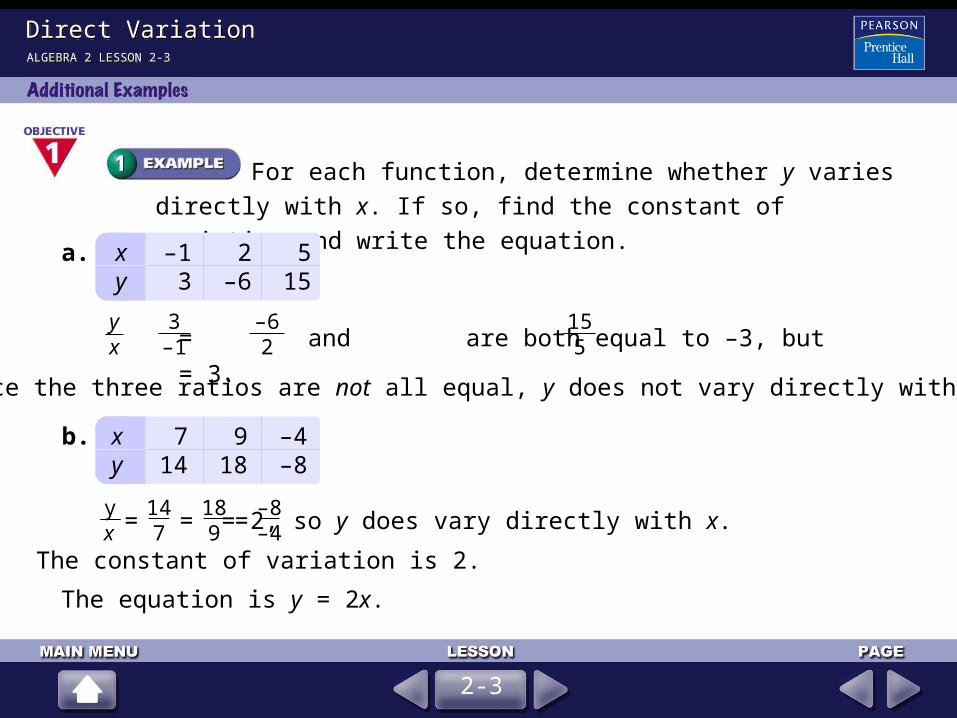
For each function, determine whether y varies directly with x.
If so, find the constant of variation and write the equation.
x –1 2 5y 3 –6 15
a.
Since the three ratios are not all equal, y does not vary directly with x.
x 7 9 –4y 14 18 –8
b.
The constant of variation is 2.
The equation is y = 2x.
2-3
= and are both equal to –3, but = 3. yx
3–1
–62
155
= 2, so y does vary directly with x.yx
147
189
–8–4= = =
Direct VariationDirect VariationALGEBRA 2 LESSON 2-3ALGEBRA 2 LESSON 2-3
For each function, tell whether y varies directly with x. If so,
find the constant of variation.
a. 3y = 7x + 7
Since you cannot write the equation in the form y = kx, y does not vary directly with x.
b. 5x = –2y
2-3
5x = –2y is equivalent to y = – x, so y varies directly with x.52
The constant of variation is – . 52
Direct VariationDirect VariationALGEBRA 2 LESSON 2-3ALGEBRA 2 LESSON 2-3
The perimeter of a square varies directly as the length of a
side of the square. The formula P = 4s relates the perimeter to the
length of a side.
a. Find the constant of variation.
The equation P = 4s has the form of a direct variation equation with k = 4.
b. Find how long a side of the square must be for the perimeter to be 64 cm.
P = 4s Use the direct variation.
64 = 4s Substitute 64 for P.
16 = s Solve for s.
The sides of the square must have length 16 cm.
2-3
Direct VariationDirect VariationALGEBRA 2 LESSON 2-3ALGEBRA 2 LESSON 2-3
Suppose y varies directly with x, and y = 15 when x = 27.
Find y when x = 18. Let (x1, y1) = (27, 15) and let (x2, y2) = (18, y).
15(18) = 27(y) Write the cross products.
y = 10 Simplify.
Write a proportion.y1
x1
y2
x2
=
Substitute.=1527
y18
2-3
y = Solve for y.15 • 18
27
Direct VariationDirect Variation
Pages 74–77 Exercises
1. yes; k = 2, y = 2x2. yes; k = –3, y = –3x
3. no
4. yes; k = , y = x
5. yes; k = 7, y = 7x6. no
7. yes; k = –2, y = –2x
8. no
9. yes; k = 12
10. yes; k = 6
11. yes; k = –2
12. no
13. no
14. yes; k = –5
15. yes; k = 6
16. no
13
13
17. k = ; –
18. k = – ;
19. k = –1; 5
20. k = 2; –10
21. k = – ; 21
22. k = – ; 1
23. a. k =
b. s = h
c. 23 ft 1 in.
27
ALGEBRA 2 LESSON 2-3ALGEBRA 2 LESSON 2-3
107
53
253
174
14
14
14
13361336
2-3
Direct VariationDirect Variation
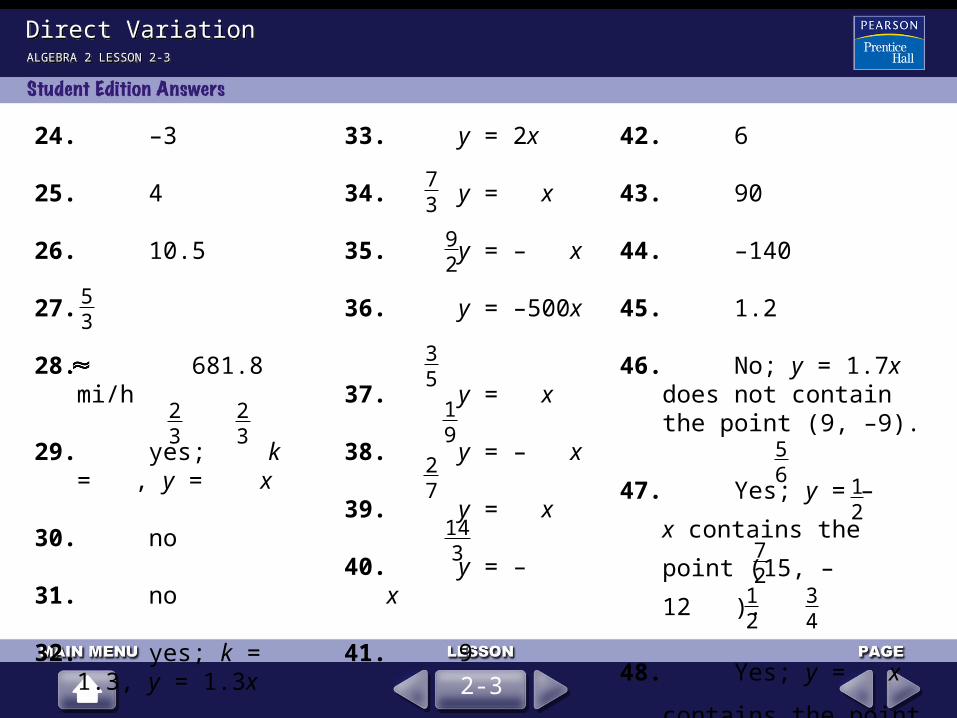
24. –3
25. 4
26. 10.5
27.
28. 681.8 mi/h
29. yes; k = , y = x
30. no
31. no
32. yes; k = 1.3, y = 1.3x
ALGEBRA 2 LESSON 2-3ALGEBRA 2 LESSON 2-3
53
23
23
33. y = 2x
34. y = x
35. y = – x
36. y = –500x
37. y = x
38. y = – x
39. y = x
40. y = – x
41. 9
73
92
35
19
27
143
42. 6
43. 90
44. –140
45. 1.2
46. No; y = 1.7x does not contain the point (9, –9).
47. Yes; y = – x contains
the point (15, –12 ).
48. Yes; y = x contains the
point (6 , 22 ).
56 1
2
72
12
34
2-3
Direct VariationDirect Variation
49. Answers may vary. Sample: y = 0.5x
50. Answers may vary. Sample: y = 3.2x
51. Answers may vary. Sample: y = – x
ALGEBRA 2 LESSON 2-3ALGEBRA 2 LESSON 2-3
34
52. a. y = 28xb. 103.6 mic. 417.9 gald. $0.056/mi
53. Answers may vary. Sample: No; y = 0 passes through the origin, but is not a direct variation.
54. Answers may vary. Sample: If y varies directly with x2, and y = 2 when x = 4,
then y = 10 when
x = 9.
18
55. y is doubled.
56. y is halved.
57. y is divided by 7.58. y is multiplied by 10.
59. a.
b. 32
c. z = kxy, x = k1w, so z = kk1wy,
z varies jointly with w and y.
60. B
12
2-3
Direct VariationDirect Variation
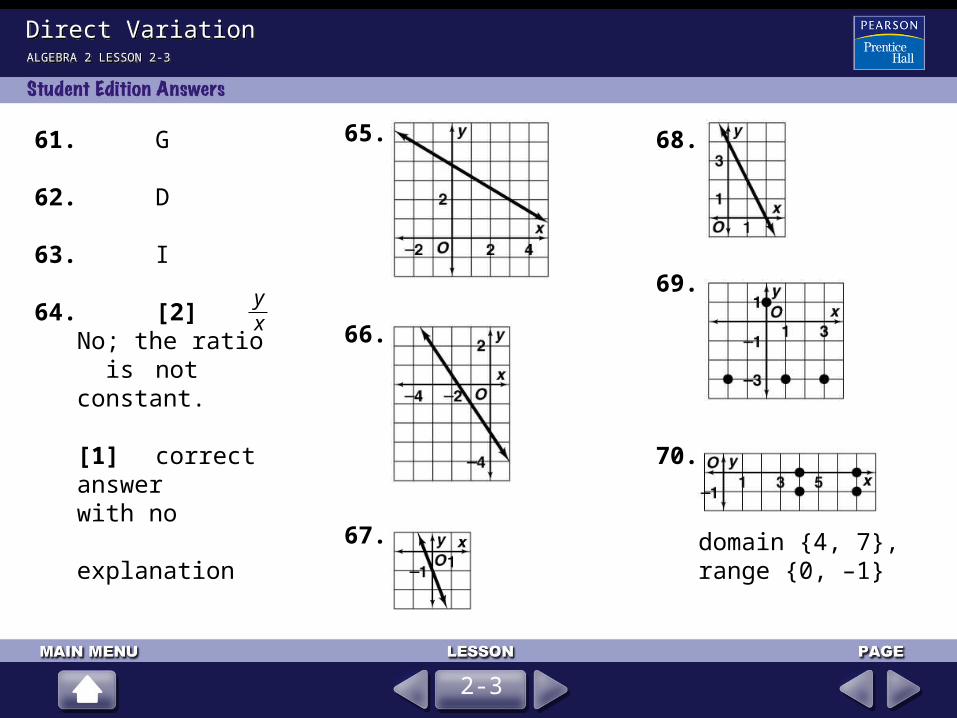
61. G
62. D
63. I
64. [2] No; the ratio is not constant.
[1] correct answer with no
explanation
ALGEBRA 2 LESSON 2-3ALGEBRA 2 LESSON 2-3
65.
66.
67.
68.
69.
70.
domain {4, 7}, range {0, –1}
2-3
yx
72.
domain {1, 2, 3, 4}, range {7, 8, 9, 10}
Direct VariationDirect Variation
71.
domain {1, 2, 4, 5}, range {–2, –1, 1, 2}
ALGEBRA 2 LESSON 2-3ALGEBRA 2 LESSON 2-3
73. 72%
2-3
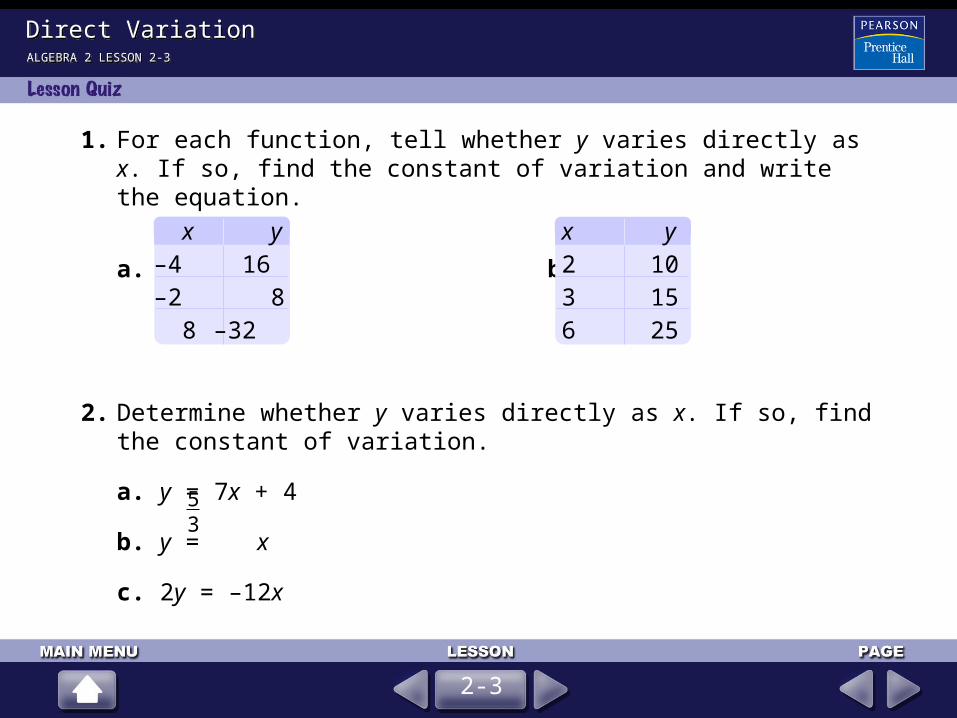
1. For each function, tell whether y varies directly as x. If so, find the constant of variation and write the equation.
a. b.
2. Determine whether y varies directly as x. If so, find the constant of variation.
a. y = 7x + 4
b. y = x
c. 2y = –12x
Direct VariationDirect VariationALGEBRA 2 LESSON 2-3ALGEBRA 2 LESSON 2-3
x y–4 16–2 8 8 –32
x y2 103 156 25
53
2-3
Direct VariationDirect VariationALGEBRA 2 LESSON 2-3ALGEBRA 2 LESSON 2-3
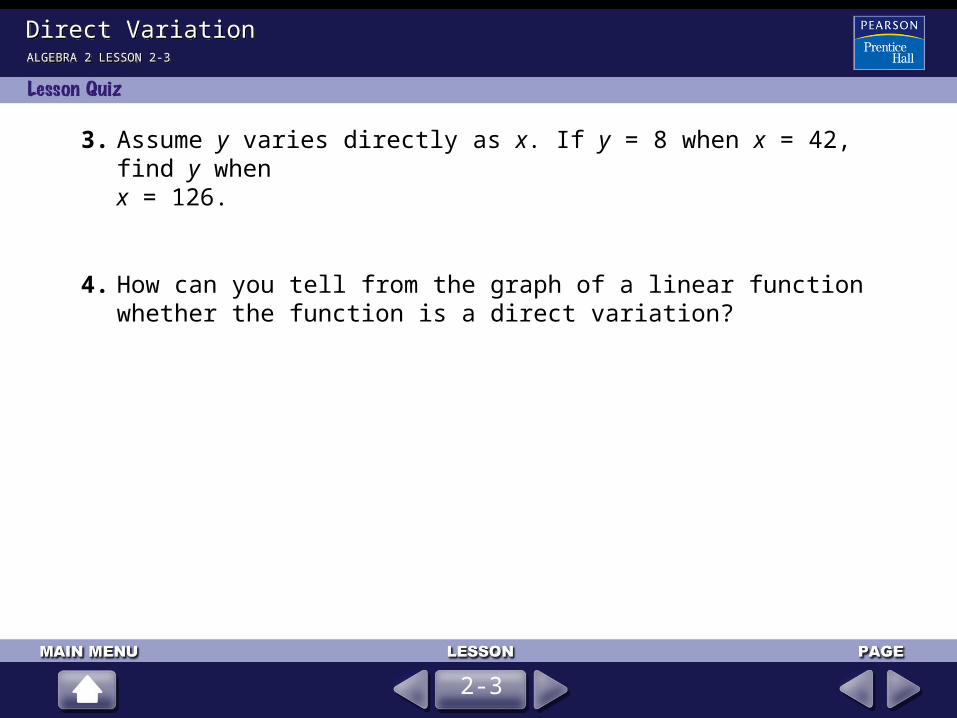
3. Assume y varies directly as x. If y = 8 when x = 42, find y when x = 126.
4. How can you tell from the graph of a linear function whether the function is a direct variation?
2-3
1. For each function, tell whether y varies directly as x. If so, find the constant of variation and write the equation.
a. b.
2. Determine whether y varies directly as x. If so, find the constant of variation.
a. y = 7x + 4
b. y = x
c. 2y = –12x
Direct VariationDirect VariationALGEBRA 2 LESSON 2-3ALGEBRA 2 LESSON 2-3
x y–4 16–2 8 8 –32
x y2 103 156 25
yes; –4; y = –4x
no
53
no
yes; –6
2-3
yes;53
Direct VariationDirect VariationALGEBRA 2 LESSON 2-3ALGEBRA 2 LESSON 2-3
If the graph is a non-horizontal line through the origin, then the linear function is a direct variation.
3. Assume y varies directly as x. If y = 8 when x = 42, find y when x = 126.
4. How can you tell from the graph of a linear function whether the function is a direct variation?
24
2-3
Using Linear ModelsUsing Linear Models
(For help, go to Lessons 2-1 and 2-2.)
ALGEBRA 2 LESSON 2-4ALGEBRA 2 LESSON 2-4
1. (–0.2, 9) and (3.4, 7.3) 2. (10, 17) and (11.5, 13.5)
3. (0, ) and (–1, )
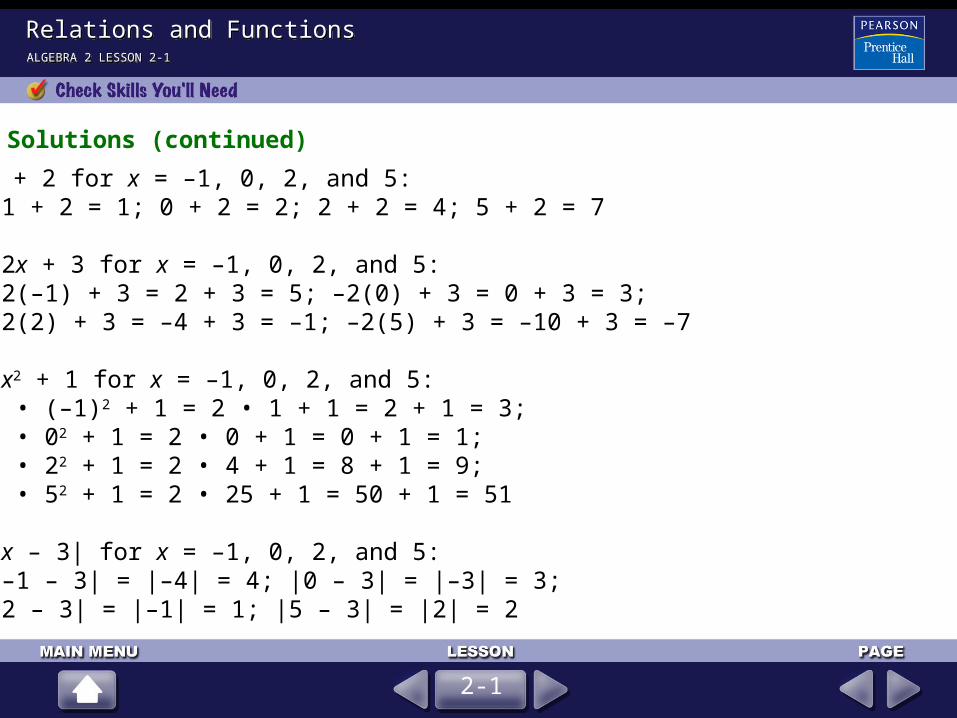
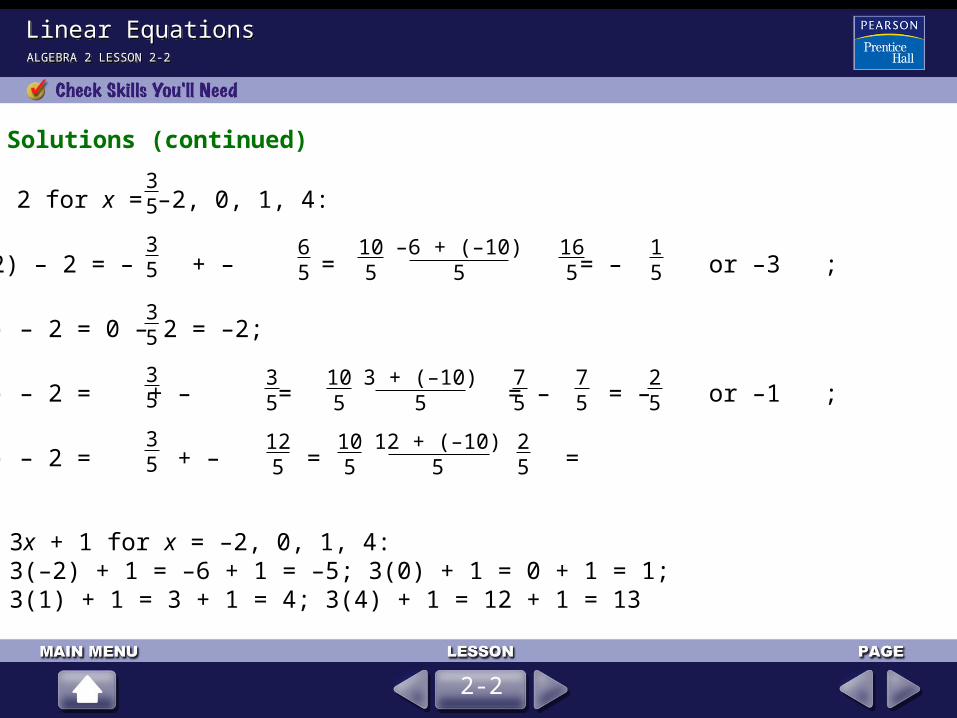
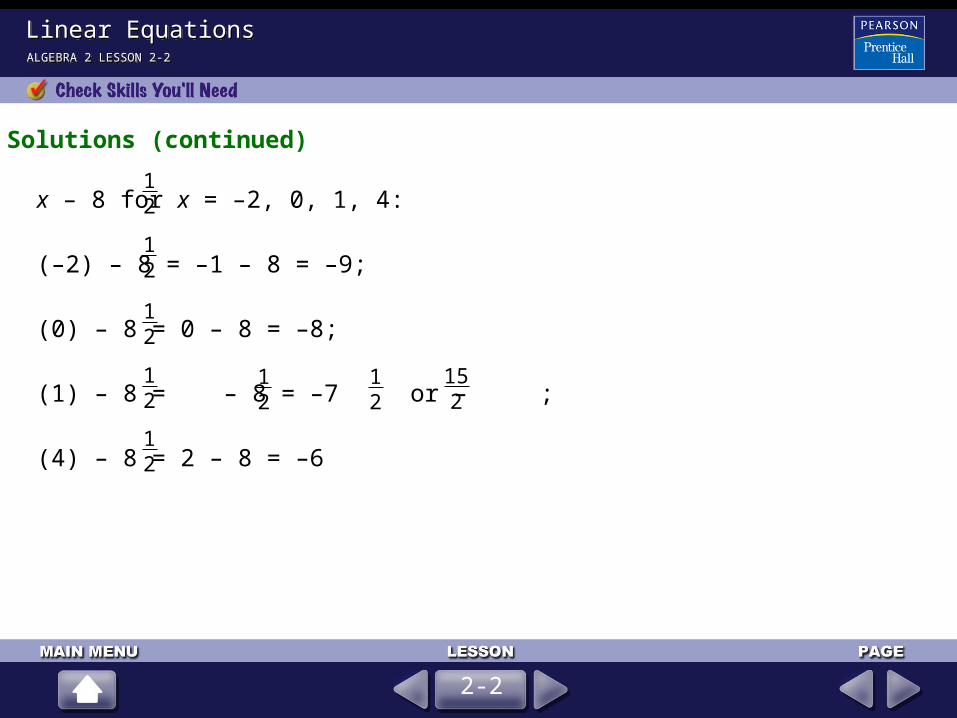
4. ƒ(x) = x – 2 for x = –3, 0,
5. g(x) = 3(2 – x) for x = 0, , 1
310
25
43
12
16
Find the change in x and the change in y between each pair of points.
Evaluate each function for the given values.
2-4
Using Linear ModelsUsing Linear ModelsALGEBRA 2 LESSON 2-4ALGEBRA 2 LESSON 2-4
1. (– 0.2, 9) and (3.4, 7.3)change in x: 3.4 – (–0.2) = 3.4 + 0.2 = 3.6change in y: 7.3 – 9 = –1.7
2. (10, 17) and (11.5, 13.5)change in x: 11.5 – 10 = 1.5change in y: 13.5 – 17 = –3.5
3. 0, and –1,
change in x: –1 – 0 = –1
change in y: – = – =
310
25
310
25
410
310
110
Solutions
2-4
Using Linear ModelsUsing Linear ModelsALGEBRA 2 LESSON 2-4ALGEBRA 2 LESSON 2-4
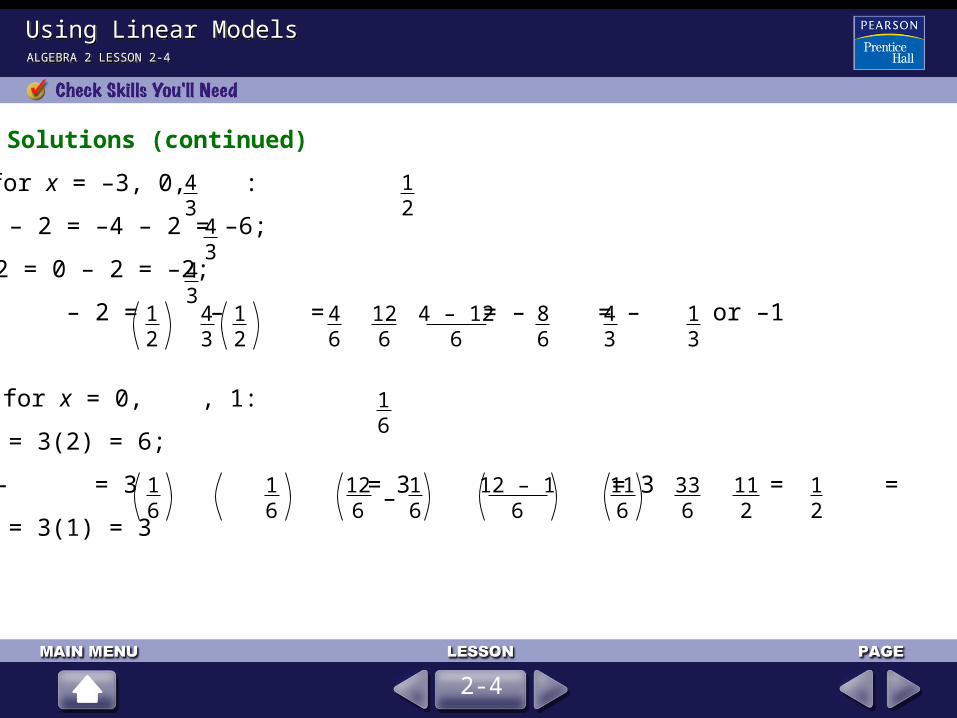
4. ƒ(x) = x – 2 for x = –3, 0, :
ƒ(–3) = (–3) – 2 = –4 – 2 = –6;
ƒ(0) = (0) – 2 = 0 – 2 = –2;
ƒ = – 2 = – = = – = – or –1
5. g(x) = 3(2 – x) for x = 0, , 1:
g(0) = 3(2 – 0) = 3(2) = 6;
g = 3 2 – = 3 = 3 = 3 = = or 5 ;
g(1) = 3(2 – 1) = 3(1) = 3
43
12
43
43
12
12
43
46
126
4 – 126
86
43
13
16
16
16
16
126 –
12 – 16
116
336
112
12
Solutions (continued)
2-4
Using Linear ModelsUsing Linear ModelsALGEBRA 2 LESSON 2-4ALGEBRA 2 LESSON 2-4
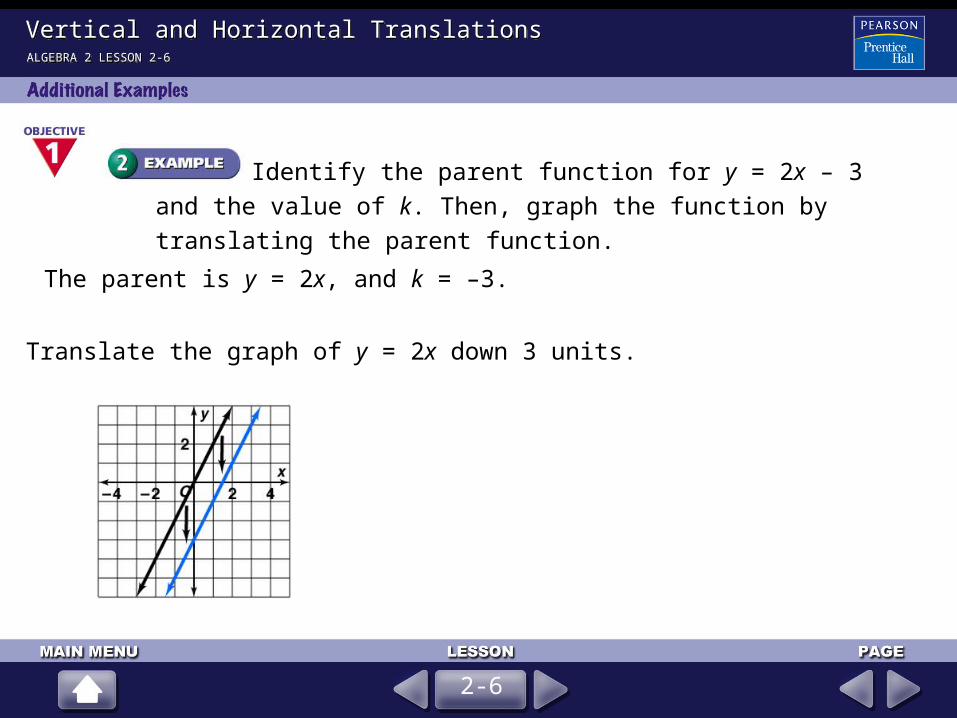
Suppose an airplane descends at a rate of 300 ft/min from
an elevation of 8000 ft.
Write and graph an equation to model the plane’s elevation as a function of the time it has been descending. Interpret the intercept at which the graph intersects the vertical axis.
Define: Let t = time (in minutes) since the plane began its descent.
Let d = the plane’s elevation.
Write: d = –300 • t + 8000
2-4
Using Linear ModelsUsing Linear ModelsALGEBRA 2 LESSON 2-4ALGEBRA 2 LESSON 2-4
(continued)
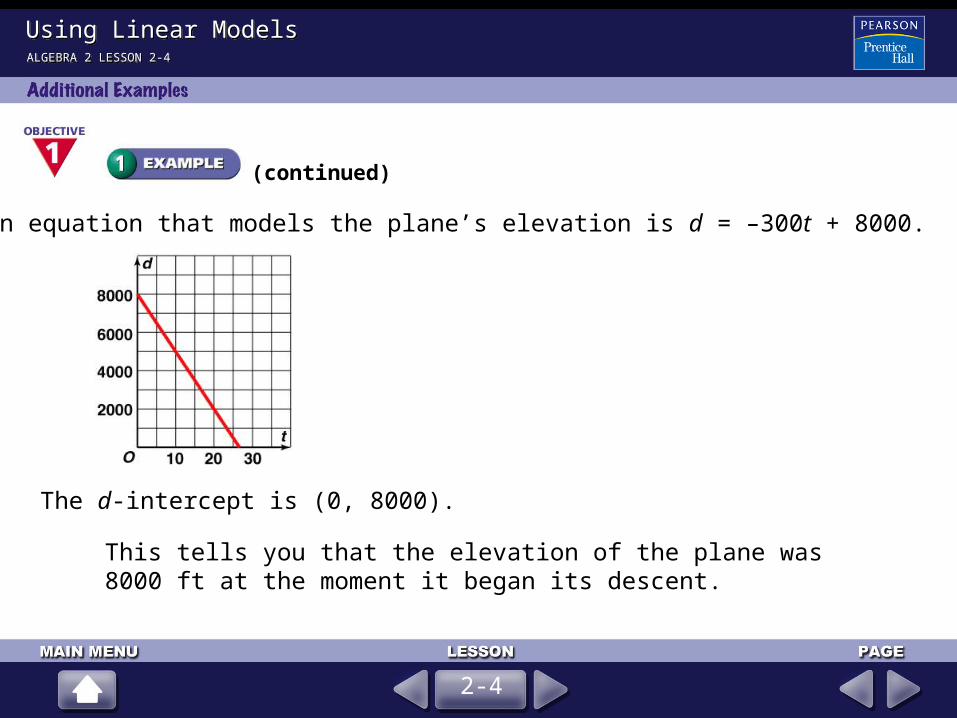
An equation that models the plane’s elevation is d = –300t + 8000.
The d-intercept is (0, 8000).
This tells you that the elevation of the plane was 8000 ft at the moment it began its descent.
2-4
Using Linear ModelsUsing Linear ModelsALGEBRA 2 LESSON 2-4ALGEBRA 2 LESSON 2-4
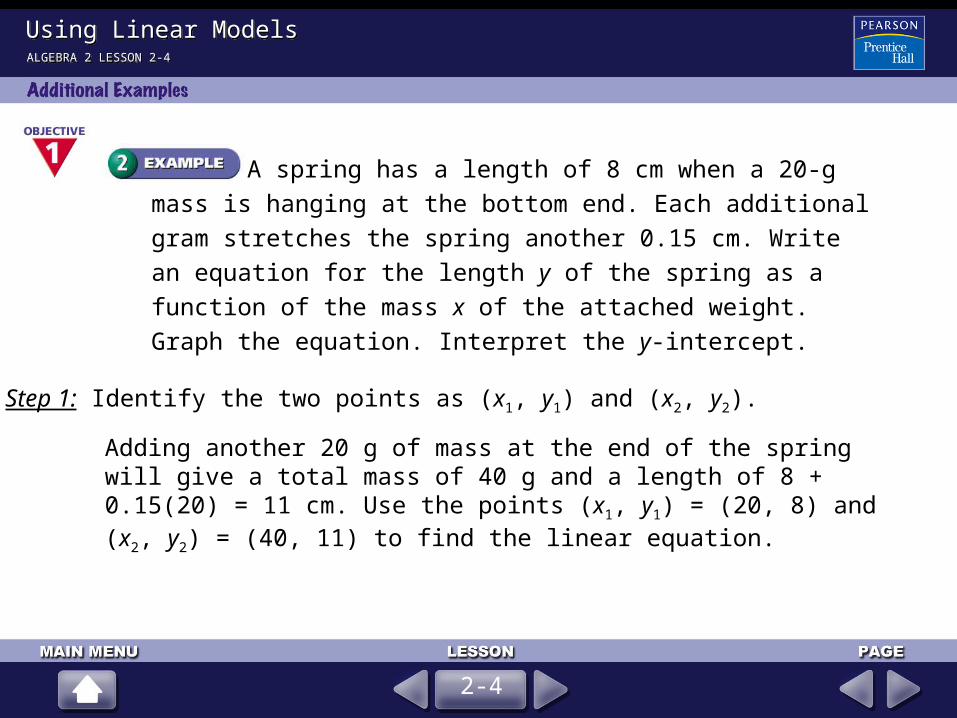
A spring has a length of 8 cm when a 20-g mass is hanging
at the bottom end. Each additional gram stretches the spring
another 0.15 cm. Write an equation for the length y of the spring as
a function of the mass x of the attached weight. Graph the equation.
Interpret the y-intercept.
Step 1: Identify the two points as (x1, y1) and (x2, y2).
Adding another 20 g of mass at the end of the spring will give a total mass of 40 g and a length of 8 + 0.15(20) = 11 cm. Use the points (x1, y1) = (20, 8) and (x2, y2) = (40, 11) to find the linear equation.
2-4
Using Linear ModelsUsing Linear ModelsALGEBRA 2 LESSON 2-4ALGEBRA 2 LESSON 2-4
(continued)
Step 2: Find the slope of the line.
m = Use the slope formula.
m = Substitute.
m = , or 0.15 Simplify.
y2 – y1
x2 – x1
11 – 840 – 20
320
Step 3: Use one of the points and the point-slope form to write an equation for the line.
y – y1 = m(x – x1) Use the point-slope form.
y – 8 = 0.15(x – 20) Substitute.
y = 0.15x + 5 Solve for y.
2-4
Using Linear ModelsUsing Linear ModelsALGEBRA 2 LESSON 2-4ALGEBRA 2 LESSON 2-4
(continued)
An equation of the line that models the length of the spring is y = 0.15x + 5.
The y-intercept is (0, 5). So, when no weight is attached to the spring, the length of the spring is 5 cm.
2-4
Using Linear ModelsUsing Linear ModelsALGEBRA 2 LESSON 2-4ALGEBRA 2 LESSON 2-4
Use the equation from Additional Example 2. What mass
would be needed to stretch the spring to a length of 9.5 cm?
y = 0.15x + 5 Write the equation.
9.5 = 0.15x + 5 Substitute 9.5 for y.
30 = x Simplify.
The mass should be 30 g.
2-4
= x Solve for x.9.5 – 5
0.15
Using Linear ModelsUsing Linear ModelsALGEBRA 2 LESSON 2-4ALGEBRA 2 LESSON 2-4
An art expert visited a gallery and jotted down her guesses
for the selling price of five different paintings. Then, she checked the
actual prices. The data points (guess, actual) show the results, where
each number is in thousands of dollars. Graph the data points.
Decide whether a linear model is reasonable. If so, draw a trend line
and write its equation.
{(12, 11), (7, 8.5), (10, 12), (5, 3.8), (9, 10)}
A linear model seems reasonable since the points fall close to a line.
Trend lines and equations may vary.
2-4
Using Linear ModelsUsing Linear ModelsALGEBRA 2 LESSON 2-4ALGEBRA 2 LESSON 2-4
(continued)
A possible trend line is the line through (6, 6) and (10.5, 11). Using
these two points to write an equation in slope-intercept form gives
y = x – .109
23
2-4
Using Linear ModelsUsing Linear ModelsALGEBRA 2 LESSON 2-4ALGEBRA 2 LESSON 2-4
Pages 81–84 Exercises
1. d = 62.5h + 15 2. a. y = –50t + 1000
b.
The y-intercept (0, 1000) represents the filled pool, and the t-intercept (20, 0) represents the time needed to empty the pool.
3. h = 8x + 60
4. y = x – 1; 5 leaves
5. y = 0.5x + 0.75; 3.25 lb
6. y = 58.3x – 3.3; 172 blades of grass
2-4
Using Linear ModelsUsing Linear ModelsALGEBRA 2 LESSON 2-4ALGEBRA 2 LESSON 2-4
7. y = 1.75x + 1.75; $8.40
8.
Linear model is reasonable; models may vary. Sample: y = –1.3x + 11
9.
Linear model is reasonable; models may vary. Sample: y = 2.6x – 0.6
10.
Linear model is reasonable; models may vary. Sample: y = –0.75x – 3.7
11.
not reasonable
2-4
Using Linear ModelsUsing Linear ModelsALGEBRA 2 LESSON 2-4ALGEBRA 2 LESSON 2-4
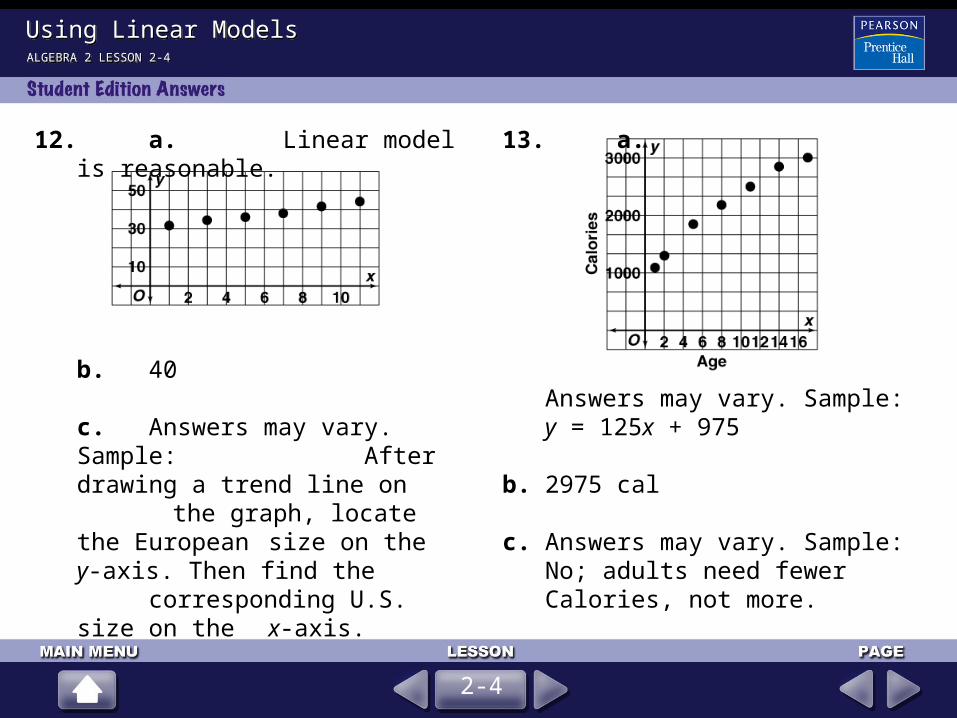
12. a. Linear model is reasonable.
b. 40
c. Answers may vary. Sample: After drawing a trend line
on the graph, locate the European size on the y-axis. Then find the corresponding U.S. size on the
x-axis.
13. a.
Answers may vary. Sample: y = 125x + 975
b. 2975 cal c. Answers may vary. Sample: No;
adults need fewer Calories, not more.
2-4
Using Linear ModelsUsing Linear ModelsALGEBRA 2 LESSON 2-4ALGEBRA 2 LESSON 2-4
14. a.
b–e. Answers may vary. Samples are given.
b. c = 0.04A
c. The model fits the data very closely.
d. No; the area of the tarp is 150 ft2 so the price should be $6.00.
e. 6 8 ft; $0.07
15. y = –4x + 10
16. y = –3x – 6
17. y = –7.5x – 2.5
18. y = 1.4375x – 7.33125
2-4
Using Linear ModelsUsing Linear ModelsALGEBRA 2 LESSON 2-4ALGEBRA 2 LESSON 2-4
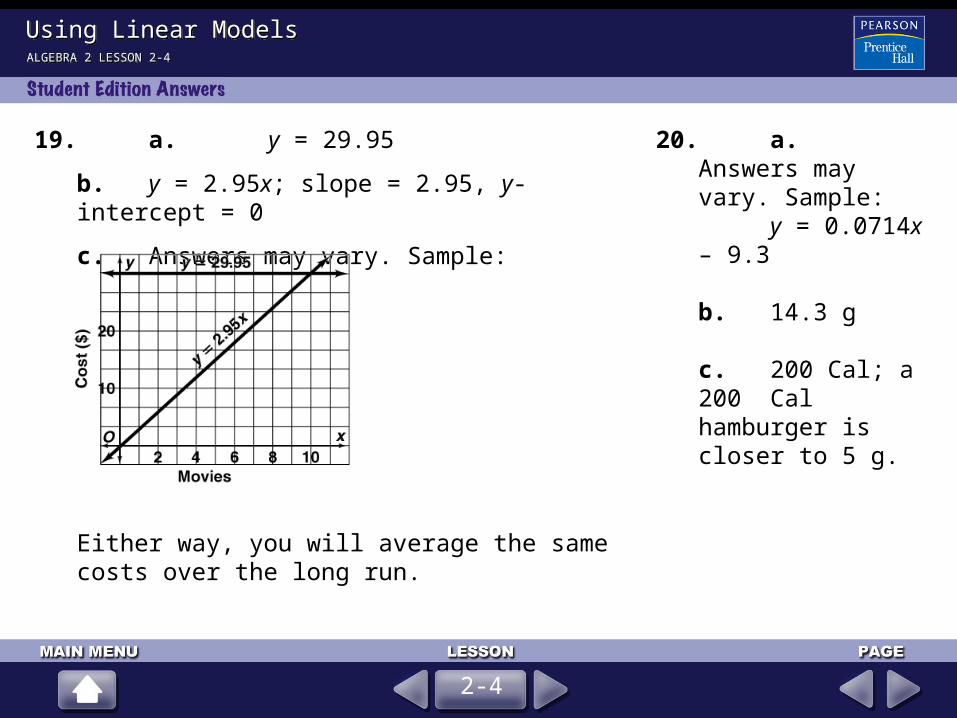
19. a. y = 29.95
b. y = 2.95x; slope = 2.95, y-intercept = 0
c. Answers may vary. Sample:
Either way, you will average the same costs over the long run.
20. a. Answers may vary. Sample:
y = 0.0714x – 9.3
b. 14.3 g
c. 200 Cal; a 200 Cal hamburger is closer to 5 g.
2-4
Using Linear ModelsUsing Linear ModelsALGEBRA 2 LESSON 2-4ALGEBRA 2 LESSON 2-4
21. a. population
b–c.
d. 2 million
e. Answers may vary. Sample: Strong; the points fall close to a straight line.
22.104.5
23.85.8
24.6.5
25.13
26.882
2-4
Using Linear ModelsUsing Linear ModelsALGEBRA 2 LESSON 2-4ALGEBRA 2 LESSON 2-4
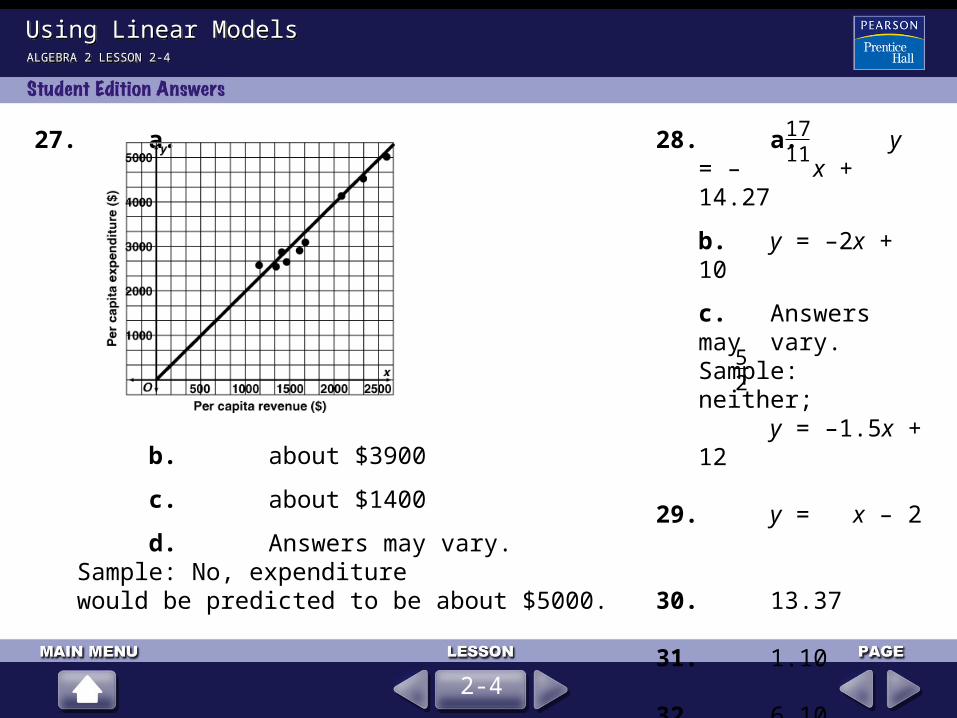
27. a.
b.about $3900
c. about $1400
d.Answers may vary. Sample: No, expenditure would be predicted to be about $5000.
28. a. y = – x + 14.27
b. y = –2x + 10
c. Answers may vary. Sample: neither; y = –1.5x + 12
29. y = x – 2
30. 13.37
31. 1.10
32. 6.10
33. 8.09
1711
52
2-4
Using Linear ModelsUsing Linear ModelsALGEBRA 2 LESSON 2-4ALGEBRA 2 LESSON 2-4
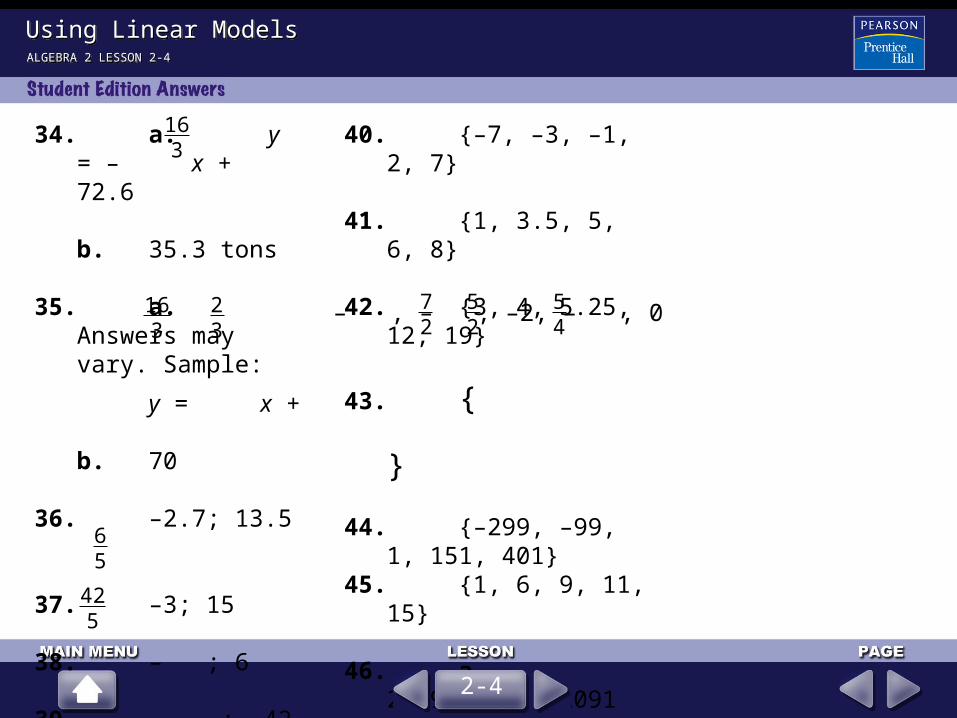
34. a. y = – x + 72.6
b. 35.3 tons
35. a. Answers may vary. Sample:
y = x +
b. 70
36. –2.7; 13.5
37. –3; 15
38. – ; 6
39. ; –42
163
163
23
65
425
40. {–7, –3, –1, 2, 7}
41. {1, 3.5, 5, 6, 8}
42. {3, 4, 5.25, 12, 19}
43. { }
44. {–299, –99, 1, 151, 401}
45. {1, 6, 9, 11, 15}
46. a. 20.91 ft/s; 2091 ft
b. d = 20.91t
c. 14.25 mi/h
– , – , –2, – , 072
52
54
2-4
Using Linear ModelsUsing Linear ModelsALGEBRA 2 LESSON 2-4ALGEBRA 2 LESSON 2-4
1. A family built a house in a beach resort area. In 1990, the house was 430 ft from the water. With erosion, the house was 400 ft from the water in 2000.
a. Assuming a linear relationship between the number of years x since 1990 and the distance y of the house from the water, write an equation for y as a function of x.
b. In what year will the house be only 250 ft from the water?
2. Graph the set of data. Decide whether a linear model is reasonable. If so, draw a trend line and write its equation.{(1, 2), (3, 3), (3, 3.75), (4, 4), (5, 3.25), (6, 4.5)}
y = –3x + 430
2050
A linear model seems reasonable; Answers may vary.Sample: y = 0.4x +2
2-4
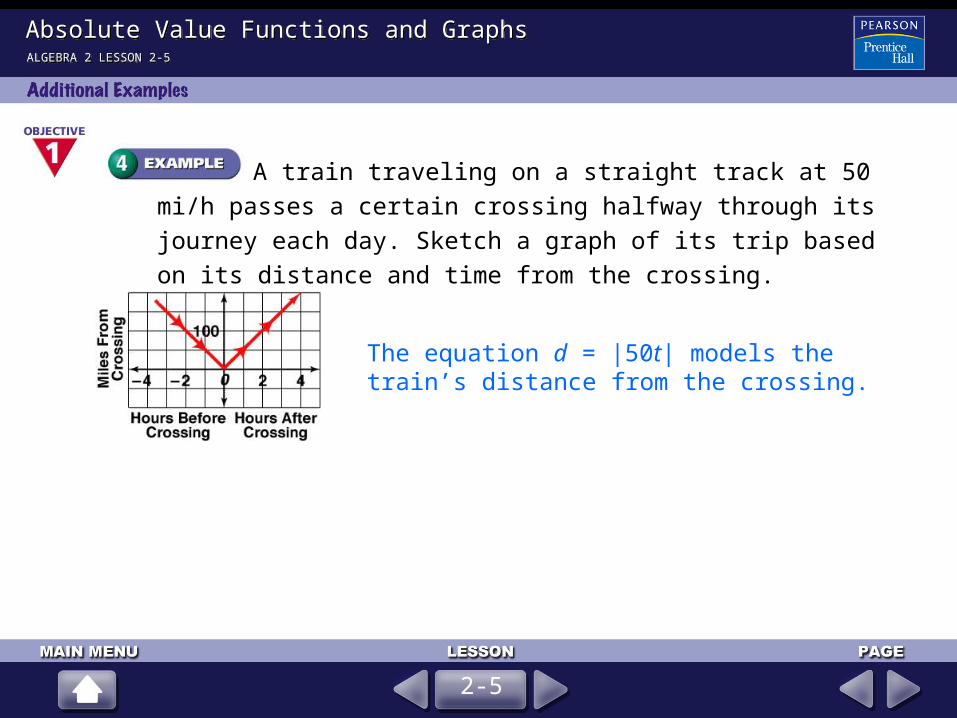
2-5
Absolute Value Functions and GraphsAbsolute Value Functions and GraphsALGEBRA 2 LESSON 2-5ALGEBRA 2 LESSON 2-5
(For help, go to Lesson 2-2 and Skills Handbook page 851.)
1. y = x for real numbers x and y 0
2. y = 2x – 4 for real numbers x and y 0
3. y = –x + 6 for real numbers x and y 3
Graph each equation for the given domain and range.
>–
<–
>–
Absolute Value Functions and GraphsAbsolute Value Functions and GraphsALGEBRA 2 LESSON 2-5ALGEBRA 2 LESSON 2-5
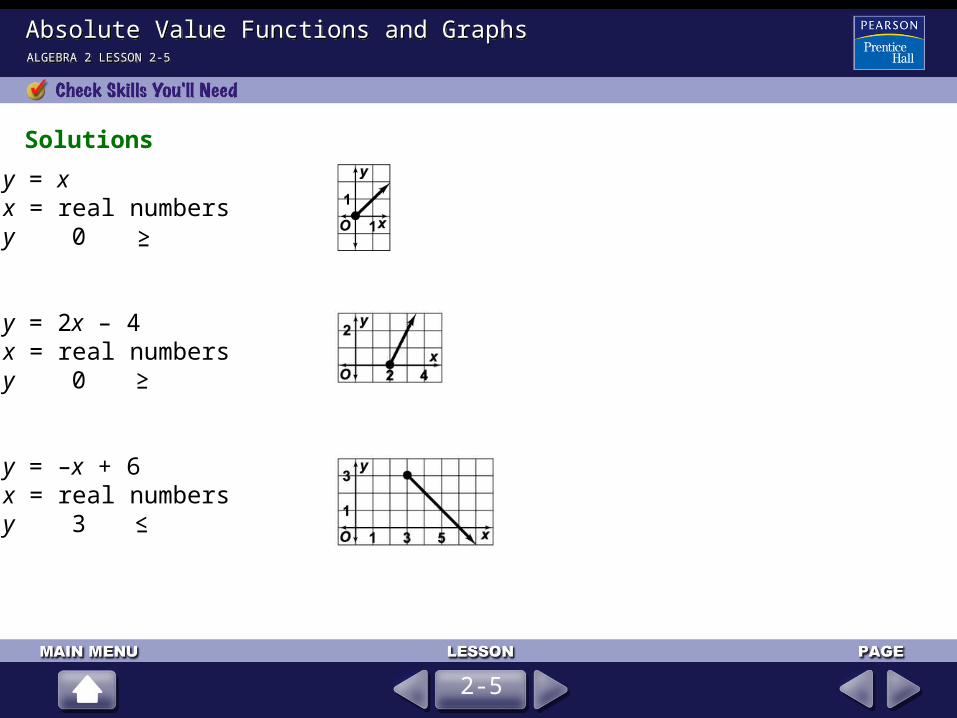
1. y = x x = real numbersy 0
2. y = 2x – 4 x = real numbersy 0
3. y = –x + 6 x = real numbersy 3
Solutions
2-5
>–
<–
>–
Absolute Value Functions and GraphsAbsolute Value Functions and GraphsALGEBRA 2 LESSON 2-5ALGEBRA 2 LESSON 2-5
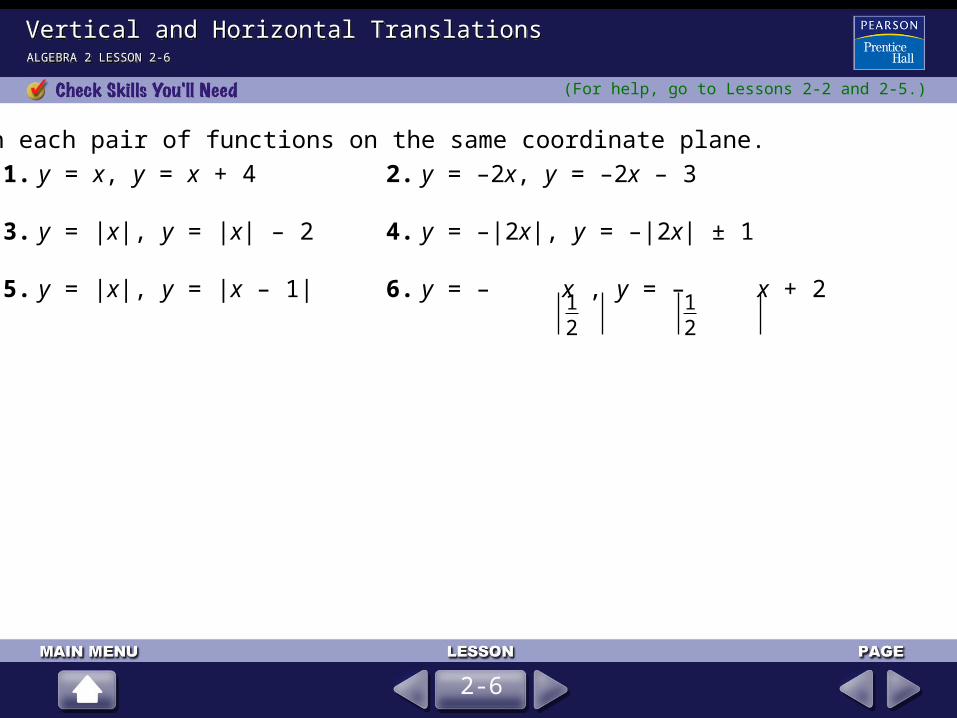
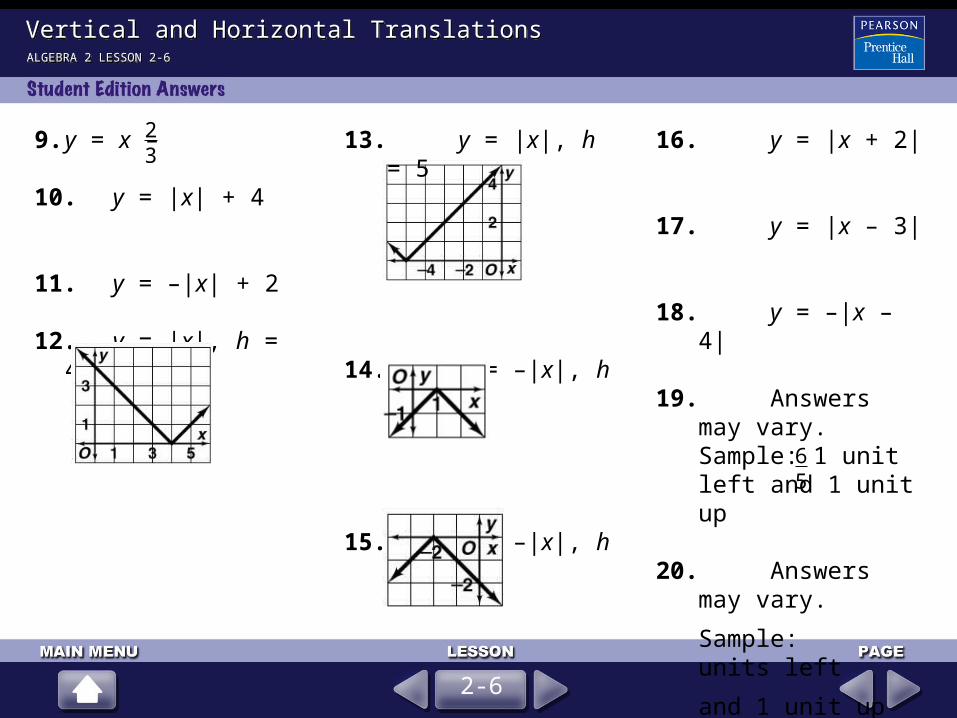
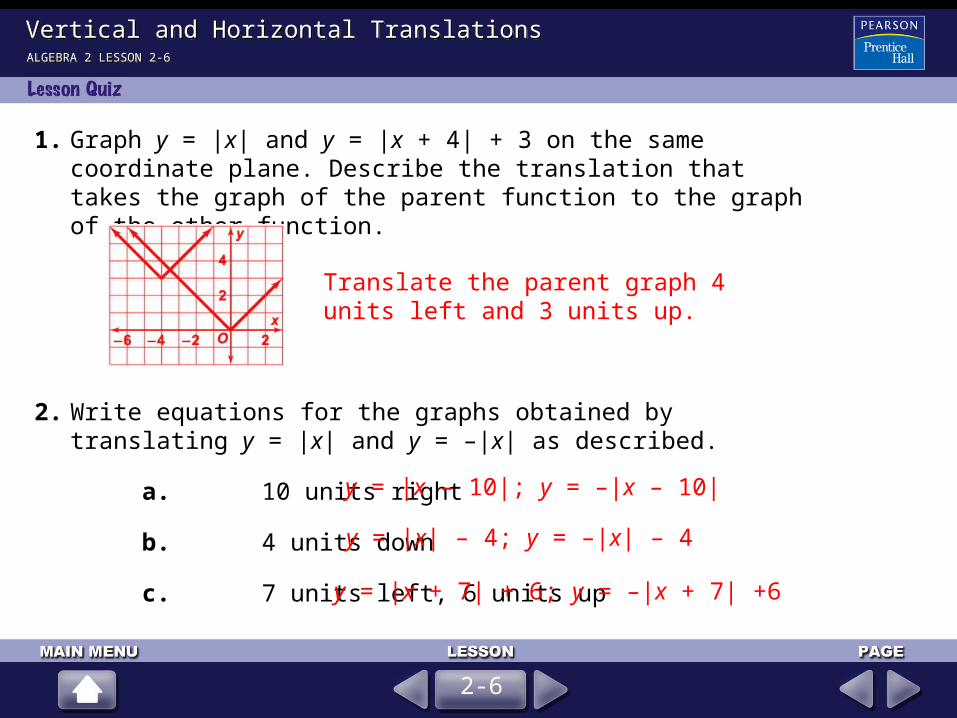
Vertical and Horizontal TranslationsVertical and Horizontal TranslationsALGEBRA 2 LESSON 2-6ALGEBRA 2 LESSON 2-6
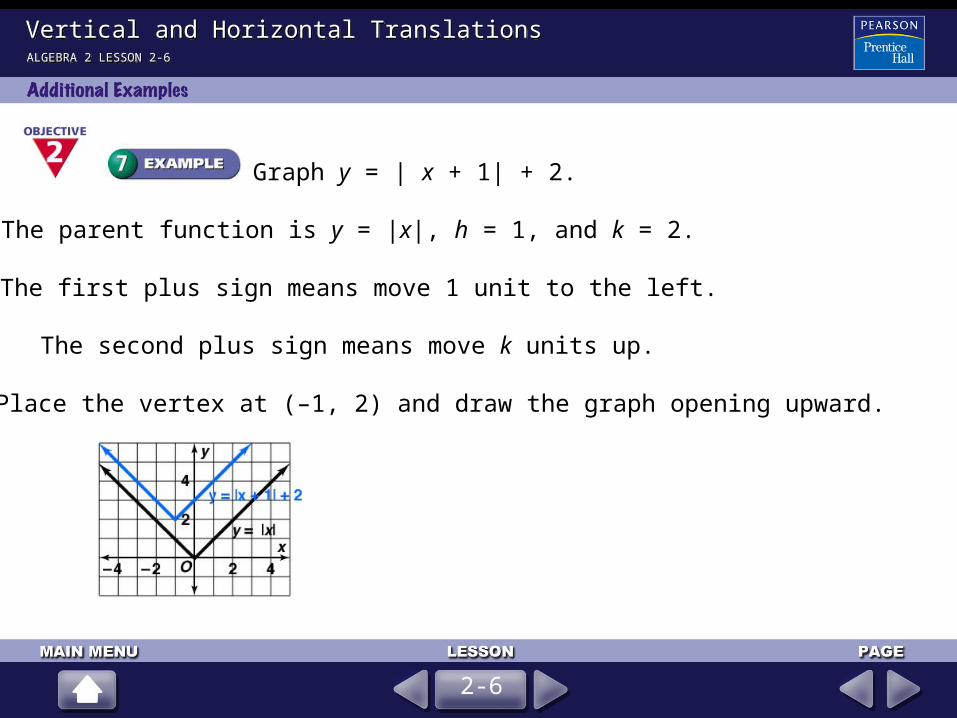
1. Graph y = |x| and y = |x + 4| + 3 on the same coordinate plane. Describe the translation that takes the graph of the parent function to the graph of the other function.
2. Write equations for the graphs obtained by translating y = |x| and y = –|x| as described.
a. 10 units right
b. 4 units down
c. 7 units left, 6 units up
Translate the parent graph 4 units left and 3 units up.
Step 2: Since the inequality is less than, y-values must be less than those on the boundary line. Shade the region below the boundary line.
All ordered pairs with whole-number coordinates in the shaded area and on the boundary line represent a combination of x orders of scrambled eggs and y orders of omelets that the restaurant could fill.
56. [2] y 300x, where y is the number of tornadoes that could occur in the next x years. The domain is all whole numbers greater than 0, since years are whole numbers and can’t be negative. The range is whole numbers 300,
since you cannot have a fraction of a tornado and in the first year you will have at least 300.
[1] includes only inequality with no explanation of domain and range