Page 1
1
RELATIONSHIP BETWEEN RATIONAL CHOICE RATIONALE FOR
ADOPTION OF BALANCED SCORECARD AND ORGANIZATIONAL
PERFORMANCE OF STATE CORPORATIONS IN KENYA
Joseph Ouma Osewe, Dr. Hazel Gachunga, Dr. Thomas Senaji and Prof.
Romanus Odhiambo
Page 2
European Journal of Business and Strategic Management
ISSN 2518-265X (Online)
Vol.3, Issue 1 No.1, pp 1 –14, 2018 www.iprjb.org
2
RELATIONSHIP BETWEEN RATIONAL CHOICE RATIONALE
FOR ADOPTION OF BALANCED SCORECARD AND
ORGANIZATIONAL PERFORMANCE OF STATE
CORPORATIONS IN KENYA
1*
Joseph Ouma Osewe *Post Graduate Student, Jomo Kenyatta University of Agriculture and Technology
* Corresponding Author’s Email: [email protected]
2 Dr. Hazel Gachunga
Lecturer, Jomo Kenyatta University of Agriculture and Technology, Kenya
3 Dr. Thomas Senaji
Lecturer, Kenya Methodist University, Kenya
4 Prof. Romanus Odhiambo
Lecturer, Jomo Kenyatta University of Agriculture and Technology, Kenya
Abstract
Purpose: The purpose of this study was to determine the relationship between rational choice
rationale for balanced scorecard (BSC) adoption and organizational performance of state
corporations in Kenya.
Methodology: The research design employed in this study was explanatory cross-sectional
survey research design. The target population for this study was the 32 State Corporations that
have implemented balanced scorecard. A sample size of 96 top and senior middle level managers
comprising of Managing Directors, Human Resource Directors, Finance Directors, Operations
Directors, or their equivalent designations in senior management were surveyed using semi-
structured questionnaires. The research adopted a quantitative approach.
Findings: The findings indicated that rational choice is a good predictor of organizational
performance of State Corporations in Kenya. The findings also showed that rational choice and
organizational performance had a positive and significant relationship.
Unique Contribution to Theory, Practice and Policy: In line with the findings, it is
recommended that organizational decision makers to take account of available information,
potential costs and benefits in determining whether to adopt or not adopt balanced scorecard, and
to be lucid in choosing the best choice of action.
Key words: Rational choice rationale, balanced scorecard adoption and organizational
performance.
Page 3
European Journal of Business and Strategic Management
ISSN 2518-265X (Online)
Vol.3, Issue 1 No.1, pp 1 –14, 2018 www.iprjb.org
3
1.0 INTRODUCTION
1.1 Background of the Study
Market competition for customers, inputs, and capital make organizational performance essential
to the survival and success of the modern business. As a consequence, organizational
performance has acquired a central role as the goal of modern organization. It is a recurrent
theme of great interest to both academic scholars and practicing managers. It is the most sought
outcome and common factor across organizations (Ongeti, 2014). Most studies in strategic
management conceptualize performance as a dependent variable and seek to identify variables
that explain variation in performance. It however, continues to be a contentious subject among
organizational researchers in terms of definition and measurement (Aosa & Machuki, 2011) as
various scholars and researchers define and conceptualize performance differently.
Hemming (2012) exemplifies that as companies around the world transform themselves for
competition based on information, their ability to exploit intangible assets has become far more
decisive than their ability to invest in and manage physical assets. This trend shows that the
development and the adoption of more sophisticated managerial innovation system such as the
balanced scorecard (BSC) used in planning, measuring and monitoring firm’s performances are
increasingly popular. In recent years, the use of the balanced scorecard and its variations not only
applies to privately owned commercial entities, but also to the public sector and non-commercial
entities (Lawson, Stration & Hatch, 2006; Kaplan, 2010). It is reported that more than 50% of the
Fortune 500 companies adopt the BSC or its variations as a main performance measurement and
strategic management tool (Gumbus, 2005).
Despite its widespread adoption and being touted by its proponents Kaplan and Norton as having
performance enhancing potential, the results are mixed and inconclusive. De Geuser, Mooraj and
Oyon (2009) indicate that it has proved difficult to document a strong relationship between
balanced scorecard use and performance. Norreklit, Mitchell and Bjornenak (2012), pointed out
that Kaplan and Norton’s balanced scorecard literature appeals to managers’ emotions instead of
logic.
However, Rigby and Bilodeu (2007) argue that the extremely high and successful spread of
balanced scorecard among thousands of organizations two decades after its inception is sufficient
evidence that implementing organizations are either satisfied with the concept or at least find
some aspects of the concept useful and beneficial to enhance performance. It was expected that
at the third decade since its conception, the concept of the balanced scorecard would have
matured and its application easily replicated across organizations, but this is not the case, there
have been as many unsuccessful implementations of the balanced scorecard as successful ones
(Parmenter, 2012)
These developments have prompted greater scrutiny of how and why managers cause their
organizations to adopt balanced scorecard and the implications of these on its effectiveness and
performance. Researchers typically distinguish between two types of explanations for reasons for
its adoption, one is the rational accounts behavior which assumes that organizations act
Page 4
European Journal of Business and Strategic Management
ISSN 2518-265X (Online)
Vol.3, Issue 1 No.1, pp 1 –14, 2018 www.iprjb.org
4
rationally, and adopt the balanced scorecard to improve performance or strategic control
(Abrahamson, 1996).
1.2 Statement of the Problem
The Kenyan government acknowledged that over the years there has been poor organizational
performance in State Corporations, especially in the management of public resources which has
hindered the realization of sustainable economic growth. As a result of this various strategies to
revive the economy have been embraced. In 1991, a State corporation reform strategy paper was
approved by the cabinet. Its content included the adoption of balanced scorecard as tool to
improve organizational performance of State Corporations (GoK, 2010).
Internationally, the balanced scorecard has seen widespread adoption as a tool to improve
organizational performance. Its adoption has been so rapid that it is labelled as one of the most
influential management instruments of the 20th century (Hoque, 2014). Its worldwide adoption
stands at 66%. Bloom and Van Reenen (2007) and Mol and Birkinshaw (2009) found that
management practice adoption associates with superior firm performance. A review of United
Kingdom competitiveness undertaken by Porter and Ketels (2003) suggests that low levels of
adoption of what they term best practice is a contributor to the United Kingdom productivity gap.
On the contrast, the results from adoption are mixed. This has prompted attention of management
researchers (Battisti & Iona, 2009; Bloom & Van Reenen, 2007; Chen & Huang, 2009; Mol &
Birkinshaw, 2009; Chalhoub, 2009; Wu, 2010). Neely (2008) found the balanced scorecard
having a positive impact on sales, gross profit and net profit, and its removal had negative impact
on the same, while Kraaijenbrink (2012) disagrees with practitioner oriented literature
suggestions that the balanced scorecard improves strategy awareness, communication, execution
and achievement.
BSC adoption is affected by multiple and diverse rationales. Norreklit et al,. (2012)
recommended research on the rationality behind balanced scorecard adoption, to answer why the
BSC seemingly has had a worldwide impact, and even stronger impact than most other
management concepts. Battisti and Iona (2009) found that traditional economic factors such as
firm size, ownership and market competition can only explain a limited proportion of the
variability of the adoption of management practices across firms, leading them to suggest it is
necessary to consider alternative explanations and question the firm’s rationality in its adoption
choices. Mol and Birkinshaw (2009) observed that scant research supports this topic. In
particular, the research sought to illuminate the relationship between rational choice rationale for
balanced scorecard adoption and organizational performance of State Corporations in Kenya.
1.3 Research Objective
The study sought to establish the relationship between rational choice rationale for balanced
scorecard adoption and organizational performance of State Corporations in Kenya.
Page 5
European Journal of Business and Strategic Management
ISSN 2518-265X (Online)
Vol.3, Issue 1 No.1, pp 1 –14, 2018 www.iprjb.org
5
2.0 LITERATURE REVIEW
2.1 Theoretical Literature Review
2.1.1 Rational Choice theory
Rational choice theory is an economic principle that states that individuals always make prudent
and logical decisions. These decisions provide people with the greatest benefit or satisfaction —
given the choices available — and are also in their highest self-interest (Levin & Milgrom,
2004). Rational choice intellectual position was secured in Thomas Hobbes’ Leviathan (1651).
Hobbes tried to explain the basic functioning of political institutions via individuals’ choices. He
conjectured choices stemmed from universally held ‘appetites’ and ‘aversions.’ The effort was
continued by such illustrious figures as Francis Hutcheson, David Hume, Adam Smith, and later
Utilitarian’s as Jeremy Bentham and John Stuart Mill. Others followed including many in
economics. These works spawned what has come to be thought of as classical rational choice
theory.
Adam Smith emphasized the potential social functionality of Hobbes’ simplifying assumption of
self-interest, famously asserting, in the Wealth of Nations (1776), that it is not from the
benevolence of the butcher, the brewer, or the baker that we expect our dinner, but from their
regard to their own interest. Utilitarian’s went on to formalize the link between individual choice
and social welfare via a reduction of moral content to an interpersonally comparable utility that
was seen as also motivating the individuals
Rational choice is concerned, with finding the best means to given ends; more specifically, in
the face of a decision-making situation, an actor considers a finite set of alternatives, ascribes
consequences to them, orders these consequences according to their importance and value, and
makes an optimal choice among available alternatives. The actor is assumed to know all
available alternatives, and chooses the best action or means to achieve her ends on the basis of
expectations about future consequences or outcomes of her choices.
It has had a wide range of applications: among others, operations research, decision engineering,
game theory, foundations of microeconomic theory, enterprise decisions about production,
output, investment, and technological change, personal choices about marriage, child-bearing,
crime, education; personal and household choices about consumption and savings, public policy
and public choice, group and organizational behavior in sociology; and criminology, deterrence
theory, and international relations.
The same basic structure of rational choice underlies modern game theory, decision engineering,
operations research, and the various analytical approaches to improving choices and information
systems, in the blending of aviation fuel, the location of warehouses, the choice of energy
alternatives, and the arrangement of bank queues, as well as many other decision problems.
A fundamental premise is that each actor pursues his or her personal values and self-interest,
typically in the context of—and against—others rationally pursuing their own self-interest and
their private values. Such theory emphasizes the volitional nature of human action and the
capability of actors to make decisions and to act on the basis of rational calculations of benefit
and cost. Individual actors are assumed to be more or less fully informed about their action
situations and to choose the best action or means to achieve their ends. This theory posits that
Page 6
European Journal of Business and Strategic Management
ISSN 2518-265X (Online)
Vol.3, Issue 1 No.1, pp 1 –14, 2018 www.iprjb.org
6
organizational adoption is motivated by a desire for efficiency gains and related boosts to
economic performance (Katz & Shapiro, 1987; Teece, 1980). Adopters are conceived as rational
actors that scan their environment and make efficient choices.
Rational choice theories are multiple with several variants having the following components: an
actor or collective agent in a decision situation identifies or specifies alternative actions or
sequences of actions, her repertoire of options in the decision situation, that are possible and are
known unambiguously; she determines the consequences resulting from each of the alternatives,
the possible outcomes or payoffs of the options, that is the actor is assumed to know all relevant
consequences of her alternative actions; the actor has preferences among the options, with what
is assumed to be a consistent preference ordering
This assumes moreover that the consequences of acts can be compared in terms of subjective
preferences or utilities; effectively, there is comparability of the values or preferences of each of
the sets of consequences; the actor applies a decision or choice procedure to the alternatives to
determine which maximizes net gain; the procedure selects a single alternative on the basis of its
consequences for the actor in terms of her preferences or utilities. The actor makes a choice by
selecting the alternative which maximizes a utility or value function. Varian (1997) posits that all
economic models are pretty much the same. There are some economic agents. They make
choices in order to advance their objectives. The choices have to satisfy various constraints so
there’s something that adjusts to make all these choices consistent.
In the context of BSC adoption, rational choice theory approach predicts that a new system will
be adopted when the expected benefits, in terms of enhanced organizational performance, exceed
the associated costs. It assumes that organizations act rationally and innovations such as
balanced scorecard are adopted by rational decision makers who make the choices that lead to
the diffusion of beneficial innovations and adopt such concepts to improve performance (Katz &
Shapiro, 1987).
2.2 Empirical Literature Review
Rational accounts emerges from the field of economics, it has an immediate intuitive appeal,
since they focus on the presumed economic benefits that result from the adoption of a practice.
The connection between cost effectiveness and the likelihood of diffusion is one of the most
widely reported findings in the innovation diffusion literature. Organizational adoption is usually
motivated by methodical evaluation and a desire for efficiency gains and related boosts to
economic performance. It takes utility maximization as a literal description of a decision process
(Ansari, Fiss & Zajac, 2010).
Rational choice comes in two versions. The first one focuses on evolutionary processes, which
suggest that selection forces weed out the weaker performers, who fail to adopt an efficient
practice. The second indicating effective innovations are adopted by rational decision makers
who make the choices that lead to the diffusion of beneficent innovations (Ansari, Fiss & Zajac,
2010).
In both forms a key mechanism explaining increasing levels of adoption pertains to information
cascades, where adoption processes build momentum as firms use observed behaviors of early
adopters, presumably with more accurate information about the practice, to update their own
value expectations regarding a diffusing practice (Terlaak & Gong, 2008). In such models
Page 7
European Journal of Business and Strategic Management
ISSN 2518-265X (Online)
Vol.3, Issue 1 No.1, pp 1 –14, 2018 www.iprjb.org
7
imitation follows from a heuristic of social proof that is, firms infer from the actions of other
firms what constitutes appropriate actions to minimize search costs and to avoid the costs of
experimentation.
With greater diffusion more information about the utility of a practice reduces its associated
uncertainty and, thus, the risk of adoption, speeding up the diffusion process. However, some
rational models also acknowledge that information cascades may lead to herding behavior, which
occurs when it is optimal for an individual, having observed the actions of those ahead of him, to
follow the behavior of the preceding individual without regard to his own information. Such
information cascades may form particularly fast when early adopters are high status individuals
or are perceived to have special expertise, leading other firms to imitate them, even if their
private information indicates that adoption is not beneficial (Ansari, Fiss & Zajac, 2010).
Performance of a firm is a comprehensive result, its measurement and evaluation system should
be equally comprehensive and multidimensional to achieve alignment and coherence with the
notion of its performance. Public authorities have to pay much attention to the objectives of
efficiency; effectiveness and economy. As a result of this, a growing number of public sector
organizations worldwide are adopting balanced scorecard for performance management (Farneti
& Guthrie, 2009).
Hemming (2012) exemplifies that as companies around the world transform themselves for
competition, based on information, their ability to exploit intangible assets has become far more
decisive than their ability to invest in and manage physical assets hence balanced scorecard is a
good option for them. Balanced scorecard or its variation aim to capture data on what has
happened and to measure factors that drive profitable growth. Balanced scorecard is a
management system that can motivate breakthrough improvements in such critical areas as
product, process, customer, and market development. Rational choice therefore informs the
choice for balanced scorecard.
3.0 RESEARCH METHODOLOGY
The research design employed in this study was explanatory cross-sectional survey research
design. The population of the study was the 32 State Corporations that have implemented the
balanced scorecard. A sample size of 96 top and senior middle level managers comprising of
Managing Directors, Human Resource Directors, Finance Directors, Operations Directors, or
their equivalent designations in senior management were surveyed using semi-structured
questionnaires. A sample size of three persons per organization was used in order to avoid single
respondent bias. These were sampled using simple random sampling method. The research
adopted a quantitative approach as this was found by the researcher to be the most appropriate
for this study. The Cronbach’s alpha values obtained in the pilot study and the wide literature
used in this area supported this approach. Data was analysed using Statistical Packages for Social
Sciences Version 22 software. Hypothesis was tested using Analysis of Variance (ANOVA) F-
test.
Page 8
European Journal of Business and Strategic Management
ISSN 2518-265X (Online)
Vol.3, Issue 1 No.1, pp 1 –14, 2018 www.iprjb.org
8
4.0 RESULTS
4.1 General Information
Table 1 provides the results on the response rate and the demographic information.
Table 1: General Information
Response rate Frequency Percent
Returned 92 96
Unreturned/Rejected 4 4
Total 96 100
Gender Frequency Percent
Male 48 52
Female 44 48
Total 92 100
Number of Employees Frequency Percent
More than 100 80 87
50-100 employees 12 13
Total 92 100
Job position Frequency Percent
Top management 61 67
Middle management 31 33
Total 92 100
Level of Education Frequency Percent
PhD 13 14
Masters 42 46
Bachelor’s 32 35
Diploma 5 5
Total 92 100
Out of the 96 administered questionnaires, 92 fully completed questionnaires were returned. This
represented a response rate of 96%. On gender, majority of the respondents (52%) who were
managers in their companies were male. Female represented 48% of the respondents. Majority of
the respondents who were 87% indicated that their organization has more than 100 employees
while 13% indicated that their organization has 50-100 employees. Further, most of the
respondents who were 67% held top management positions in their respective organizations.
Those in senior middle management were represented by 33%. Finally on education, most of the
respondents (46%) had attained a master’s degree, 35% had bachelor’s degree, 14% had
postgraduate degree and 5% had diploma as the highest education they had attained.
4.2 Descriptive Analysis
The descriptive analysis results are as depicted in Table 2.
Page 9
European Journal of Business and Strategic Management
ISSN 2518-265X (Online)
Vol.3, Issue 1 No.1, pp 1 –14, 2018 www.iprjb.org
9
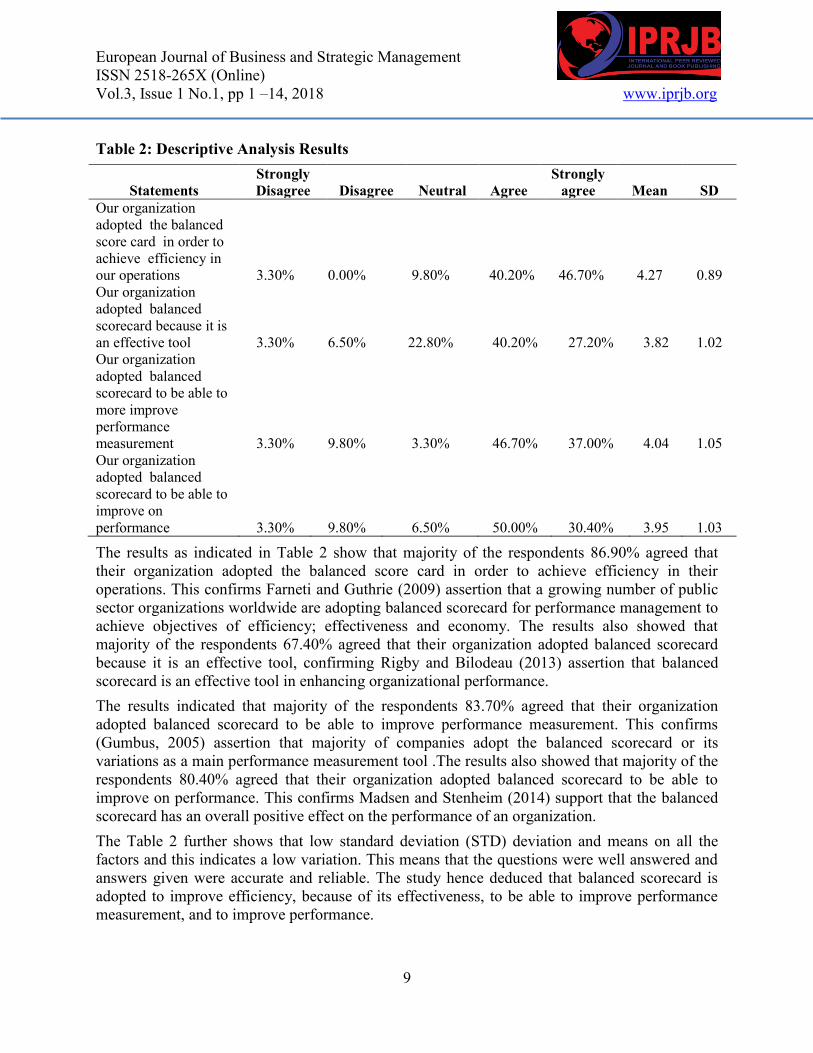
Table 2: Descriptive Analysis Results
Statements
Strongly
Disagree Disagree Neutral Agree
Strongly
agree Mean SD
Our organization
adopted the balanced
score card in order to
achieve efficiency in
our operations 3.30% 0.00% 9.80% 40.20% 46.70% 4.27 0.89
Our organization
adopted balanced
scorecard because it is
an effective tool 3.30% 6.50% 22.80% 40.20% 27.20% 3.82 1.02
Our organization
adopted balanced
scorecard to be able to
more improve
performance
measurement 3.30% 9.80% 3.30% 46.70% 37.00% 4.04 1.05
Our organization
adopted balanced
scorecard to be able to
improve on
performance 3.30% 9.80% 6.50% 50.00% 30.40% 3.95 1.03
The results as indicated in Table 2 show that majority of the respondents 86.90% agreed that
their organization adopted the balanced score card in order to achieve efficiency in their
operations. This confirms Farneti and Guthrie (2009) assertion that a growing number of public
sector organizations worldwide are adopting balanced scorecard for performance management to
achieve objectives of efficiency; effectiveness and economy. The results also showed that
majority of the respondents 67.40% agreed that their organization adopted balanced scorecard
because it is an effective tool, confirming Rigby and Bilodeau (2013) assertion that balanced
scorecard is an effective tool in enhancing organizational performance.
The results indicated that majority of the respondents 83.70% agreed that their organization
adopted balanced scorecard to be able to improve performance measurement. This confirms
(Gumbus, 2005) assertion that majority of companies adopt the balanced scorecard or its
variations as a main performance measurement tool .The results also showed that majority of the
respondents 80.40% agreed that their organization adopted balanced scorecard to be able to
improve on performance. This confirms Madsen and Stenheim (2014) support that the balanced
scorecard has an overall positive effect on the performance of an organization.
The Table 2 further shows that low standard deviation (STD) deviation and means on all the
factors and this indicates a low variation. This means that the questions were well answered and
answers given were accurate and reliable. The study hence deduced that balanced scorecard is
adopted to improve efficiency, because of its effectiveness, to be able to improve performance
measurement, and to improve performance.
Page 10
European Journal of Business and Strategic Management
ISSN 2518-265X (Online)
Vol.3, Issue 1 No.1, pp 1 –14, 2018 www.iprjb.org
10
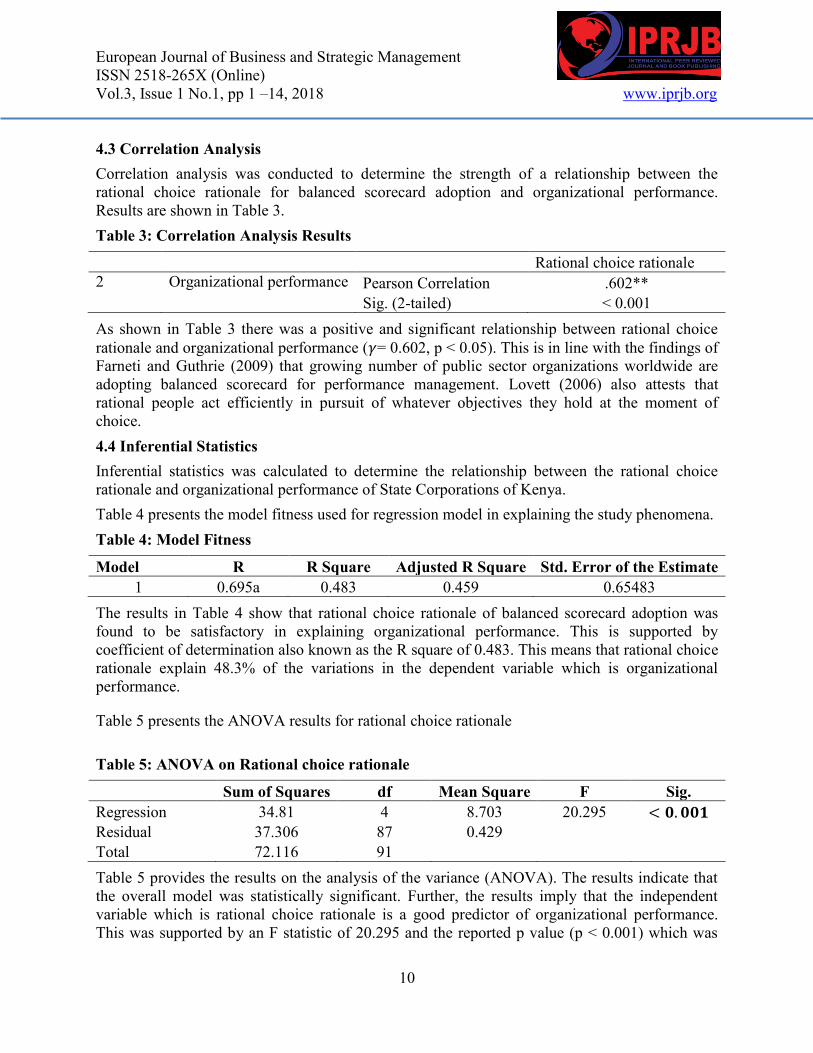
4.3 Correlation Analysis
Correlation analysis was conducted to determine the strength of a relationship between the
rational choice rationale for balanced scorecard adoption and organizational performance.
Results are shown in Table 3.
Table 3: Correlation Analysis Results
Rational choice rationale
2 Organizational performance Pearson Correlation .602**
Sig. (2-tailed) < 0.001
As shown in Table 3 there was a positive and significant relationship between rational choice
rationale and organizational performance ( = 0.602, p < 0.05). This is in line with the findings of
Farneti and Guthrie (2009) that growing number of public sector organizations worldwide are
adopting balanced scorecard for performance management. Lovett (2006) also attests that
rational people act efficiently in pursuit of whatever objectives they hold at the moment of
choice.
4.4 Inferential Statistics
Inferential statistics was calculated to determine the relationship between the rational choice
rationale and organizational performance of State Corporations of Kenya.
Table 4 presents the model fitness used for regression model in explaining the study phenomena.
Table 4: Model Fitness
Model R R Square Adjusted R Square Std. Error of the Estimate
1 0.695a 0.483 0.459 0.65483
The results in Table 4 show that rational choice rationale of balanced scorecard adoption was
found to be satisfactory in explaining organizational performance. This is supported by
coefficient of determination also known as the R square of 0.483. This means that rational choice
rationale explain 48.3% of the variations in the dependent variable which is organizational
performance.
Table 5 presents the ANOVA results for rational choice rationale
Table 5: ANOVA on Rational choice rationale
Sum of Squares df Mean Square F Sig.
Regression 34.81 4 8.703 20.295
Residual 37.306 87 0.429
Total 72.116 91
Table 5 provides the results on the analysis of the variance (ANOVA). The results indicate that
the overall model was statistically significant. Further, the results imply that the independent
variable which is rational choice rationale is a good predictor of organizational performance.
This was supported by an F statistic of 20.295 and the reported p value (p < 0.001) which was
Page 11
European Journal of Business and Strategic Management
ISSN 2518-265X (Online)
Vol.3, Issue 1 No.1, pp 1 –14, 2018 www.iprjb.org
11
less than the conventional probability of 0.05 level of significance. Table 6 presents the
regression of coefficients results for rational choice rationale.
Table 6: Regression of Coefficients Results for Rational Choice Rationale
Model Unstandardized Coefficients
Standardized
Coefficients t Sig.
B Std. Error Beta
(Constant) 0.902 0.407
2.219 0.029
Our organization adopted
the balanced score card in
order to achieve
efficiency in our
operations 0.107 0.082 0.108 1.311 0.193
Our organization adopted
balanced scorecard
because it is an effective
tool 0.540 0.103 0.616 5.235 0.000
Our organization adopted
balanced scorecard to be
able to more improve
performance measurement 0.275 0.102 0.324 2.686 0.009
Our organization adopted
balanced scorecard to be
able to more improve on
performance -0.229 0.117 -0.265 -1.963 0.053
A value of p < 0.01 is interpreted as a very strong evidence against Ho, p < 0.05 is moderate
evidence against Ho, p < 0.10 is Suggestive evidence against Ho, p > 0.10 is little or no real
evidence against Ho. Regression of coefficients results in Table 6 showed that efficiency in
operations of balanced scorecard and organizational performance had a positive and insignificant
relationship (r=0.107, p=0.193). The results also revealed that effectiveness of BSC and
organizational performance had a positive and significant relationship (r=-0.054, p<0.001). The
results further revealed that ability to improve performance measurement and organizational
performance had a positive and significant relationship (r=0.275, p=0.009). Finally, results
revealed that ability of balanced scorecard to improve performance had a negative and
insignificant relationship with organizational performance (r=-0.229, p=0.053).Table 7 presents
the optimal model for rational choice Rationale.
Page 12
European Journal of Business and Strategic Management
ISSN 2518-265X (Online)
Vol.3, Issue 1 No.1, pp 1 –14, 2018 www.iprjb.org
12
Table 7: Optimal Model for Rational Choice Rationale
Unstandardized
Coefficients
Standardized
Coefficients t Sig.
B Std. Error Beta
(Constant) 0.87 0.393
2.217 0.029
Rational Choice
Rationale 0.686 0.096 0.602 7.155
Regression coefficients in Table 7, revealed that there was a positive and significant relationship
between rational choice rationale for balanced scorecard adoption and organizational
performance (r=0.686, p<0.001). This was supported by a calculated t-statistic of 7.155 which is
larger than the critical t-statistic of 1.96 (Kothari, 2011). These results agree with Farneti and
Guthrie (2009) who indicated that growing number of public sector organizations worldwide are
adopting balanced scorecard for performance management this is due to the efficiency,
effectiveness and economy of balanced scorecard model.
The model for rational choice rationale is
Y=0.87+0.686X where,
Y= Organizational Performance
X= Rational Choice Rationale
5.0 CONCLUSIONS AND RECOMMENDATIONS
5.1 Conclusions
It was concluded that rational choice and organizational performance had a positive and
significant relationship. Organizations seem to adopt balanced scorecard because it is an
effective tool and also to be able to improve performance measurement. .
5.2 Recommendations
In line with the findings, it is recommended that organizational decision makers to take account
of available information, potential costs and benefits in determining whether to adopt or not
adopt balanced scorecard, and to be lucid in choosing the best choice of action
REFERENCES
Abrahamson, E. (1996). Management fashion. Academy of management review, 21(1), 254-285.
Ansari, S. M., Fiss, P. C., & Zajac, E. J. (2010). Made to fit: How practices vary as they diffuse.
Academy of management review, 35(1), 67-92.
Aosa, E., & Machuki, V. N. (2011). The influence of the external environment on the
performance of publicly quoted companies in Kenya. Nairobi: University of Nairobi.
Page 13
European Journal of Business and Strategic Management
ISSN 2518-265X (Online)
Vol.3, Issue 1 No.1, pp 1 –14, 2018 www.iprjb.org
13
Battisti, G., & Iona, A. (2009). The intra-firm diffusion of complementary innovations: Evidence
from the adoption of management practices by British establishments. Research
Policy, 38(8), 1326-1339.
Bloom, N., & Van Reenen, J. (2007). Measuring and explaining management practices across
firms and countries. The Quarterly Journal of Economics, 122(4), 1351-1408.
Chalhoub, M. S. (2009). The effect of management practices on corporate performance: an
empirical study of non-governmental organizations in the Middle East. International
journal of management, 26(1), 51.
Chen, C. J., & Huang, J. W. (2009). Strategic human resource practices and innovation
performance—The mediating role of knowledge management capacity. Journal of
business research, 62(1), 104-114.
De Geuser, F., Mooraj, S., & Oyon, D. (2009). Does the balanced scorecard add value?
Empirical evidence on its effect on performance. European Accounting Review, 18(1),
93-122.
Farneti, F., & Guthrie, J. (2009). Sustainability reporting by Australian public sector
organisations: Why they report. In Accounting forum (Vol. 33, No. 2, pp. 89-98).
Elsevier.
GoK (2010). Review of performance contracting in the public sector, Nairobi, Government
Printer. (Excerpts) September2010.
Gumbus, A. (2005). Introducing the balanced scorecard: creating metrics to measure
performance. Journal of management education, 29(4), 617-630.
Hemmings, A. D. (2012). Considerable values in Antarctica. The Polar Journal, 2(1), 139-156.
Hobbes, T. (1968). 1651. Leviathan. Classics of moral and political theory, ed. M. Morgan, 581-
735.
Hoque, Z. (2014). 20 years of studies on the balanced scorecard: trends, accomplishments, gaps
and opportunities for future research. The British accounting review, 46(1), 33-59.
Kaplan. (2010). Conceptual Foundations of the Balanced Scorecard. Boston: Harvard Business
School, Harvard University.
Katz, M. L., & Shapiro, C. (1987). R and D rivalry with licensing or imitation. The American
Economic Review, 402-420.
Kothari, C. R. (2011). Research methodology: Methods and techniques. New Age International.
Kraaijenbrink, J. (2012). Integrating knowledge and knowledge processes: a critical incident
study of product development projects. Journal of product innovation
management, 29(6), 1082-1096.
Lawson, R., Stratton, W., & Hatch, T. (2006). Strategic focus–does your scorecarding system
have it. CMA Management, 80(6), 35-40.
Levin, J., & Milgrom, P. (2004). Introduction to choice theory. Available from internet:
http://web. stanford. edu/~ jdlevin/Econ, 20202.
Page 14
European Journal of Business and Strategic Management
ISSN 2518-265X (Online)
Vol.3, Issue 1 No.1, pp 1 –14, 2018 www.iprjb.org
14
Lovett, F. (2006). Rational choice theory and explanation. Rationality and Society, 18(2), 237-
272.
Madsen, D., & Stenheim, T. (2014). Perceived benefits of balanced scorecard implementation.
Problems and Perspectives in Management, 12(3), 81-90.
Mol, M. J., & Birkinshaw, J. (2009). The sources of management innovation: When firms
introduce new management practices. Journal of business research, 62(12), 1269-1280.
Ndungu, C. L. N. (2014). Balanced scorecard and strategy implementation at Kenyatta
university, Kenya. Nairobi: University of Nairobi.
Neely, A. (2008). Does the balance scorecard work: an empirical investigation.
Norreklit, H., Norreklit, L., Mitchell, F., & Bjornenak, T. (2012). The rise of the balanced
scorecard! Relevance regained?. Journal of Accounting & Organizational Change, 8(4),
490-510.
Ongeti, W. J. (2014). Organizational resources, corporate governance and performance of
Kenyan State Corporations. Unpublished PhD thesis. Nairobi: University of Nairobi.
Parmenter, D. (2012). The Leading-edge Manager's Guide to Success: Strategies and Better
Practices. John Wiley & Sons.
Porter, M. E., & Ketels, C. H. (2003). UK competitiveness: moving to the next stage.
Rigby, D., & Bilodeau, B. (2007). Bain's global 2007 management tools and trends
survey. Strategy & Leadership, 35(5), 9-16.
Teece, D. J. (1980). Economies of scope and the scope of the enterprise. Journal of economic
behavior & organization, 1(3), 223-247.
Terlaak, A., & Gong, Y. (2008). Vicarious learning and inferential accuracy in adoption
processes. Academy of Management Review, 33(4), 846-868.
Varian, H. R. (1997). Versioning information goods.
Wu, H. K. (2010). Modelling a Complex System: Using novice expert analysis for developing an
effective technology enhanced learning environment. International Journal of Science
Education, 32(2), 195-219.