Page 1
Volume 3, Issue 9, September – 2018 International Journal of Innovative Science and Research Technology
ISSN No:-2456-2165
IJISRT18SP16 www.ijisrt.com 157
Relationship of Personal Competence and Managerial
Competency of Business Organizers with the Quality
of School Administration Services in Man Gorontalo
Graduates
Novianty Djafri
Department of Education Management, Faculty of Educational Sciences
Gorontalo State University, Indonesia
Abstract:- The purpose of this research is to find out: (1)
administrative competence of personality of employees,
(2) managerial competence of head of administration, (3)
quality of school administration services, and (4)
relationship of personal competence and managerial
competence of administrative staff with quality of school
administration services in Madrasah Aliyah NegeriInsan
Cendekia Gorontalo. This study uses quantitative
methods with correlational techniques. Data collection
techniques using observation and questionnaire. Data
analysis techniques using descriptive analysis techniques
and quantitative analysis techniques. The results of the
study can be concluded that: (1) personality
competencies of administrative staff are in good criteria;
(2) Managerial competence of the head of administration
is in good criteria; (3) The quality of school
administration services is in good criteria; (4) There is a
strong relationship between the personality
competencies of administrative staff and managerial
competence.
Keywords:- Personality Competence, Managerial
Competence, Quality of School Administration Services.
I. INTRODUCTION
The existence of education in schools is very much
determined by the school administration. School
administration is an overall process of activities in the form
of planning, arranging, administering and controlling all
school affairs to achieve the goals of education and teaching
in schools. School administration certainly requires
managers who are truly capable and competent to be able to
manage. School administration personnel are educational
staff who are tasked with providing administrative services
for the implementation of the education process in schools. They are non teaching staff who work in schools which are
often referred to as Administration (TU). The school
administration system is part of the technical implementing
unit for the administration of educational systems and
educational information in schools. Business arrangements
in the school environment are one part that has a supporting
function in the realization of the school's vision and
mission. This support is realized through services that
support teaching and administrative activities. In carrying
out these responsibilities administrative officials are
required to provide quality services.
In accordance with the findings of the observations in
MAN Insan Cendekia Gorontalo, the quality of service and
competency standards possessed by the governance staff
are: administrative staff perform friendly service both to
teachers, students and guests (parents of students), have a
high level of discipline, can seen from the regular time of
the morning apple and coming out according to the rules set,
the head and administrative staff have competent in carrying out their work because of the educational background that
supports appropriate for the position, optimal administrative
performance, it is shown by the awareness of the effort to
prepare a plan for a good long-term and short-term activity
program, having excellent facilities and infrastructure for
the work of administrative staff, head of administration and
other employees able to utilize information technology
properly.
Based on the background of the problem above, the
formulation of the problem in this study concerning: (1)
How is the personality competency of administrative
personnel in the Madrasah Aliyah NegeriInsan Cendekia
Gorontalo. (2) How is the managerial competence of the
head of administration at Madrasah Aliyah NegeriInsan
Cendekia Gorontalo? (3) How is the quality of school administration services for administrative staff at the
Madrasah Aliyah NegeriInsan Cendika Gorontalo? (4) Is
there a relationship between the personality competencies of
the administrative staff and managerial competence of the
head of administration with the quality of school
administration services in the Madrasah Aliyah NegeriInsan
Cendekia Gorontalo.
II. THEORITICAL REVIEW
Quality is defined as a dynamic condition which is
related to products, services, people, processes and
environments that meet or exceed expectations (Tjiptono
and Diana, 2004: 51). In the Big Indonesian Dictionary,
quality can also be defined as the level of excellence, so
quality is a relative measure of goodness. Wijaya in Toni
(2011: 11) states that quality is something that is decided by
the customer. Referring to the Minister of National
Education Regulation No. 24 of 2008 concerning the
Competency Standards of Administrative Staff / School TU
includes: "Personality competencies, social competencies, technical competencies, and managerial competencies
(specifically school / madrasah administrative personnel)".
Page 2
Volume 3, Issue 9, September – 2018 International Journal of Innovative Science and Research Technology
ISSN No:-2456-2165
IJISRT18SP16 www.ijisrt.com 158
Sagala (2009: 40) argues that school administration is
limited to administrative activities, namely systematic information-making activities and written records related to
all information obtained and needed regarding their
relationship to one another. According to Syah (2002: 229)
suggests the basic understanding of competence is ability
and ability. Uno (2007: 201) defines competence as a
characteristic that stands out for a person and indicates ways
of behaving or thinking, in all situations, and continues for a
long period of time.
III. RESEARCH METHODOLOGY
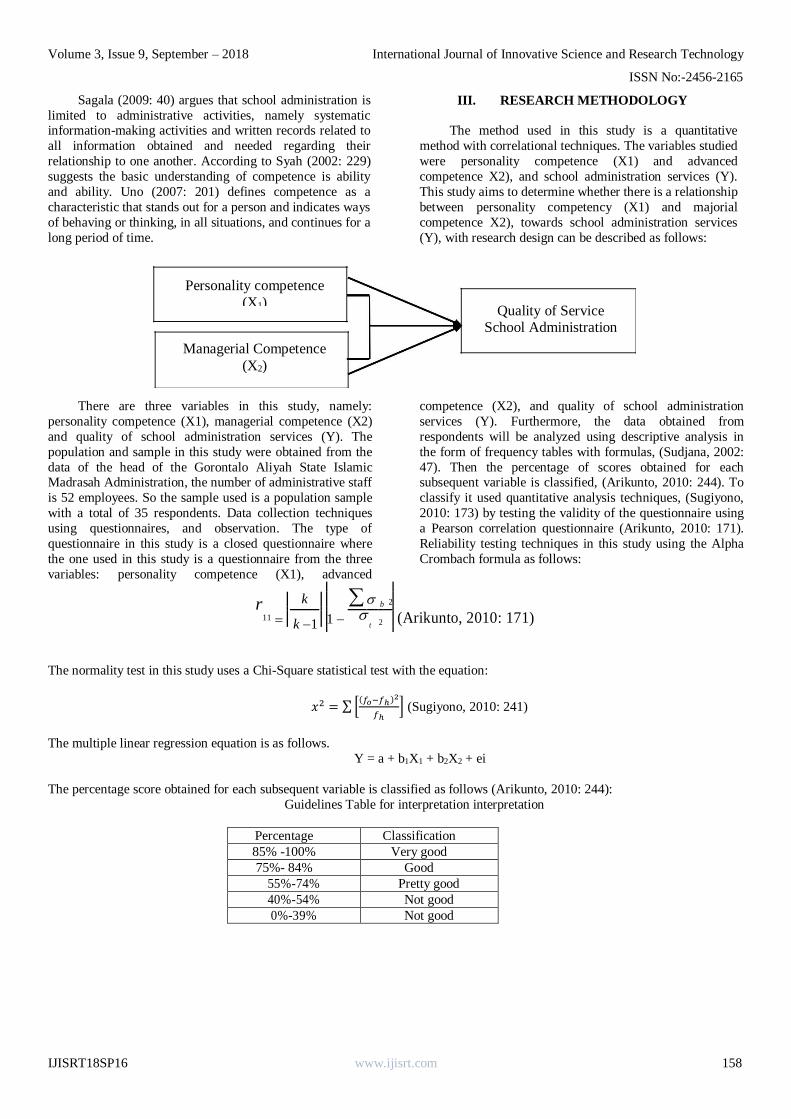
The method used in this study is a quantitative
method with correlational techniques. The variables studied
were personality competence (X1) and advanced
competence X2), and school administration services (Y).
This study aims to determine whether there is a relationship
between personality competency (X1) and majorial
competence X2), towards school administration services
(Y), with research design can be described as follows:
There are three variables in this study, namely:
personality competence (X1), managerial competence (X2)
and quality of school administration services (Y). The
population and sample in this study were obtained from the
data of the head of the Gorontalo Aliyah State Islamic Madrasah Administration, the number of administrative staff
is 52 employees. So the sample used is a population sample
with a total of 35 respondents. Data collection techniques
using questionnaires, and observation. The type of
questionnaire in this study is a closed questionnaire where
the one used in this study is a questionnaire from the three
variables: personality competence (X1), advanced
competence (X2), and quality of school administration
services (Y). Furthermore, the data obtained from
respondents will be analyzed using descriptive analysis in
the form of frequency tables with formulas, (Sudjana, 2002:
47). Then the percentage of scores obtained for each subsequent variable is classified, (Arikunto, 2010: 244). To
classify it used quantitative analysis techniques, (Sugiyono,
2010: 173) by testing the validity of the questionnaire using
a Pearson correlation questionnaire (Arikunto, 2010: 171).
Reliability testing techniques in this study using the Alpha
Crombach formula as follows:
r11
k
1
b 2
(Arikunto, 2010: 171)
k 1
t 2
The normality test in this study uses a Chi-Square statistical test with the equation:
𝑥2 = ∑ [(𝑓𝑜−𝑓ℎ)2
𝑓ℎ] (Sugiyono, 2010: 241)
The multiple linear regression equation is as follows.
Y = a + b1X1 + b2X2 + ei
The percentage score obtained for each subsequent variable is classified as follows (Arikunto, 2010: 244):
Guidelines Table for interpretation interpretation
Percentage Classification
85% -100% Very good
75%- 84% Good
55%-74% Pretty good
40%-54% Not good
0%-39% Not good
Personality competence
(X1)
Managerial Competence
(X2)
Quality of Service School Administration
(Y)
Page 3
Volume 3, Issue 9, September – 2018 International Journal of Innovative Science and Research Technology
ISSN No:-2456-2165
IJISRT18SP16 www.ijisrt.com 159
IV. RESULTS AND DISCUSSION
Results of Descriptive Analysis
Descriptive analysis was carried out to find out the
percentage of clerical personality competency, the
managerial competence of the head of administration, and
the quality of school administration services in the
Madrasah Aliyah NegeriInsan Cendika Gorontalo. The
results of the analysis of research data on personality
competency of administrative personnel, the managerial
competence of the head of administration, and quality of school administration services can be seen in Annex 4.
Based on these data, it can be seen that the total score of
each respondent in each variable. Data on the total score of
each respondent for personality competency variables (X1),
managerial competence (X2), and quality of school
administration services (Y) can be seen in Table 1 below.
No. Responden
Personality
Competence
(X1)
Managerial
Competence
(X2)
Quality of School
Administration Services (Y)
1 187 115 95
2 176 134 113
3 145 126 107
4 162 106 85
5 167 137 115
6 136 120 101
7 169 118 99
8 204 115 94
9 185 118 98
10 168 95 76
11 191 121 102
12 178 148 124
13 163 130 111
14 180 121 101
15 178 137 116
16 185 119 100
17 173 126 107
18 191 128 110
19 203 118 98
20 155 135 114
21 157 117 95
22 174 129 110
23 167 108 92
24 181 121 103
25 169 126 108
26 158 130 111
27 160 121 102
28 155 124 104
29 148 128 109
30 133 137 118
31 161 119 99
32 145 115 94
33 160 111 93
34 134 93 73
35 148 136 84
Amount 5846 4282 3561
Average 167.03 122.34 101.74
Minimum Value 133 93 73
Maximum Value 204 148 124
Maximum Total Score 7140 5180 4340
Percentage of Achievements 81.88% 82.66% 82.05%
Achievement Criteria Good Good Good
Table 1. Data on personality competence variables (X1), managerial competencies (X2), and quality of school administration services (Y)
Based on the results of data analysis, it can be seen
that the percentage of personality competencies of
administrative personnel reaches 81.88%. The percentage
in this range shows that the personality competencies of the
Page 4
Volume 3, Issue 9, September – 2018 International Journal of Innovative Science and Research Technology
ISSN No:-2456-2165
IJISRT18SP16 www.ijisrt.com 160
administrative staff are in good criteria. Furthermore, the
percentage of managerial competence in the head of administration reaches 82.66%. The percentage in this
range indicates that the managerial competence of the head
of the administration is in good criteria. Then the quality of
school administration services for administrative staff
percentage reached 82.05% with good criteria.
Quantitative Analysis Results
1. Basic Assumption Test Results
The basic assumption test is done by analyzing the
normality of the research data. The normality test aims to
test the normal level of each research variable because the
requirement to test the hypothesis in this study is that the data must have a good regression model. Data that has a
good regression model is data that is normally distributed or
close to normal. Normality test in this study uses Chi-
Square statistical test.
2. Normality Test Data for Administrative Personnel
Competency Variables (X1)
Number of samples (n) = 35
Maximum score = 204
Minimum score = 133
Range = maximum score -
minimum score
= 204 – 133 = 71
Many classes (k) = 1 + 3,3 log 35
= 1 + 3,3 (1,54)
= 1 + 5,1
= 6,1 (taken 6 classes)
Class length (p) = 𝑟𝑎𝑛𝑔𝑒
𝑘=
71
6= 11,83
(taken 12)
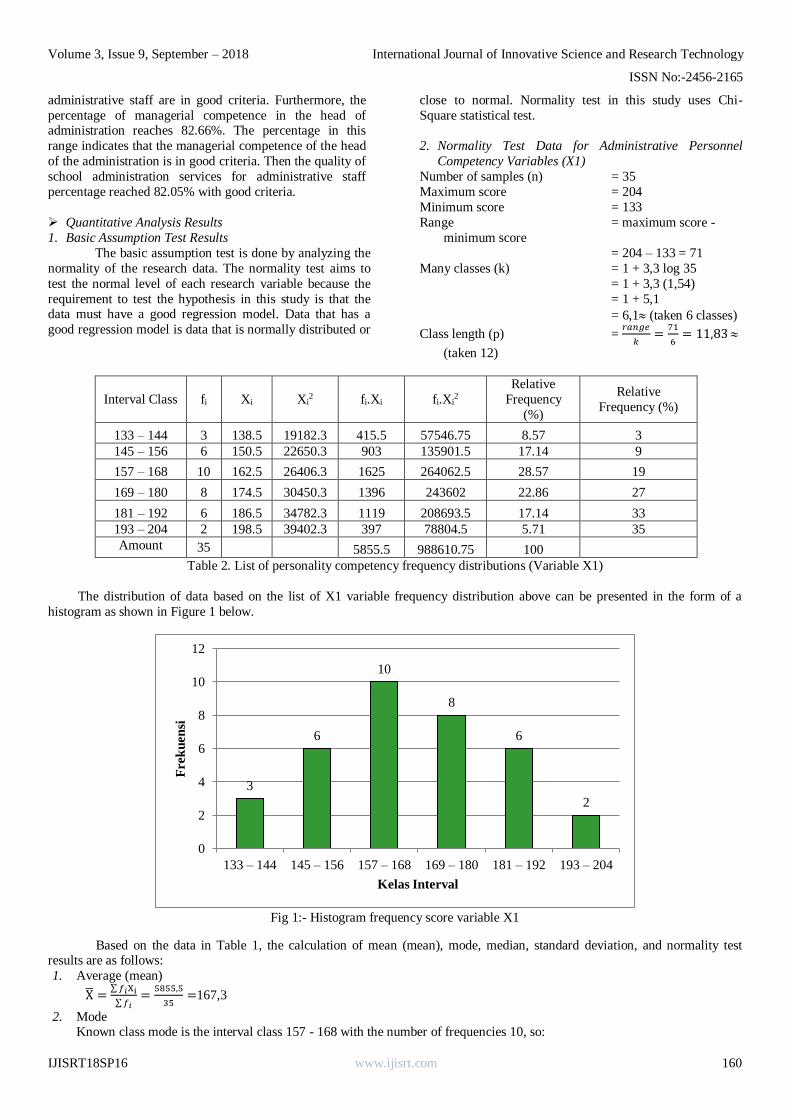
Interval Class fi Xi Xi2 fi.Xi fi.Xi
2
Relative
Frequency
(%)
Relative
Frequency (%)
133 – 144 3 138.5 19182.3 415.5 57546.75 8.57 3
145 – 156 6 150.5 22650.3 903 135901.5 17.14 9
157 – 168 10 162.5 26406.3 1625 264062.5 28.57 19
169 – 180 8 174.5 30450.3 1396 243602 22.86 27
181 – 192 6 186.5 34782.3 1119 208693.5 17.14 33
193 – 204 2 198.5 39402.3 397 78804.5 5.71 35
Amount 35 5855.5 988610.75 100
Table 2. List of personality competency frequency distributions (Variable X1)
The distribution of data based on the list of X1 variable frequency distribution above can be presented in the form of a
histogram as shown in Figure 1 below.
Fig 1:- Histogram frequency score variable X1
Based on the data in Table 1, the calculation of mean (mean), mode, median, standard deviation, and normality test results are as follows:
1. Average (mean)
X̅ =∑ 𝑓𝑖Xi
∑ 𝑓𝑖=
5855,5
35=167,3
2. Mode
Known class mode is the interval class 157 - 168 with the number of frequencies 10, so:
3
6
10
8
6
2
0
2
4
6
8
10
12
133 – 144 145 – 156 157 – 168 169 – 180 181 – 192 193 – 204
Frek
uen
si
Kelas Interval
Page 5
Volume 3, Issue 9, September – 2018 International Journal of Innovative Science and Research Technology
ISSN No:-2456-2165
IJISRT18SP16 www.ijisrt.com 161
b = 156,5
p = 12 b1 = 10 – 6 = 4
b2 = 10 – 8 = 2
Mo = 𝑏 + 𝑝 (𝑏1
𝑏1 + 𝑏2) = 156,5 + 12 (
4
4 + 2) = 156,5 + 12(0,7)
= 156,5 + 8 = 164,5 3. Median
The median is known to be in the interval class 157 - 168, so that:
b = 156,5
p = 12
n = 35
F = 9 f=10
Me = 𝑏 + 𝑝 (
1
2𝑛 − 𝐹
𝑓) = 156,5 + 12 (
17,5 − 9
10) = 156,5 + 12 (0,7)
= 156,5 + 10,2
= 166,7
4. Standard deviation
SD = √n ∑ fiXi
2 − (∑ fi Xi)2
n(n − 1)= √
35 (988610,75) − (5855,5)2
35 (34)
= √34601376 – 34286880,25
1190
= √314496
1190= √264,28
= 16,26
The results of calculating the mean, mode, median, and standard deviation of personality competence variables can be seen
in Table 3 below.
Data Mean Mode Median Standard Deviation
Nilai 167.30 164.5 166.7 16.26
Table 3. Table of mean, mode, median, and standard deviation variables X1
5. Normality Test
1. Calculating the Price of Z Class Limits
Price Z class limits are needed for price calculations (data normality test). To find out the price of Z the boundary class is
obtained through the formula:
Z = 𝑥𝑖−�̅�
𝑠
Interval Class
Limit Class
z Limit Class
Regional
Area Limits
Area Z Table
fh
(Lu. Z Tabelx N) f0
(𝑓0 − 𝑓ℎ)2
𝑓ℎ
132.5 -2.14 0.4838
133 – 144 0.0646 2.261 3 0.2415
144.5 -1.40 0.4192
145 – 156 0.1738 6.083 6 0.0011
156.5 -0.66 0.2454
157 – 168 0.2733 9.5655 10 0.0197
168.5 0.07 0.0279
169 – 180 0.2631 9.2085 8 0.1586
180.5 0.81 0.291
181 – 192 0.1484 5.194 6 0.1251
192.5 1.55 0.4394
193 – 204 0.0496 1.736 2 0.0401
204.5 2.29 0.489
x2= ∑ [(𝑓0−𝑓ℎ)2
𝑓ℎ] 0.5862
Table 4. List of Observations Frequency and Frequency of Expectation of Variable X1
Page 6
Volume 3, Issue 9, September – 2018 International Journal of Innovative Science and Research Technology
ISSN No:-2456-2165
IJISRT18SP16 www.ijisrt.com 162
3
6
89
7
2
0
2
4
6
8
10
93 – 102 103 – 112 113 – 122 123 – 132 133 – 142 143 – 152
Frek
uen
si
Kelas Interval
2. Price𝑥2count
Based on the table of observation frequency and
expectation frequency of variable X1, it can be seen that the
calculated price 𝑥2count= 0.59. As for the price of the table at
the significance level α = 0.05 it can be known by calculating the degree of freedom (dk) then adjusted to the
value in the Distribution table x2.
Degree of freedom (dk) = Number of interval classes –3
= 6 – 3 = 3
So that is obtained𝑥2(0,95)(3) = 7,81.
The statistical hypothesis for normality test is stated as
follows.
H0: Estimated error population is normally distributed
H1: Population error estimates are not normally distributed
The test criteria are H0accepted if𝑥2count≤𝑥2
table and reject
H0if𝑥2count>𝑥2
tableatthe a real level The selected.
Seeing these results is known that𝑥2count = 0,59<𝑥2
table =
7,81, so it can be concluded that the distribution of
personality competency data obtained through questionnaires (questionnaires) is normally distributed. Thus
the data normality requirements are variable X1that is,
personality competence meets the requirements for
hypothesis testing.
6. Managerial Data Variability Normality Competency Test
Results Head of Administration (X2)
Number of samples(n) = 35
Maximum score = 148
Minimum score = 93
Range = maximum score -
minimum score
= 148 – 93 = 55
Many classes (k) = 1 + 3,3 log 35
= 1 + 3,3 (1,54)
= 1 + 5,1
= 6,1 (taken 6
classes)
Class length(p) = 𝑟𝑎𝑛𝑔𝑒
𝑘=
55
6= 9,17
(taken 10)
Interval Class fi Xi Xi2 fi.Xi fi.Xi
2
Relative
Frequency
(%)
Cumulative
Frequency (fk)
93 – 102 3 97.5 9506.25 292.5 28518.75 8.57 3
103 – 112 6 107.5 11556.3 645 69337.5 17.14 9
113 – 122 8 117.5 13806.3 940 110450 22.86 17
123 – 132 9 127.5 16256.3 1147.5 146306.25 25.71 26
133 – 142 7 137.5 18906.3 962.5 132343.75 20.00 33
143 – 152 2 147.5 21756.3 295 43512.5 5.71 35
Amount 35 4282.5 530468.75 100
Table 5. List of frequency distributions for managerial competencies (Variable X2)
Data distribution based on the list of the frequency distribution of the X2 variable score above can be presented in the form
of a histogram as shown in Figure 2 below.
Fig 2:- Histogram frequency variable score X2
Based on the data in the table, it can be calculated the mean (mean), mode, median, standard deviation, and normality test results
as follows:
1. Average
Page 7
Volume 3, Issue 9, September – 2018 International Journal of Innovative Science and Research Technology
ISSN No:-2456-2165
IJISRT18SP16 www.ijisrt.com 163
X̅ =∑ 𝑓𝑖Xi
∑ 𝑓𝑖=
4282,5
35= 122,36
2. Mode
Known class mode is the interval class 123-132 with the number of frequencies 9, so that:
b = 122,5
p = 10
b1 = 9 – 8 = 1
b2 = 9 – 7 = 2
Mo = 𝑏 + 𝑝 (𝑏1
𝑏1 + 𝑏2) = 122,5 + 10 (
1
1 + 2) = 122,5 + 10(0,33)
= 122,5 + 3,33 = 125,83 3. Median
The median is known to be in the interval class 123 - 132, so that:
b = 122,5
p = 10
n = 35
F = 17
f = 9
Me = 𝑏 + 𝑝 (
1
2𝑛 − 𝐹
𝑓) = 122,5 + 10 (
17,5 − 17
9) = 122,5 + 10 (0,06)
= 122,5 + 0,56 = 123,06
4. Standard deviation
SD = √n ∑ fiXi
2 − (∑ fi Xi)2
n(n − 1)= √
35 (530468,75) − (4282,5)2
35 (34)
= √18566406 − 18339806,25
1190 = √
226600
1190
=√190,42=13,80
The results of the calculation of mean, mode, median, and standard deviation of managerial competence variables can be
seen in Table 6 below.
Data Mean Mode Median Standard Deviation
Nilai 122.36 125.83 123.06 13.80
Table 6. Table of mean, mode, median, and standard deviation of variables X2
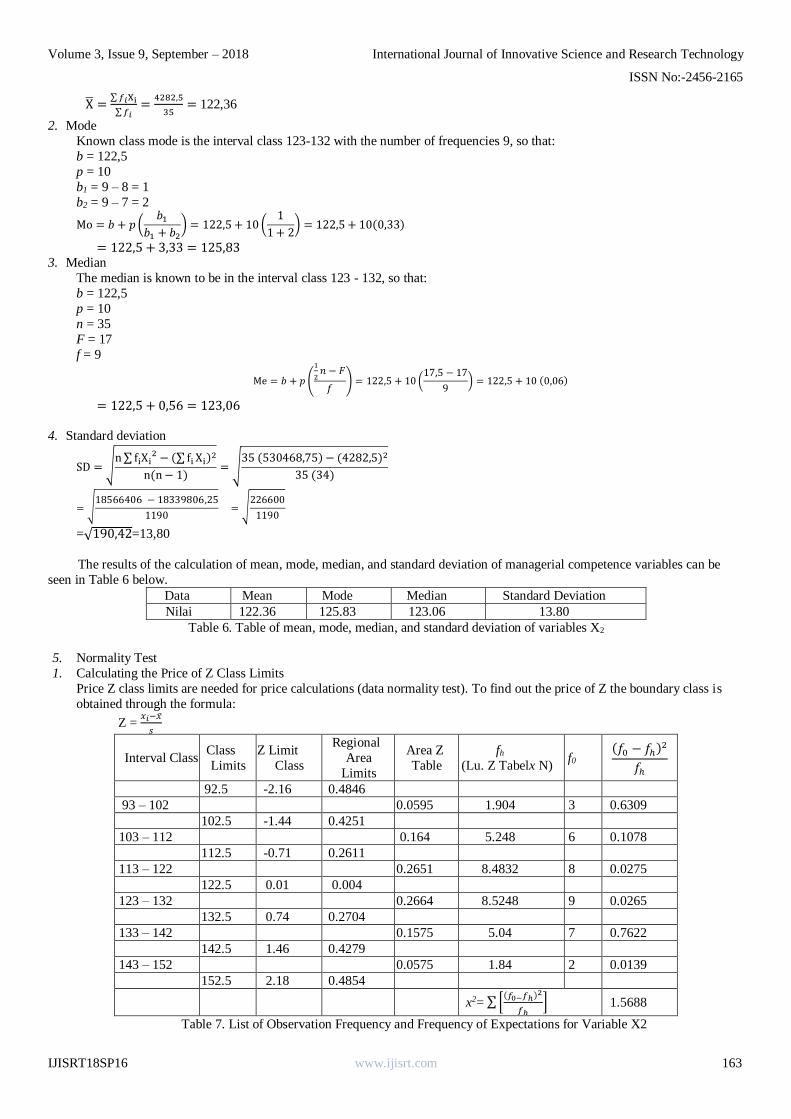
5. Normality Test
1. Calculating the Price of Z Class Limits
Price Z class limits are needed for price calculations (data normality test). To find out the price of Z the boundary class is
obtained through the formula:
Z = 𝑥𝑖−�̅�
𝑠
Interval Class Class
Limits
Z Limit
Class
Regional
Area
Limits
Area Z
Table
fh
(Lu. Z Tabelx N) f0
(𝑓0 − 𝑓ℎ)2
𝑓ℎ
92.5 -2.16 0.4846
93 – 102 0.0595 1.904 3 0.6309
102.5 -1.44 0.4251
103 – 112 0.164 5.248 6 0.1078
112.5 -0.71 0.2611
113 – 122 0.2651 8.4832 8 0.0275
122.5 0.01 0.004
123 – 132 0.2664 8.5248 9 0.0265
132.5 0.74 0.2704
133 – 142 0.1575 5.04 7 0.7622
142.5 1.46 0.4279
143 – 152 0.0575 1.84 2 0.0139
152.5 2.18 0.4854
x2= ∑ [(𝑓0−𝑓ℎ)2
𝑓ℎ] 1.5688
Table 7. List of Observation Frequency and Frequency of Expectations for Variable X2
Page 8
Volume 3, Issue 9, September – 2018 International Journal of Innovative Science and Research Technology
ISSN No:-2456-2165
IJISRT18SP16 www.ijisrt.com 164
2. Price𝑥2count
Based on the table of the observation frequency and
the expectation frequency of the X2 variable, it can be seen
that the price𝑥2count = 1,57. As for prices𝑥2
tablethe at a real
level α = 0,05can be known by calculating the degree of
freedom (dk) then adjusted to the value in the Distribution table x2.
Degree of freedom (dk) = Number of interval classes - 3 = 6
- 3 = 3
So that is obtained𝑥2(0,95)(3) = 7,81.
The statistical hypothesis for normality test is stated as
follows.
H0: Estimated error population is normally distributed
H1: Population error estimates are not normally distributed
The test criteria are H0 received if𝑥2count≤𝑥2
table and reject H0
if 𝑥2count>𝑥2
tableatthe the chosen level.
As a result, it is known that𝑥2count = 1,57<𝑥2
table =
7,81, so it can be concluded that the distribution of
managerial competency data obtained through
questionnaires (questionnaires) is normally distributed. Thus
the data normality requirement of variable X2 is that managerial competencies fulfill the requirements for
hypothesis testing.
6. Data Normality Test Quality of Administration Service
Variables (Y)
Number of samples (n) = 35
Maximum score = 124
Minimum score = 74
Range = maximum score - minimum
score
= 124 – 73 = 51
Many classes (k) = 1 + 3,3 log 35 = 1 + 3,3 (1,54)
= 1 + 5,1
= 6,1 (taken 6
classes)
Class length (p) = 𝑟𝑎𝑛𝑔𝑒
𝑘=
51
6=8,5(taken 9)
Interval Class fi Yi Yi2 fi.Yi fi.Yi
2
Relative
Frequency
(%)
Cumulative
Frequency (fk)
73 – 80 3 77 5929 231 17787 8.57 3
81 – 88 6 86 7396 516 44376 17.14 9
89 – 96 9 95 9025 855 81225 25.71 18
97 – 104 8 104 10816 832 86528 22.86 26
105 – 112 6 113 12769 678 76614 17.14 32
113 – 120 3 122 14884 366 44652 8.57 35
121 – 128 3 77 5929 231 17787 8.57 3
Amount 35 3478 351182 100
Table 8. List of administrative service quality frequencies (Variable Y)
Data distribution based on the list of frequency distributions of Y variable scores above can be presented in the form of a
histogram as shown in Figure 3 below.
Fig 4:- Histogram variable frequency score Y
3
6
9
8
6
3
0
1
2
3
4
5
6
7
8
9
10
73 – 81 82 – 90 91 – 99 100 – 108 109 – 117 118 – 126
Freq
uen
cy
Interval Class
Page 9
Volume 3, Issue 9, September – 2018 International Journal of Innovative Science and Research Technology
ISSN No:-2456-2165
IJISRT18SP16 www.ijisrt.com 165
Based on the data in the table, it can be calculated the mean (mean), mode, median, standard deviation, and normality test
results as follows:
1. Average
X̅ =∑ 𝑓𝑖Yi
∑ 𝑓𝑖=
3478
35= 99,37
2. Mode
Known class mode is in interval classes 91 - 99 with a frequency of 9, so:
b = 90,5
p = 9
b1 = 9 – 6 = 3
b2 = 9 – 8 = 1
Mo = 𝑏 + 𝑝 (𝑏1
𝑏1 + 𝑏2
) = 90,5 + 9 (3
3 + 1) = 90,5 + 9 (0,75)
= 90,5 + 6,75
= 106,52 3. Median
The median is known to be in the interval class 91 - 99, so that: b = 90,5
p = 9
n = 35
F = 9
f=9
Me = 𝑏 + 𝑝 (
1
2𝑛 − 𝐹
𝑓) = 90,5 + 9 (
17,5 − 9
9) = 90,5 + 9(0,94)
= 90,5 + 8,5 = 99
4. Standard deviation
SD = √n ∑ fiXi
2 − (∑ fi Xi)2
n(n − 1)= √
35 (351182) − (3478)2
35(34)
=√12291370 − 12096484
1190= √
194886
1190
= √163,77 = 12,8
The results of calculating the mean, mode, median, and standard deviation variables of the quality of school administration
services can be seen in the following Table 9.
Data Mean Mode Median Standard Deviation
Value 99.37 106.25 99 12.8
Table 9. Table of mean, mode, median, and variable standard deviation Y
5. Normality Test
1. Calculating the Price of Z Class Limits
Price Z class limits are needed for price calculations (data normality test). To find out the price of Z the boundary class is
obtained through the formula:
Z = 𝑥𝑖−�̅�
𝑠
Page 10
Volume 3, Issue 9, September – 2018 International Journal of Innovative Science and Research Technology
ISSN No:-2456-2165
IJISRT18SP16 www.ijisrt.com 166
Interval
Class
Class
Limits
Z Limit
Class
Regional
Area
Limits
Area Z
Table
fh
(Lu. Z Tabelx N) f0
(𝑓0 − 𝑓ℎ)2
𝑓ℎ
72.5 -2.10 0.4821
73 – 81 0.0629 2.0128 3 0.484
81.5 -1.40 0.4192
82 – 90 0.1643 5.2576 6 0.105
90.5 -0.69 0.2549
91 – 99 0.2589 8.2848 9 0.062
99.5 0.01 0.004
100 – 108 0.2571 8.2272 8 0.006
108.5 0.71 0.2611
109 – 117 0.1611 5.1552 6 0.138
117.5 1.42 0.4222
118 – 126 0.0608 1.9456 3 0.571
126.5 2.12 0.483
x2= ∑ [(𝑓0−𝑓ℎ)2
𝑓ℎ] 1.3669
Table 10. List of Observation Frequency and Frequency of Variable Expectations Y
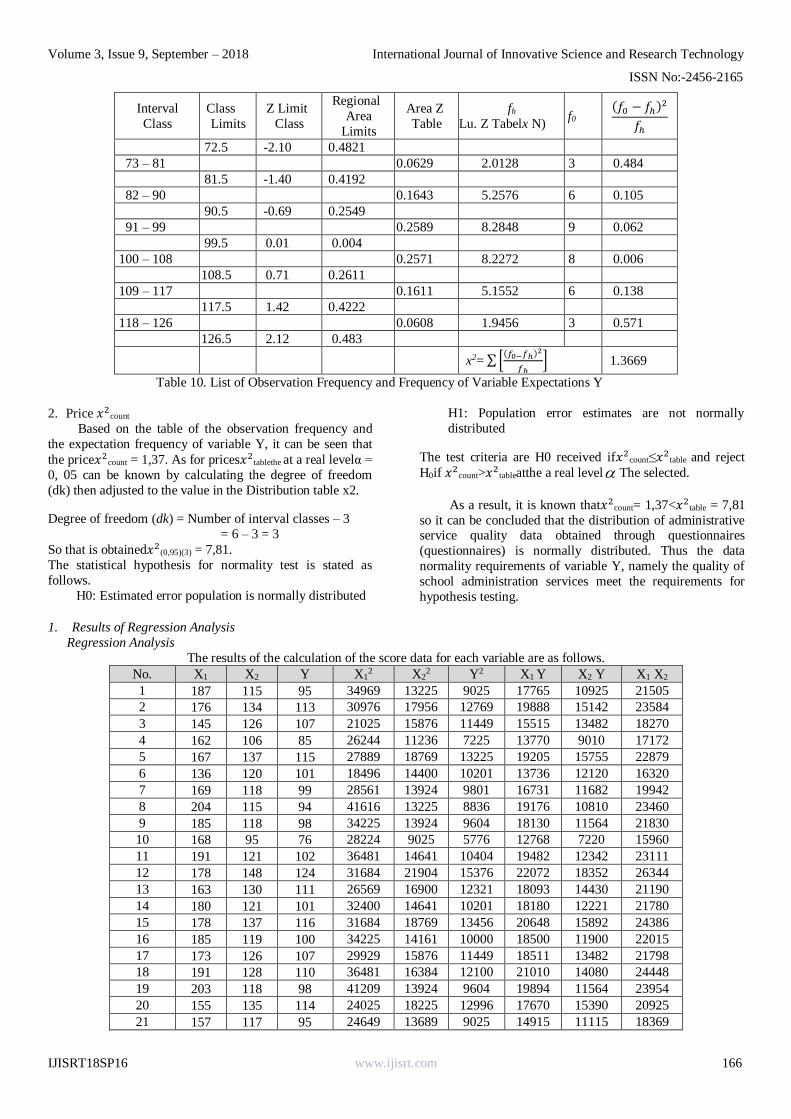
2. Price 𝑥2count
Based on the table of the observation frequency and
the expectation frequency of variable Y, it can be seen that
the price𝑥2count = 1,37. As for prices𝑥2
tablethe at a real levelα =
0, 05 can be known by calculating the degree of freedom
(dk) then adjusted to the value in the Distribution table x2.
Degree of freedom (dk) = Number of interval classes – 3
= 6 – 3 = 3
So that is obtained𝑥2(0,95)(3) = 7,81.
The statistical hypothesis for normality test is stated as
follows.
H0: Estimated error population is normally distributed
H1: Population error estimates are not normally
distributed
The test criteria are H0 received if𝑥2count≤𝑥2
table and reject
H0if 𝑥2count>𝑥2
tableatthe a real level The selected.
As a result, it is known that𝑥2count= 1,37<𝑥2
table = 7,81
so it can be concluded that the distribution of administrative service quality data obtained through questionnaires
(questionnaires) is normally distributed. Thus the data
normality requirements of variable Y, namely the quality of
school administration services meet the requirements for
hypothesis testing.
1. Results of Regression Analysis
Regression Analysis
The results of the calculation of the score data for each variable are as follows.
No. X1 X2 Y X12 X2
2 Y2 X1 Y X2 Y X1 X2
1 187 115 95 34969 13225 9025 17765 10925 21505
2 176 134 113 30976 17956 12769 19888 15142 23584
3 145 126 107 21025 15876 11449 15515 13482 18270
4 162 106 85 26244 11236 7225 13770 9010 17172
5 167 137 115 27889 18769 13225 19205 15755 22879
6 136 120 101 18496 14400 10201 13736 12120 16320
7 169 118 99 28561 13924 9801 16731 11682 19942
8 204 115 94 41616 13225 8836 19176 10810 23460
9 185 118 98 34225 13924 9604 18130 11564 21830
10 168 95 76 28224 9025 5776 12768 7220 15960
11 191 121 102 36481 14641 10404 19482 12342 23111
12 178 148 124 31684 21904 15376 22072 18352 26344
13 163 130 111 26569 16900 12321 18093 14430 21190
14 180 121 101 32400 14641 10201 18180 12221 21780
15 178 137 116 31684 18769 13456 20648 15892 24386
16 185 119 100 34225 14161 10000 18500 11900 22015
17 173 126 107 29929 15876 11449 18511 13482 21798
18 191 128 110 36481 16384 12100 21010 14080 24448
19 203 118 98 41209 13924 9604 19894 11564 23954
20 155 135 114 24025 18225 12996 17670 15390 20925
21 157 117 95 24649 13689 9025 14915 11115 18369
Page 11
Volume 3, Issue 9, September – 2018 International Journal of Innovative Science and Research Technology
ISSN No:-2456-2165
IJISRT18SP16 www.ijisrt.com 167
No. X1 X2 Y X12 X2
2 Y2 X1 Y X2 Y X1 X2
22 174 129 110 30276 16641 12100 19140 14190 22446
23 167 108 92 27889 11664 8464 15364 9936 18036
24 181 121 103 32761 14641 10609 18643 12463 21901
25 169 126 108 28561 15876 11664 18252 13608 21294
26 158 130 111 24964 16900 12321 17538 14430 20540
27 160 121 102 25600 14641 10404 16320 12342 19360
28 155 124 104 24025 15376 10816 16120 12896 19220
29 148 128 109 21904 16384 11881 16132 13952 18944
30 133 137 118 17689 18769 13924 15694 16166 18221
31 161 119 99 25921 14161 9801 15939 11781 19159
32 145 115 94 21025 13225 8836 13630 10810 16675
33 160 111 93 25600 12321 8649 14880 10323 17760
34 134 93 73 17956 8649 5329 9782 6789 12462
35 148 136 84 21904 18496 7056 12432 11424 20128
Amount 5846 4282 3561 987636 528418 366697 595525 439588 715388
Average 167.03 122.34 101.74
Table 11. Data on calculation results of each variable
Based on the data in Table 11, data analysis was performed using multiple linear regression models. Multiple linear
regression equations for 2 predictors were:
Y = a + b1X1 + b2X2
To find the regression coefficients b1, and b2, simultaneous equations can be used, as follows:
1. ∑ 𝑋1 𝑌 = 𝑏1 ∑ 𝑋12 + 𝑏2 ∑ 𝑋1𝑋2
6. ∑ 𝑋2 𝑌 = 𝑏1 ∑ 𝑋1𝑋2 + 𝑏2 ∑ 𝑋22
7. a = �̅� − 𝑏1�̅�1 − 𝑏2�̅�2
With the deviation score method, the following results are obtained:
∑ 𝑋12 = ∑ 𝑋1 −
(∑ 𝑋1)2
𝑛= 987636 −
(5846)2
35 = 11186,97
∑ 𝑋22 = ∑ 𝑋2 −
(∑ 𝑋2)2
𝑛= 528418 −
(4282)2
35 = 4545,89
∑ 𝑌2 = ∑ 𝑌 −(∑ 𝑌)2
𝑛= 366697 −
(3561)2
35 = 4390,69
∑ 𝑋1𝑌 = ∑ 𝑋1𝑌 −(∑ 𝑋1)(∑ 𝑌)
𝑛= 595525−
(5846)(3561)
35 = 736,26
∑ 𝑋2𝑌 = ∑ 𝑋2𝑌 −(∑ 𝑋2)(∑ 𝑌)
𝑛=439588 −
(4282)(3561)
35 = 3925,09
∑ 𝑋1𝑋2 =∑ 𝑋1𝑋2 −(∑ 𝑋1)(∑ 𝑋2)
𝑛= 715388 −
(5846)(4282)
35 = 171,66
Based on these results, the constant values and linear regression coefficients
Y = a + b1X1 + b2X2can be determined as follows:
1. = [(∑ 𝑋2
2)(∑ 𝑋1𝑌)− (∑ 𝑋2𝑌)(∑ 𝑋1𝑋2)]
[(∑ 𝑋12)(∑ 𝑋2
2)− (∑ 𝑋1𝑋2)2]
= [(4545,89)(736,26)− (3925,09)(171,66)]
[(11186,97)(4545,89)− (171,66)2]
= [3346940,83 − 673769]
[50854693,6 – 29466,17]
= 2673171,83
50825227,43
= 0,053
2. b2 = [(∑ 𝑋1
2)(∑ 𝑋2𝑌)− (∑ 𝑋1𝑌)(∑ 𝑋1𝑋2)]
[(∑ 𝑋12)(∑ 𝑋2
2)− (∑ 𝑋1𝑋2)2]
= [(11186,97)(3925,09)− (736,26)(171,66)]
[(11186,97)(4545,89)− (171,66)2]
Page 12
Volume 3, Issue 9, September – 2018 International Journal of Innovative Science and Research Technology
ISSN No:-2456-2165
IJISRT18SP16 www.ijisrt.com 168
= [43909821,75 − 126383]
[50854693,6− 29466,17]
= 43783437,94
50825227,43
= 0,861
3. a = (∑ 𝑌) − 𝑏1(∑ 𝑋1)− 𝑏2(∑ 𝑋2)
𝑛
= (3561) − 0,053 (5846)− 0,861 (4282)
35=
3561 −307,47 − 3688,73
35
= −435,21
35 = -8,369
So the regression equation is:
Y = -8,369 + 0,053X1 + 0,861X2
Information: Y = bound variable (quality of administrative services)
a = constant
b1, b2 = regression coefficients
X1, X2 =independent variables (personality competence &
managerial competence)
The regression equation above can be explained as follows:
Constants of -8,369; meaning that if all the independent
variables (X) value is 0, then the quality of school
administration services (Y) the value is equal to -8,369.
The regression coefficient of personality competence
variable (X1) is 0.053; that is, if other independent
variables have a fixed value and personality competence
has increased by 1%, then the quality of school
administration services (Y) will increase by 5.3%. A
positive coefficient means that there is a positive
relationship between personality competency and the
quality of school administration services. The higher the
value of personality competency, the more the value of
the quality of administrative services will increase.
Conversely, the lower the value of personality competency, the lower the value of the quality of school
administration services.
The regression coefficient of personality competence
variable (X2) is 0.861; that is, if other independent
variables have a fixed value and managerial competence
has a 1% increase, the quality of school administration
services (Y) will increase by 86.1%. A positive
coefficient means that there is a positive relationship
between managerial competence and the quality of
school administration services. The higher the value of
managerial competence, the more the value of the quality
of school administration services will increase, on the contrary, the lower the value of managerial competence,
the lower the value of the quality of school
administration services.
Dual Correlation Analysis (R) This analysis is used to determine the relationship
between two or more independent variables (X1, and X2)
with the dependent variable (Y) simultaneously. This
coefficient shows how much the relationship occurs between
independent variables (X1, and X2) simultaneously on the
dependent variable (Y). The value of R ranges from 0 to 1,
the value is getting closer to 1 meaning the relationship is
getting stronger, whereas the value is getting closer to 0 then
the relationship is getting weaker. According to Sugiyono
(2007) guidelines for interpreting the correlation coefficient
are as follows:
Coefficient interval Level of Influence
0,00 – 0,199 Very low
0,20 – 0,399 Low
0,40 – 0,599 Medium
0,60 – 0,799 Strong
0,80 – 1,00 Very strong
Table 12. Guidelines for interpretation of correlation coefficients
The equation for calculating multiple correlation coefficients with the following two independent variables.
R2 = 𝑏1(∑ 𝑋1𝑌) + 𝑏2(∑ 𝑋2𝑌)
∑ 𝑌2 = 0,053 (736,26) + 0,861 (3925,09)
4390,69
R2= 38,72 + 3381,27
4390,69 =
3419,99
4390,69= 0,7789
R= 0,8826
Based on data analysis obtained the R value of 0.8826. This shows that there is a very strong relationship between the entire
independent variable (X) on the quality of administrative services (variable Y).
Page 13
Volume 3, Issue 9, September – 2018 International Journal of Innovative Science and Research Technology
ISSN No:-2456-2165
IJISRT18SP16 www.ijisrt.com 169
Determination Analysis (R2)
Determination analysis in multiple linear regression is used to determine the percentage contribution of the
influence of independent variables (X1, and X2)
simultaneously on the dependent variable (Y).
Determination coefficient (R2)
R2 =𝐽𝐾 (𝑟𝑒𝑔)
∑ 𝑌2 = (𝑏1(∑ 𝑋1𝑌) + 𝑏2 (∑ 𝑋2𝑌)
∑ 𝑌2)
2
From the results of the regression analysis, the R value
is 0.8826 so that the value of R2 can be determined as
follows.
R2 = (0,8826)2
= 0,7789
Based on data analysis obtained the R2 value of
0.7789 or (77.89%). This shows that the percentage of the
contribution of the influence of the independent variable (X)
on the dependent variable (the quality of administrative services) is 77.89%, or the variation of the independent
variables used in the model (variable X) is able to give an
effect of 77.89% on the dependent variable (quality of
school administration services). While the remaining
22.11% is influenced by other variables that are not included
in this research model.
Test Regression Coefficients Together (Test F)
This test is used to determine whether the independent
variables (X1, X2) together (simultaneously) significantly
influence the dependent variable (Y), or to find out whether
the regression model can be used to predict the dependent variable or not. Significantly means that the relationship that
occurs can apply to all administrative staff at the Madrasah
Aliyah Negeri Gorontalod Madrasah Aliyah with a
population of 35 people.
The hypothesis for the F test in this study is as follows:
H0 = The independent variables simultaneously / together
have no significant effect on the dependent variable.
H1 = independent variables simultaneously / together have a
significant effect on the dependent variable.
The basis for decision making in testing the hypothesis is:
WhenFcount<Ftable (α = 0,05), then rejectH1
When Fhitung>Ftable (α = 0,05), then rejectH1.
Significance test of the effect of regression independent
variables on the dependent variable simultaneously using the
formula:
F = 𝑅2(𝑛 − 𝑘 − 1)
𝑘(1−𝑅2)
with:
F : The coefficient of determination
n : Number of samples
k : number of independent predictors / variables.
So that the calculated F value can be calculated as follows:
F = 0,7789 (35 − 2 − 1)
2(1− 0,7789)
F = 0,7789 (32)
2 (0,2211)
F = 24,9254
0,4422
= 56,37 R2
So the price of F count = 56.37. This price is then
compared to the price of F table. For the numerator (k) = 2
and for the denominator (n - k - 1) = 35 - 2 - 1 = 32, the F table value is obtained at the level = 0.05 of 3.29 (calculated
using Microsoft Office Excel with the equation = FINV
(0.05,2,32)).
The decision method in testing the hypothesis is:
WhenFcount<Ftable (α = 0,05), then reject H1
WhenFcount>Ftable (α = 0,05), then reject H1
In accordance with the results of the data analysis, the
fcount value was 56.37 while the value of fabel at the level
= 0.05 was 3.29. Thus, the value of Fcount>Ftable and the hypothesis accepting H1 is that the independent variables
simultaneously / jointly have a significant effect on the
dependent variable. Thus, it can be concluded that the test
results are simultaneously (together), variable X (personality
competence (X1), and managerial competence (X2)) has a
significant influence on variable Y (quality of school
administration services).
Partial Regression Coefficient Test (t test)
This test is used to determine whether the regression
models of independent variables (X1, and X2) partially
(individually) have a significant effect on the dependent variable (Y). The t test basically shows how far the influence
of an independent variable individually influences the
variation of the dependent variable. Hypothesisstatistics for t
test is as follows:
H0 = Each independent variable has no significant effect
on the dependent variable.
H1 = Each independent variable has a significant effect
on the dependent variable.
The basis for decision making in testing the hypothesis is:
Whentcount<ttable (α = 0,05), then reject H1 When tcount>ttable (α = 0,05), then reject H1.
Significance test of the effect of regression
independent variables on the dependent variable partially
using the formula:
|𝑡0𝑖| = 𝑏𝑖
𝑆𝑏𝑖
𝑆𝑒 = √∑ 𝑌2 − 𝑏1 (∑ 𝑋1𝑌) − 𝑏2(∑ 𝑋2𝑌)
𝑛 − 𝑘 − 1
Page 14
Volume 3, Issue 9, September – 2018 International Journal of Innovative Science and Research Technology
ISSN No:-2456-2165
IJISRT18SP16 www.ijisrt.com 170
𝑟12 =𝑛 ∑ 𝑋1𝑋2 − ∑ 𝑋1 ∑ 𝑋2
√[𝑛 ∑ 𝑋12 − (∑ 𝑋1)2][𝑛 ∑ 𝑋2
2 − (∑ 𝑋2)2]
𝑆𝑏1 =𝑆𝑒
√(∑ 𝑋12)(1− 𝑟12
2)dan 𝑆𝑏2 =
𝑆𝑒
√(∑ 𝑋22)(1− 𝑟12
2)
So,
𝑆𝑒 = √∑ 𝑌2 − 𝑏1 (∑ 𝑋1𝑌) − 𝑏2(∑ 𝑋2𝑌)
𝑛 − 𝑘 − 1
𝑆𝑒 = √4390,69 − 0,053 (736,26) − 0,861(3925,09)
35 – 2 − 1
𝑆𝑒 = √4390,69 − 38,724 − 3381,27
32
𝑆𝑒 = √970,69
32
𝑆𝑒 = √30,33
𝑆𝑒 =5,51
Furthermore,
𝑟12 =𝑛 ∑ 𝑋1𝑋2 − ∑ 𝑋1 ∑ 𝑋2
√[𝑛 ∑ 𝑋12 − (∑ 𝑋1)2][𝑛 ∑ 𝑋2
2 − (∑ 𝑋2)2]
𝑟12 =35 (715388) − (5846)(4282)
√[35 (987636) − (5846)2][35 (528418) − 42822]
𝑟12 =25038580 − 25032572
√[34567260 − 34175716][18494630 − 18335524]
𝑟12 =6008
√[391544][159106]
𝑟12 =6008
√62296999664
𝑟12 = 6008
249593,67
𝑟12 = 0,024
Based on these results, it can be calculated the regression coefficient value of each independent variable (X) to the dependent
variable (Y) as follows.
1. T test for personality competence variables (X1) on the quality of school administration services (Y), namely:
𝑆𝑏1 =𝑆𝑒
√(∑ 𝑋12)(1 − 𝑟12
2)
𝑆𝑏1 =5,51
√(11186,97)(1 − 0,022)
𝑆𝑏1 =5,51
√(11186,97)(0,1)
𝑆𝑏1 =5,51
√11180,49
𝑆𝑏1 =5,51
105,74
𝑆𝑏1 = 0,005
Page 15
Volume 3, Issue 9, September – 2018 International Journal of Innovative Science and Research Technology
ISSN No:-2456-2165
IJISRT18SP16 www.ijisrt.com 171
So,
t1= |𝑏1
𝑆𝑏1|= |
0,053
0,005|= 10,01
2. T test for managerial competence variables (X2) on the quality of school administration services (Y), namely:
𝑆𝑏2 =𝑆𝑒
√(∑ 𝑋12)(1 − 𝑟12
2)
𝑆𝑏2 =5,51
√(4545,89)(1 − 0,0242)
𝑆𝑏2 =5,51
√(4545,89)(0,1)
𝑆𝑏2 =5,51
√4543,25
𝑆𝑏2 =5,51
67,4
𝑆𝑏2 = 0,082
So,
t2= |𝑏2
𝑆𝑏2|= |
0,861
0,082|= 10,54
So the price of t count for the X1 variable is 10.01, and
for the X2 variable is 10.54. Furthermore, the price of t table
with degrees of freedom (dk) = n - k = 35 - 2 = 33. Thus the
value of t table is obtained at the level = 0.05 of 2.03
(calculated using microsoft office excel with the equation =
TINV (0.05, 33)).
In accordance with the results of data analysis, the
results of the study can be concluded that:
[1]. Personality competency variable (X1), the calculated t
value is 10.01. The significance value at the level of α = 5% or 0.05 is 2.03. Thus, the personality competency
factor partially has a significant effect on the quality of
administrative services because of the value of t count> t
table.
[2]. Managerial competence variable (X2), the calculated t
value is 10.54. The significance value at the level of α =
5% or 0.05 is 2.03. Thus, managerial competence factors
partially have a significant effect on the quality of
administrative services because of the value of tcount> t
table.
Based on the results of the analysis, the research
hypothesis is to accept H1, ie each independent variable has
a significant effect on the dependent variable.
Discussion of Research Results
The administration and quality of educational
administration services at schools are given very much
determined by school administration personnel. School
administration personnel are tasked with providing
administrative support services for the implementation of
the school education process. School administration
personnel are educational staff who are tasked with providing administrative support services for the
implementation of the education process in schools. They
are non teaching staff who work in schools which are often
referred to as administration. In Kepmendiknas No. 053 / U /
2001 concerning Guidelines for Preparing Minimum Service
Standards for Organizing Schools in the Basic and
Secondary Education Sector, it is stated that School
Administration Personnel are human resources in schools
that are not directly involved in teaching and learning
activities but strongly support their success in school
administration activities.
School MAN InsanGorontalo Scholar as one of the
schools / madrasas considered superior in Gorontalo
Province. This is certainly not free from the competence of the education administration staff at the school, such as
personality competencies and managerial competencies.
According to Ismuha, et al. (2016: 49), someone's personal
competence in managing education is demanded with a good
personality and noble character, able to develop a culture
and noble moral traditions, and become a noble example for
the community in the school. Leaders are also expected to
have personality integrity as leaders and have a desire strong
in self-development and open in carrying out tasks.
According to Satyawan (2016: 40), leaders and managers
that are people who lead and manage school management must have the basics and terms of leadership and must
understand the basic functions of management. Managerial
competence is the ability to manage resources through
planning, organizing, directing and supervising activities to
achieve organizational goals effectively and efficiently.
Based on the results of the descriptive analysis, the
competency of the personality of the education
administration personnel, in this case, is that the
administration is in good criteria with a percentage reaching
81.88%. Furthermore, the managerial competence of the
head of administration is in good criteria with the percentage reaching 82.66%. Thus, the high percentage value of
personality competency of administrative staff and
managerial competence of the head of administration is
Page 16
Volume 3, Issue 9, September – 2018 International Journal of Innovative Science and Research Technology
ISSN No:-2456-2165
IJISRT18SP16 www.ijisrt.com 172
expected to be able to support in implementing / providing
administrative services in schools.
Tjiptono in Taman (2013: 101) suggests that good
service quality has a close relationship with customer
satisfaction. Quality of service gives encouragement to
customers to establish strong ties with the institution. As
such, this kind of relationship allows the institution to
understand customers' expectations and their needs in
education carefully. According to the results of data
analysis, the quality of school administration services is in
good criteria with a percentage reaching 82.05%. This
shows that there are good administrative competencies and
managerial competencies of the head of good administration, resulting in a good quality of school
administration services.
In accordance with the results of the regression
analysis, the form of regression equations between employee
personality variables in the administrative system of
managerial competency variables, head of administration,
and the quality of school administration service quality
variables in the work environment with employee
performance is Y = -8,369 + 0,053X1 + 0,861X2. This
regression model shows that if all the independent variables (X) value is 0, then the quality of administrative services (Y)
the value is -8,369. Furthermore, the regression coefficient
of personality competence variable (X1) is 0.053; that is, if
other independent variables have a fixed value and
personality competence has increased by 1%, then the
quality of school administration services (Y) will increase
by 5.3%.
The coefficient is positive means that there is a
positive relationship between personality competency and
the quality of school administration services. The higher the
value of personality competence, the higher the quality of school administration services, on the contrary, the lower the
value of personality competence also decreases the quality
of school administration services. (X2) of 0.861; that is, if
another independent variable has a fixed value and
managerial competence has a 1% increase, then the quality
of the administrative services of the school (Y) will increase
by 86.1%. The coefficient is positive means that there is a
positive relationship between managerial competency and
the quality of school administration services. The higher the
value of managerial competence, the more the value of the
quality of school administration services, the lower the value of managerial competence, the lower the quality of school
administration services.
Tjiptono, et al. (2003: 70) states that service quality
reflects the comparison between service levels compared to
customer expectations. Service quality is realized by
meeting customer needs and desires as well as the accuracy
of delivery in balancing or exceeding customer expectations.
Service quality is centered on efforts to meet needs and
customer desires and delivery accuracy to offset customer
expectations. Based on Law Number 20 of 2003 concerning National Education Standards, it is explained that school
education services consist of content standards, process
standards, graduate competency standards, standards of
educators and education personnel, facilities and infrastructure standards, management standards, financing
standards, and educational assessment standards .
Simultaneously (together), the personality competence
of administrative staff (X1), and managerial competence of
the head of administration (X2) have a significant influence
on the quality of school administration services.
Furthermore, partially, the personality competency of
administrative staff has a significant influence on the quality
of school administration services. Later, managerial
competencies in the administration have a significant
influence on the quality of school administration services.
V. CONCLUSION
Based on the results of the analysis of research data
about the relationship of personality competencies and
managerial competency of administrative staff with quality
of school administration services in MAN Insan Cendekia
Gorontalo, can be summarized as follows: 1) personality
competence of administrative staff in Madrasah Aliyah
NegeriInsan Cendekia Gorontaloberada in good criteria with
percentage reached 81.88%. 2) the managerial competence of the head of administration is in good criteria with a
percentage reaching 82.66%. 3) The quality of school
administration services administrative personnel is in good
criteria with a percentage reaching 82.05%. 4) There is a
strong relationship between the personality competencies of
administrative staff and managerial competence of the head
of administration with the quality of school administration
services in the Madrasah Aliyah NegeriInsan Cendekia
Gorontalo, where the regression value (R) is 0.8826.
REFERENCES
[3]. Admodiwirio, Soebagio. 2000. Indonesian Education
Management. Jakarta: PT. Ardadiza Jaya.
[4]. Arikunto, Suharsimi. 1993. Management Research.
Jakarta: PT. RinekaCipta.
[5]. ________. 2010. Research Procedure: An Approach to
Practice. Jakarta: RinekaCipta.
[6]. Asmani, Jamal Ma'mur. 2011. Practical Tips for
Building and Managing School Administration.
Yogyakarta: Diva press.
[7]. Ismuha, Khairudin, Djailani AR. 2016. Kompetensi
Manajerial Kepala Sekolah Dalam Meningkatkan Kinerja Guru Pada SD Negeri Lamklat Kecamatan
Darussalam Kabupaten Aceh Besar. Jurnal
Administrasi Pendidikan Pascasarjana Universitas
Syiah Kuala Volume 4, No. 1, Hal. 46 – 55.
[8]. Jasfar, Farida. 2005. Service Management (Integrated
Approach). Bogor: Ghalia Indonesia.
[9]. Kadarman, AM. &Udaya, J. 2006. Introduction to
Management Science. Jakarta: Gramedia Main
Library.
[10]. Khaeruddin, H and MahfudJunaedi. 2007. Education
Unit Concept Level Curriculum and Implementation in Madrasas. Yogyakarta: Pillar of Media.
Page 17
Volume 3, Issue 9, September – 2018 International Journal of Innovative Science and Research Technology
ISSN No:-2456-2165
IJISRT18SP16 www.ijisrt.com 173
[11]. Kunandar. 2007. Professional teacher. Jakarta:
Rajawali Press. [12]. Government Regulation Number 19 of 2005, Article
28 paragraph 3 concerning National Education
Standards.
[13]. Minister of National Education Regulation No.24 of
2008 concerning School / Madrasah Administrative
Staff Standards.
[14]. Permenkes No. 971 of 2009, Article 1 paragraph 3
concerning Competence.
[15]. Purwanto, Ngalim. 2010. Administration and
Supervision of Education. Bandung: Teenagers
Rosdakarya.
[16]. Ramayulis, H. 2013. Teacher Profession and Ethics. Jakarta: KalamMulia.
[17]. Rangkuti, Freddy. 2006. Measuring Customer
Satisfaction. Jakarta: PT Gramedia Pustaka Utama.
[18]. Robbin, Stephen P. 2006. Organizational behavior
(Transfer of language: Benjamin Molan). Klanten: PT.
Gramedia Group Index.
[19]. Sagala, Syaiful. 2009. Administration of
Contemporary Education. Bandung: Alfabeta.
[20]. ________. 2013. Teacher's Professional Ability and
Education Personnel. Contents: Alfabeta.
[21]. Satyawan, Made Puja.2016. Managerial Competence of the Head of Vocational High School (Case Study in
SMK Negeri 1 Terbanggi Besar). Thesis. Postgraduate
Master of Education Management Education and
Education Master's Degree Program in Master of
Education.
[22]. Sinambela, et al. 2010. Public Service Reform Theory,
Policy, and Implementation. Jakarta: PT BumiAksara.
[23]. Stoner, James. AF. 2006. Management (Volume 1,2)
Alfonsus Sirait. Jakarta: Erlangga.
[24]. Sudarmanto, 2009. HR Competency Performance and
Development. Yogyakarta: Student Library.
[25]. Sudjana. 2002. Statistics Method. Bandung: Tarsito. [26]. Sugiyono. 2010. Quantitative, Qualitative and R & D
Research Methods. Bandung: Alfabeta.
[27]. Suhardan, Dadang. 2010. Professional Supervision.
Bandung: Alfabeta.
[28]. Suharsa Putra, Uhar. 2010. Educational
Administration. Bandung: RefikaAditama.