Page 1
S.G.. Roy et. al..: Relationships between land use, predicted pollution loadings, and ecotoxicological assays in
constructed wetlands
Romanian Journal of Ecology & Environmental Chemistry ● Vol.2 ● No.2 ● 2020
118
Relationships between land use, predicted pollution loadings, and
ecotoxicological assays in constructed wetlands https://doi.org/10.21698/rjeec.2020.215 Proceedings Paper
SUBHOMITA GHOSH ROY1*, TIMOTHY J. EHLINGER1,2
1Department of Biological Sciences, University of Wisconsin - Milwaukee, PO Box 413, Milwaukee 53201- 0413, USA 2Institute for Systems Change and Peacebuilding, University of Wisconsin Milwaukee, PO Box 413, Milwaukee 53201-
0413, USA
*Corresponding author (e-mail): [email protected]
Abstract Environmental degradation related to uncontrolled development resulted in the passage of the United States
Clean Water Act (CWA) in 1972, with the stated purpose “to restore and maintain the integrity of the
nation’s waters”. Implementation of the CWA leads to increased research to develop multimetric indicators
to better measure and understand the complex patterns of ecological responses to stress occurring across
levels of biological, spatial, and temporal organization. One area of research is the use of integrated indices
of chemical risk, ecotoxicological risk, and ecological risk to assess the impact of human activity across
disturbance gradients of urbanization. Selecting relevant metrics for constructing a multimetric index
requires identifying bioindicator organisms with capacities to detect signals from anthropogenic
disturbances. This study explored the potential efficacy of a suite of higher plant ecotoxicological assays for
use as bioindicators in ecological risk assessment along a gradient of urbanization in a wetland ecosystem.
The study was conducted in the Pike River watershed (Racine, Wisconsin, USA) in six wetlands selected
across a gradient of dominant land use types (agricultural, commercial, residential, undeveloped, and
industrial). MicroBioTest PhytotoxkitTM ecotoxicological assays, based on growth inhibition of three plants
(Sinapis, Sorghum, and Lepidium) were used to assess sediment toxicity. The relationships between
Phytotoxkit™ responses and predicted pollutant loadings calculated from surrounding land use provided
clear signals of stress from watershed pollutants draining into the wetland sites. The potential for these
ecotoxicological indicators to serve as biological response signatures is strong, and further research and
calibration in field and microcosms studies will assist in calibrating responses for use in integrated
monitoring efforts.
Keywords: bioindicators, ecotoxicology, ecological risk assessment, pollutant loading, wetlands
INTRODUCTION Urbanization is one of the major drivers of
degraded surface water quality [1], attributable
to increasing impervious surface area
contributing to higher stormwater runoff into
local streams, rivers, lakes, and wetlands [2].
This runoff in turn carries increased
concentrations and loadings of nutrient and
heavy metal pollutants contributing to a
deterioration in the quality of the receiving
waters [3] (Fig. 1). Increased public awareness
of the interconnections between changes in land
cover and surface water quality contributed to
the passing of the US Clean Water Act (CWA)
in 1972, establishing quality standards for
surface waters and setting limits for the
discharge of pollutants and excess nutrients [4,
5]. But CWA created a challenge for bridging
the gap between the science of environmental
monitoring, social-ecological domains of
designated uses (e.g. fishable-swimmable), and
the interconnected biogeochemical cycles
affecting protective numerical criteria (e.g.
phosphate standards) [6]. To this end, it became
imperative to incorporate diverse disciplinary
perspectives in the selection of metrics and
indicators for use in monitoring programs [7].
The U.S. Environmental Protection Agency
(USEPA) initially promoted the use of
monitoring strategies that integrated metrics of
water quality parameters, whole-effluent
toxicity testing, and ambient biological assays
[8]. This “3-legged stool” approach has proven
to be limited in its capacity to characterize
ecological integrity across diverse
environmental contexts [9-11]. To develop
more effective and robust monitoring strategies,
the use of biological assays and bioindicators
has increased steadily [8, 9]. Concurrent with
Page 2
S.G.. Roy et. al..: Relationships between land use, predicted pollution loadings, and ecotoxicological assays in
constructed wetlands
Romanian Journal of Ecology & Environmental Chemistry ● Vol.2 ● No.2 ● 2020
119
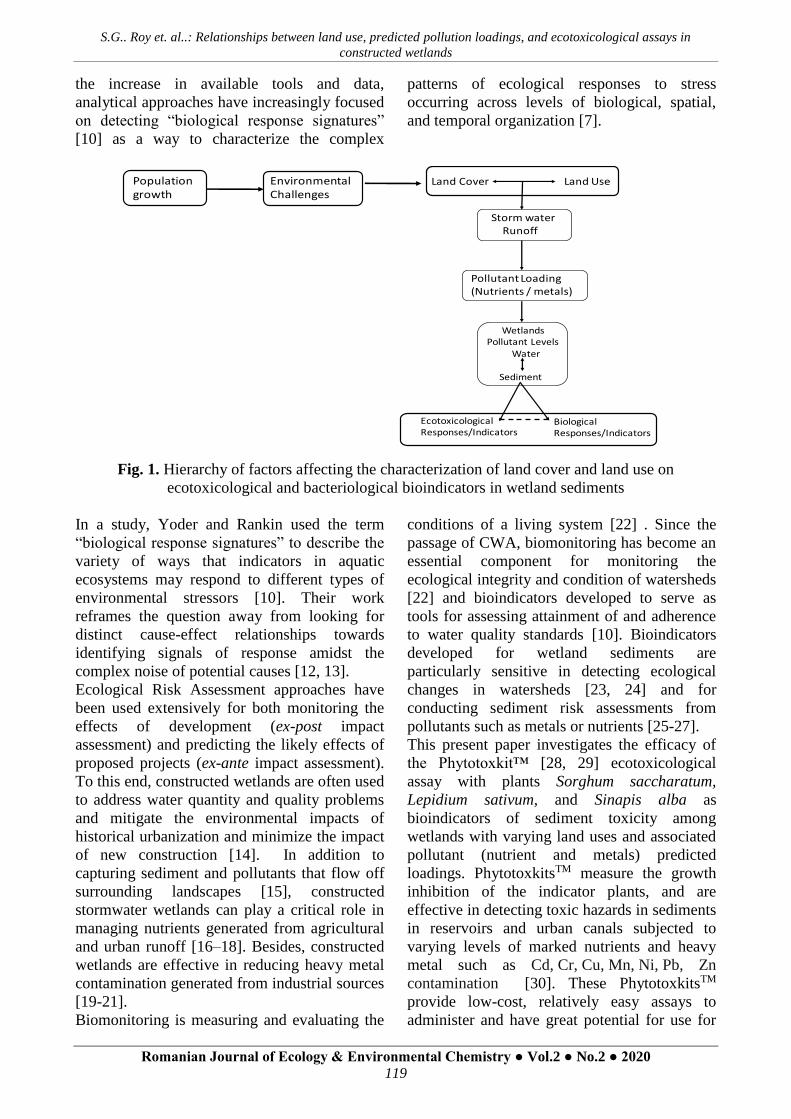
the increase in available tools and data,
analytical approaches have increasingly focused
on detecting “biological response signatures”
[10] as a way to characterize the complex
patterns of ecological responses to stress
occurring across levels of biological, spatial,
and temporal organization [7].
Fig. 1. Hierarchy of factors affecting the characterization of land cover and land use on
ecotoxicological and bacteriological bioindicators in wetland sediments
In a study, Yoder and Rankin used the term
“biological response signatures” to describe the
variety of ways that indicators in aquatic
ecosystems may respond to different types of
environmental stressors [10]. Their work
reframes the question away from looking for
distinct cause-effect relationships towards
identifying signals of response amidst the
complex noise of potential causes [12, 13].
Ecological Risk Assessment approaches have
been used extensively for both monitoring the
effects of development (ex-post impact
assessment) and predicting the likely effects of
proposed projects (ex-ante impact assessment).
To this end, constructed wetlands are often used
to address water quantity and quality problems
and mitigate the environmental impacts of
historical urbanization and minimize the impact
of new construction [14]. In addition to
capturing sediment and pollutants that flow off
surrounding landscapes [15], constructed
stormwater wetlands can play a critical role in
managing nutrients generated from agricultural
and urban runoff [16–18]. Besides, constructed
wetlands are effective in reducing heavy metal
contamination generated from industrial sources
[19-21].
Biomonitoring is measuring and evaluating the
conditions of a living system [22] . Since the
passage of CWA, biomonitoring has become an
essential component for monitoring the
ecological integrity and condition of watersheds
[22] and bioindicators developed to serve as
tools for assessing attainment of and adherence
to water quality standards [10]. Bioindicators
developed for wetland sediments are
particularly sensitive in detecting ecological
changes in watersheds [23, 24] and for
conducting sediment risk assessments from
pollutants such as metals or nutrients [25-27].
This present paper investigates the efficacy of
the Phytotoxkit™ [28, 29] ecotoxicological
assay with plants Sorghum saccharatum,
Lepidium sativum, and Sinapis alba as
bioindicators of sediment toxicity among
wetlands with varying land uses and associated
pollutant (nutrient and metals) predicted
loadings. PhytotoxkitsTM measure the growth
inhibition of the indicator plants, and are
effective in detecting toxic hazards in sediments
in reservoirs and urban canals subjected to
varying levels of marked nutrients and heavy
metal such as Cd, Cr, Cu, Mn, Ni, Pb, Zn
contamination [30]. These PhytotoxkitsTM
provide low-cost, relatively easy assays to
administer and have great potential for use for
LandCoverLandUse
StormwaterRunoff
PollutantLoading(Nutrients/metals)
WetlandsPollutantLevels
Water
Sediment
EcotoxicologicalResponses/Indicators
BiologicalResponses/Indicators
Populationgrowth
EnvironmentalChallenges
Page 3
S.G.. Roy et. al..: Relationships between land use, predicted pollution loadings, and ecotoxicological assays in
constructed wetlands
Romanian Journal of Ecology & Environmental Chemistry ● Vol.2 ● No.2 ● 2020
120
routine evaluations as bioindicators [31, 32].
The question addressed in this paper is, does
variation in growth inhibition of PhytoTox™
ecotoxicological assays (Sorghum saccharatum,
Lepidium sativum, and Sinapis alba) correlate
with variation in pollution-related stressors as
predicted loadings estimate that enter wetlands
from their surrounding watersheds?
MATERIALS AND METHODS
Study-system, land use, and site characteristics
This study was conducted in the Pike River
watershed (Racine County, Wisconsin USA)
utilizing a series of stormwater wetlands that
were constructed between 2001 and 2008 as
structural features in a flood-control plan
implemented by the Village of Mount Pleasant.
The plan included significant modifications in
channel morphology, the creation of riparian
wetland-pond systems, and the installation of
fish habitat along an 8 km stretch of the river
[33-35]. The wetlands were excavated to
receive runoff from adjacent catchments that
comprised of a combination of agricultural,
commercial, residential, undeveloped, and
industrial land uses [33-35]. Six individual
wetlands were selected for this study to capture
a gradient of dominant land cover types (Fig.
2). The catchment area and percent land use
(residential, commercial, industrial, agricultural,
and undeveloped) for each wetland were
determined from Southeastern Wisconsin
Regional Planning Commission or SEWRPC,
2010 Racine County map book [36] and are
shown in Table 1.
1
2
3
4
5
6
N
Fig. 2. Aerial photograph of the Pike River North Branch (Google 2015) showing locations
(42043’N and 87052’W, scale: 4.1 cm = 1967 m) of study wetlands and surrounding land use
(Southeastern Wisconsin Regional Planning Commission, SEWRPC 2010)
Table 1. Watershed area (hectares) and cover percentages as a percent of the watershed area of
wetland study sites in the Pike River watershed
Wetland site
Land Cover (Percent of Watershed)
Watershed
Area (ha)
Percent
Residential
Percent
Commercial
Percent
Industrial
Percent
Agricultural
Percent
Undeveloped
1 104.45 11.00 15.10 12.10 61.60 0.00
2 334.18 42.30 0.00 0.00 57.50 0.00
3 267.46 41.80 0.00 0.00 58.20 0.00
4 2.88 58.90 6.00 0.00 35.20 0.00
5 493.72 15.70 14.20 20.80 0.00 49.30
6 720.00 0.00 72.20 20.20 0.00 7.20
Page 4
S.G.. Roy et. al..: Relationships between land use, predicted pollution loadings, and ecotoxicological assays in
constructed wetlands
Romanian Journal of Ecology & Environmental Chemistry ● Vol.2 ● No.2 ● 2020
121
Pollution loading estimates
Pollutant loadings into wetland sites were
estimated based upon the calculated land uses
draining into each wetland. The percent land
use measurements for each category within the
area draining into each wetland site was
provided in Source Load and Management
Model or SLAMM [37], run by Village of
Mount Pleasant, Racine County Wisconsin,
2011 during the construction of these wetlands
(Fig. 3 and 4). By default, agricultural lands
were incorporated into the category of the
undeveloped land in SLAMM, due to its use as
an urban planning model [33, 37]. Therefore,
land classifications were manually re-coded to
agricultural land uses by cross-comparison with
the 2010 SEWRPC land cover data [36]. All
land use measurements were converted from
acres as provide by SLAMM to square meters.
The percent of land uses was calculated with
respect to the total area of the land cover
draining into the wetlands. Values for each of
the land use categories (residential, industrial,
commercial, undeveloped, and agricultural) are
the summation of the source subcategories (e.g.
roofs, street area, parking, driveways, sidewalks
and landscaped area) (Fig. 3 and 4) [38].
Predictions for pollutant loadings (nitrate +
nitrite, phosphate, Zn, Pb, Cu, and Cd) were
estimated using the geometric mean of values
measured from studies reported in the literature
[39–44] by the source area subcategories (e.g.
roofs, street area, parking, driveways,
sidewalks, and landscaped area) of each land
use category (residential, industrial,
commercial, undeveloped and agricultural)
(Table 2). Due to the inadequacy of data the
loading estimates of nitrate and metals like Ag,
As, Hg, and Ni could not be calculated. Then
the total pollutant loadings in Kg/year were
calculated by multiplying the pollutant loading
estimates from the literature by the source area
(m2) subcategories (e.g. roofs, street area,
parking, driveways, sidewalks, and landscaped
area) of each land use category (residential,
industrial, commercial, undeveloped and
agricultural) in a year. This produces the total
pollutant loading at each wetland site by land
use category (residential, industrial,
commercial, undeveloped, and agricultural) in a
year. These calculated loadings are shown in
Figure 4 and Table 2.
Fig. 3. Percentage of land use types for the drainage basins for the six constructed wetlands used in
this study. Land use data from the Southeastern Wisconsin Regional Planning Commission
(SEWRPC) 2010, were accessed through the Racine County Map Server website.
http://racinecounty.maps.arcgis.com
Page 5
S.G.. Roy et. al..: Relationships between land use, predicted pollution loadings, and ecotoxicological assays in
constructed wetlands
Romanian Journal of Ecology & Environmental Chemistry ● Vol.2 ● No.2 ● 2020
122
3A
3B
1.4A
1.4B
Fig. 4. (A) Predicted model of total nutrient (nitrate-nitrite and phosphate) area-weighted loadings
(kg/year) from land use runoffs for wetland sites 1-6. (B) Predicted model of total metal (Cd, Cu,
Zn, Pb) area-weighted loadings (kg/year) from land use runoffs for wetland sites 1-6
Each error bar is constructed using one standard error (± 1 SE) from the mean.
Table 2. Predicted area-weighted loading and total loadings of nutrients and metals for wetland site
1-6 based upon land use and watershed area Area Weighted Loadings (mg/m2/year)
Wetland
Site
Watershed
Area (ha)
Nitrate-
Nitrite Phosphate Cd Cu Pb Zn
1 104.45 0.21 1.06 0.00 0.04 0.11 0.21
2 334.18 0.19 0.98 0.00 0.03 0.05 0.15
3 267.46 0.18 1.04 0.00 0.04 0.05 0.17
4 2.88 0.31 0.95 0.00 0.02 0.07 0.18
5 493.72 0.41 0.94 0.02 0.05 0.08 0.24
6 720.00 0.39 0.71 0.00 0.05 0.05 0.19
Total Loading from Watershed (kg/year)
Wetland
Site
Watershed
Area (ha)
Nitrate-
Nitrite Phosphate Cd Cu Pb Zn
1 104.45 2.19 11.07 0.04 0.41 1.18 2.24
2 334.18 6.34 32.92 0.22 1.00 1.69 5.12
3 267.46 4.81 27.80 0.19 1.07 1.38 4.61
4 2.88 0.08 0.27 0.00 0.00 0.02 0.05
5 493.72 20.24 46.34 1.36 3.46 3.96 11.87
6 720.00 28.08 51.26 0.27 3.60 3.73 14.32
Sediment sampling collection
Sediment samples were collected from the six-
wetland sites. During summer 2015, a core
sampler (5 x 50 cm) was used to collect
sediment samples to a depth of 10-15 cm from
the top surface layer at three locations (two at
both shorelines and the third one at the middle
zone) for each wetland site. Sediments were
homogenized in the field and were divided into
two replicates, yielding two samples per site or
a total of 12. Based upon results from the Fall
2015 samples, the sediment collection process
was modified in fall 2016 and summer 2017 by
using an Ekman dredge grab sampler (15 x 15 x
25 cm) to gather a greater amount of sediment
Page 6
S.G.. Roy et. al..: Relationships between land use, predicted pollution loadings, and ecotoxicological assays in
constructed wetlands
Romanian Journal of Ecology & Environmental Chemistry ● Vol.2 ● No.2 ● 2020
123
from the upper surface layer, without
compressing the sediment samples [42]. In fall
2016, at each wetland site, samples were
collected at two different locations from the
edge zone. Sediments were homogenized in the
field and were divided into three replicates,
yielding three samples per site or a total of 18.
During summer 2017, two edge and two middle
zone samples were collected. This process
yielded four samples per site in 2017 or a total
24. All Samples were stored in Nalgene 1-liter
bottles on ice before transport to the laboratory.
There were total of 54 sediment samples from
all sampling times. At the laboratory, samples
were stored at -250C for eco-toxicological
studies.
Ecotoxicological Assays
Ecotoxicological tests were carried out
following the standard operational procedures
of the PhytotoxkitTM solid sample test (seed
germination and early growth microbiotest with
higher plant) developed by Microbiotest,
Belgium that complies with ISO Standard
18763 for validation [28]. The PhytotoxkitTM
uses three plant species: monocot Sorghum
saccharatum, dicot Lepidium sativum, and
Sinapis alba [28]. Control and test sediments
were added and saturated with distilled water in
PVC test plates (21 x 15.5 x 0.8 cm). To
saturate 90 ml of control sediment 35 ml of
distilled water was added with help of a syringe
as per the reference test of PhytotoxkitTM [28].
For the test sediments, the volume of water
(Vsat) needed for complete hydration of the test
soil was determined by adding 50 ml of distilled
water to the soil and then subtracting the
amount of supernatant recovered after
saturation for every test sediment. The filter
paper was placed on top of each of the control
and test sediments after saturating them with
distilled water and ten seeds of the same plant
were placed on the filter paper in one row and
at equal distance from each other. This was
repeated with all the three seed species. Plates
were incubated at 25°C in darkness for 72
hours. Digital images were taken of all the
plates, and stem and root lengths were
measured using Image J™ software [43]. The
proportion of root and stem length inhibition of
the test sample plants were calculated relative to
the control plant growth to generate growth
inhibition indices. One Phytotoxkit test TM
combined the growth inhibition test plates for
Sorghum saccharatum, Lepidium sativum, and
Sinapis alba. Hence with 54 sediment samples,
each test had 162 test plates (54x3). The same
test was repeated twice yielding 310 sediment
plates. Some sediment collected were not
enough to do two tests.
Data Analyses
Data distributions were examined for normality
and were transformed as necessary to meet the
assumptions of statistical tests. Count and
length data were transformed using a log
transformation (log10 (X + 1)) while
proportional data were transformed using an
arcsine transformation [44] before statistical
analyses conducted using JMP® 14 [45].
Effect of predicted nutrients and metals on Growth Inhibition
Multifactor Analysis of variance (ANOVA) was
used to examine the effects of predicted
pollutants (nutrients and metals) loadings and
seed species on growth inhibition of Lepidium
sativum, Sinapis alba, and Sorghum
saccharatum. Land use was assumed to not
have changed significantly over the course of
the study, and as such, the ANOVA tests for the
effect of predicted loadings from the
surrounding land use on the stem and root
growth inhibitions (the dependent response
variable) included loadings and seed species
and year as independent variables. ANOVA
tests for the effect of predicted loading of
individual (Cd, Cu, Pb, Zn) metals from the
surrounding land use on growth inhibition (the
dependent response variable) included loadings
and seed species and year as independent
variables.
Page 7
S.G.. Roy et. al..: Relationships between land use, predicted pollution loadings, and ecotoxicological assays in
constructed wetlands
Romanian Journal of Ecology & Environmental Chemistry ● Vol.2 ● No.2 ● 2020
124
RESULTS AND DISCUSSION
Ecotoxicological bioindicators
Proportion root and stem growth inhibition
values are calculated relative to growth in
control sediments (clean silica sand) so that
positive values indicate inhibition (i.e. reduced
growth = inhibition) whereas negative values
indicate growth stimulation (i.e. increased
growth = stimulation). For Lepidium sativum,
root inhibition ranged from -1.5 to +1.5 and
stem inhibition ranged from -0.75 to +1.25. For
Sinapis alba, root inhibition varied from -1.5 to
+1.25 and stem inhibition ranged from -1 to
+1.25. For Sorghum saccharatum, the
proportion root inhibition ranged from -1.5 to
+1.25 and stem inhibition ranged from -3.5 to
+1.5. Responses varied among wetland sites
and between years. Sorghum exhibited
consistently higher growth inhibition for both
roots and stem across the study compared to the
other two-bioindicator species (Fig. 5). Wetland
1 exhibited consistently the lowest inhibition
(highest stimulation) values for Lepidium
sativum and Sinapis alba, whereas wetlands 3
and 4 exhibited higher inhibition (Fig. 5).
Seed species
Sinapis Sorghum
-0.6
-0.4
-0.2
0.0
0.2
0.4
0.6
-0.8
-0.6
-0.4
-0.2
0.0
0.2
0.4
0.6
1 2 3 4 5 6 1 2 3 4 5 6 1 2 3 4 5 6
Sampling time
Fall 2016
Summer 2015
Summer 2017
Wetland Site
Lepidium
Grow
th I
nh
ibit
ion
Grow
th I
nh
ibit
ion
(A) Stem
(B) Root
Fig. 5. Variation of growth inhibition of the bioindicator plant species (Lepidium sativum, Sinapis
alba, Sorghum saccharatum) and wetland sites in three sampling dates of Fall 2016, Summer 2015,
and 2017. (A) Stem Inhibition and (B) Root Inhibition. Each error bar is constructed using one
standard error (± 1 SE) from the mean.
Ecotoxicological bioindicator, responses to pollution stress
a. Nutrient Effects
For predicted nutrient loading ANOVA models
the dependent variables were the growth
inhibitions and the independent x variables
included predicted total nutrient loadings and
seed species. This model initially considered the
year as an independent variable but as no
significant effect of this variable was observed,
the year effect was not considered in the final
model (Fig. 6). This final model detected no
statistically significant effects of predicted
nutrient loadings or the seed species on the root
growth inhibition of Lepidium sativum, Sinapis
alba, Sorghum saccharatum (Fig. 6, P-values:
seed species = 0.5024, Nitrate and nitrite
loading = 0.4916, phosphate loading = 0.8761,
nutrient interaction = 0.9162). Although with
an increase in the nitrate + nitrite and phosphate
loading decrease in the root growth inhibition
was observed. This suggests that the root
inhibition was negatively affected by the
Page 8
S.G.. Roy et. al..: Relationships between land use, predicted pollution loadings, and ecotoxicological assays in
constructed wetlands
Romanian Journal of Ecology & Environmental Chemistry ● Vol.2 ● No.2 ● 2020
125
predicted nutrient loadings. There were
significant results for stem growth inhibition.
There was a significant effect of the seed
species (P<0.0001) with the highest inhibition
in Sorghum saccharatum, nitrate and nitrite
loading (P = 0.0041), and the nutrient
interaction (P = 0.0116) on stem growth
inhibition of Lepidium sativum, Sinapis alba,
Sorghum saccharatum. However, the effect of
phosphate loading was not significant for stem
growth inhibition (P=0.0898) (Fig. 6). Stem
growth inhibition was observed to be
decreasing with nitrate and nitrite loading, but
increasing with phosphate loading (Fig. 6).
Implying the negative effect of nitrate and
nitrite loading on the stem growth inhibitions.
Seed Species Predicted total nutrient loading (Kg/year)
Nitrate+nitrite Phosphate
Nitrate+nitrite Phosphate
Fig. 6. Prediction profiles from ANOVA showing the effects of seed species and the predicted total
loadings of total nitrate + nitrite and phosphate (kg/year) on the growth inhibitions of stems and
roots for the bioindicator species Lepidium sativum, Sinapis alba, Sorghum saccharatum. The blue-
lined area in each profile represents the 95% confidence prediction interval of the response variable.
The profiler is set for nitrate + nitrite at 1.96 kg/year, phosphate at 26.23 kg/year in case of root
growth inhibition, and nitrate + nitrite at 10.91 kg/year, phosphate at 26.23 kg/year in case of stem
growth inhibition.
b. Metal Effects
For predicted metal loading ANOVA models
the dependent variables were the growth
inhibitions and the independent x variables
included predicted total metal loadings and seed
species. This model initially considered the year
as an independent variable but as no significant
effect of this variable was observed, the year
effect was not considered in the final model
(Fig. 7). The effects of heavy metal loadings
predicted by the land cover on root inhibition
were not statistically significant except for Pb
(Fig. 7). P-values for root inhibition: seed
species = 0.4359, Cd loading = 0.3064, Cu
loading = 0.9990. Pb loading = 0.0168, Zn
loading = 0.6119, metal loading interactions =
0.4625). Decreased root inhibition (i.e.
facilitated root growth) was associated with an
increase in Pb loading (Figure 7). Likewise, the
effects of heavy metal loadings predicted by
land cover on stem inhibition were not
significant (P-values for effect on stem
inhibition: Cd loading = 0.3167, Cu loading =
Page 9
S.G.. Roy et. al..: Relationships between land use, predicted pollution loadings, and ecotoxicological assays in
constructed wetlands
Romanian Journal of Ecology & Environmental Chemistry ● Vol.2 ● No.2 ● 2020
126
0.6489, Pb loading = 0.1512, Zn loading =
0.9076, metal loading interaction = 0.4629).
Suggesting that suggest that the Pb loading as
predicted (in Kg/year) in these wetland sites (1-
6) did not affect these three plant bioindicator
species of Lepidium sativum, Sinapis alba, and
Sorghum saccharatum negatively. Seed species
responded differently to predicted metal
loadings. For stem inhibition, the effect of seed
species effect was significant (P <.0001) with
highest inhibition observed in Sorghum
saccharatum (Fig. 7).
Cu PbCd Zn
Pb
Cd Cu Pb Zn
Seed Species Predicted total metal loading (Kg/year)
Cd Cu Pb Zn
Fig. 7. Prediction profiles from ANOVA showing the effect of predicted total loading of Cd, Cu,
Zn, Pb in kg/year on the growth inhibitions of the bioindicator species Lepidium sativum, Sinapis
alba, Sorghum saccharatum. The blue-lined area in each profile represents the 95% prediction
confidence interval for the response variable. The profiler is set to Cd at 1.26 kg/year, Cu at 1.43
kg/year, Pb at 1.88 kg/year and Zn at 6.04 kg/year in case of root growth inhibition and Cd at 1.25
kg/year, Cu at 1.36 kg/year, Pb at 1.88 kg/year and Zn at 13.85 kg/year in case of stem growth
inhibition.
This study was designed to explore the potential
of PhytoTox™ ecotoxicological tests to serve as
possible bioindicators for predicted pollution
loading from surrounding land uses for wetland
ponds located in urbanizing watersheds.
Agricultural and residential land uses both
produce runoffs rich in nutrients such as
phosphate and nitrate due to the presence of
fertilizers and pesticides applied to lawns,
gardens, and agricultural fields. These fertilizers
and pesticides especially when rich in nutrients
affect plant growth [46–54]. The predicted
loadings were a constant measure over a while
(a year). The results suggest a possibility of
interactions between the loadings of nutrients
(e.g. from fertilizers) and loadings of metals
associated with these pesticides resulting in
various levels responses from Lepidium
sativum, Sinapis alba, Sorghum saccharatum
such as root inhibition was negatively affected
by the predicted nutrient loadings, the negative
effect of nitrate + nitrite loading on the stem
growth inhibitions but the Pb loading as
predicted (in Kg/year) in these wetland sites (1-
6) did not affect negatively.
The factors contributing to the differing
responses by the different ecotoxicological
bioindicator plant species is grounds for further
Page 10
S.G.. Roy et. al..: Relationships between land use, predicted pollution loadings, and ecotoxicological assays in
constructed wetlands
Romanian Journal of Ecology & Environmental Chemistry ● Vol.2 ● No.2 ● 2020
127
study. As in this paper, herbicides and metals
are well-known to affect the growth and
development of Sorghum saccharatum [49, 54].
In comparison, however, Sinapis alba and
Lepidium sativum frequently exhibited negative
inhibition (stimulation) for root and stem
growth in this paper.
CONCLUSIONS
One of the challenges for monitoring
environmental impacts in terms of the Clean
Water Act is to identify and develop indicators
that can capture and integrate the effects of
pollutants or stressors across various
(sometimes mismatched) spatial and temporal
scales. Chronic stressors such as baseline
nutrient loading from agricultural fields provide
fundamentally different signals to detect
compared to acute events such as a manure spill
or pesticide application whose detection by
direct chemical measurement may be missed
between monitoring sessions. The situation is
made more complicated by the fact that
interactions among different stressors in nature
may result in complex response patterns that
can result in the interpretation of the patterns
detected being very context-dependent.
The results of this paper provide signals of
stress from watershed pollutants draining into
the wetland sites, which should be further
explored with real measurements in the wetland
sites (1-6). A major character of a biological
sub-metrics that it should be able to detect
biological responses to human activities across
different scales, these ecotoxicological
bioindicators demonstrated evidence of stress
across different spatial scales of six different
wetlands. We estimated the chemical risk
(nutrient and metals) with the use of plant
ecotoxicological bioindicators. Our results
detected a correlation in the ecotoxicological
bioindicators with watershed pollutants that
were predicted.
ACKNOWLEDGEMENTS
This work was supported by the Village of Mount pleasant (Racine, WI).
REFERENCES
[1] WANG, L. and LYONS, J., Biological
Response Signatures: Indiactor Patterns Using
Aquatic Communities, CRC Press, 2003, p.
227.
[2] EPA, Protecting Water Quality from Urban
Runoff, United States Environ. Prot. Agency,
no. 2,
2003, p. EPA-841-F-03-003.
[3] FOLEY, J. A., DEFRIES, R., ASNER G. P.,
BARFORD, C, BONAN, G., CARPENTER, S.
R., CHAPIN, F. S., COE, M. T., DAILY, G. C,
GIBBS, H. K., HELKOWSKI, J. H.,
HOLLOWAY, T., HOWARD, E. A.,
KUCHARIK C. J., MONFREDA, C, PATZ, J.
A., PRENTICE, I. C, RAMANKUTTY, N.,
SNYDER, P. K., Science (80), 309, no. 5734,
2005, p.
570.
[4] CAREY, R., HOCHMUTH, G. J., Hort
Technol., 22, no. 4, 2012, p. 418.
[5] EPA, Summary of the Clean Water Act.,
2012.
[6] GLICKSMAN, R. L., BATZEL, M. R.,
Washingt. Univ. J. Law Policy, Washingt.
Univ. Sch. Law, 32, 2010, p. 99.
[7] CAIRNS, J.J., PRATT, J. R., Freshwater
Biomonitoring and Benthic Macroinvertebrates,
Chapman and Hali, New York, 1993, p. 10-27.
[8] KARR, J. R., Measuring Biological
integrity: lesions from stream, in S. Woodley, J.
Kay and G. Francis (Eds.), in Ecological
Integrity and Management of Ecosystems,
Delray, FL: St. Lucie Press, 1993.
[9] KARR, J. R., Predicting Aquatic
ecosystems: clean water is not enough, in W.S
Davis and T.P. Simon(Eds.), in Biological
Assessment and Criteria: Tools for Water
Resource Planning and Decision Making., Boca
Raton, FL: Lewis Publishers, 1995, p. 7-13.
[10] YODER, C, RANKIN, E., Biological
response signatures and the area degradation
value: new tools for interpreting multi-metric
data, in W.S. Davis and T.P. Simons(Eds), in
Biological Assessment and Criteria: Tools for
Water Resource Planning and Decision
Making., Boca Raton,
FL: Lewis Publishers, 1995, p. 263-286.
[11] YODER, C, RANKIN, E., Biological
Page 11
S.G.. Roy et. al..: Relationships between land use, predicted pollution loadings, and ecotoxicological assays in
constructed wetlands
Romanian Journal of Ecology & Environmental Chemistry ● Vol.2 ● No.2 ● 2020
128
criteria program development and
implementation in Ohio in W.S. Ohio and
T.P.Simon (Eds.), in Biological Assessment and
Criteria: Tools for Water Resource Planning
and Decision Making., Boca Raton, FL: Lewis
Publishers, 1995, p. 109-144.
[12] CLAPCOTT, J. E., GOODWIN, E. O.,
YOUNG, R G, KELLY, D. J., Knowl. Manag.
Aquat. Ecosyst., 2014, no. 415.
[13] CLAPCOTT, J. E., COLLIER, K. J.,
DEATH, R G, GOODWIN, E. O., HARDING,
J. S., KELLY, D., LEATHWICK, J. R,
YOUNG, R. G, Freshw. Biol., 57, no. 1, 2012,
p. 74.
[14] TIXIER, G., ROCHFORT, Q.,
GRAPENTINE, L., MARSALEK, J.,
LAFONT, M., Water Res., 46, no. 20, 2012, p.
6671.
[15] KADLEC, R, WALLACE, S., Treatment
Wetlands. CRC Press Taylor & Francis Group,
LLC, 2009.
[16] MANIOS, T., FOUNTOULAKIS, M.,
KARATHANASIS, A., Environ. Manage., 43,
no. 5, 2009, p. 908.
[17] SCHOLZ, M., HEDMARK, A., Water.
Air. Soil Pollut, 205, no. (1-4), 2010, p. 323.
[18] BEUTEL, M., MORGAN, M.,
ERLENMEYER, J., BROUILLARD, E., J.
Environ. Qual., 43, no. 3, 2014, p. 1071.
[19] KHAN, S., AHMAD, I., SHAH. M.,
REHMAN, S., KHALIQ, A., J. Environ.
Manag., 90, no. 11, 2009, p. 3451.
[20] KNOX, A., NELSON, E., HALVERSON,
N., GLADDEN, J., Soil Sediment Contam., 19,
no. 6, 2010, p. 667.
[21] SAHU, O., Int. Lett. Nat. Sci., 12, 2014, p.
35.
[22] KARR, J. R., CHU, E. W., Restoring Life
in Running Waters, Island Press, Washington
D.C., Covelo California, 1999.
[23] AYLAGAS, E., BORJA, A.,
TANGHERLINI, M., DELL'ANNO, A.,
CORINALDESI, C, MICHELL, C. T., Mar.
Pollut. Bull, 114, no. 2, 2017, p. 679.
[24] KE, X., WANG, C, JING, D., ZHANG, Y.,
ZHANG, H, Mar. Pollut. Bull., 98, 2015, p.
267.
[25] CHAPMAN, D. P. M., Environ. Toxicol.
Chem., 14, no. 9, 1995, p. 1451.
[26] JENSEN, J., Sediment toxicity and the
recovery of biological integrity in a restored
stream channel. Milwaukee., University of
Wisconsin Milwaukee, 2011.
[27] DELLINGER, M., CARVAN, M.,
KLINGER, K, McGRAW, J., EHLINGER, T.,
Challenges, 5, no. 1,2014, p. 75.
[28] MICROBIOTEST Inc, Standard
Operational Procedure, Phytotoxkit. Seed
germination and early growth microbiotest with
higher plants, Available from:
https://www.microbiotests.com [08.31.2020].
[29] CZERNIAWSKA-KUSZA, I., KUSZA, G,
Environ. Monit. Assessment., 179, no. 1-4,
2010, p. 113.
[30] CZERNIAWSKA-KUSZA, I.,
CIESIELCZUK, T., KUSZA, G., CICHON, A.,
Environ. Toxicol, 21, no. 4, 2006, p. 367.
[31] PERSOONE, G., VANGHELUWE, M.,
Toxicity determination of the sediments of the
river Seine in France by application of a battery
of microbiotests. New York: New Microbiotests
for Routine Toxicity Screening and
Biomonitoring, Kluwer Academic, 2000.
[32] SIMS, A., ZHANG, Y., GAJARAJ, S.,
BROWN, P., HU, Z., Water Res., 47, no. 5,
2013, p. 1711.
[33] CRISPELL-SYNDER, I., Executive
summary of WDNR facilitation presentation for
Pike River improvements by Mount Pleasant
Storm Water Drainage District No. 1., 1997.
[34] EHLIGER, T., DeTHORNE, L., BERNER,
B., Monitoring of stream habitat and aquatic
biotic integrity - Pike River North and South
Branches, Racine and Kenosha Counties,
Wisconsin, 2002.
[35] EHLIGER, T., DeTHORNE, L.,
Monitoring of stream habitat and aquatic biotic
integrity -Pike River North and South Branches,
Racine and Kenosha Counties, Wisconsin,
Interim Report., 2004.
[36] Southeastern Wisconsin Regional Planning
Commission, SEWRPC, Racine County
Mapbook, 2010.
[37] PITT, R., VOORHEES, J., The Source
Loading and Management Model (SLAMM), A
Water Quality Management Planning Model for
Urban Stormwater Runoff., 2000.
[38] PITT, R., VOORHEES, J., Source loading
and management model (SLAMM). Seminar
Publication: National Conference on Urban
Runoff Management: Enhancing Urban
Watershed Management at the Local, County,
and State Levels March 30 - April 2, 1993,
Cent. Environ. Res. Information, U.S. Environ.
Page 12
S.G.. Roy et. al..: Relationships between land use, predicted pollution loadings, and ecotoxicological assays in
constructed wetlands
Romanian Journal of Ecology & Environmental Chemistry ● Vol.2 ● No.2 ● 2020
129
Prot. Agency. EPA/625/R-95/003. Cincinnati.
Ohio., 1995, p. 225-243. [39] PITT, R.,
BOZEMAN, M., Sources of Urban Runoff
Pollution and Its Effects on an Urban Creek.,
Cincinnati, OH., 1982.
[40] BANNERMAN, R. T., OWENS, D. W.,
DODDS, R. B., HORNEWER, N. J., Water Sci.
Technol., 28, no. 3-5, 1993, p. 241.
[41] BANNERMAN, R., BAUN, K., BOHN,
P., GRACZYK, D., Evaluation of Urban
Nonpoint Source Pollution Management in
Milwaukee County, Wisconsin., Chicago, IL,
1983. [42] KASICH, J. T., NELLY, M.,
SCOTT, J., Sediment Sampling Guide and
Methodologies., Ohio EPA Sediment Sampl.
Guid. Environ. Prot. Agency., 2012.
[43] SCHEIDER, C. A., RASBAND, W. S.,
ELICEIRI, K. W., Nat. Methods, 9, no. 7, 2012,
p. 671.
[44] SOKAL, R., ROHLF, J., BIOMETRY,
Second. San Fransisco: W.H. Freeman and
Company, 1981.
[45] SAS, JMP®, Version <14>, SAS Institute
Inc., Cary, NC, 2019.
[46] ALTIERI, M. A., NICHOLLS, C. I., Soil
Tillage Res., 72, no. 2, 2003, p. 203.
[47] CHEN, B. M., WANG, Z. H., LI, S. X.,
WANG, G. X., SONG, H. X., WANG, X. N.,
Plant Sci., 167, no. 3, 2004, p. 635.
[48] SCHEIRS, J., BRUYN De, L. De,
Entomol. Exp. Appl., 113, no. 2, 2004, p. 109.
[49] LOPEZ-LUNA, J., GONZALEZ-
CHAVEZ, M., ESPARZA-GARCIA, F.,
RODRIGUEZ-VAZQUEZ, R., J. Hazard.
Mater., 163, no. 2-3, 2009, p. 829.
[50] PANG, J., RYAN, M. H., TIBBETT, M.,
CAWTHRAY, G. R., SIDDIQUE, K. H. M.,
BOLLAND, M. D. A., DENTON, M. D.,
LAMBERS, H., Plant Soil, 331, no. 1, 2010, p.
241. [51] LIU, C. W., SUNG, Y., CHEN, B. C,
LAI, H. Y., Int. J. Environ. Res. Public Health,
11, no. 4, 2014, p. 4427.
[52] ZHAWAR, V. K., KAUR, N., GUPTA, A.
K., J. Plant Nutr., 37, no. 13, 2014, p. 2195.
[53] SHUKLA, D., RINEHART, C. A., SAHI,
S. V., Sci. Rep., 7, no. 1, 2017, p. 1.
[54] GERIK, T., BEAN, B., VANDERLIP, R.,
Sorghum Growth and Development. Texas.,
Texas A M Univ. Syst,
http://glasscock.agrilife.org/files/2015/05/Sorgh
um-Growth-and-Development.pdf, 2010.