Full Terms & Conditions of access and use can be found at http://www.tandfonline.com/action/journalInformation?journalCode=tprs20 Download by: [150.162.55.85] Date: 24 November 2015, At: 12:16 International Journal of Production Research ISSN: 0020-7543 (Print) 1366-588X (Online) Journal homepage: http://www.tandfonline.com/loi/tprs20 Relationships between lean product development enablers and problems Guilherme Luz Tortorella, Giuliano Almeida Marodin, Diego de Castro Fettermann & Flavio Sanson Fogliatto To cite this article: Guilherme Luz Tortorella, Giuliano Almeida Marodin, Diego de Castro Fettermann & Flavio Sanson Fogliatto (2015): Relationships between lean product development enablers and problems, International Journal of Production Research, DOI: 10.1080/00207543.2015.1106020 To link to this article: http://dx.doi.org/10.1080/00207543.2015.1106020 Published online: 19 Nov 2015. Submit your article to this journal Article views: 16 View related articles View Crossmark data
Transcript
Full Terms & Conditions of access and use can be found athttp://www.tandfonline.com/action/journalInformation?journalCode=tprs20
Download by: [150.162.55.85] Date: 24 November 2015, At: 12:16
Relationships between lean product developmentenablers and problems
Guilherme Luz Tortorella, Giuliano Almeida Marodin, Diego de CastroFettermann & Flavio Sanson Fogliatto
To cite this article: Guilherme Luz Tortorella, Giuliano Almeida Marodin, Diego deCastro Fettermann & Flavio Sanson Fogliatto (2015): Relationships between lean productdevelopment enablers and problems, International Journal of Production Research, DOI:10.1080/00207543.2015.1106020
To link to this article: http://dx.doi.org/10.1080/00207543.2015.1106020
Relationships between lean product development enablers and problems
Guilherme Luz Tortorellaa*, Giuliano Almeida Marodinb,1, Diego de Castro Fettermanna and Flavio Sanson Fogliattoc
aCentro Tecnológico/DEPS, Federal University of Santa Catarina, Florianópolis, Brazil; bDepartment of Management Sciences, TheOhio State University, Columbus, OH, USA; cDepartment of Transport and Industrial Engineering, Federal University of Rio Grande
do Sul, Porto Alegre, Brazil
(Received 10 June 2015; accepted 4 October 2015)
The lean product development (LPD) approach uses lean principles and enablers (tools, techniques and practices) toreduce waste and continuously improve the product development processes (PDP). Other than reducing product develop-ment lead time, LPD also aims at improving quality by reducing problems that might occur during the process. SeveralLPD enablers are proposed in the existing literature; however, there is limited knowledge on how these enablers mayeffectively counteract the occurrence of problems in the PDP. We empirically tested the association between 4 groups ofLPD enablers and 11 groups of LPD problems in a sample of 64 companies that are undergoing lean implementation inthe shop floor and administrative areas. There are two major contributions here. First, we propose an empirically vali-dated instrument for assessing the adoption of LPD enablers and the incidence of LPD problems in companies filling anexisting gap in the literature. Second, we provide understanding on how LPD enablers can mitigate the incidence ofLPD problems, allowing companies undergoing lean implementation to better manage their PDP. Moreover, some resultsdemonstrate that the association between enablers and problems may not be as suggested in the existing literature.
Keywords: lean product development; product development problems; lean product development enablers
1. Introduction
Product development capabilities are becoming critical for companies, as the increase in global competition andmarkets’ segmentation accelerates the pace in which changes take place in many industries (Dal Forno, Forcellini, andBornia 2013; Oliver, Dostaler, and Dewberry 2004). However, companies that structured their product developmentprocess (PDP) based on traditional models may be in disadvantage regarding important dimensions such as agility,flexibility and productivity (Panizzolo et al. 2012).
Traditional PDP models usually lead to a number of problems commonly seen in companies; some of them are: (i)work overload on designers and engineers that frequently perform unnecessary tasks, (ii) a PDP model that is not clearlyunderstood by designers, (iii) project cost overruns, (iv) difficulty in retrieving knowledge from previous projects and(v) ambiguity regarding tasks’ responsibilities due to insufficient commitment of functional departments (Liker 2005;Oppenheim 2011; Rossi, Taisch, and Terzi 2012). Such problems may result from the fact that companies have tradition-ally focused their improvement efforts on shop floor (materials flow)-related issues or on supporting areas with a closerrelationship with that, such as procurement and logistics (Dekkers, Chang, and Kreutzfeldt 2013; Jayanth, Das, andNicolae 2010). To overcome such deficiencies, the application of lean thinking principles and enablers to PDP has beenproposed by academics and practitioners (Rossi, Taisch, and Terzi 2012).
Lean product development (LPD) departs from the customer’s perception of value to create new and profitable valuestreams within the organisation, exploring synergies between processes, people, tools and technology (Kumar, Sharma,and Agarwal 2015; Slack 1999). Browning and Worth (2000) emphasise that the concept of LPD goes beyond the goalof waste elimination: it aims at maximising the value added to customers, shareholders, employees, society andsuppliers. The adoption of LPD has yielded benefits to companies such as Toyota; however, achieving effective LPDimplementation has proven difficult for many other organisations (Letens, Farris, and Aken 2011).
Increasing practical significance has been attributed to the concept of LPD by companies that have succeeded inimproving their manufacturing processes, and find that product design is the new operations bottleneck (Reinertsen2009). The lean approach applied to product development leads to greater interaction between teams, flexibility and
*Corresponding author. Email: [email protected] address: Moore School of Business, University of South Carolina, Columbia, SC-USA.
dynamism, as well as shorter development lead times (Reis et al. 2013). However, since some of the enablers includedin LPD have been known before the coining of the concept, some confusion concerning definitions may arise amongpractitioners who may be familiar with the enablers but not with the concept of LPD (Karlsson and Ahlstrom 1996).Information gathered from studies at Toyota provides a clear view of LPD as a system; it becomes clear that implement-ing individual techniques from the LPD toolbox will not transform a company’s PDP. Unfortunately, reported cases ofsuccessful LPD adoption apart from Toyota are rather limited (Kennedy, Harmon, and Minnock 2008; Lander and Liker2007; Liker and Morgan 2011).
Although giving organisations the means to provide the market high-quality products in a faster and more efficientway, LPD is not yet fully recognised as a source of competitive advantage by many companies (Kreafle 2011; Reiset al. 2013). A reason for that is that organisations evolve differently according to their characteristics (Leon and Farris2011). To achieve improvements in LPD, organisations must improve value creation and work flow efficiency not justwithin, but across levels (Letens, Farris, and Aken 2011). Thus, each organisation’s maturity level will determine theresults (Reis et al. 2013).
In this paper, we propose an instrument for assessing and understanding the relationships between enablers that pro-mote LPD, providing means to mitigate product development problems in companies undergoing lean implementation.The aforementioned relationships were determined and validated through a survey carried out with 64 Brazilian compa-nies. We thus provide an empirically validated instrument for assessing LPD enablers and problems with no parallel inthe existing literature.
In addition to the method proposed here, this paper carries another significant contribution. Identifying relevant rela-tionships between product development problems and LPD enablers may contribute to specify the context in whichproblems are expected to occur. With that knowledge, companies will be able to emphasise the development of enablersthat tend to improve their operational performance.
The rest of this paper is organised as follows. A literature review on LPD is presented in Section 2. Section 3contains the research method. Results are given in Section 4, followed by conclusions in Section 5.
2. Lean product development
Researchers and practitioners took different approaches once they realised the potential benefits that the PDP couldattain by becoming lean (Khan et al. 2013). Such approaches may be classified in five categories: (i) those thatrebranded concurrent engineering as LPD (Karlsson and Ahlstrom 1996); (ii) those that viewed lean as lean manufactur-ing, and tried to adapt its various components to product development (Cooper and Edgett 2008; Reinertsen 2009); (iii)those that considered the foundation of LPD to be the Toyota Product Development System, but combined with otherideas from lean manufacturing, applying it to product development (Hines, Francis, and Found 2006; Oppenheim 2004);(iv) those that identified the Toyota Company as the foundation of lean and went to great extents to study its productdevelopment system, identifying a more comprehensive set of principles and mechanisms directly related to productdevelopment that were argued to be theoretically superior to conventional theory (Oppenheim 2011; Sobek, Liker, andWard 1998); and (v) those derived from group, with a greater focus on applications in industrial companies (Liker andMorgan 2011; Panchak 2009).
A comparison of traditional product development and LPD projects is presented in Table 1. Ward (2007) conceptu-alised LPD as a set of operational value streams that should be designed to consistently execute product developmentactivities effectively and efficiently, creating usable knowledge through learning. The building blocks of such valuestreams and knowledge creation cycle were organised in five LPD principles: value focus, entrepreneurial systemdesigner, teams of responsible experts, set-based concurrent engineering and cadence (pull and flow). Flores et al.(2011) proposed an LPD model based on four supporting tools: designing a lean transformation tool kit, mapping of the
Table 1. Traditional and LPD projects.
Traditional product development Lean product development
Team structure Teams were not used Cross-functional teamsDevelopment phases Small overlap SimultaneousIntegration vs. coordination N/A MeetingsProject management Functional team structure Heavyweight managerBlack box engineering No YesSupplier involvement Towards the end of the project From the beginning of the project
Source: Karlsson and Ahlstrom (1996).
2 G.L. Tortorella et al.
Dow
nloa
ded
by [
150.
162.
55.8
5] a
t 12:
16 2
4 N
ovem
ber
2015
LPD value stream, creation of a learning kit for LPD and methods and techniques based on lean design. Pardal, Perondi,and Valeri (2011) synthesised LPD in seven key elements: (i) set-based concurrent engineering, (ii) chief engineering asconnection between functional areas, (iii) strong integration with suppliers throughout the development process, (iv)superior technical competence, (v) simplified visual communication, (vi) search for excellence and (vii) continuousimprovement-driven culture.
Machado and Toledo (2006) point to the difference in the application of five lean principles proposed by Womack andJones (2003) in manufacturing and product development activities, as shown in Table 2. In manufacturing, lean principlesare methodically implemented, and the product is easily visualised (Karim and Zaman 2013); in product development, theprocess is not as tangible, and targets emerge as the process takes place (Fiore 2005; Venkatamuni and Rao 2010).
2.1 LPD enablers
Several methods have been proposed to improve the traditional PDP (e.g. Clark and Wheelwright 2010; Eppinger2002). Such methods, although providing some benefits to companies, do not seem sufficient to achieve the break-through improvements that characterise LPD (Letens, Farris, and Aken 2011; Liker and Morgan 2011; Morgan andLiker 2008). Much of the LPD literature concentrates on suggesting solutions to a number of problems that it establishesto be commonly found in the LPD process (Hines, Francis, and Found 2006; Kosonen and Buhanist 1995). Such toolsand techniques that focus on the integration and coordination of product development are essential to improve the flowwithin the organisation as a whole (Letens, Farris, and Aken 2011; Rauniar and Rawski 2012).
Wang et al. (2012) identify three families of enablers required for LPD according to their goals; they are: (i) thoseaiming at collecting information and providing feedback for the design process, (ii) those supporting the core activitiesof product design and development and (iii) those providing administrative support to chief engineers and staff.Womack, Jones, and Roos (1991) identify what they believe to be the set of core LPD enablers: heavyweight projectmanagers, dedicated cross-functional teams, joint decision-making involving all team members and concurrent engineer-ing. Karlsson and Ahlstrom (1996) argue that the key set of interrelated enablers comprised in LPD include supplierinvolvement, simultaneous or concurrent engineering, cross-functional teams and strategy. Furthermore, Leon and Farris(2011) outline seven knowledge domains in the LPD literature: (i) performance based, (ii) strategy, (iii) knowledge-based networks, (iv) decision based, (v) process modelling, (vi) supplier/partnership and (vii) lean manufacturing princi-ples. Definitions in the literature for different LPD enablers are provided in Table 3.
Hoppmann et al. (2011) developed a framework for organising LPD enablers. Their proposition listed the following11 interdependent components: strong project manager, specialist career path, workload levelling, responsibility-basedplanning and control, cross-project knowledge transfer, simultaneous engineering, supplier integration, product varietymanagement, rapid prototyping/simulation/testing, process standardisation and set-based engineering. Oppenheim (2011)also offers a comprehensive checklist named ‘lean enablers for systems engineering’. The checklist is an amalgamationof recommendations for systems engineering organised around six principles: (i) capture value defined by customers, (ii)map the value stream and eliminate waste, (iii) flow the work through the planned streamlined value-adding steps andprocesses, (iv) let customers pull value, (v) pursue perfection in all processes and (vi) respect people.
Despite the efforts to define LPD enablers, in Khan (2012)’s view, the differentiation between critical enablers andthose which may be substituted by equivalents is a topic still open in the literature. Field research may also be requiredto determine whether such enablers are actually adopted by industrial practitioners. Ballé and Ballé (2005) comment thatany enabler taken out of the LPD system will not yield significant efficiency gains in the development process. More-over, no integrated framework of the identified LPD enablers has been put forward in the surveyed literature nor has amethodological guide been formulated to support the application of lean thinking in engineering projects (Dekkers,Chang, and Kreutzfeldt 2013; Jayanth, Das, and Nicolae 2010; Leon and Farris 2011; Reis et al. 2013).
Table 2. Lean principles applied to manufacturing and product development.
Lean principles Manufacturing Product development
1 - Define value Visual in each step, target pre-specified Difficult to see, emerging targets2 - Identify flow of value Parts and material Information and knowledge3 - Make the value flow Interactions are waste Interactions are usually beneficial4 - Pulled from customer demand Driven by take time Driven by company’s need5 - Look for perfection Repeatable and error-free processes Process allows innovation and reduces cycle time
Source: Machado and Toledo (2006).
International Journal of Production Research 3
Dow
nloa
ded
by [
150.
162.
55.8
5] a
t 12:
16 2
4 N
ovem
ber
2015
2.2 LPD problems
In iterative processes such as product development, a key factor for value addition is getting the right information in theright place at the right time (Browning and Worth 2000). LPD consists of many interrelated enablers, which to be suc-cessfully adopted demand changes in basic values and ideas. For the most part, LPD enablers are not conceptually com-plex; therefore, problems that may arise in their implementation are mostly management related (Cusumano andNobeoka 1998; Karlsson and Ahlstrom 1996; Meybodi 2013). The use of techniques detached from the LPD mainframeis also not recommended. Browning and Worth (2000) emphasise that removing waste in a PDP context requires a sys-tem perspective, rather than focus on individual activities. Thus, a certain degree of organisational unlearning must bepursued such that old beliefs regarding procedures and measurements are deconstructed to welcome change (Leon andFarris 2011).
Problems addressed in the LPD literature may be grouped in two classes. The first one congregates problems dealingwith the effectiveness of the development process in terms of market success of newly developed products (Hines, Fran-cis, and Found 2006). Problems within this class include a lack of alignment between product development strategy andthe wider business strategic plan, unnecessary development activity, lack of understanding of customer requirements andhigh new product failure rates (Bauch 2004; Graebsch 2005; Haque and Moore 2004). The second class of problems isconcerned with the efficiency of the development process itself. These include the lack of a formal or standardised pro-cess, ineffective control of high-volume development environments, poor internal communications, lack of commonfocus, inability to improve or learn from mistakes and ultimately poor project deadline achievement and fiscal control(Oppenheim 2004; Reinertsen 2009). To address problems listed above, a major topic in the LPD literature is the identi-fication of best practices that may lead to their mitigation (Hoppmann et al. 2011; Kato 2005).
Similar to waste classification in materials flow analysis, Oehmen and Rebentich (2010) propose eight categories ofwaste in LPD: (i) waiting of people, (ii) overproduction of information, (iii) overprocessing of information, (iv) miscom-munication of information, (v) stockpiling of information, (vi) generating defective information, (vii) correcting informa-tion and (viii) unnecessary movement of people. Two fundamental root causes for such wastes are informationoverproduction and miscommunication; waiting of people may be interpreted as the end point in the waste chain (Likerand Morgan 2011; Morgan and Liker 2008; Oehmen and Rebentich 2010). Pessoa (2008) proposes two additional typesof waste (external events and wishful thinking), while Bauch (2004) adds lack of system discipline and limited ITresources to the list. Finally, reinvention and hand offs are also cited as types of product development wastes by Rauniarand Rawski (2012). Table 4 describes LPD problems mentioned in the literature and their corresponding citations.
3. Method
There are three stages to the research method proposed here: (i) questionnaire development and data collection, (ii) con-struct validity and reliability assessment and (iii) regression models. These stages are detailed in the sections to follow.
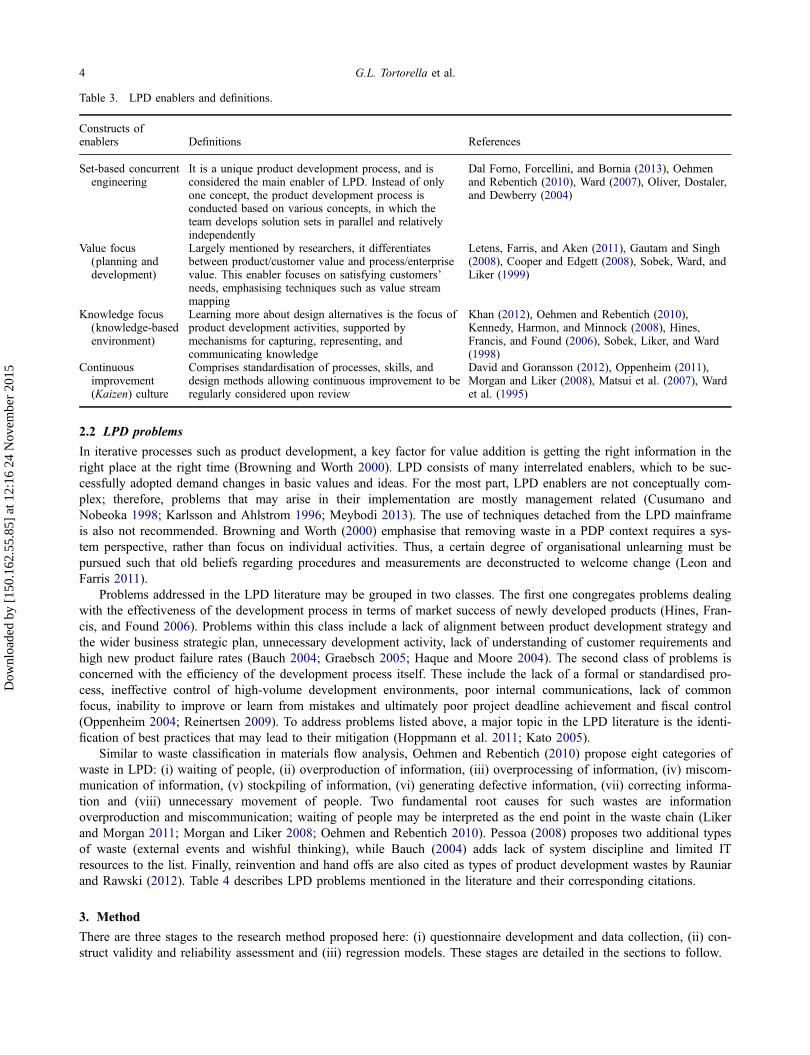
Table 3. LPD enablers and definitions.
Constructs ofenablers Definitions References
Set-based concurrentengineering
It is a unique product development process, and isconsidered the main enabler of LPD. Instead of onlyone concept, the product development process isconducted based on various concepts, in which theteam develops solution sets in parallel and relativelyindependently
Dal Forno, Forcellini, and Bornia (2013), Oehmenand Rebentich (2010), Ward (2007), Oliver, Dostaler,and Dewberry (2004)
Value focus(planning anddevelopment)
Largely mentioned by researchers, it differentiatesbetween product/customer value and process/enterprisevalue. This enabler focuses on satisfying customers’needs, emphasising techniques such as value streammapping
Letens, Farris, and Aken (2011), Gautam and Singh(2008), Cooper and Edgett (2008), Sobek, Ward, andLiker (1999)
Knowledge focus(knowledge-basedenvironment)
Learning more about design alternatives is the focus ofproduct development activities, supported bymechanisms for capturing, representing, andcommunicating knowledge
Khan (2012), Oehmen and Rebentich (2010),Kennedy, Harmon, and Minnock (2008), Hines,Francis, and Found (2006), Sobek, Liker, and Ward(1998)
Continuousimprovement(Kaizen) culture
Comprises standardisation of processes, skills, anddesign methods allowing continuous improvement to beregularly considered upon review
David and Goransson (2012), Oppenheim (2011),Morgan and Liker (2008), Matsui et al. (2007), Wardet al. (1995)
4 G.L. Tortorella et al.
Dow
nloa
ded
by [
150.
162.
55.8
5] a
t 12:
16 2
4 N
ovem
ber
2015
3.1 Questionnaire development and data collection
3.1.1 Sample
We used the following criteria to select companies and respondents. First, we targeted at companies that were (i)implementing lean both at the shop floor and office levels and (ii) geographically located in the south of Brazil in orderto control the effect of environmental factors, such as availability of skilled labour. Non-random selection of companiesin surveys on lean is a common approach; examples may be found in Saurin, Ribeiro, and Marodin (2010), Boyle,Scherrer-Rathje, and Stuart (2011), Eroglu and Hofer (2011) and Taj and Morosan (2011). Second, respondents shouldhave experience in lean and product or process development.
Questionnaires were sent by email to former students of executive education courses on lean offered by a largeBrazilian University since 2008. The institution is the only one in its region offering short courses on lean. Courses areopen to the general public. The same database of respondents was used in previous studies (e.g. Marodin and Saurin2015; Tortorella et al. 2015). A first email message containing the questionnaires was sent in March 2014, and twofollow-ups were sent in the following weeks.
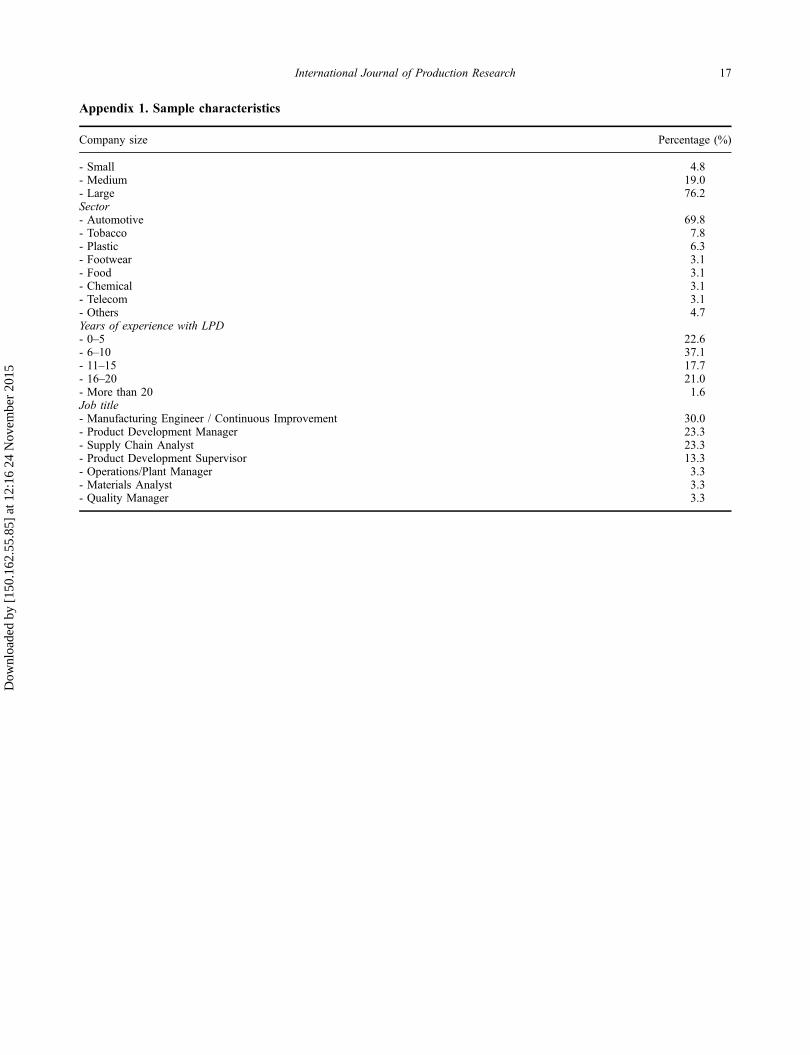
The final sample was comprised of 64 valid responses; respondents’ demographics are presented in Appendix 1.Most respondents were from large companies (76.2%); the majority of companies belonged to the automotive supplychain (69.8%). Most respondents (87.4%) had six or more years of experience with LPD. Regarding the job title, therewas a predominance of manufacturing or continuous improvement engineers (30%), product development managers(23.3%), supply chain analysts (23.3%) and product development supervisors (13.3%).
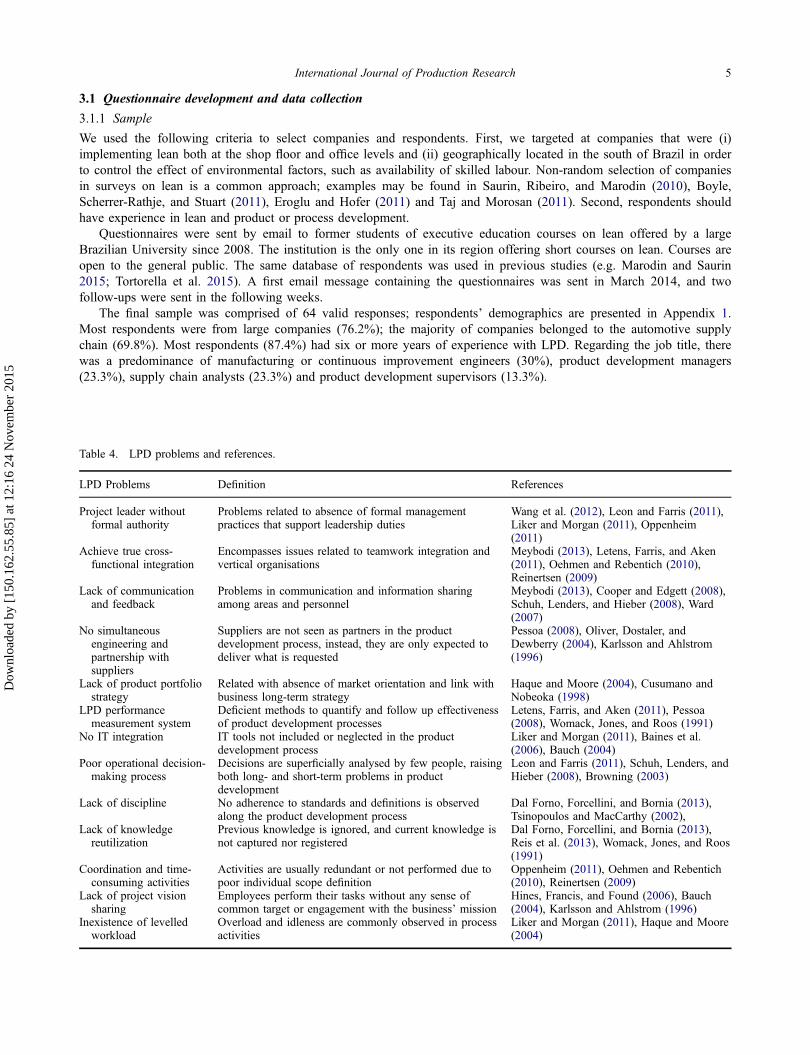
Table 4. LPD problems and references.
LPD Problems Definition References
Project leader withoutformal authority
Problems related to absence of formal managementpractices that support leadership duties
Wang et al. (2012), Leon and Farris (2011),Liker and Morgan (2011), Oppenheim(2011)
Achieve true cross-functional integration
Encompasses issues related to teamwork integration andvertical organisations
Meybodi (2013), Letens, Farris, and Aken(2011), Oehmen and Rebentich (2010),Reinertsen (2009)
Lack of communicationand feedback
Problems in communication and information sharingamong areas and personnel
Meybodi (2013), Cooper and Edgett (2008),Schuh, Lenders, and Hieber (2008), Ward(2007)
No simultaneousengineering andpartnership withsuppliers
Suppliers are not seen as partners in the productdevelopment process, instead, they are only expected todeliver what is requested
Pessoa (2008), Oliver, Dostaler, andDewberry (2004), Karlsson and Ahlstrom(1996)
Lack of product portfoliostrategy
Related with absence of market orientation and link withbusiness long-term strategy
Haque and Moore (2004), Cusumano andNobeoka (1998)
LPD performancemeasurement system
Deficient methods to quantify and follow up effectivenessof product development processes
Letens, Farris, and Aken (2011), Pessoa(2008), Womack, Jones, and Roos (1991)
No IT integration IT tools not included or neglected in the productdevelopment process
Liker and Morgan (2011), Baines et al.(2006), Bauch (2004)
Poor operational decision-making process
Decisions are superficially analysed by few people, raisingboth long- and short-term problems in productdevelopment
Leon and Farris (2011), Schuh, Lenders, andHieber (2008), Browning (2003)
Lack of discipline No adherence to standards and definitions is observedalong the product development process
Dal Forno, Forcellini, and Bornia (2013),Tsinopoulos and MacCarthy (2002),
Lack of knowledgereutilization
Previous knowledge is ignored, and current knowledge isnot captured nor registered
Dal Forno, Forcellini, and Bornia (2013),Reis et al. (2013), Womack, Jones, and Roos(1991)
Coordination and time-consuming activities
Activities are usually redundant or not performed due topoor individual scope definition
Oppenheim (2011), Oehmen and Rebentich(2010), Reinertsen (2009)
Lack of project visionsharing
Employees perform their tasks without any sense ofcommon target or engagement with the business’ mission
Hines, Francis, and Found (2006), Bauch(2004), Karlsson and Ahlstrom (1996)
Inexistence of levelledworkload
Overload and idleness are commonly observed in processactivities
Liker and Morgan (2011), Haque and Moore(2004)
International Journal of Production Research 5
Dow
nloa
ded
by [
150.
162.
55.8
5] a
t 12:
16 2
4 N
ovem
ber
2015
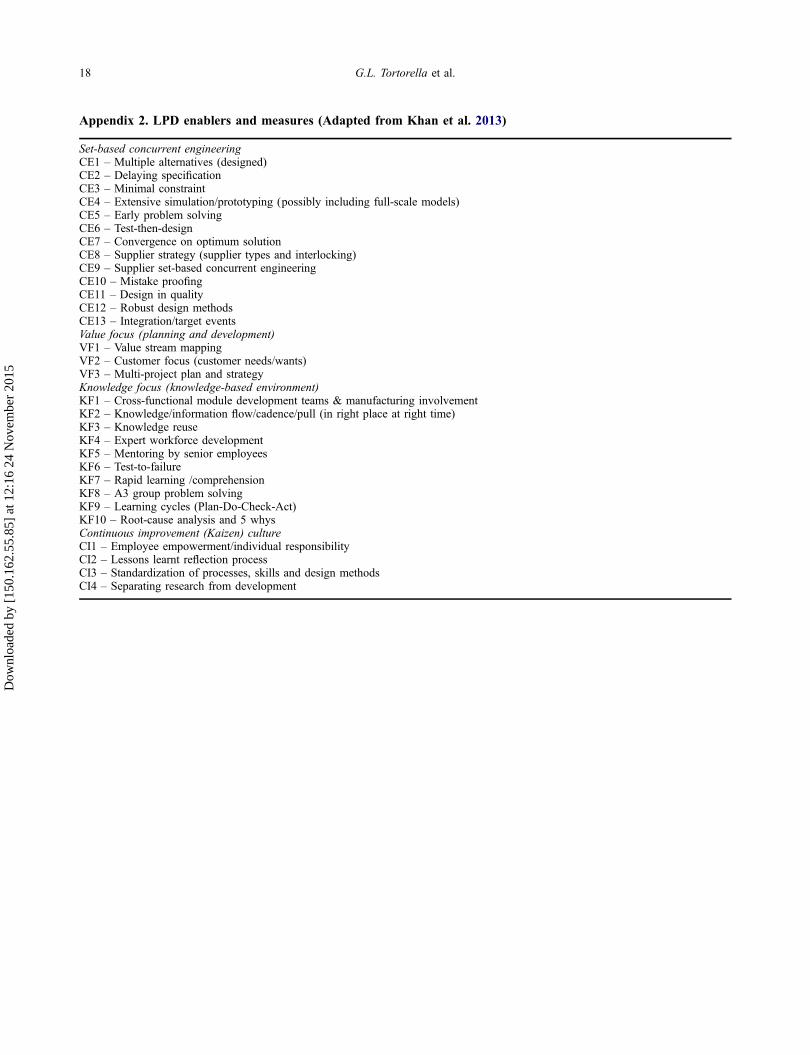
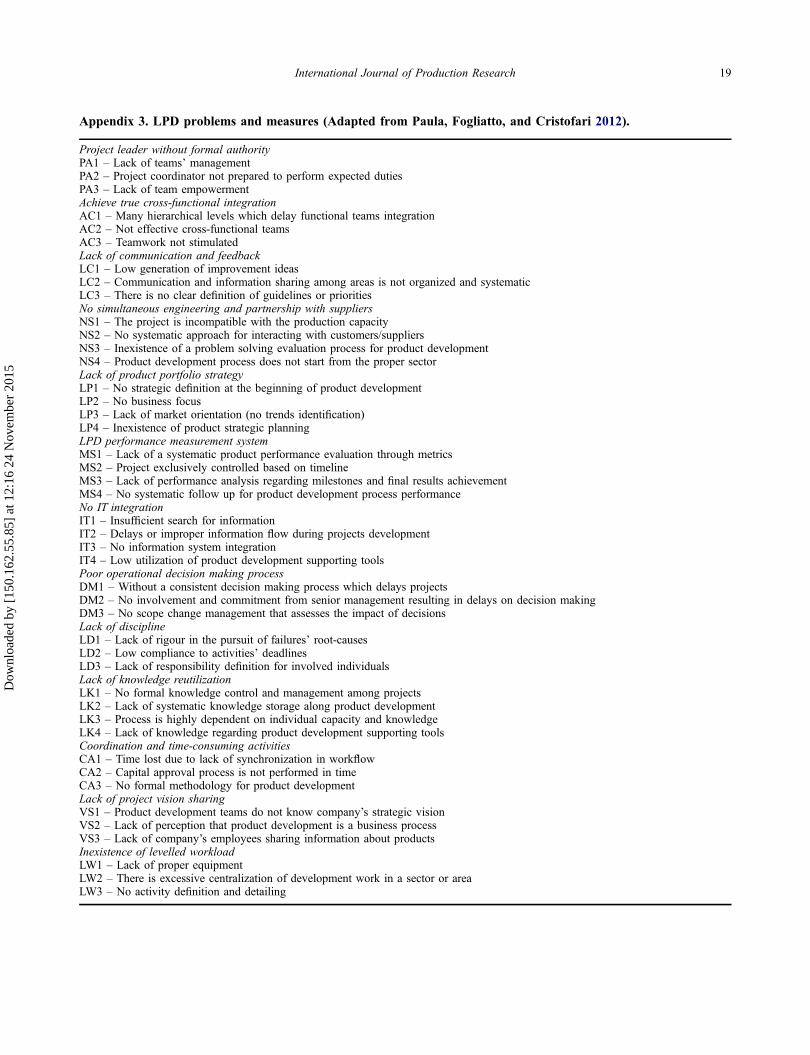
3.1.2 Questionnaire
The questionnaire had three parts. The first part was comprised of 30 questions based on Khan et al. (2013), and aimedat measuring the degree of adoption of the 4 constructs of LPD enablers described in the literature (Table 3). Thesequestions are presented in Appendix 2. Each question was answered on a scale ranging from 0 (not used) to 9 (fullyadopted). The second part of the questionnaire intended to assess the frequency of occurrence of LPD problems. The 44questions from Paula, Fogliatto, and Cristofari (2012) used to measure 13 LPD problems (Table 4) are presented inAppendix 3. A six-point scale ranging from 1 (vary rare) to 6 (very frequent) was used in the questionnaire.Demographic information of respondents and their companies was asked in the final part of the questionnaire.
3.1.3 Sample and method bias
We tested for non-response bias as proposed by Armstrong and Overton (1977) using Levene’s test for equality ofvariances and a t test for the equality of means between early (respondents of the first email sent) and late (respondentsof the two follow-ups) respondents. Results indicated no differences in means and variation in the two groups, with95% significance. Thus, there is no statistical evidence that our sample is significantly different from the rest of thepopulation.
Surveys that use data from single respondents may be affected by respondent’s bias; to minimise that we followedsome directions given by Podsakoff et al. (2003). First, dependent variables (LPD problems, in this case) were placedfirst and physically far from independent variables (LPD enablers) in the questionnaire, and used different scales (1 to 9for LPD enablers and 1 to 6 for LPD problems). Second, we verified that respondents had the proper knowledge toanswer the questionnaire, in terms of job title and work experience (Appendix 1). Third, we used Harman’s single-factortest following a Factor Analysis with all measures to test for the existence of a single factor that could account for themajority of the variance among variables. As the first factor accounted for 44% of the overall variance in the data, weconcluded for the non-existence of any common method bias.
3.2 Construct validity and reliability assessment
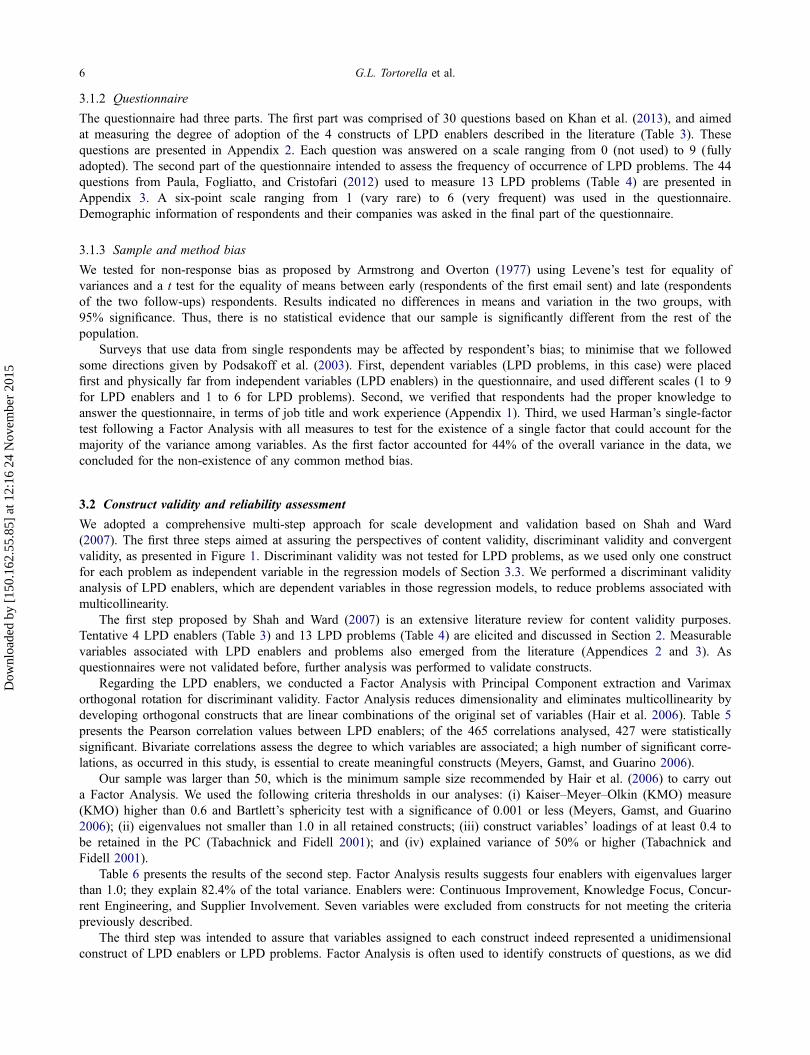
We adopted a comprehensive multi-step approach for scale development and validation based on Shah and Ward(2007). The first three steps aimed at assuring the perspectives of content validity, discriminant validity and convergentvalidity, as presented in Figure 1. Discriminant validity was not tested for LPD problems, as we used only one constructfor each problem as independent variable in the regression models of Section 3.3. We performed a discriminant validityanalysis of LPD enablers, which are dependent variables in those regression models, to reduce problems associated withmulticollinearity.
The first step proposed by Shah and Ward (2007) is an extensive literature review for content validity purposes.Tentative 4 LPD enablers (Table 3) and 13 LPD problems (Table 4) are elicited and discussed in Section 2. Measurablevariables associated with LPD enablers and problems also emerged from the literature (Appendices 2 and 3). Asquestionnaires were not validated before, further analysis was performed to validate constructs.
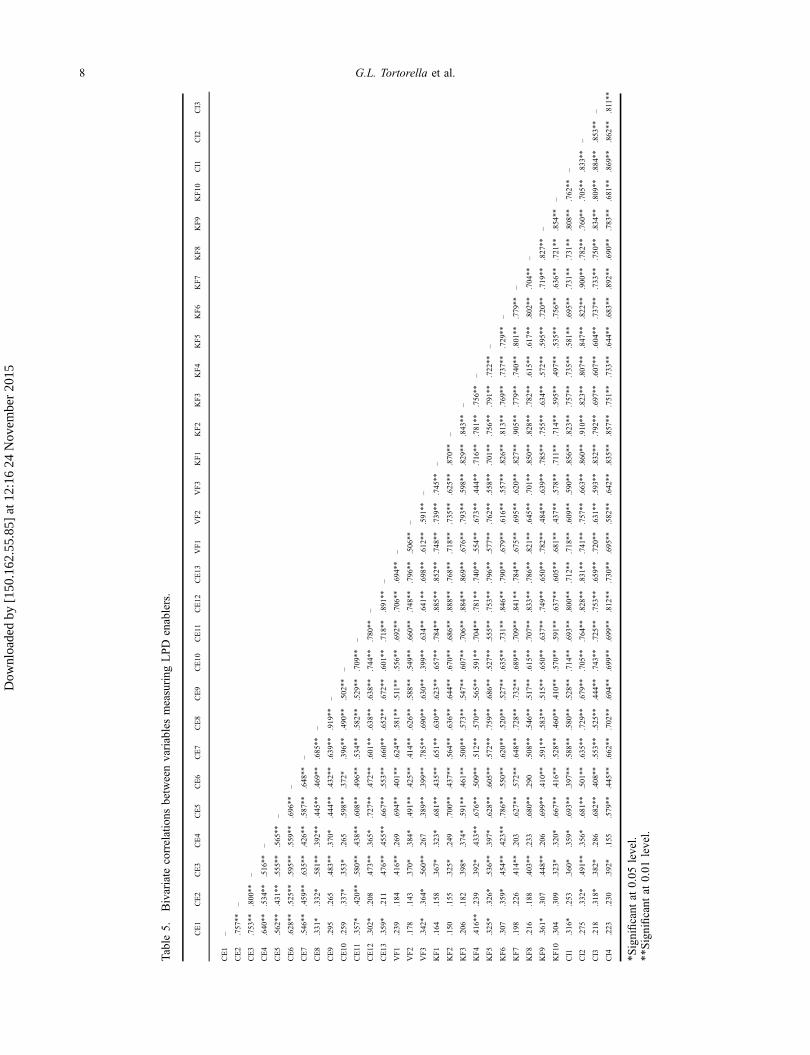
Regarding the LPD enablers, we conducted a Factor Analysis with Principal Component extraction and Varimaxorthogonal rotation for discriminant validity. Factor Analysis reduces dimensionality and eliminates multicollinearity bydeveloping orthogonal constructs that are linear combinations of the original set of variables (Hair et al. 2006). Table 5presents the Pearson correlation values between LPD enablers; of the 465 correlations analysed, 427 were statisticallysignificant. Bivariate correlations assess the degree to which variables are associated; a high number of significant corre-lations, as occurred in this study, is essential to create meaningful constructs (Meyers, Gamst, and Guarino 2006).
Our sample was larger than 50, which is the minimum sample size recommended by Hair et al. (2006) to carry outa Factor Analysis. We used the following criteria thresholds in our analyses: (i) Kaiser–Meyer–Olkin (KMO) measure(KMO) higher than 0.6 and Bartlett’s sphericity test with a significance of 0.001 or less (Meyers, Gamst, and Guarino2006); (ii) eigenvalues not smaller than 1.0 in all retained constructs; (iii) construct variables’ loadings of at least 0.4 tobe retained in the PC (Tabachnick and Fidell 2001); and (iv) explained variance of 50% or higher (Tabachnick andFidell 2001).
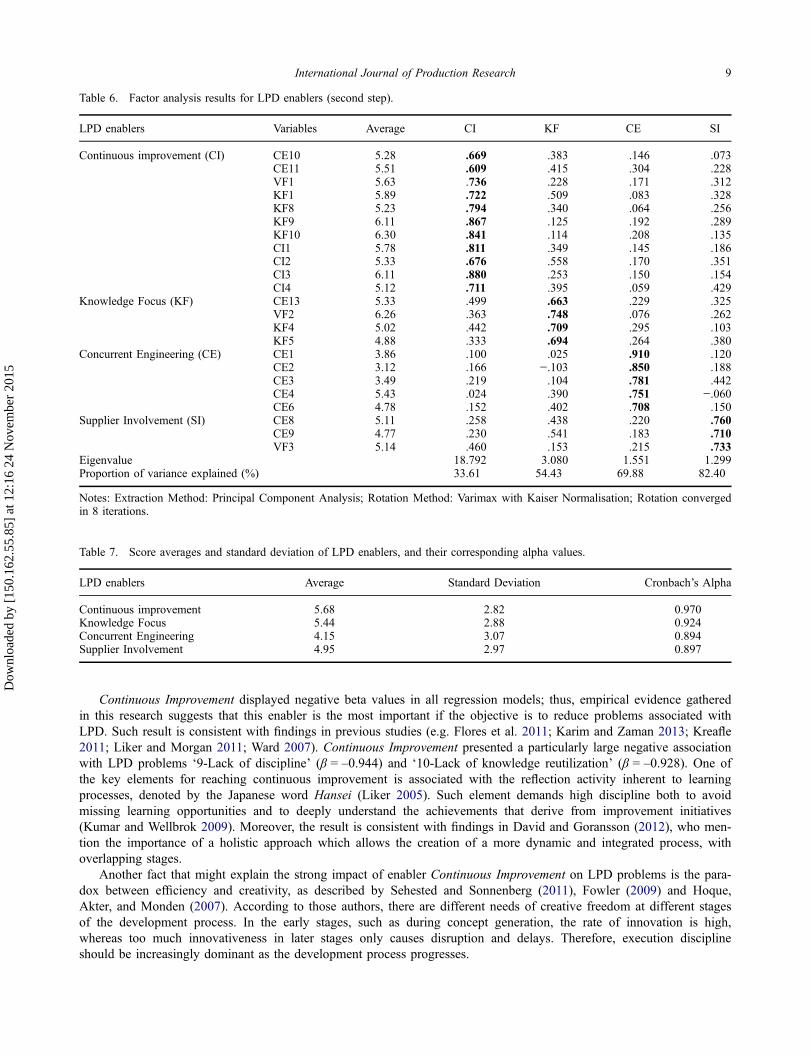
Table 6 presents the results of the second step. Factor Analysis results suggests four enablers with eigenvalues largerthan 1.0; they explain 82.4% of the total variance. Enablers were: Continuous Improvement, Knowledge Focus, Concur-rent Engineering, and Supplier Involvement. Seven variables were excluded from constructs for not meeting the criteriapreviously described.
The third step was intended to assure that variables assigned to each construct indeed represented a unidimensionalconstruct of LPD enablers or LPD problems. Factor Analysis is often used to identify constructs of questions, as we did
6 G.L. Tortorella et al.
Dow
nloa
ded
by [
150.
162.
55.8
5] a
t 12:
16 2
4 N
ovem
ber
2015
in the second step, but it may also be used to check the validity of predefined constructs (e.g. Dwivedi, Choudrie, andBrinkman 2006). Thus, we followed the procedure in Gopal et al. (2003) by conducting Factor Analyses on each LPDenabler and LPD problem individually, for discriminant validity. We validated constructs in which all variables loadedin one single component, as suggested by Dunn, Seaker and Waller (1994).
Criteria thresholds in our analyses were the same described in the second step. Applying the criteria led to the verifi-cation that all LPD enablers and problems successfully achieved validity. LPD enablers explained a portion of the totalvariance that varied from 70.68 to 83.31%, while LPD problems displayed values ranging from 55.24 to 77.51%
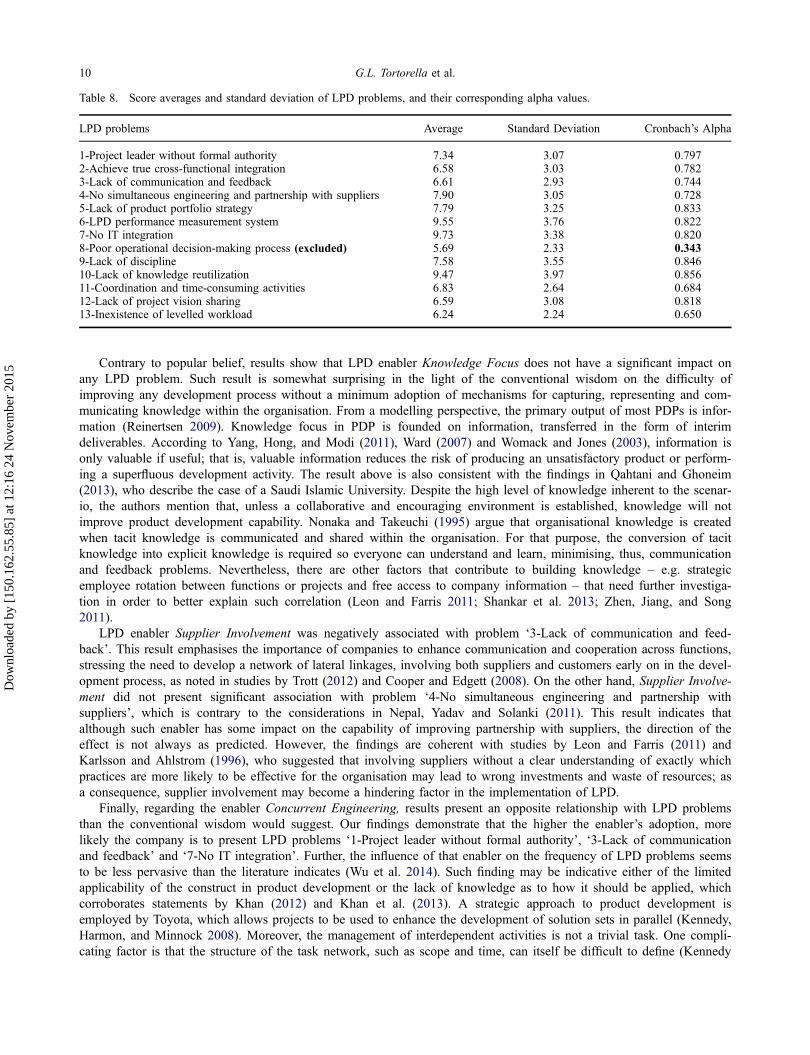
Finally, we tested all constructs (LPD enablers and problems) for reliability determining their Cronbach’s alpha val-ues. An alpha threshold of 0.6 or higher was used since it is commonly adopted in the case of newly developed con-structs (Meyers, Gamst, and Guarino 2006). LPD enablers displayed high reliability, with alpha values ranging from0.894 to 0.970. Table 7 presents score averages and standard deviations for all LPD enablers, along with their alpha val-ues. LPD problems displayed an average alpha value of 0.748, with one construct (‘8-Poor operational decision-makingprocess’) not satisfying the reliability threshold, and being disregarded in the analyses to follow. Table 8 presents scoreaverages and standard deviations for all LPD problems, along with their alpha values.
3.3 Regression models
Ordinary least squares (OLS) regression analysis with stepwise variable selection was used to describe how LPDenablers are associated with LPD problems. We build individual models using each LPD problem as a dependent vari-able and LPD enablers as independent variables. In our models, each construct was treated as a variable with outcomesgiven by their scores which were obtained considering answers provided by respondents on (i) questions related toenabler adoption or (ii) questions related to problem incidence, depending on the construct under consideration. A totalof 64 score outcomes were obtained for each construct; scores provided by each respondent on constructs were aligned.
OLS models were tested for normality, linearity and homoscedasticity (Hair et al. 2006). We examined the models’residuals to check for normality; linearity was tested with partial regression plots for each LPD enabler; homoscedastic-ity was visually evaluated plotting standardised residuals against predicted values. Models satisfied all assumptions.
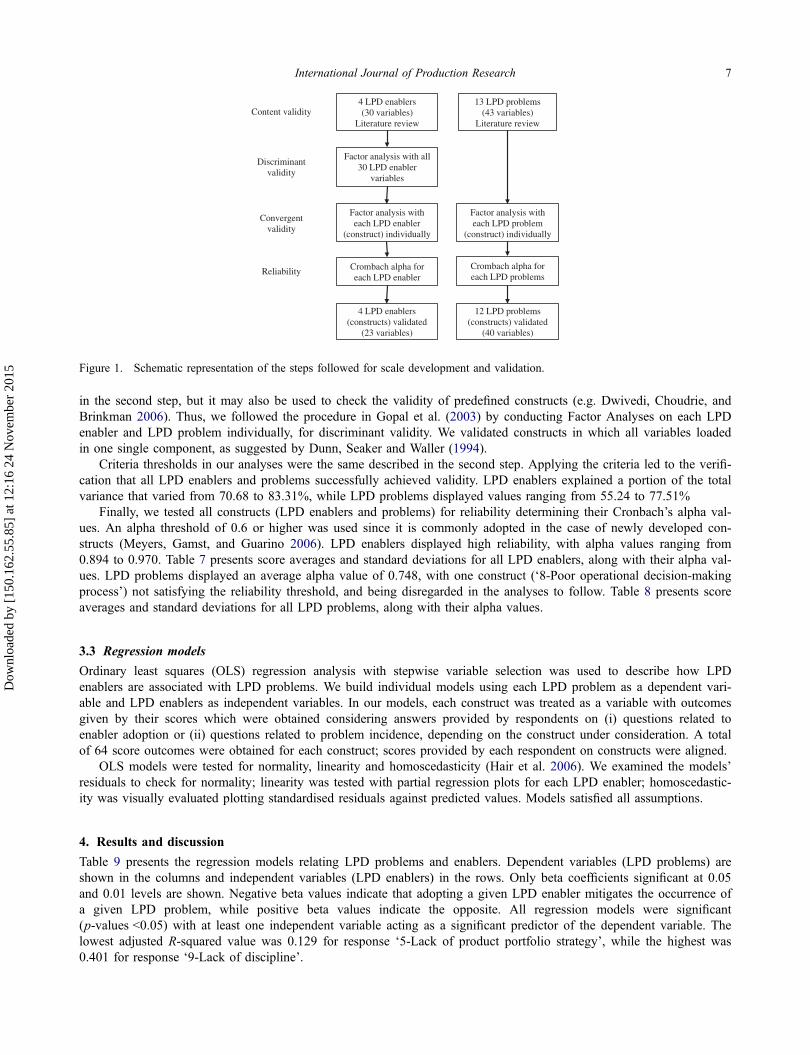
4. Results and discussion
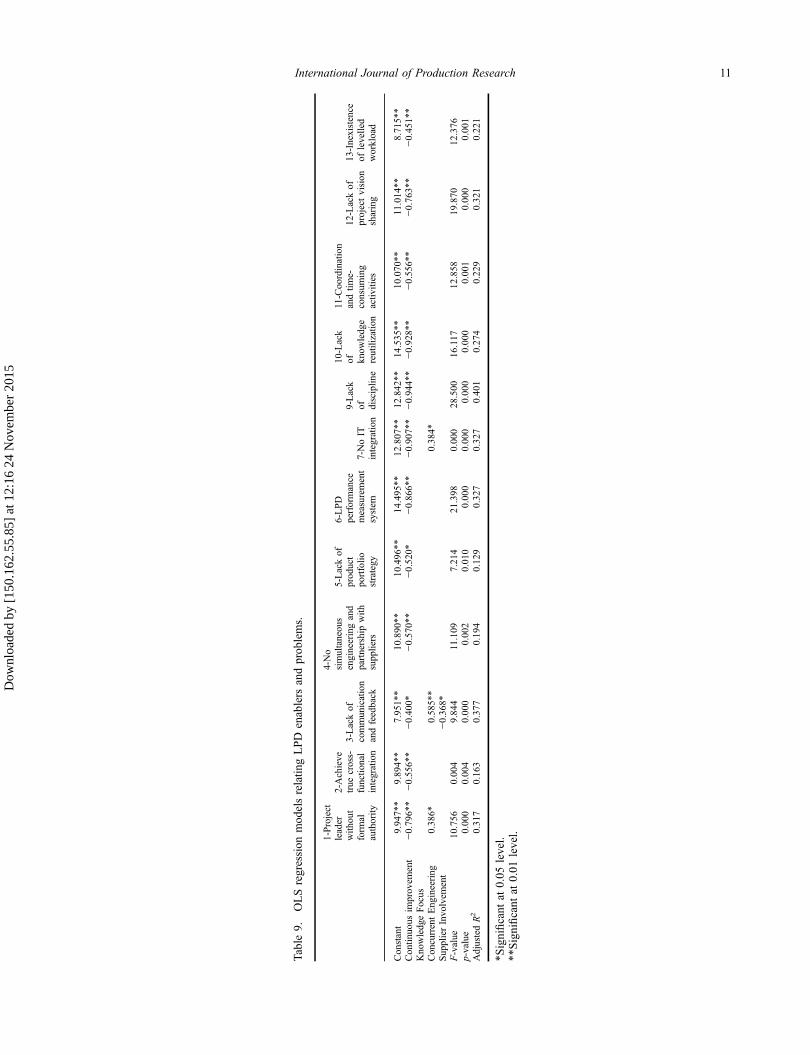
Table 9 presents the regression models relating LPD problems and enablers. Dependent variables (LPD problems) areshown in the columns and independent variables (LPD enablers) in the rows. Only beta coefficients significant at 0.05and 0.01 levels are shown. Negative beta values indicate that adopting a given LPD enabler mitigates the occurrence ofa given LPD problem, while positive beta values indicate the opposite. All regression models were significant(p-values <0.05) with at least one independent variable acting as a significant predictor of the dependent variable. Thelowest adjusted R-squared value was 0.129 for response ‘5-Lack of product portfolio strategy’, while the highest was0.401 for response ‘9-Lack of discipline’.
4 LPD enablers(30 variables)
Literature review
13 LPD problems (43 variables)
Literature review Content validity
Factor analysis with all 30 LPD enabler
variables
Factor analysis witheach LPD enabler
(construct) individually
Discriminantvalidity
Convergentvalidity
Factor analysis witheach LPD problem
(construct) individually
Reliability Crombach alpha for each LPD enabler
Crombach alpha for each LPD problems
4 LPD enablers(constructs) validated
(23 variables)
12 LPD problems (constructs) validated
(40 variables)
Figure 1. Schematic representation of the steps followed for scale development and validation.
International Journal of Production Research 7
Dow
nloa
ded
by [
150.
162.
55.8
5] a
t 12:
16 2
4 N
ovem
ber
2015
Table
5.Bivariate
correlations
betweenvariablesmeasuring
LPD
enablers.
CE1
CE2
CE3
CE4
CE5
CE6
CE7
CE8
CE9
CE10
CE11
CE12
CE13
VF1
VF2
VF3
KF1
KF2
KF3
KF4
KF5
KF6
KF7
KF8
KF9
KF10
CI1
CI2
CI3
CE1
–
CE2
.757
**–
CE3
.753
**.800
**–
CE4
.640
**.534
**.516
**–
CE5
.562
**.431
**.555
**.565
**–
CE6
.628
**.525
**.595
**.559
**.696
**–
CE7
.546
**.459
**.635
**.426
**.587
**.648
**–
CE8
.331
*.332
*.581
**.392
**.445
**.469
**.685
**–
CE9
.295
.265
.483
**.370
*.444
**.432
**.639
**.919
**–
CE10
.259
.337
*.353
*.265
.598
**.372
*.396
**.490
**.502
**–
CE11
.357
*.420
**.580
**.438
**.608
**.496
**.534
**.582
**.529
**.709
**–
CE12
.302
*.208
.473
**.365
*.727
**.472
**.601
**.638
**.638
**.744
**.780
**–
CE13
.359
*.211
.476
**.455
**.667
**.553
**.660
**.652
**.672
**.601
**.718
**.891
**–
VF1
.239
.184
.416
**.269
.694
**.401
**.624
**.581
**.511**
.556
**.692
**.706
**.694
**–
VF2
.178
.143
.370
*.384
*.491
**.425
**.414
**.626
**.588
**.549
**.660
**.748
**.796
**.506
**–
VF3
.342
*.364
*.560
**.267
.389
**.399
**.785
**.690
**.630
**.399
**.634
**.641
**.698
**.612
**.591
**–
KF1
.164
.158
.367
*.323
*.681
**.435
**.651
**.630
**.623
**.657
**.784
**.885
**.852
**.748
**.739
**.745
**–
KF2
.150
.155
.325
*.249
.700
**.437
**.564
**.636
**.644
**.670
**.686
**.888
**.768
**.718
**.735
**.625
**.870
**–
KF3
.206
.182
.398
*.374
*.591
**.461
**.500
**.573
**.547
**.607
**.706
**.884
**.869
**.676
**.793
**.598
**.829
**.843
**–
KF4
.416
**.239
.392
*.433
**.676
**.509
**.512
**.570
**.565
**.591
**.704
**.781
**.740
**.554
**.673
**.444
**.716
**.781
**.756
**–
KF5
.325
*.326
*.536
**.397
*.628
**.605
**.572
**.759
**.686
**.527
**.555
**.753
**.796
**.577
**.762
**.558
**.701
**.756
**.791
**.722
**–
KF6
.307
.359
*.454
**.423
**.786
**.550
**.620
**.520
**.527
**.635
**.731
**.846
**.790
**.679
**.616
**.557
**.826
**.813
**.769
**.737
**.729
**–
KF7
.198
.226
.414
**.203
.627
**.572
**.648
**.728
**.732
**.689
**.709
**.841
**.784
**.675
**.695
**.620
**.827
**.905
**.779
**.740
**.801
**.779**
–
KF8
.216
.188
.403
**.233
.680
**.290
.508
**.546
**.517
**.615
**.707
**.833
**.786
**.821
**.645
**.701
**.850
**.828
**.782
**.615
**.617
**.802
**.704
**–
KF9
.361
*.307
.448
**.206
.699
**.410
**.591
**.583
**.515
**.650
**.637
**.749
**.650
**.782
**.484
**.639
**.785
**.755
**.634
**.572
**.595
**.720**
.719
**.827
**–
KF10
.304
.309
.323
*.320
*.667
**.416
**.528
**.460
**.410
**.570
**.591
**.637
**.605
**.681
**.437
**.578
**.711**
.714
**.595
**.497
**.535
**.756**
.636
**.721
**.854
**–
CI1
.316
*.253
.360
*.359
*.693
**.397
**.588
**.580
**.528
**.714
**.693
**.800
**.712
**.718
**.609
**.590
**.856
**.823
**.757
**.735
**.581
**.695**
.731
**.731
**.808
**.762
**–
CI2
.275
.332
*.491
**.356
*.681
**.501
**.635
**.729
**.679
**.705
**.764
**.828
**.831
**.741
**.757
**.663
**.860
**.910
**.823
**.807
**.847
**.822
**.900
**.782
**.760
**.705
**.833
**–
CI3
.218
.318
*.382
*.286
.682
**.408
**.553
**.525
**.444
**.743
**.725
**.753
**.659
**.720
**.631
**.593
**.832
**.792
**.697
**.607
**.604
**.737**
.733
**.750
**.834
**.809
**.884
**.853
**–
CI4
.223
.230
.392
*.155
.579
**.445
**.662
**.702
**.694
**.699
**.699
**.812
**.730
**.695
**.582
**.642
**.835
**.857
**.751
**.733
**.644
**.683
**.892
**.690
**.783
**.681
**.869
**.862
**.811**
*Significant
at0.05
level.
**Significant
at0.01
level.
8 G.L. Tortorella et al.
Dow
nloa
ded
by [
150.
162.
55.8
5] a
t 12:
16 2
4 N
ovem
ber
2015
Continuous Improvement displayed negative beta values in all regression models; thus, empirical evidence gatheredin this research suggests that this enabler is the most important if the objective is to reduce problems associated withLPD. Such result is consistent with findings in previous studies (e.g. Flores et al. 2011; Karim and Zaman 2013; Kreafle2011; Liker and Morgan 2011; Ward 2007). Continuous Improvement presented a particularly large negative associationwith LPD problems ‘9-Lack of discipline’ (β = –0.944) and ‘10-Lack of knowledge reutilization’ (β = –0.928). One ofthe key elements for reaching continuous improvement is associated with the reflection activity inherent to learningprocesses, denoted by the Japanese word Hansei (Liker 2005). Such element demands high discipline both to avoidmissing learning opportunities and to deeply understand the achievements that derive from improvement initiatives(Kumar and Wellbrok 2009). Moreover, the result is consistent with findings in David and Goransson (2012), who men-tion the importance of a holistic approach which allows the creation of a more dynamic and integrated process, withoverlapping stages.
Another fact that might explain the strong impact of enabler Continuous Improvement on LPD problems is the para-dox between efficiency and creativity, as described by Sehested and Sonnenberg (2011), Fowler (2009) and Hoque,Akter, and Monden (2007). According to those authors, there are different needs of creative freedom at different stagesof the development process. In the early stages, such as during concept generation, the rate of innovation is high,whereas too much innovativeness in later stages only causes disruption and delays. Therefore, execution disciplineshould be increasingly dominant as the development process progresses.
Table 6. Factor analysis results for LPD enablers (second step).
Contrary to popular belief, results show that LPD enabler Knowledge Focus does not have a significant impact onany LPD problem. Such result is somewhat surprising in the light of the conventional wisdom on the difficulty ofimproving any development process without a minimum adoption of mechanisms for capturing, representing and com-municating knowledge within the organisation. From a modelling perspective, the primary output of most PDPs is infor-mation (Reinertsen 2009). Knowledge focus in PDP is founded on information, transferred in the form of interimdeliverables. According to Yang, Hong, and Modi (2011), Ward (2007) and Womack and Jones (2003), information isonly valuable if useful; that is, valuable information reduces the risk of producing an unsatisfactory product or perform-ing a superfluous development activity. The result above is also consistent with the findings in Qahtani and Ghoneim(2013), who describe the case of a Saudi Islamic University. Despite the high level of knowledge inherent to the scenar-io, the authors mention that, unless a collaborative and encouraging environment is established, knowledge will notimprove product development capability. Nonaka and Takeuchi (1995) argue that organisational knowledge is createdwhen tacit knowledge is communicated and shared within the organisation. For that purpose, the conversion of tacitknowledge into explicit knowledge is required so everyone can understand and learn, minimising, thus, communicationand feedback problems. Nevertheless, there are other factors that contribute to building knowledge – e.g. strategicemployee rotation between functions or projects and free access to company information – that need further investiga-tion in order to better explain such correlation (Leon and Farris 2011; Shankar et al. 2013; Zhen, Jiang, and Song2011).
LPD enabler Supplier Involvement was negatively associated with problem ‘3-Lack of communication and feed-back’. This result emphasises the importance of companies to enhance communication and cooperation across functions,stressing the need to develop a network of lateral linkages, involving both suppliers and customers early on in the devel-opment process, as noted in studies by Trott (2012) and Cooper and Edgett (2008). On the other hand, Supplier Involve-ment did not present significant association with problem ‘4-No simultaneous engineering and partnership withsuppliers’, which is contrary to the considerations in Nepal, Yadav and Solanki (2011). This result indicates thatalthough such enabler has some impact on the capability of improving partnership with suppliers, the direction of theeffect is not always as predicted. However, the findings are coherent with studies by Leon and Farris (2011) andKarlsson and Ahlstrom (1996), who suggested that involving suppliers without a clear understanding of exactly whichpractices are more likely to be effective for the organisation may lead to wrong investments and waste of resources; asa consequence, supplier involvement may become a hindering factor in the implementation of LPD.
Finally, regarding the enabler Concurrent Engineering, results present an opposite relationship with LPD problemsthan the conventional wisdom would suggest. Our findings demonstrate that the higher the enabler’s adoption, morelikely the company is to present LPD problems ‘1-Project leader without formal authority’, ‘3-Lack of communicationand feedback’ and ‘7-No IT integration’. Further, the influence of that enabler on the frequency of LPD problems seemsto be less pervasive than the literature indicates (Wu et al. 2014). Such finding may be indicative either of the limitedapplicability of the construct in product development or the lack of knowledge as to how it should be applied, whichcorroborates statements by Khan (2012) and Khan et al. (2013). A strategic approach to product development isemployed by Toyota, which allows projects to be used to enhance the development of solution sets in parallel (Kennedy,Harmon, and Minnock 2008). Moreover, the management of interdependent activities is not a trivial task. One compli-cating factor is that the structure of the task network, such as scope and time, can itself be difficult to define (Kennedy
Table 8. Score averages and standard deviation of LPD problems, and their corresponding alpha values.
LPD problems Average Standard Deviation Cronbach’s Alpha
1-Project leader without formal authority 7.34 3.07 0.7972-Achieve true cross-functional integration 6.58 3.03 0.7823-Lack of communication and feedback 6.61 2.93 0.7444-No simultaneous engineering and partnership with suppliers 7.90 3.05 0.7285-Lack of product portfolio strategy 7.79 3.25 0.8336-LPD performance measurement system 9.55 3.76 0.8227-No IT integration 9.73 3.38 0.8208-Poor operational decision-making process (excluded) 5.69 2.33 0.3439-Lack of discipline 7.58 3.55 0.84610-Lack of knowledge reutilization 9.47 3.97 0.85611-Coordination and time-consuming activities 6.83 2.64 0.68412-Lack of project vision sharing 6.59 3.08 0.81813-Inexistence of levelled workload 6.24 2.24 0.650
10 G.L. Tortorella et al.
Dow
nloa
ded
by [
150.
162.
55.8
5] a
t 12:
16 2
4 N
ovem
ber
2015
Table
9.OLSregression
mod
elsrelatin
gLPD
enablers
andprob
lems.
1-Project
leader
with
out
form
alauthority
2-Achieve
true
cross-
functio
nal
integration
3-Lackof
communication
andfeedback
4-No
simultaneous
engineeringand
partnershipwith
suppliers
5-Lackof
product
portfolio
strategy
6-LPD
performance
measurement
system
7-NoIT
integration
9-Lack
of disciplin
e
10-Lack
of know
ledge
reutilizatio
n
11-Coordination
andtim
e-consum
ing
activ
ities
12-Lackof
projectvision
sharing
13-Inexistence
oflevelled
workload
Constant
9.947**
9.894**
7.951**
10.890**
10.496**
14.495**
12.807**
12.842**
14.535**
10.070**
11.014**
8.715**
Contin
uous
improvem
ent
−0.796**
−0.556**
−0.400*
−0.570**
−0.520*
−0.866**
−0.907**
−0.944**
−0.928**
−0.556**
−0.763**
−0.451**
KnowledgeFocus
ConcurrentEngineering
0.386*
0.585**
0.384*
SupplierInvolvem
ent
−0.368*
F-value
10.756
0.004
9.844
11.109
7.214
21.398
0.000
28.500
16.117
12.858
19.870
12.376
p-value
0.000
0.004
0.000
0.002
0.010
0.000
0.000
0.000
0.000
0.001
0.000
0.001
AdjustedR2
0.317
0.163
0.377
0.194
0.129
0.327
0.327
0.401
0.274
0.229
0.321
0.221
*Significant
at0.05
level.
**Significant
at0.01
level.
International Journal of Production Research 11
Dow
nloa
ded
by [
150.
162.
55.8
5] a
t 12:
16 2
4 N
ovem
ber
2015
2013). Thereby, the differentiation between set-based concurrent engineering and conventional development process is apotentially misunderstanding issue among companies, as argued by Browning (2003), who claims that the structure ofthe activity network determines the value trajectory of the LPD process, and, thus, its efficiency and effectiveness.
5. Conclusion
5.1 Contribution to theory
This research presents some important theoretical contributions to the state of the art on LPD. We propose a newapproach to identify enablers that may contribute to the improvement of the PDP. The specialised literature on productdevelopment frequently identifies enablers through the analysis of organisations that successfully manage their productdevelopment projects; e.g. Garver (2003), Song and Noh (2006), Barczak, Griffin, and Kahn (2009), Barczak and Kahn(2012), Khan (2012) and Markham and Lee (2013). Being organisation specific, such analyses may lack reproducibility;i.e. practitioners may not always verify the positive effects reported in the literature in their companies since they do notshare the same characteristics of the organisations in which the benefits of adopting the enablers were originallyobserved (Bessant and Francis 1997; Markham and Griffin 1998; Ozer and Chen 2006).
Our approach identifies lean enablers that may improve the PDP focusing on specific characteristics of the organisa-tion in which they will be implemented. That is accomplished through the identification of LPD problems that may betackled using a particular set of enablers. Using our proposition, researchers may choose the construct of enablers withthe highest likelihood of mitigating problems that appear frequently in the PDP of the company under analysis. A set of23 different enablers that represent the operational space surrounding LPD was identified and grouped into 4 main con-structs, contributing to establish an operational complement to the conceptual definition of LPD.
We also provide a deeper understanding on how LPD enablers can mitigate the presence of LPD problems, allowingcompanies undergoing lean implementation to better manage their PDP. We argue that, viewed individually, enablersmay not benefit operations involved in an LPD process, but together, grouped as constructs, they are likely to mitigatecertain problems. That is the case of constructs Continuous Improvement and Supplier Involvement, which jointly enablecompanies to address product development problems. Moreover, some results demonstrate that the association betweenenablers and problems may not be as suggested in the existing literature. For instance, in opposition to evidences avail-able in the literature, there is a positive relationship between construct Concurrent Engineering and the occurrence ofLPD problems. Such finding may suggest that Southern Brazilian companies may not be properly implementing theconstruct, thus facing more problems in communication, IT integration and project leadership along the PDP.
5.2 Contribution to practice
We presented empirical evidences on how LPD enablers and problems are associated. For instance, enabler constructContinuous Improvement was negatively associated with the occurrence of all LPD problems in companies undergoinglean implementation. Supplier Involvement was negatively associated with only one LPD problem. Enabler constructKnowledge Focus does not seem to affect LPD problems in those companies, and the efforts to implement ConcurrentEngineering are in fact increasing three LPD problems (‘1-Project leader without formal authority’, ‘3-Lack of commu-nication and feedback’ and ‘7-No IT integration’). Overall, evidences presented here suggest that the studied LPDenablers, viewed in the literature as fundamental for successful lean implementation, significantly affect the likelihoodof LPD problems’ occurrence. For example, if a company is facing ‘3-Lack of communication and feedback’, it is rec-ommended the adoption of enablers Continuous Improvement and Supplier Involvement to mitigate that problem.
5.3 Limitations and future research
There are some limitations due to the nature of the sample used in the survey that must be highlighted. First, respon-dents were mostly from companies located in the south of Brazil; their answers might thus be linked to regional issues.That may be relevant since recent data from 24 countries suggested that lean implementation is highly dependent oncultural aspects (Kull et al. 2014). Thus, as this limitation restricts the results to this geographic condition, it alsoincreases the certainty that they apply to those companies, and to others in regions with similar characteristics.
Regarding the proposed objective, this investigation empirically validated the association between LPD enablers andproblems. Due to poor evidence in the literature on the likelihood of any interdependent influence, further investigationwould add more information and help to establish a holistic perspective about the problem, identifying interactionsbetween LPD enablers and their influence on LPD problems. Such extension would require a more elaborate datacollection and analysis.
12 G.L. Tortorella et al.
Dow
nloa
ded
by [
150.
162.
55.8
5] a
t 12:
16 2
4 N
ovem
ber
2015
Disclosure statement
No potential conflict of interest was reported by the authors.
References
Armstrong, J. S., and S. T. Overton. 1977. “Estimating Nonresponse Bias in Mail Surveys.” Journal of Marketing Research 14 (3):396–402. doi:10.2307/3150783.
Baines, T., Lightfoot, G., Williams, G., Greenough, R., 2006. “State-of-the-art in Lean Design Engineering: A Literature Review onWhite Collar Lean.” Proceedings of the Institution of Mechanical Engineers, Cranfield, UK.
Ballé, F., and M. Ballé. 2005. “Lean Development.” Business Strategy Review Autumn 16 (3): 17–22.Barczak, G., and K. Kahn. 2012. “Identifying New Product Development Best Practice.” Business Horizons 55 (3): 293–305.Barczak, G., A. Griffin, and K. Kahn. 2009. “PERSPECTIVE: Trends and Drivers of Success in NPD Practices: Results of the 2003
PDMA Best Practices Study.” Journal of Product Innovation Management 26 (1): 3–23.Bauch, C. 2004. “Lean Product Development: Making Waste Transparent.” Diploma Thesis, Technical University of Munich.Bessant, J., and D. Francis. 1997. “Implementing the New Product Development Process.” Technovation 17 (4): 189–222.Boyle, T. A., M. Scherrer-Rathje, and I. Stuart. 2011. “Learning to Be Lean: The Influence of External Information Sources in Lean
Improvements.” Journal of Manufacturing Technology Management 22 (5): 587–603. doi:10.1108/17410381111134455.Browning, T. 2003. “On Customer Value and Improvement in Product Development Processes.” Systems Engineering 6 (1): 49–61.
doi:10.1002/sys.10034.Browning, T., and F. Worth. 2000. “Value-based Product Development: Refocusing Lean.” Engineering Management Journal 168–
172.Clark, K., and S. Wheelwright. 2010. Managing New Product and Process Development: Text Cases. New York: Harvard Business
School.Cooper, R., and S. Edgett. 2008. “Maximizing Productivity in Product Innovation.” Research Technology Management 51 (2): 47–58.Cusumano, M., and K. Nobeoka. 1998. Thinking beyond Lean: How Multi-project Management is Transforming Product Develop-
ment at Toyota and Other Companies. New York: Free Press.Dal Forno, A., F., Forcellini, and A. Bornia. 2013. “Desenvolvimento lean de produtos: uma análise da literatura.” [Lean Product
Development: A Literature Analysis.] Proceedings of Workshop em Sistemas e Processos Industriais, Santa Cruz do Sul,Brazil.
David, A., and M. Goransson. 2012. Lean Product Development: The Bank of Tomorrow? Lund: Master of Science Degree Project inBusiness and Economics at Lund University, Lund, Sweden.
Dekkers, R., C. Chang, and J. Kreutzfeldt. 2013. “The Interface between ‘Product Design and Engineering’ and Manufacturing: AReview of the Literature and Empirical Evidence.” International Journal of Production Economics 144: 316–333. doi:10.1016/j.ijpe.2013.02.020.
Dunn, S. C., R. F. Seaker, and M. A. Waller. 1994. “Latent Variables in Business Logistics Research: Scale Development andValidation.” Journal of Business Logistics 15 (2): 145–172.
Dwivedi, Y., J. Choudrie, and W. Brinkman. 2006. “Development of a Survey Instrument to Examine Consumer Adoption of Broad-band.” Industrial Management & Data Systems 106 (5): 700–718. doi:10.1108/02635570610666458.
Eppinger, S. 2002. “Patterns of Product Development Interactions.” Proceedings of the International Conference on EngineeringDesign, Cambridge, USA, 283–290.
Eroglu, C., and C. Hofer. 2011. “Lean, Leaner, Too Lean? The Inventory-performance Link Revisited.” Journal of OperationsManagement 29 (4): 356–369. doi:10.1016/j.jom.2010.05.002.
Fiore, C. 2005. Accelerated Product Development: Combining Lean and Six Sigma for Peak Performance. New York: ProductivityPress.
Flores, M., A. Cabello, L. Torredemer, M. Agrawal, J. Keast, S. Terzi, and A. Sopelana. 2011. “Do Enterprises Implement a ProcessArchitecture towards Lean in a Product Development? A Comparative Study among Large and Small Firms.” In ConcurrentEnterprising (ICE), 2011 17th International Conference, Germany. 1–9. IEEE.
Fowler, N. 2009. “Lean Six Sigma and Innovation Can Synergistically Fit within Product Development.” Proceedings of Society ofPlastics Engineers’ Annual Technical Conference. Chicago, IL.
Garver, M. 2003. “Best Practices in Identifying Customer-driven Improvement Opportunities.” Industrial Marketing Management 32(6): 455–466.
Gautam, N., and N. Singh. 2008. “Lean Product Development: Maximizing the Customer Perceived Value through Design Change(Redesign).” International Journal of Production Economics 114: 313–332.
Gopal, A., K. Sivaramakrishnan, M. Krishnan, and T. Mukhopadhyay. 2003. “Contracts in Offshore Software Development: AnEmpirical Analysis.” Management Science 49 (12): 1671–1683.
Graebsch, M., 2005. “Information and Communication in Lean Product Development.” Diploma Thesis, Technical University ofMunich.
Hair, J. F., R. L. Tatham, R. E. Anderson, and W. Black. 2006. Multivariate Data Analysis. Upper Saddle River, NJ: Pearson PrenticeHall.
Haque, B., and M. Moore. 2004. “Applying Lean Thinking to New Product Introduction.” Journal of Engineering Design 15 (1):1–31.
Hines, P., M. Francis, and P. Found. 2006. “Towards Lean Product Lifecycle Management.” Journal of Manufacturing TechnologyManagement 17 (7): 866–887. doi:10.1108/17410380610688214.
Hoppmann, J., E. Rebentisch, U. Dombrowski, and T. Zahn. 2011. “A Framework for Organizing Lean Product Development.” Engi-neering Management Journal 23 (1): 3–15.
Hoque, M., M. Akter, and Y. Monden. 2007. “Concurrent Engineering: A Compromising Approach to Develop a Feasible andCustomer-pleasing Product.” International Journal of Production Research 43 (8): 1607–1624. doi:10.1080/00207540412331320490.
Jayanth, J., A. Das, and M. Nicolae. 2010. “Looking beyond the Obvious: Unravelling the Toyota Production System.” InternationalJournal of Production Economics 128 (1): 280–291. doi:10.1016/j.ijpe.2010.07.024.
Karim, A., and K. Zaman. 2013. “A Methodology for Effective Implementation of Lean Strategies and Its Performance Evaluation inManufacturing Organizations.” Business Process Management Journal 19 (1): 169–196. doi:10.1108/14637151311294912.
Karlsson, C., and P. Ahlstrom. 1996. “The Difficult Path to Lean Product Development.” Journal of Product Innovation Management13: 283–295. doi:10.1111/1540-5885.1340283.
Kato, J. 2005. Development of a Process for Continuous Creation of Lean Value in Product Development Organizations. CambridgeMIT.
Kennedy, M. 2013. Product Development for the Lean Enterprise: Why Toyota’s System is Four times More Productive and How YouCan Implement It. New York: Oaklea Press.
Kennedy, M., K. Harmon, and E. Minnock. 2008. Ready, Set, Dominate: Implement Toyota’s Set-based Learning for DevelopingProducts and Nobody Can Catch You. New York: Oaklea Press.
Khan, M. S. 2012. “The Construction of a Model for Lean Product Development.” PhD Thesis, School of Applied Sciences CranfieldUniversity.
Khan, M. S., A. Al-Ashaab, E. Shehab, B. Haque, P. Ewers, M. Sorli, and A. Sopelana. 2013. “Towards Lean Product and ProcessDevelopment.” International Journal of Computer Integrated Manufacturing 26 (12): 1105–1116. doi:10.1080/0951192X.2011.608723.
Kosonen, K., and P. Buhanist. 1995. “Customer Focused Lean Production Development.” International Journal of ProductionEconomics 41: 211–216. doi:10.1016/0925-5273(94)00048-4.
Kreafle, K. 2011. “Lean Product Development.” Interdisciplinary Information Sciences 17 (1): 11–13.Kull, T., T. Yan, Z. Liu, and J. Wacker. 2014. “The Moderation of Lean Manufacturing Effectiveness by Dimensions of National Cul-
ture: Testing Practice-culture Congruence Hypotheses.” International Journal of Production Economics 153: 1–12. doi:10.1016/j.ijpe.2014.03.015.
Kumar, S., and J. Wellbrok. 2009. “Improved New Product Development through Enhanced Design Architecture for Engineer-to-orderCompanies.” International Journal of Production Research 47 (15): 4235–4254. doi:10.1080/00207540801939030.
Kumar, R., M. Sharma, and A. Agarwal. 2015. “An Experimental Investigation of Lean Management in Aviation: Avoiding UnforcedErrors for Better Supply Chain.” Journal of Manufacturing Technology Management 26 (2): 231–260.
Lander, E., and J. Liker. 2007. “The Toyota Production System and Art: Making Highly Customized and Creative Products theToyota Way.” International Journal of Production Research 45 (16): 3681–3698. doi:10.1080/00207540701223519.
Leon, H. C. M., and J. A. Farris. 2011. “Lean Product Development Research: Current State and Future Directions.” EngineeringManagement Journal 23 (1): 29–51.
Letens, G., J. A. Farris, and E. M. Van Aken. 2011. “A Multilevel Framework for Lean Product Development System Design.”Engineering Management Journal 23 (1): 69–85.
Liker, J. 2005. The Toyota Way: 14 Management Principles from the World’s Greatest Manufacturer. New York: McGraw Hill Profes-sional.
Liker, J. K., and J. Morgan. 2011. “Lean Product Development as a System: A Case Study of Body and Stamping Development atFord.” Engineering Management Journal 23 (1): 16–28.
Machado, M., and N. Toledo. 2006. “Criação de valor no processo de desenvolvimento de produtos: uma avaliação da aplicabilidadedos princípios e práticas enxutas.” Revista Gestão Industrial 2 (3): 142–153.
Markham, S., and A. Griffin. 1998. “The Breakfast of Champions: Associations between Champions and Product Development Envi-ronments, Practices and Performance.” Journal of Product Innovation Management 15 (5): 436–454.
Markham, S., and H. Lee. 2013. “Product Development and Management Association’s 2012 Comparative Performance AssessmentStudy.” Journal of Product Innovation Management 30 (3): 408–429.
Marodin, G. A., and T. A. Saurin. 2015. “Classification and Relationships between Risks That Affect Lean Production Implementa-tion.” Journal of Manufacturing Technology Management 26 (1): 57–79. doi:10.1108/JMTM-12-2012-0113.
Matsui, Y., R. Filippini, H. Kitanaka, and O. Sato. 2007. “A Comparative Analysis of New Product Development by Italian andJapanese Manufacturing Companies: A Case Study.” International Journal of Production Economics 110: 16–24.
Meybodi, M. 2013. “The Links between Lean Manufacturing Practices and Concurrent Engineering Method of New ProductDevelopment.” Benchmarking: An International Journal 20 (3): 362–376. doi:10.1108/14635771311318135.
Meyers, L. S., G. Gamst, and A. J. Guarino. 2006. Applied Multivariate Research. Thousand Oaks, CA: Sage.Morgan, J., and J. Liker. 2008. The Toyota Product Development System. New York: Productivity Press.Nepal, B., O. Yadav, and R. Solanki. 2011. “Improving the NPD Process by Applying Lean Principles: A Case Study.” Engineering
Management Journal 23 (1): 52–68.Nonaka, I., and H. Takeuchi. 1995. The Knowledge-creating Company: How Japanese Companies Create the Dynamics of Innova-
tion. Oxford: Oxford University Press.Oehmen, J., and E. Rebentich. 2010. Waste in Lean Product Development. Cambridge: Massachusetts Institute of Technology’s Lean
Advancement Initiative.Oliver, N., I. Dostaler, and E. Dewberry. 2004. “New Product Development Benchmarks: The Japanese, North American, and UK
Consumer Electronics Industries.” The Journal of High Technology Management Research 15: 249–265. doi:10.1016/j.hitech.2004.03.006.
Oppenheim, B. 2004. “Lean Product Development Flow.” Systems Engineering 7 (4): 352–376. doi:10.1002/sys.20014.Oppenheim, B. 2011. Lean for Systems Engineering with Lean Enablers for Systems Engineering. New Jersey: Wiley.Ozer, M., and Z. Chen. 2006. “Do the Best New Product Development Practices of US Companies Matter in Hong Kong?” Industrial
Marketing Management 35 (3): 279–292.Panchak, P. 2009. Teledyne Benthos Adapts the Toyota Product Development System. New York: Association of Manufacturing
Excellence.Panizzolo, R., P. Garengo, M. Sharma, and A. Gore. 2012. “Lean Manufacturing in Developing Countries: Evidence from Indian
SMEs.” Production Planning & Control 23 (10–11): 769–788.Pardal, L., L. Perondi, and S. Valeri, 2011. “A filosofia enxuta no desenvolvimento de produto e suas origens.” [Lean Philosophy in
Product Development and Its Origins.] Proceedings of 2º Workshop em Engenharia e Tecnologia, Espaciais.Paula, I., F. S. Fogliatto, and C. Cristofari. 2012. “Method for Assessing the Maturity of Product Development Management: A
Proposal.” African Journal of Business Management 5 (38): 10285–10302.Pessoa, M. 2008. Weaving the Waste Net: A Model to the Product Development System Low Performance Drivers and Its Causes.
Cambridge: LAI White Paper.Podsakoff, P. M., S. B. MacKenzie, J. Y. Lee, and N. P. Podsakoff. 2003. “Common Method Biases in Behavioral Research: A Criti-
cal Review of the Literature and Recommended Remedies.” Journal of Applied Psychology 88 (5): 879–903. doi:10.1037/0021-9010.88.5.879.
Qahtani, F., and S. Ghoneim. 2013. “Organizational Learning: As an Approach for Transforming to Learning Organization Conceptin Saudi Universities.” Mediterranean Journal of Social Science 4 (2): 513–524.
Rauniar, R., and G. Rawski. 2012. “Organizational Structuring and Project Team Structuring in Integrated Product DevelopmentProject.” International Journal of Production Economics 135: 939–952. doi:10.1016/j.ijpe.2011.11.009.
Reinertsen, D. 2009. The Principles of Product Development Flow: Second Generation Lean Product Development. New York:Celeritas.
Reis, Z., C. Costa, G. Milan, and L. Eberle. 2013. “Revisão da literatura sobre a implementação da filosofia lean no PDP.” RevistaGlobal Manager 1 (1): 56–79.
Rossi, M., M. Taisch, and S. Terzi. 2012. “Lean Product Development: A Five-steps Methodology for Continuous Improvement.”Proceedings of 18th International Conference on Engineering, Technology and Innovation, Cambridge, USA.
Saurin, T. A., J. L. D. Ribeiro, and G. A. Marodin. 2010. “Identificação de oportunidades de pesquisa a partir de um levantamento daimplantação da produção enxuta em empresas do Brasil e do exterior [Research opportunities identification raised from leanimplementation in companies located in Brazil and abroad].” Gestão & Produção 17 (4): 829–841.
Schuh, G., M. Lenders, and S. Hieber. 2008. “Lean Innovation: Introducing Value Systems to Product Development.” Proceedings ofPICMET, Cape Town.
Sehested, C., and H. Sonnenberg. 2011. Lean Innovation: A Fast Path from Knowledge to Value. Heidelberg: Springer.Shah, R., and P. T. Ward. 2007. “Defining and Developing Measures of Lean Production.” Journal of Operations Management 25
(4): 785–805. doi:10.1016/j.jom.2007.01.019.Shankar, R., N. Mittal, S. Rabinowitz, A. Baveja, and S. Acharia. 2013. “A Collaborative Framework to Minimise Knowledge Loss
in New Product Development.” International Journal of Production Research 51 (7): 2049–2059. doi:10.1080/00207543.2012.701779.
Slack, R. 1999. The Lean Value Principle in Military Aerospace Product Development. Cambridge: Lean Aerospace InitiativeMassachusetts Institute of Technology.
Sobek, D., J. Liker, and A. Ward. 1998. “Another Look at How Toyota Integrates Product Development.” Harvard Business Review76 (4): 36–47.
Sobek, D., A. Ward, and J. Liker. 1999. “Toyota’s Principles of Set-based Concurrent Engineering.” Sloan Management Review 40(2): 67–83.
Song, M., and J. Noh. 2006. “Best New Product Development and Management Practices in the Korean High-tech Industry.”Industrial Marketing Management 35 (3): 262–278.
Tabachnick, B. G., and L. S. Fidell. 2001. Using Multivariate Statistics. 5th ed. New York: Pearson.Taj, S., and C. Morosan. 2011. “The Impact of Lean Operations on the Chinese Manufacturing Performance.” Journal of
Manufacturing Technology Management 22 (2): 223–240. doi:10.1108/17410381111102234.Tortorella, G. L., G. A. Marodin, R. Miorando, and A. Seidel. 2015. “The Impact of Contextual Variables on Learning Organization
in Firms That Are Implementing Lean: A Study in Southern Brazil.” The International Journal of Advanced ManufacturingTechnology 78 (9–12): 1879–1892. doi:10.1007/s00170-015-6791-1.
Trott, P. 2012. Innovation Management and New Product Development. 5th ed. Edinburgh: Pearson Education.Tsinopoulos, C., and I. MacCarthy. 2002. “New Product Development as a Complex System of Decision.” Proceedings of the IEEE
International Engineering Management Conference, Detroit, USA.Venkatamuni, T., and A. Rao. 2010. “Reduction of Product Development Time by Team Formation Method in Lean Manufacturing.”
Indian Journal of Science and Technology 3 (5): 578–582. doi:10.17485/ijst/2010/v3i5/29758.Wang, L., X. Ming, F. Kong, D. Li, and P. Wang. 2012. “Focus on Implementation: A Framework for Lean Product Development.”
Journal of Manufacturing Technology Management 23 (1): 4–24. doi:10.1108/17410381211196267.Ward, A. 2007. Lean Product and Process Development. New York: Lean Institute.Ward, A., J. Liker, J. Cristiano, and D. Sobek. 1995. “The Second Toyota Paradox: How Delaying Decisions Can Make Better Cars
Faster.” MIT Sloan Management Review 15: 45–61.Womack, J., and D. Jones. 2003. Lean Thinking: Banish Waste and Create Wealth for Your Corporation. New York: Simon and
Schuster.Womack, J., D. Jones, and D. Roos. 1991. The Machine That Changed the World: The Story of Lean Production. New York: Harper
Perennial.Wu, Z., Ming, X., He, L., Li, M., Li, X., 2014. Knowledge Integration and Sharing for Complex Product Development. International
Journal of Production Research 52: 1–18. doi:10.1080/00207543.2014.923121.Yang, M., P. Hong, and S. Modi. 2011. “Impact of Lean Manufacturing and Environmental Management on Business Performance:
An Empirical Study of Manufacturing Firms.” International Journal of Production Economics 129: 251–261. doi:10.1016/j.ijpe.2010.10.017.
Zhen, L., Z. Jiang, and H. Song. 2011. “Distributed Knowledge Sharing for Collaborative Product Development.” InternationalJournal of Production Research 49 (10): 2959–2976. doi:10.1080/00207541003705864.
- Small 4.8- Medium 19.0- Large 76.2Sector- Automotive 69.8- Tobacco 7.8- Plastic 6.3- Footwear 3.1- Food 3.1- Chemical 3.1- Telecom 3.1- Others 4.7Years of experience with LPD- 0–5 22.6- 6–10 37.1- 11–15 17.7- 16–20 21.0- More than 20 1.6Job title- Manufacturing Engineer / Continuous Improvement 30.0- Product Development Manager 23.3- Supply Chain Analyst 23.3- Product Development Supervisor 13.3- Operations/Plant Manager 3.3- Materials Analyst 3.3- Quality Manager 3.3
International Journal of Production Research 17
Dow
nloa
ded
by [
150.
162.
55.8
5] a
t 12:
16 2
4 N
ovem
ber
2015
Appendix 2. LPD enablers and measures (Adapted from Khan et al. 2013)
Set-based concurrent engineeringCE1 – Multiple alternatives (designed)CE2 – Delaying specificationCE3 – Minimal constraintCE4 – Extensive simulation/prototyping (possibly including full-scale models)CE5 – Early problem solvingCE6 – Test-then-designCE7 – Convergence on optimum solutionCE8 – Supplier strategy (supplier types and interlocking)CE9 – Supplier set-based concurrent engineeringCE10 – Mistake proofingCE11 – Design in qualityCE12 – Robust design methodsCE13 – Integration/target eventsValue focus (planning and development)VF1 – Value stream mappingVF2 – Customer focus (customer needs/wants)VF3 – Multi-project plan and strategyKnowledge focus (knowledge-based environment)KF1 – Cross-functional module development teams & manufacturing involvementKF2 – Knowledge/information flow/cadence/pull (in right place at right time)KF3 – Knowledge reuseKF4 – Expert workforce developmentKF5 – Mentoring by senior employeesKF6 – Test-to-failureKF7 – Rapid learning /comprehensionKF8 – A3 group problem solvingKF9 – Learning cycles (Plan-Do-Check-Act)KF10 – Root-cause analysis and 5 whysContinuous improvement (Kaizen) cultureCI1 – Employee empowerment/individual responsibilityCI2 – Lessons learnt reflection processCI3 – Standardization of processes, skills and design methodsCI4 – Separating research from development
18 G.L. Tortorella et al.
Dow
nloa
ded
by [
150.
162.
55.8
5] a
t 12:
16 2
4 N
ovem
ber
2015
Appendix 3. LPD problems and measures (Adapted from Paula, Fogliatto, and Cristofari 2012).
Project leader without formal authorityPA1 – Lack of teams’ managementPA2 – Project coordinator not prepared to perform expected dutiesPA3 – Lack of team empowermentAchieve true cross-functional integrationAC1 – Many hierarchical levels which delay functional teams integrationAC2 – Not effective cross-functional teamsAC3 – Teamwork not stimulatedLack of communication and feedbackLC1 – Low generation of improvement ideasLC2 – Communication and information sharing among areas is not organized and systematicLC3 – There is no clear definition of guidelines or prioritiesNo simultaneous engineering and partnership with suppliersNS1 – The project is incompatible with the production capacityNS2 – No systematic approach for interacting with customers/suppliersNS3 – Inexistence of a problem solving evaluation process for product developmentNS4 – Product development process does not start from the proper sectorLack of product portfolio strategyLP1 – No strategic definition at the beginning of product developmentLP2 – No business focusLP3 – Lack of market orientation (no trends identification)LP4 – Inexistence of product strategic planningLPD performance measurement systemMS1 – Lack of a systematic product performance evaluation through metricsMS2 – Project exclusively controlled based on timelineMS3 – Lack of performance analysis regarding milestones and final results achievementMS4 – No systematic follow up for product development process performanceNo IT integrationIT1 – Insufficient search for informationIT2 – Delays or improper information flow during projects developmentIT3 – No information system integrationIT4 – Low utilization of product development supporting toolsPoor operational decision making processDM1 – Without a consistent decision making process which delays projectsDM2 – No involvement and commitment from senior management resulting in delays on decision makingDM3 – No scope change management that assesses the impact of decisionsLack of disciplineLD1 – Lack of rigour in the pursuit of failures’ root-causesLD2 – Low compliance to activities’ deadlinesLD3 – Lack of responsibility definition for involved individualsLack of knowledge reutilizationLK1 – No formal knowledge control and management among projectsLK2 – Lack of systematic knowledge storage along product developmentLK3 – Process is highly dependent on individual capacity and knowledgeLK4 – Lack of knowledge regarding product development supporting toolsCoordination and time-consuming activitiesCA1 – Time lost due to lack of synchronization in workflowCA2 – Capital approval process is not performed in timeCA3 – No formal methodology for product developmentLack of project vision sharingVS1 – Product development teams do not know company’s strategic visionVS2 – Lack of perception that product development is a business processVS3 – Lack of company’s employees sharing information about productsInexistence of levelled workloadLW1 – Lack of proper equipmentLW2 – There is excessive centralization of development work in a sector or areaLW3 – No activity definition and detailing