E L S E V I E R Chemical Geology 114 (1994) 347-363
CHEMICAL GEOLOGY
ISOTOPE GEOS(TEV( "E
Relationships between mineral surfaces and organic carbon concentrations in soils and sediments
L a w r e n c e M. M a y e r Department of Oceanography, Darling Marine Center, University of Maine, Walpole, ME 04573, USA
(Received May 25, 1993; revision accepted October 4, 1993)
Abstract
Relationships between mineral specific surface area and organic carbon (OC) concentration are examined for sediments and soil A-horizons from throughout the world. I found (published elsewhere) that continental shelf sediments from many different regions exhibit downcore loss of OC to a refractory background level which shows a consistent relationship with mineral surface area (slope = 0.8 6 mg m - 20C ). This trend is equivalent to a mono- layer of organic matter over all surfaces, and is termed the monolayer-equivalent (ME) level. Sediments and soils from other environments are compared to this empirically derived relationship. Several continental slope areas show extension of this relationship to considerable depth. Marked excesses of OC above this trend, which persist downcore, were found in sediments with high carbonate mineral content or slope sediments with low dissolved oxygen concentrations in the overlying water column. About half of the soils examined also adhered to this rela- tionship, while soils with high carbonate content, low pH, or poor drainage showed OC concentrations higher than the ME level. OC concentrations below the ME level are found in deltaic regions and areas with low organic matter delivery such as the deep sea or arid soils. The nature of mineral surfaces was examined using N2 adsorption- desorption isotherms, and most surface area was found to be present as pores with < 8-nm widths. A hypothesis is developed that explains the observed OC concentrations as a saturation of adsorption sites within small pores, which are small enough to exclude hydrolytic enzymes and hence protect organic matter against biological attack. The relationship between this hypothesis and other hypothesized protection mechanisms is discussed. Adsorption is shown to provide a mechanistic and quantitative explanation for spatial and temporal relationships between sedimentation rate and OC burial.
I. Introduction
Many soils and sediments have organic carbon ( O C ) concentra t ions in the range of 1-100 mg g - ~ OC. Observed concent ra t ions are lower than would be expected solely f rom the relative deliv- ery rates of OC and minerals . Much if not mos t o f the OC del ivered to soils and sediments be- comes remineral ized, account ing for these lower concentrat ions. At a global scale OC concentra- t ions show a clear posi t ive relat ionship to or-
ganic ma t t e r supply; concentra t ions are low in deserts and the deep sea, and high in areas of in- tensive plant product ion. However , at smaller space scales concentra t ions often appea r to be influenced by factors more related to the preser- vat ion of organic ma t t e r than to its supply.
OC concentra t ions in mar ine cont inental shelf sediments frequently show a part icularly strong correlat ion of OC concentra t ion with grain size (Premuzic et al., 1982; Romankev ich , 1984), especially compa red with soils and sediments
from other depositional regimes. In another pa- per (Mayer, 1994) I have examined the nature of this grain size relationship in terms of the cor- respondence between OC concentration and mineral surface area of aluminosilicate sedi- ments. In that work I show a widespread, com- mon relationship between OC concentration and surface area that approximates a monolayer of adsorbed OC on mineral surfaces. This relation- ship provides an explanation for the downcore asymptotic OC concentration (refractory back- ground) found in many shallow-water sediments (Berner, 1982), and hence indicates a surface area control on the stabilization and burial of or- ganic matter in these sediments. A hypothesis was presented to explain this relationship, based on the microtopographic nature of mineral sur- faces. In this Symposium paper, I review these shelf data and examine the OC-surface area re- lationship and the nature of mineral surfaces from a wider range of samples including soils, carbonate sediments and deeper ocean sedi- ments. The OC and surface area relationships found for the shelf sediments are found to have somewhat wider applicability. Some geochemi- cal implications of these widespread relation- ships are explored.
2. Methods and materials
Samples were obtained from the collections of a large number of investigators (see Acknowl- edgements). Only unground samples which had been collected recently or stored frozen were ob- tained. Upon receipt of samples, they were stored frozen in my laboratory. Soil samples were ob- tained from the National Soil Survey Laboratory (Lincoln, Nebraska, U.S.A. ); these samples had been stored at room temperature, but as OC analyses from my laboratory agreed well with their values they were deemed acceptable for the purposes of this study. Prior to analysis, samples were freeze-dried.
To determine the degree of association be- tween organic matter and minerals, some sam- ples were subjected to separations on the basis of density. These separations were performed by
shaking suspensions in saturated CsCl solution (p= 1.9 g m1-1 ) followed by centrifugation, as described in Mayer et al. ( 1993 ).
Sub-samples of most samples were prepared for total OC analysis by grinding and vapor-phase acidification with fuming HCI in a desiccator, to remove carbonate minerals, with sample weights determined before acid attack. Acidified sam- ples were then analyzed on a Carlo Erba ® 1106 Elemental Analyzer (precision, as average stan- dard error on duplicates, is _+ 1%). OC analyses were corrected for seasalt contributions to sedi- ment weight. OC concentrations in carbonate sediments from St. Croix, U.S. Virgin Islands, were determined by dichromate titration (Gau- dette et al., 1974). The calcium carbonate con- tent of samples from some areas was determined by weight loss after acidification by glacial acetic acid.
For surface area analysis of aluminosilicates, samples were routinely pretreated to remove or- ganic matter using a sodium pyrophosphate-hy- drogen peroxide attack. Carbonate samples did not receive this pretreatment. Samples analyzed with and without organic matter removal gener- ally show similar surface area values (Mayer, 1994). Prior to analysis, samples were degassed either for 15 rain at a temperature of 250-350°C under a stream of nitrogen-helium or overnight at 150°C in a vacuum oven; similar results were found between these methods. Surface area anal- ysis was usually carried out by the one-point BET* method using Nz adsorption (analytical precision on duplicates= + 1%) with a Quan- tachrome ® Monosorb. This method is described in detail in Mayer (1994). Occasionally a multi- point BET analysis was performed using a Quan- tachrome ® Autosorb 1; multi-point analyses agreed well with single-point analyses.
Pore size distributions on samples were also determined on the Autosorb 1. Samples which had been pretreated to remove organic matter (except the carbonate sample) were degassed at 150°C overnight under vacuum. A full adsorp- tion/desorption isotherm was obtained and the pore size distribution calculated using the man-
*Brunauer-Emmett-Teller adsorption isotherm.
L.M. Mayer / Chemical Geology 114 (1994) 34 7-363 349
ufacturer's software package. Pore size calcula- tion for mesopores (described below) is based on the Barrett-Joyner-Halenda method (Bar- rett et al., 1951 ), in which N2 condensation is considered to occur within small pores at partial pressures of N= below saturation pressure, with the extent of condensation depending on the width of the pore. The data were corrected for multilayer adsorption onto pore walls, using the equation of deBoer et al. ( 1966 ), which was cho- sen based on examination of t-plots of the var- ious samples. The surface area associated with micropores was determined by the t-plot method (Gregg and Sing, 1982 ).
3. Results
3. I. Previous work
Mayer (1994) has presented a detailed exam- ination of OC accumulation patterns in alumi- nosilicate sediments of various continental shelf regions. A common pattern described in that work is relatively high OC concentrations at the sediment-water interface underlain by a de- crease in concentration to a refractory back- ground level, a pattern well described in the lit- erature (Berner, 1982; Henrichs and Reeburgh, 1987 ). The largest enrichments of OC at the sed- iment-water interface were typically found in areas of relatively high organic matter delivery, e.g., inshore sites and polluted areas. Deeper shelf areas typically showed small or no decreases in OC concentration with core depth. These pat- terns substantiated a trend that can be discerned from the literature (described in Mayer, 1993 ).
Determination of the OC-surface area rela- tionships of the refractory background showed a consistent relationship for aluminosilicate sedi- ments from all shelf areas except deltaic regions adjacent to rivers with very high sediment deliv- ery rates (e.g., Mississippi River, U.S.A. ). Of the 38 continental shelf cores reported in that paper, 22 exhibited OC distributions that could be mo- delled according to the equation:
O C z ~.~ O C R B + O f m e t e x p ( - f l z ) ( 1 )
where OCz and OCRB are the OC concentrations at any core depth z and in the refractory back- ground, respectively; O(~rnet is the amount of me- tabolizable OC at the sediment-water interface; and fl is the depth attenuation coefficient ( cm- l ) . A scatter plot of the OCRa-Values thus determined vs. the average surface area values of the deeper core horizons (Fig. 1 ) showed a highly significant linear relationship (p<0.01) with a slope of 0.86 mg m - 2 0 C . The samples from the sediment-water interface, on the other hand, showed much poorer correlation. In other words, regardless of the OC-surface area relationship at the sediment-water interface, the stabilized OC concentration downcore showed a relationship to surface area that was consistent among many different continental shelf areas. Of the cores that did not yield refractory background concentra- tions by this equation, most had OC concentra- tion-surface area relationships in their deeper horizons that were still consistent with those plotted in Fig. 1.
The significance of this downcore OC-surface area relationship is that it approximates the amount of OC that would be expected from a monolayer of moderate size organic molecules covering all mineral surfaces. For example, pro- teins typically show OC concentrations of 0.5-1
100- O
"7 03 • REFRACTORY BACKGROUND ~, 75
O SURFACE
Z o 50
t j O -
0 • I 10 20 30 40
SURFACE AREA (rn 2 g- 1 /
Fig. 1. Concentrations of organic carbon at the sediment- water interface and in the refractory background (calculated according to the algorithm described in the text) of various continental shelf cores in North America. Diagonal bars are the 95% confidence bars for the data (which are different than the 95% confidence limits of the regression line ), calculated using the JMP program (SAS Institute, Inc., Cary, North Carolina, U.S.A. ).
mg m - 2 O f if adsorbed to monolayer saturation at either solid-water or air-water interfaces (e.g., Arai and Norde, 1990). For this reason, Mayer (1994) applied the term "monolayer-equiva- lent" to those OC concentrations that fit within the 95% confidence bands of this set of refrac- tory background levels (Fig. 1 ). Such mono- layer-equivalent (ME) coverages have been in- ferred or determined in other studies as well (Weiler and Mills, 1965; Suess, 1973; Tanoue and Handa, 1979; Keil et al., 1994). The term monolayer-equivalent is stressed, because there is no evidence to indicate that organic matter is indeed wholly dispersed over all mineral surfaces.
The ME level appears to describe the concen- tration at which OC levels stabilize and become buried in aluminosilicate continental shelf areas other than those adjoining sediment-rich large rivers such as the Mississippi, Amazon (Brazil) and Huanghe (China). An ME range of concen- trations, derived from this set of continental shelf cores, can be defined as the 95% confidence in- tervals about the refractory background data of Fig. 1. Most samples from a much larger collec-
tion of sediment-water interface samples of shelves also plotted within this ME zone (Mayer, 1994). This present work examines the applica- bility of this ME zone to sediments and soils from other environments.
3.2. Deeper marine sediments
Sediment-water interfhce samples from ocean depths > 200 m (Fig. 2; Table 1 ) show several features. The ME zone, taken from Fig. 1, ex- tends only to a surface area of ~ 35 m 2 g- ~, which represents the range of continental shelf samples from which it was calculated. At higher surface area values, the ME zone is likely to level some- what. Keil et al. (1994) examined grain size sep- arates from Washington, U.S.A., coastal sedi- ments, and found a similar OC-surface area relationship as the ME zone of Fig. 1; above ~ 40 m 2 g- ~, however, this trend showed a shallower slope. Similar levelling or even drops in OC con- centrations have frequently been observed in clay fractions of grain size separations of soils and sediments (Tanoue and Handa, 1979; Tiessen
"7 O'1
E
Z O rv, < (..)
Z < L9 O
250
200
150
100 []
50-~ x x+x •
1 ~ , , . •6 A •
0 20 40 60 80
SURFACE AREA (m 2 g-1 )
PERU SLOPE
[] W. MEX ICO SLOPE
X BLACK SEA
"}- SANTA CATALINA BASIN
• CALIFORNIA SLOPE/RISE
• NW ATLANTIC SLOPE
O W. MEDITERRANEAN
I~ NE ATLANTIC
• SKAGERRAK 695m
• WASHINGTON SLOPE
• NIGERIAN SLOPE
O E PACIFIC
CI NE PACIFIC
Fig. 2. Organic carbon concentration vs. surface area for samples from the sediment-water interface of deeper marine sediments (slopes, rises and deep sea). Diagonal lines enclose the monolayer-equivalent zone from Fig. 1.
L.M. Mayer / Chemical Geology 114 (1994) 347-363 351
Table 1 Locations, depth of water column overlying sediment along with codes provided by sampler, sampling depth in sediment, organic carbon and surface area of samples from marine deeper water environments, calcium carbonate-rich environments and fresh- water environments
( a ) Marine slopes, rises and deep sea
Location Water Sediment Organic Surface Location Water Sediment Organic Surface code depth depth carbon area code depth depth carbon area
(m) (era) (mgg -1) (m2g - l ) (m) (cm) (mgg - l ) (m2g -1 )
Fig. 3. Organic carbon concentration vs. core depth for cores taken in several slope and rise regions. Solid circles are data points, while the horizontal bars represent the range of the monolayer-equivalent level derived from the 95% confidence bars of Fig. 1, with each range determined for the surface area associated with that depth interval. No such confidence bars could be calculated for the Nigerian slope samples because the surface area values in this core are outside the range of data in Fig. 1.
354 L.M. Mayer / Chemical Geology 114 (1994.) 347-363
and Stewart, 1983). Notwithstanding this prob- able levelling, samples from the deep sea in areas distant from land (eastern and northeastern Pa- cific) have OC concentrations well below the ME zone. Some hemipelagic sediments near the Cal- ifornia shelf, east Pacific, at depths as great as 3728 m, had values within the ME zone. Many of the sediments from slope depths that were sampled in this study [e.g., northwestern and northeastern Atlantic, western Mediterranean and Skagerrak (North Sea) ] exhibit OC concen- trations within the ME zone, similar to shelf sed- iments. Some slope sediments with high surface area values, from the Washington and Nigerian slopes, had values which might be within or be- low the ME zone, depending on the extent to which the ME zone levels as clays become abun- dant. All samples with values above the ME zone were from areas with low dissolved oxygen con- centrations in the water column (Peru, west Mexico, California slope and basin, Black Sea).
Most cores from slope and rise areas showed relatively little downcore change in OC concen- tration (Fig. 3). The data are plotted with the ME zone indicated by a range bar that represents the upper and lower 95% confidence bounds of Fig. 1. Cores taken in slope areas with low dis- solved oxygen concentrations (Peru, California) showed little tendency to exhibit downcore loss of OC to the ME zone, at least within the depths sampled, in contrast to cores from shallow-water, low-oxygen areas such as Skan Bay (Alaska, U.S.A. ) which showed OC loss with depth to the ME level (Mayer, 1994). Longer cores (e.g., Ni- gerian and NW North Atlantic slopes) showed progressive slow decay over 2-4 m, suggesting that the refractory background concentrations of OC commonly found in shorter cores represent only a slowing of OC loss with depth.
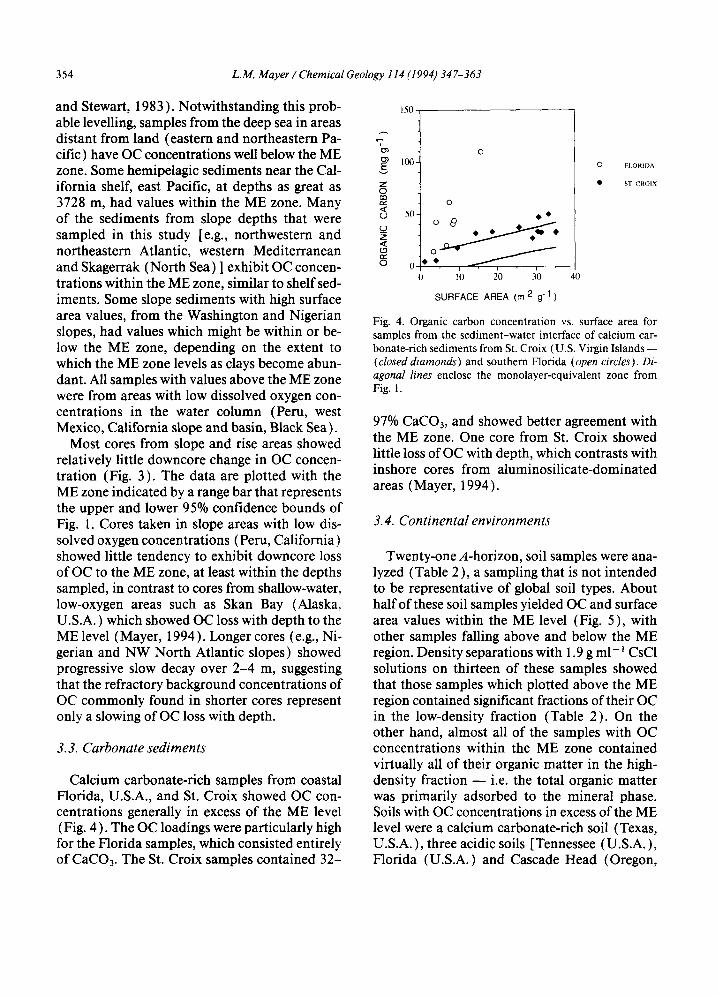
3.3. Carbonate sediments
Calcium carbonate-rich samples from coastal Florida, U.S.A., and St. Croix showed OC con- centrations generally in excess of the ME level (Fig. 4 ). The OC loadings were particularly high for the Florida samples, which consisted entirely of CaCO3. The St. Croix samples contained 32-
150
'7 0 ) t ~
Z o t ~ < U
Z <
o
1(30
50
0 0 40
0
1~0 20 30
SURFACE AREA (m 2 g-l)
0 FI,ORIDA
• SI' CROIX
Fig. 4. Organic carbon concent ra t ion vs. surface area for samples f rom the s ed imen t -wa t e r interface o f calc ium car- bonate-r ich sed imen t s f rom St. Croix (U.S. Virgin Is lands - - (closed diamonds) and sou thern Florida (open circles). Di- agonal lines enclose the monolayer -equiva len t zone f rom Fig. 1.
97% CaCO3, and showed better agreement with the ME zone. One core from St. Croix showed little loss of OC with depth, which contrasts with inshore cores from aluminosilicate-dominated areas (Mayer, 1994).
3.4. Continental environments
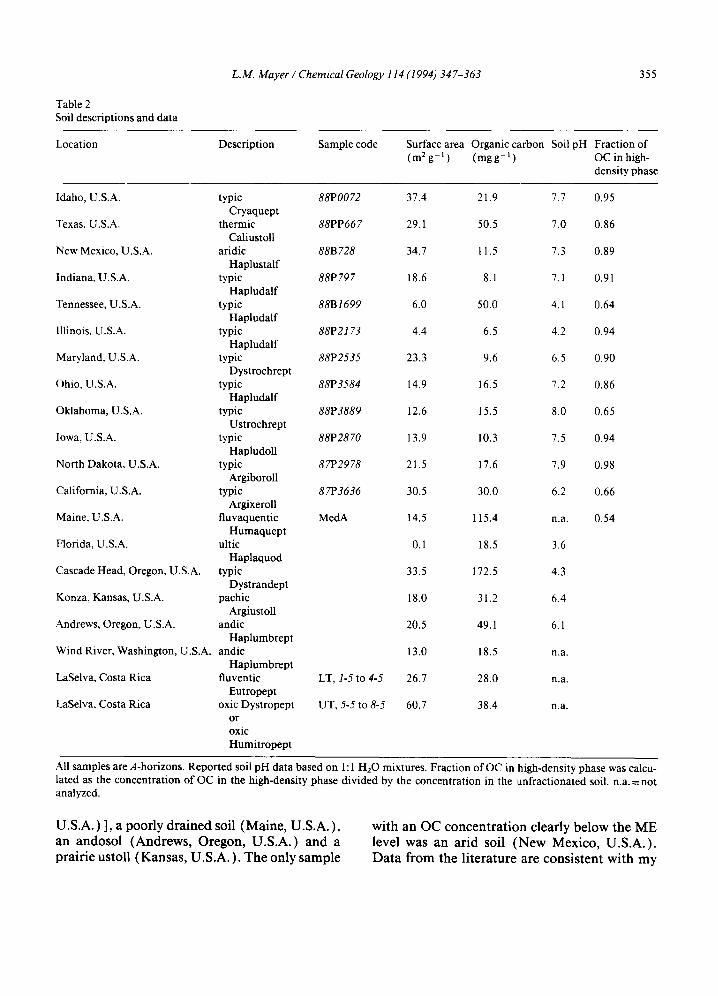
Twenty-one A-horizon, soil samples were ana- lyzed (Table 2 ), a sampling that is not intended to be representative of global soil types. About half of these soil samples yielded OC and surface area values within the ME level (Fig. 5), with other samples falling above and below the ME region. Density separations with 1.9 g ml - 1 CsCI solutions on thirteen of these samples showed that those samples which plotted above the ME region contained significant fractions of their OC in the low-density fraction (Table 2). On the other hand, almost all of the samples with OC concentrations within the ME zone contained virtually all of their organic matter in the high- density fraction - - i.e. the total organic matter was primarily adsorbed to the mineral phase. Soils with OC concentrations in excess of the ME level were a calcium carbonate-rich soil (Texas, U.S.A.), three acidic soils [Tennessee (U.S.A.), Florida (U.S.A.) and Cascade Head (Oregon,
L.M. Mayer / Chemical Geology 114 (1994) 347-363 355
Table 2 Soil descriptions and data
Location Description Sample code Surface area Organic carbon (m2g - l ) (mgg -1)
Soil pH Fraction of OC in high- density phase
Idaho, U.S.A.
Texas, U.S.A.
New Mexico, U.S.A.
Indiana, U.S.A.
Tennessee, U.S.A.
Illinois, U.S.A.
Maryland, U.S.A.
Ohio, U.S.A.
Oklahoma, U.S.A.
Iowa, U.S.A.
North Dakota, U.S.A.
California, U.S.A.
Maine, U.S.A.
Florida, U.S.A.
Cascade Head, Oregon, U.S.A.
Konza, Kansas, U.S.A.
Andrews, Oregon, U.S.A.
typic Cryaquept
thermic Caliustoll
aridic Haplustalf
typic Hapludalf
typic Hapludalf
typic Hapludalf
typic Dystrochrept
typic Hapludalf
typic Ustrochrept
typic Hapludoll
typic Argiboroll
typic Argixeroll
fluvaquentic Humaquept
ultic Haplaquod
typic Dystrandept
pachic Argiustoll
andic Haplumbrept
Wind River, Washington, U.S.A. andic Haplumbrept
LaSelva, Costa Rica fluventic Eutropept
LaSelva, Costa Rica oxic Dystropept or oxic Humitropept
88P0072 37.4 21.9 7.7
88PP667 29.1 50.5 7.0
88B728 34.7 11.5 7.3
88P797 18.6 8.1 7.1
88B1699 6.0 50.0 4.1
88P2173 4.4 6.5 4.2
88P2535 23.3 9.6 6.5
88P3584 14.9 16.5 7.2
88P3889 12.6 15.5 8.0
88P2870 13.9 10.3 7.5
87P2978 21.5 17.6 7.9
87P3636 30.5 30.0 6.2
MedA 14.5 115.4 n.a.
0.1 18.5 3.6
33.5 172.5 4.3
18.0 31.2 6.4
20.5 49.1 6.1
13.0 18.5 n.a.
LT, 1-5 to 4-5 26.7 28.0 n.a.
UT, 5-5 to 8-5 60.7 38.4 n.a.
0.95
0.86
0.89
0.91
0.64
0.94
0.90
0.86
0.65
0.94
0.98
0.66
0.54
All samples are A-horizons. Reported soil pH data based on l: 1 H20 mixtures. Fraction of OC in high-density phase was calcu- lated as the concentration of OC in the high-density phase divided by the concentration in the unfractionated soil. n.a. = not analyzed.
U.S.A. ) ], a poorly drained soil (Maine, U.S.A. ), an andosol (Andrews, Oregon, U.S.A.) and a prairie ustoll (Kansas, U.S.A. ). The only sample
with an OC c o n c e n t r a t i o n clearly be low the M E level was an a r id soil ( N e w Mexico , U .S .A. ) . D a t a f rom the l i t e ra tu re are cons i s t en t wi th m y
356 L.M. Mayer / Chemical Geology 114 (1994) 34 7-363
200
"7 ID)
150 E
Z O m 100 < £3 {_) z 50- < (.9 o
o
o o o
0~~0 0 0 0 o
0 '' ' I
,0 20 40 6'0
SURFACE AREA (m 2 g- 1
80
Fig. 5. Organic carbon concentration vs. surface area for soil samples; data are in Table 2. Diagonal lines enclose the monolayer-equivalent zone from Fig. 1.
100
Ig ° t.u • t:z: [] • < " ' ,~ 75 o U < t9 I.k. rv"
z < o ~ D,~P ~c,F~c ~.7) 25 j~ I • ,N.:,,^N. so,L ~18~
~ z o - - ~ 0 20 40 60 80
PORE WIDTH (nm)
Fig. 6. Percent of BET surface area vs. pore width in mineral grains from a deep Pacific sediment, a soil from Indiana and a carbonate sediment from Florida. The y-axis show the cu- mulative percentage contained in slit-shaped pores narrower than the x-axis value. Plotted values contain contributions from micropores. Total surface area values, from BET anal- ysis, of these samples are given in parentheses, and represent the 100% y-axis value. Pore size distribution was calculated from the N2 desorption isotherm.
results. Eight of twelve A-horizon samples re- ported by Gallez et al. (1976), Borggaard ( 1979, 1982), and Feller et al. (1992) yielded values within the ME zone. Literature data using sur- face area analyses other than the N2 BET method
were ignored, due to lack of comparability be- tween methods.
Little attempt was made to sample freshwater environments for this study. Two cores were ob- tained from Sabine Lake, Texas, and one core from the Vigia River in Brazil (Table 1 ). All three cores show OC concentrations below the ME level, with little change downcore in OC concentration relative to this level. From the lit- erature, Ball et al. (1990) examined grain size separates of an aquifer sand, considered to be a former lacustrine deposit, and Baccini et al. (1982) examined a modern lake sediment. In contrast to my findings, their data are within the ME zone.
3.5. Nature of mineral surfaces
The surface area of minerals found in soils and sediments is considerably higher than would be predicted from grain size (Weiler and Mills, 1965 ), due to surface roughness of the mineral particles. This surface roughness can be ex- pressed in terms of a pore size distribution, by calculating the surface area associated with pores of different sizes (micropores are < 2 nm, mesopores are 2-50 nm and macropores are > 50 nm in width). The most common method to measure the mesopore size distribution is to ex- amine N 2 condensation at intermediate partial pressures. Assumptions and other details for these measurements and calculations are pre- sented in Mayer (1994). Most adsorption-de- sorption isotherms had narrow hysteresis loops indicative of slit-shaped pores, as found by Greenland and Mott (1978) and Titley et al. (1987). The instrument's software calculates pore sizes assuming cylindrical pores, but the ra- dii of cylindrical pores can be regarded as equiv- alent to the width of slit-shaped pores (Innes, 1957 ) and are presented here as slit widths.
Pore size distributions were calculated for this study using the desorption leg of the adsorption- desorption isotherm. Although either leg may be used for such calculations, slit-shaped pores likely have a delay in condensation during the adsorp- tion leg and hence can give misleading results. Further, excellent agreement was found between
L.M. Mayer / Chemical Geology 114 (1994) 347-363 357
Table 3 Pore size data for soils and sediments
BET Micropore Total mesopore surface Sum surface area surface area area (micropore+desorpt ion (m 2 g- 1 ) (m 2 g- ' ) mesopore area )
adsorption desorption (m 2 g-~ ) (m2g - t ) (m2g - l )
BET surface area calculated from multi-point adsorption data. Micropore surface area calculated from t-plots. Total mesopore surface areas calculated from adsorption and desorption legs of isotherm and are integrated over entire mesopore range. The sum of the surface areas from the micropores and mesopores (calculated from the desorption leg) agree well with the BET surface area, which measures all surfaces. The last column gives the ratio of surface area found in micropores and mesopores < 8 nm in width (from the desorption leg) to the BET surface area.
the BET surface area values and the sum of the cumulative surface area from the desorption iso- therm plus the surface area from micropores (Table 3 ). Poorer agreement was found using the adsorption leg. The major exception to this agreement was the Cascade Head soil, which had 60% more area from the sum of mesopores and micropores than was obtained by BET analysis. This sample showed an abnormally large adsorp- tion-desorption hysteresis, which suggests net- work effects during desorption that cause over- estimates of surface area (Lowell and Shields, 1984). The hysteresis is similar to that observed for halloysite (Gregg and Sing, 1982), and per- haps indicates tubular minerals such as imogo- lite, a common constituent of andosols.
All samples examined in this study showed the total surface area to be dominated by smaller mesopores (2-8-nm width) and micropores ( < 2 nm), especially the former (Fig. 6; Table 3 ). No sample showed more than 13.1% of its surface area in micropores. Macropores ( > 50 nm) are generally unimportant contributors to surface area, based on two continental shelf samples
analyzed commercially by mercury porosimetry (Lowell and Shields, 1984), in addition to the excellent agreement between BET analyses and the sum of micropore and mesopore areas. These data are consistent with results of Greenland and Mott (1978), Titley et al. (1987), and Murray and Quirk ( 1990a, b). No systematic trends were found with sample location. The carbonate sed- iment had a considerably lower fraction of its surface area associated with small mesopores than any of the aluminosilicate samples. Experi- ments testing the effect of the hydrogen peroxide attack showed that these results are not an arti- fact of that step.
4. Discussion
The data presented in Mayer (1994) show that the ME zone defines a relationship between OC concentrations and surface area that is remarka- bly consistent for aluminosilicate sediments of continental shelf regimes away from major sedi- ment-carrying rivers. Moreover, most of the up-
358 L.M. Mayer / Chemical Geology 114 (1994) 347-363
per slopes and rises adjacent to shelves show "draping" of this ME relationship to considera- ble depth (e.g., California and NW North Atlan- tic slopes), though several samples may show sub-ME levels of OC. In areas of low dissolved oxygen concentration the OC concentrations commonly exceed the ME level. In shallow-water areas this enrichment decreases downcore to the ME zone within tens of cm, whereas in slope sites this enrichment appears to persist downcore. In deltaic regions the OC concentrations are gener- ally below the ME level (Mayer, 1994).
Carbonate sediments were sampled only in areas within a few meters of shore, and were gen- erally found to contain OC in excess of the ME level. This finding may result from the sampling bias toward very shallow water. The persistence of OC downcore suggests a greater stabilization of OC than is found in comparable aluminosili- cate sediments, perhaps due to incorporation of organic matter within the mineral matrix. On the other hand, Suess ( 1973 ) found size separates of a lagoonal carbonate sediment to contain ME levels of OC. It is premature to infer patterns of OC relative to the ME level in carbonate sediments.
Consistent patterns of OC accumulation rela- tive to the ME zone in soils are also not clear, due to the small number of samples analyzed. The data presented here and in the literature are at least consistent with the pattern:
about half of the soils reported here and in the literature are within the ME zone;
a group of soils with OC concentrations above the ME zone are in environments thought to have particular stabilization mechanisms for organic matter (e.g., acidic, allophanic and poorly drained soils), or in a carbonate soil which shows an enrichment analogous to the marine carbon- ate samples; m OC concentrations below the ME zone are in an arid region of low organic matter production, analogous to the deep-sea samples.
Clearly more data are needed to establish the applicability of the ME zone to soils. The OC concentrations of A-horizons commonly fall into the 5-40 mg g- z OC range that is typical for the ME level. Regional soil surveys often show strong
correlation with grain size as measured by clay content (e.g., Spain et al., 1983; Nichols, 1984 ). The clay content, expressed as percent, is numer- ically similar to its surface area, expressed a s m 2 g-1 (Mayer and Rossi, 1982). Regionally tight relationships between OC concentration and percent-clay reported in the literature (e.g., Ni- chols, 1984; McDaniel and Munn, 1985) thus suggest a more widespread adherence to the ME zone in soils such as mesic Mollisols. An addi- tional, complicating factor in many soil A-hori- zons is vascular plant detritus, which can con- tribute significant amounts of non-adsorbed organic matter.
Hence it seems that the ME level is a remark- ably common, though far from universal, rela- tionship between OC concentration and surface area in aluminosilicate sediments and soils. The ME level seems to be particularly common in aluminosilicates on continental platforms (i.e. soils, shelves and upper slopes) that receive moderate delivery of organic matter and are not subjected to oxygen depletion or low pH. Fur- thermore, density separation data presented here for soils and in Mayer et al. (1993) and Mayer (1994) for sediments indicate that organic mat- ter is primarily adsorbed to the mineral phase. What mechanism might link OC concentration and surface area?
4.1. Hypothesis
The pore size distribution data (Table 3; Fig. 6) may provide a clue to such a link. Most of the surface area of all of the aluminosilicate sedi- ments and soils measured is in the form of very small mesopores and micropores, a fact gener- ally unappreciated in the literature. If present in a highly dispersed state such as a monolayer, then organic coatings on mineral grains most likely reside in these small pores. Hydrolytic enzymes, which are responsible for the initial step in or- ganic matter decay, are unable to enter pores of smaller than about twice their major axis (Mes- sing, 1974). This size exclusion of enzymes ought to prevent even the smallest of hydrolytic en- zymes, with molecular weights of 10-20 kD and major axis lengths of ~ 4 nm (Arai and Norde,
L.M. Mayer / Chemical Geology 114 (1994) 347-363 359
1990), from entering pores smaller than 8 rim, which contain most of the surface area in soils and sediments. Most hydrolytic enzymes are larger than 10-20 kD, with larger exclusion sizes. Therefore, if the enzymatic hydrolysis of ma- cromolecules to smaller oligomers or monomers is the rate-limiting step in the metabolism of sed- iment or soil organic matter, it follows that at least a kinetic inhibition of organic matter decay will occur if the organic matter is adsorbed into small pores.
The correlation of OC concentration with sur- face area that defines the ME zone (Fig. 1 ) may therefore represent a maximum adsorptive ca- pacity of minerals for organic matter that can be protected by enzyme exclusion. This saturation of protected adsorption sites may explain the common grain size correlation with OC concen- tration found for shelf environments, which do show saturation, but not for deep-sea environ- ments (Premuzic et al., 1982; Romankevich, 1984), which are below saturation. Samples with OC concentrations below the ME zone may still be protected in a like manner, but simply have not built up organic coatings to ME levels. We therefore find sub-ME levels of OC in soils and sediments with low organic matter delivery rates (arid regions, deep sea) or in areas with rapid sedimentation rates that prevent long-term ex- posure to organic inputs (e.g., deltaic regions). Within an area of sub-ME levels of OC such as the deep sea, it is therefore reasonable to find OC concentrations proportional to organic matter delivery rates (i.e. primary production rates in the overlying water column).
Evidence for pore protection in sediments with sub-ME levels of OC is the fact that cores with such levels do not show rapid decreases in OC concentration near the sediment-water interface (e.g., Mississippi Delta, Nigerian slope, Sabine Lake). In no core examined in this study or Mayer (1994) was there rapid decrease in OC with depth in the core once the OC concentra- tions were at or below the ME level. However, longer cores such as those from the NW North Atlantic and Nigerian slopes show that stabili- zation at the ME level is but a slowing of decay, not a complete cessation. Future work should as-
sess decay constants for OC in the context of the ME zone.
The ME level defines the OC concentration at which downcore loss of OC slows markedly in most continental platform cores collected at sites with oxygenated water columns. In coastal areas with low dissolved oxygen levels in the water col- umn [Skan Bay (Alaska, U.S.A.), Chesapeake Bay (Maryland, U.S.A. ), Saanich Inlet (British Columbia, Canada); Mayer, 1994 ], the OC lev- els also decreased to ME levels within depths of tens of cm, while in slope areas with low dis- solved oxygen levels (California, Peru) OC did not approach the ME level. In these latter areas there is presumably some other means of protec- tion of organic matter at levels higher than the ME zone, which is overcome in the shallower areas. The nature of such a protection mecha- nism is beyond the scope of this paper, but use of the ME zone allows its identification.
Many hypotheses have been put forward to ex- plain the stability of organic matter in soils and sediments. These hypotheses are frequently based on selective preservation of a refractory compo- nent of the original biochemical compounds (e.g., lignins, cutins), formation of heteropoly- condensates (humification), or some form of physical protection such as adsorption. Each type of stabilization may operate to some extent in different environments [reviewed in Henrichs ( 1992 ) ]. However, stabilization by the first two categories of protective mechanism - - selective preservation and condensation - - cannot by themselves explain the surface area dependence of OC concentrations found so frequently. This surface area dependence implies some critical role for adsorption.
The literature on the effects of adsorption on bioavailability is ambiguous. Many studies have demonstrated a reduction in bioavailability of organic molecules upon adsorption to mineral surfaces. Greatest inhibition has been observed with minerals such as expandable clays or allo- phanic materials (Pinck et al., 1954; Kobayashi and Aomine, 1967; Greaves and Wilson, 1973 ), though even clay-free sand has been shown to stabilize organic compounds (Lorenz and Wack- ernagel, 1987 ). However, adsorbed organic ma-
360 L.M. Mayer / Chemical Geology 114 (1994) 347-363
cromolecules can be attacked by hydrolytic en- zymes and made available for biological uptake (Estermann et al., 1959; Greaves and Wilson, 1970; Samuelsson and Kirchman, 1990). Incor- poration into small pores offers a mechanism by which adsorptive protection can be effective, and perhaps explain these inconsistencies in the literature.
Pore exclusion of enzymes differs from other matrix protection hypotheses. The long-hypoth- esized role of interlameUar adsorption in ex- pandable clays appears to have a role in decadal stabilization of organic matter (Ensminger and Gieseking, 1942; Sorensen, 1967), but soils and sediments with high concentrations of expanda- ble clays do not show enhanced OC concentra- tions consistent with the very high interlamellar surface areas (760 m 2 g-1 ) of these minerals. In- terparticle porosity (in contrast to the intrapar- ticle porosity measured in this study) has been hypothesized to exclude bacterial cells and hence their access to organic molecules (van Veen and Kuikman, 1990). The interparticle pore sizes necessary to exclude bacterial cells are two or- ders of magnitude larger than the intraparticle pores necessary to exclude their hydrolytic en- zymes. In both the expandable clay and interpar- ticle pore hypotheses, the pores are eventually expandable and hence accessible. Intraparticle pores are not expandable, and can provide a greater capability for long-term organic matter protection. Clay fractions of sediments, in fact, appear to contain less organic matter per unit of measured surface area than tektosilicate frac- tions (Keil et al., 1994).
A prerequisite for effective stabilization of or- ganic matter by incorporation into small pores is that adsorbed molecules remain in the pores. Or- ganic molecules that easily desorb will become available for hydrolytic attack in solution and hence show little preservation. Adsorptive pro- tection of organic molecules may require either condensation to create strongly adsorbed mole- cules, or selection for original biochemicals that have this property. In this manner the adsorp- tion protection hypothesis may operate with other stabilization mechanisms, rather than in place of them.
Long times may be required to accumulate these strongly adsorbed organic molecules. Soil chronosequences typically indicate that OC con- centrations in the A-horizon require decades to millennia before reaching, and stabilizing at, values suggestive of ME levels (Sollins et al., 1983; Birkeland, 1984). Similar time sequences are more difficult to find in sediment systems, because organic-free mineral surfaces are not generally placed into depositional situations. Data from samples of deltaic origin demonstrate that OC concentrations below the ME level (Mayer, 1994) are not built up to ME levels within the time allowed by the rapid sedimenta- tion rate of these systems. Slow build-up of or- ganic matter protected by adsorption into meso- pores is consistent with the paucity of the common biochemicals (proteins, carbohy- drates ) in bulk sedimentary organic matter, and points toward involvement of some kind of slower process like condensation reactions or se- lection for a minor, refractory, biochemical con- stituent. The great age of organic matter in many recent sediments and soils - - ~ 103 yr (e.g., Scharpenseel, 1977; Walsh et al., 1985 ) - - is fur- ther evidence for slow accumulation. The lack of build-up to ME levels in deep-sea sediments in- dicates, however, that time is not the only factor; some minimum rate of organic matter delivery in conjunction with sufficient time must be nec- essary to achieve saturation of protected sites.
Adsorption into small pores might promote successful condensation reactions because: (1) some condensation reactions are both kinetically and thermodynamically favored when the reac- tants are adsorbed (W~ichtersh~iuser, 1988 ); and (2) adsorption into small pores may provide a site where slower condensation reactions can oc- cur because of exclusion of faster, competitive biological reactions, as suggested for melanoidin formation in bone tissue (Collins et al., 1992 ).
4.2. Geochemical implications
The data presented here indicate that many aluminosilicate soils and sediments show stabi- lization of OC concentrations at a level related to the total surface area of the minerals. The pore
L.M. Mayer / Chemical Geology 114 (1994) 347-363 361
size data provide a possible reason for this ap- parent stabilization, via the hypothesis of hydro- lytic enzyme exclusion. Regardless of the verac- ity of the enzyme exclusion hypothesis, the fact that OC concentrations are so tightly coupled to surface area has important implications. First, the ability of some soils to accumulate standing stocks of OC, or of depositional environments to bury OC to depths of ~ 1 0 1 - 1 0 2 cm, may be di- rectly related to the surface area of the constitu- ent minerals. This surface area is largely created by disaggregation of rocks and corrosion of min- eral surfaces. At geological time and space scales, OC accumulation and burial will be limited by the rate of creation of adsorptive mineral sur- faces. This rate will in turn be controlled by nu- merous factors, with tectonics controlling at large space and time scales. This control can explain, for example, the spatial correlations between sedimentation rate and OC burial rate [though it is not the only explanation; see review in Ingall and van Capellen (1990)] . The temporal asso- ciation of OC burial with tectonic activity and hence sedimentation rates since the Archean (Des Marais et al., 1992) is a further example. The pore protection hypothesis provides a me- chanistic explanation for this covariance, in con- trast to most explanations that rely on covari- ance of both organic matter and mineral accumulation rates on a third factor such as water depth or proximity to shore.
Surface area control of OC concentration can explain the relative carbon burial flux via OC vs. mineral carbonate sedimentation since Precam- brian times (Schidlowski, 1988; Des Marais et al., 1992). The ratio of these two flux terms is about 1:4 in the latter half of Earth history. As- suming that surface area provides a cap on OC burial flux, then this flux ratio can be predicted from the ratio of surface area generated by weathering to the amount of dissolved Ca deliv- ered to the ocean. The supply of adsorptive sur- faces can be estimated as the product of the pre- agricultural riverine flux of sediment to the oceans m ~ 200 mg l - 1 sediment (Milliman and Syvitski, 1992) and an average surface area of 15 m 2 g- i (the approximate mid-point of the shelf sediment values from Fig. 1 ). Assuming an
ME level of OC ( ~ 10 mg g- 10C, from Fig. 1 ), riverine sediment can then lead to 0.167 mmol OC burial per liter of river water flux. The aver- age riverine dissolved Ca concentrations of 0.375 mM, to which can be added the equivalent of 0.066 m M from hydrothermal inputs of Ca to the ocean, can then allow 0.44 mmol C per liter of river water flux to precipitate as carbonate min- erals. The ratio derived from surface area and dissolved Ca is thus 1::2.6, similar to the ob- served ratio of 1:4. The calculation could be re- fined by using the appropriate average surface area of weathered minerals, the appropriate value of OC relative to the ME level in average buried sediment (a sub-ME level of OC, as found for deltas, is likely more appropriate), incorpora- tion of Mg into the carbonate minerals, and so forth.
An intriguing question that arises as a result of ME levels of OC in both soils and continental shelf sediments is the degree to which OC in shelf sediments represents new carbon storage. Shelf sedimentary OC may contain significant contri- butions from terrigenous OC [reviewed in Hedges ( 1992 ) ], so that shelf burial loses some importance as a sink for carbon derived from the marine environment. If shelf sedimentary OC is indeed primarily marine, then the terrigenous OC must have been somehow displaced by marine OC. It is not known if riverine sediment deliv- ered to the ocean contains an ME level of OC. Keil et al. (1994) found suspended sediment from the Columbia River (Washington) to have OC concentrations at the ME level, though the riverine sediments presented here have lower concentrations. Although the soil samples in this study frequently showed ME levels of OC, river- ine sediment may be derived extensively from soil horizons below the A-horizon and therefore have, on average, sub-ME levels of OC. These possibilities require further examination before the net role of ocean margin sedimentation in the carbon cycle can be assessed.
Acknowledgements
I thank L. Schick and K. Hardy for their assis- tance in the laboratory. Many persons went to
considerable effort to provide samples for this study, and I thank R. Anderson, T. Bianchi, T.H. Blackburn, J. Brooks, D. Burdige, J. Christen- sen, A. Devol, F. Dobbs, T. Eglinton, I. Fernan- dez, M. Fuhrman, S. Henrichs, P. Jumars, R. Keil, G. King, R. Lotti, D. McCorkle, J. Murray, C. Reimers, L. Self, P. Sollins, Soil Conservation Service (USDA), L. Wafting and J. Waugh. Use- ful comments on the manuscript were provided by R. Keil and an anonymous reviewer. This work was supported by the NSF (OCE 89- 22202) and Department of Energy (92- ER61433), as well as grants supporting the La- mont-Doherty Geological Observatory Deep-Sea Sample Repository (NSF 91-01689 and ONR N00014-90-J- 1060).
References
Arai, T. and Norde, W., 1990. The behavior of some model proteins at solid-liquid interfaces, I. Adsorption from single protein solutions. Coll. Surf., 51: 1-15.
Arnold, J.D. and Pak, C.Y.C., 1962. Protein-protein inter- action at the air-water interface. J. Coll. Sci., 17: 348- 362.
Baccini, P., Grieder, R., Stierli, E. and Goldberg, S., 1982. The influence of natural organic matter on the adsorption properties of mineral particles in lake water. Schweiz. Z. Hydrol., 44:99-116.
Ball, W.P., Buehler, C.H., Harmon, T.C., Mackay, D.M. and Roberts, P.V., 1990. Characterization of a sandy aquifer material at the grain scale. J. Contam. Hydrol., 5: 253- 295.
Barrett, E.G., Joyner, L.G. and Halenda, P.P., 1951. The de- termination of pore volume and area distributions in po- rous substances, I. Computations from nitrogen iso- therms. J. Am. Chem. Soc., 73: 373-380.
Berner, R.A., 1982. Burial of organic carbon and pyrite sul- fur in the modern ocean: its geochemical and environ- mental significance. Am. J. Sci., 282: 451-473.
Birkeland, P.W., 1984. Soils and Geomorphology. Oxford University Press, Oxford, 372 pp.
Borggaard, O.K., 1979. Selective extraction of amorphous iron oxides by EDTA from a Danish sandy loam. J. Soil Sci., 30: 727-734.
Borggaard, O.K., 1982. Effect of granulation of soil samples and minerals on measurements of specific surface by ni- trogen adsorption. Geoderma, 28: 147-149.
Collins, M.J., Westbroek, P., Muyzer, G. and DeLeeuw, J.W., 1992. Experimental evidence for condensation reactions between sugars and proteins in carbonate skeletons. Geo- chim. Cosmochim. Acta, 56:1539-1544.
deBoer, J.H., Lippens, B.C., Lippens, B.G., Broekhoff, J.C.P., van den Heuvel, A. and Osinga, Th.V., 1966. The t-curve of multimolecular N2-adsorption, J. Coll. Interface Sci., 21: 405-414.
Des Marais, D.J., Strauss, H., Summons, R.E. and Hayes, J.M., 1992. Carbon isotopic evidence for the stepwise ox- idation of the Proterozoic environment. Nature (Lon- don), 359: 605-609.
Ensminger, L.E. and Gieseking, J.E., 1942. Resistance of clay- adsorbed proteins to proteolytic hydrolysis. Soil Sci., 50: 205-209.
Estermann, E.G., Peterson, G.H. and McLaren, A.D., 1959. Digestion of clay-protein, lignin-protein, and silica-pro- tein complexes by enzymes and bacteria. Soil Sci. Soc. Am. Proc., 23: 31-36.
Feller, C., Schouller, E., Thomas, F., Rouiller, J. and Herbil- lon, A.J., 1992. N2-BET specific surface areas of some low activity clay soils and their relationships with secondary constituents and organic matter contents. Soil Sci., 153: 293-299.
Gallez, A., Juo, A.S.R. and Herbillon, A.J., 1976. Surface and charge characteristics of selected soils in the tropics. Soil Sci. Soc. Am. J., 40: 601-608.
Gaudette, H.E., Hight, W.R., Toner, L. and Folger, D.W., 1974. An inexpensive titration method for the determi- nation of organic carbon in recent sediments. J. Sedi- ment. Petrol., 44: 249-253.
Greaves, M.P. and Wilson, M.J., 1970. The degradation of nucleic acids and montmorillonite-nucleic acid com- plexes by soil microorganisms. Soil Biol. Biochem., 2: 257- 268.
Greaves, M.P. and Wilson, M.J., 1973. Effects of soil micro- organisms on montmorillonite-adenine complexes. Soil Biol. Biochem., 5: 275-276.
Greenland, D.J. and Mott, C.J.B., 1978. Surfaces of soil par- ticles. In: D.J. Greenland and M.H.B. Hayes (Editors), The Chemistry of Soil Constituents. Wiley, New York, N.Y., pp. 321-353.
Gregg, S.J. and Sing, K.S.W., 1982. Adsorption, Surface Area and Porosity. Academic Press, London, 303 pp.
Hedges, J.I., 1992. Global biogeochemical cycles: progress and problems. Mar. Chem., 39: 67-93.
Henrichs, S.M., 1992. Early diagenesis of organic matter in marine sediments: progress and perplexity. Mar. Chem., 39:119-149.
Henrichs, S.M. and Reeburgh, W.S., 1987. Anaerobic min- eralization of marine sediment organic matter: Rates and the role of anaerobic processes in the oceanic carbon economy. Geomicrobiol. J., 5:191-237.
Ingall, E.D. and van Capellen, P., 1990. Relation between sedimentation rate and burial of organic phosphorus and organic carbon in marine sediments. Geochim. Cosmo- chim. Acta, 54: 373-386.
Innes, W.B., 1957. Use of a parallel plate model in calcula- tion of pore size distribution. Anal. Chem., 29: 1069-1073.
Keil, R., Tsamakis, E., Bor Fuh, C., Giddings, J.C. and Hedges, J.I., 1994. Mineralogical and textural controls on
L.M. Mayer / Chemical Geology 114 (1994) 347-363 363
the organic composition of coastal marine sediments: Hy- drodynamic separation using SPLITT-fractionation. Geochim. Cosmochim. Acta., 58: 879-893.
Kobayashi, Y. and Aomine, S., 1967. Mechanism of inhibi- tory effect of allophane and montmorillonite on some en- zymes. Soil Sci. Plant Nutr., 13: 189-194.
Lorenz, M.G. and Wackernagel, W., 1987. Adsorption of DNA to sand and variable degradation rates of adsorbed DNA. Appl. Environ. Microbiol., 53: 2948-2952.
Lowell, S. and Shields, J.E., 1984. Powder Surface Area and Porosity. Chapman and Hall, London, 234 pp.
Mayer, L.M., 1993. Organic matter at the sediment-water interface. In: M. Engel and S. Macko (Editors), Organic Geochemistry, Plenum, New York, N.Y., pp. 171-184.
Mayer, L.M., 1994. Adsorptive control of organic carbon ac- cumulation in continental shelf sediments. Geochim. Cosmochim. Acta (in press).
Mayer, L.M. and Rossi, P.M., 1982. Specific surface areas in coastal sediments: Relationships with other textural fac- tors. Mar. Geol., 45: 241-252.
Mayer, L., Macko, S. and Cammen, L., 1988. Provenance, concentrations, and nature of sedimentary organic nitro- gen in the Gulf of Maine. Mar. Chem., 25: 291-304.
Mayer, L.M., Jumars, P.A., Taghon, G.L., Macko, S.A. and Trumbore, S., 1993. Low-density particles as potential ni- trogenous foods for benthos. J. Mar. Res., 51: 373-389.
McDaniel, P.A. and Munn, L.C., 1985. Effect of temperature on organic carbon-texture relationships in Mollisols and Aridisols. Soil Sci. Soc. Am. J., 49: 1486-1489.
Messing, R.A., 1974. Simultaneously immobilized glucose oxidase and catalase in controlled-pore titania. Biotech- nol. Bioeng., 16: 897-908.
Milliman, J.D. and Syvitski, J.P.M., 1992. Geomorphic/tec- tonic control of sediment discharge to the ocean: The im- portance of small mountainous rivers. J. Geol., 100: 525- 544.
Murray, R.S. and Quirk, J.P., 1990a. Surface area of clays. Langmuir, 6: 122-124.
Murray, R.S. and Quirk, J.P., 1990b. Intrinsic failure and cracking of clay. Soil Sci. Soc. Am. J., 54:1179-1184.
Nichols, J.D., 1984. Relation of organic carbon to soil prop- erties and climate in the Southern Great Plains. Soil Sci. Soc. Am. J., 48: 1382-1384.
Pinck, L.A., Dyal, R.S. and Allison, F.E., 1954. Protein- montmorillonite complexes, their preparation and the ef- fects of soil microorganisms on their decomposition. Soil Sci., 78:109-118.
Premuzic, E.T., Benkovitz, C.M., Gaffney, J.S. and Walsh, J.J., 1982. The nature and distribution of organic matter in the surface sediments of world oceans and seas. Org. Geochem., 4: 63-77.
Romankevich, E.A., 1984. Geochemistry of Organic Matter in the Ocean. Springer, Berlin, 334 pp.
Samuelsson, M.-O. and Kirchman, D.L., 1990. Degradation of adsorbed protein by attached bacteria in relationship to surface hydrophobicity. Appl. Environ. Microbiol., 56: 3643-3648.
Scharpenseel, H.W., 1977. The search for biologically inert and lithogenic carbon in recent soil organic matter. In: Soil Organic Matter Studies. IAEA (Int. At. Energy Agency), Vienna, Proc. Ser., 2: 193-201.
Schidlowski, M., 1988. A 3,800-million-year isotopic record of life from carbon in sedimentary rocks. Nature (Lon- don), 333: 313-318.
Sollins, P., Spycher, G. and Topik, C., 1983. Processes of soil organic-matter accretion at a mudflow chronosequence, Mt. Shasta, California. Ecology, 64: 1273-1282.
Sorensen, L.H., 1967. Duration of amino acid metabolites formed in soils during decomposition of carbohydrates. Soil Sci., 67: 234-241.
Spain, A.V., Isbell, R.F. and Probert, M.E., 1983. Soil or- ganic matter. In: Soils, An Australian Viewpoint. CSIRO (Commonw. Sci. Ind. Res. Org.), Melbourne, Vic./Aca- demic Press, London, pp. 551-563.
Suess, E., 1973. Interaction of organic compounds with cal- cium carbonate, II. Organo-carbonate association in Re- cent sediments. Geochim. Cosmochim. Acta, 37: 2435- 2447.
Tanoue, E. and Handa, N., 1979. Differential sorption of or- ganic matter by various sized sediment particles in Re- cent sediment from the Bering Sea. J. Oceanogr. Soc. Jpn., 35: 199-208.
Tiessen, H. and Stewart, J.W.B., 1983. Particle-size fractions and their use in studies of soil organic matter, II. Culti- vation effects on organic matter composition in size frac- tions. Soil Sci. Soc. Am. J., 47: 509-514.
Titley, J.G., Glegg, G.A., Glasson, D.R. and Millward, G.E., 1987. Surface areas and porosities of particulate matter in turbid estuaries. Cont. ShelfRes., 7:1363-1366.
van Veen, J.A. and Kuikman, P.J., 1990. Soil structural as- pects of decomposition by micro-organisms. Biogeo- chemistry, 11: 213-233.
W~ichtersh~iuser, G., 1988. Before enzymes and templates: Theory of surface metabolism. Microb. Rev., 52: 452-484.
Walsh, J.J., Premuzic, E.T., Gaffney, J.S., Rowe, G.T., Har- bottle, G., Stoenner, R.W., Balsam, W.L., Betzer, P.R. and Macko, S.A., 1985. Organic storage of CO2 on the conti- nental slope off the mid-Atlantic bight, the southeastern Bering Sea, and the Peru coast. Deep-Sea Res., 32: 853- 883.
Weiler, R.R. and Mills A.A., 1965. Surface properties and pore structure of marine sediments. Deep-Sea Res., 12:511- 529.