Gulf and Caribbean Research Vol 19(2), 37–52, 2007 Manuscript received December 15, 2006; accepted April 15, 2007 37 RELATIVE ABUNDANCE OF PELAGIC SHARKS IN THE WESTERN NORTH ATLANTIC OCEAN, INCLUDING THE GULF OF MEXICO AND CARIBBEAN SEA Enric Cortés 1 , Craig A. Brown 2 , and Lawrence R. Beerkircher 2 1 National Marine Fisheries Service, Panama City Laboratory, 3500 Delwood Beach Road, Panama City, Florida 32408 USA, E-mail [email protected]2 National Marine Fisheries Service, Southeast Fisheries Science Center, 75 Virginia Beach Drive, Miami, Florida 33149 USA ABSTRACT Little information exists on the status of pelagic shark populations in the Atlantic Ocean, especially in the Gulf of Mexico and Caribbean Sea. We derived indices of relative abundance for pelagic sharks based on man- datory logbooks and observer reports from a scientific observer program of the United States (US) pelagic longline fleet. Time series data from the pelagic longline logbook program (1986–2005) and the pelagic longline observer program (1992–2005) were standardized with Generalized Linear Model (GLM) procedures. Declines in relative abundance for the 6 pelagic shark species or genera examined in the logbook data analysis ranged from 43% for mako sharks, Isurus spp., to 88% for blue sharks, Prionace glauca, whereas declines in relative abundance obtained from the observer data analysis were less accentuated than those in the logbook data analysis, with the trend being positive for night sharks, Carcharhinus signatus, and thresher sharks, Alopias spp. There was no significant change in the fork length at capture over the time period considered for blue sharks, shortfin makos Isurus oxyrinchus, or night sharks. The trends obtained must be viewed cautiously given recognized shortcomings, especially of the log- book dataset, and the highly migratory nature of pelagic sharks, which requires a more comprehensive evaluation of trends throughout their range. RESUMEN Existe poca información sobre el estado de las poblaciones de tiburones pelágicos en el Océano Atlántico, especialmente en el Golfo de México y el Mar Caribe. Derivamos índices de abundancia relativa para tiburones pelágicos a partir de cuadernos de bitácora e informes de observadores de un programa de observadores científicos de la flota palangrera pelágica de los Estados Unidos (EE.UU.). Las series temporales del programa de cuadernos de bitácora de palangre pelágico (1986–2005) y del programa de observadores de palangre pelágico (1992–2005) se estandarizaron por medio de Modelos Lineales Generalizados (GLMs). Las reducciones en abun- dancia relativa de las seis especies o géneros de tiburones pelágicos que se examinaron variaron entre el 43% para Isurus spp. y el 88% para Prionace glauca, mientras que los descensos en abundancia relativa obtenidos del análisis de los datos de observadores fueron menos acentuados que los del análisis de los datos de los cuadernos de bitácora, con Carcharhinus signatus y Alopias spp. mostrando tendencias positivas. No se encontraron cambios significativos en la longitud furcal de las capturas durante el período analizado para P. glauca, Isurus oxyrinchus o C. signatus. Las tendencias obtenidas deben interpretarse con cautela debido a distintos problemas, en especial con los cuader- nos de bitácora, y el hecho de que los tiburones pelágicos son altamente migratorios, lo cual requiere una evaluación más exaustiva de las tendencias que abarque todo el rango de distribución de estas especies. INTRODUCTION There is mounting concern about the status of pelagic shark populations worldwide. While it is widely recog- nized that many populations in the Atlantic Ocean have experienced substantial declines with respect to virgin (unexploited) levels, the extent of these declines has been the subject of intense debate (Baum et al. 2003, Baum and Myers 2004, Burgess et al. 2005a,b, Baum et al. 2005). Pelagic sharks are often trans-oceanic species and are harvested or caught as bycatch by fishers from several nations. Although it has long been recognized that assess- ment of pelagic shark resources requires a multinational approach, the first assessment of 2 pelagic shark species (shortfin mako, Isurus oxyrinchus, and blue shark, Prionace glauca) in the Atlantic Ocean did not take place until 2004, under the auspices of the International Commission for the Conservation of Atlantic Tunas (ICCAT). That assess- ment, which was considered very preliminary owing to the limitations of both the quantity and quality of information available, concluded that stock biomass of both North and South Atlantic blue sharks was likely above Maximum Sustainable Yield (MSY), whereas the North Atlantic stock of shortfin mako could be below biomass at MSY, with the magnitude of the decline for the shortfin mako stock in the South Atlantic estimated to be less than in the North Atlantic stock (ICCAT 2005). Three species of pelagic sharks, the bigeye thresher, Alopias superciliosus, longfin mako, Isurus paucus, and the night shark, Carcharhinus signatus, have been pro- hibited to fisheries in Northwest Atlantic US waters since 2000 (NMFS 2003). In 1997, the night shark was also des-
Transcript
Gulf and Caribbean Research Vol 19(2), 37–52, 2007 Manuscript received December 15, 2006; accepted April 15, 2007
37
RELATIVE ABUNdANCE OF PELAGIC SHARkS IN THE WESTERN NORTH ATLANTIC OCEAN, INCLUdING THE GULF OF MExICO ANd CARIBBEAN SEA
Enric Cortés1, Craig A. Brown2, and Lawrence R. Beerkircher2
1National Marine Fisheries Service, Panama City Laboratory, 3500 Delwood Beach Road, Panama City, Florida 32408 USA, E-mail [email protected] National Marine Fisheries Service, Southeast Fisheries Science Center, 75 Virginia Beach Drive, Miami, Florida 33149 USA
ABSTRACT Little information exists on the status of pelagic shark populations in the Atlantic Ocean, especially in the Gulf of Mexico and Caribbean Sea. We derived indices of relative abundance for pelagic sharks based on man-datory logbooks and observer reports from a scientific observer program of the United States (US) pelagic longline fleet. Time series data from the pelagic longline logbook program (1986–2005) and the pelagic longline observer program (1992–2005) were standardized with Generalized Linear Model (GLM) procedures. Declines in relative abundance for the 6 pelagic shark species or genera examined in the logbook data analysis ranged from 43% for mako sharks, Isurus spp., to 88% for blue sharks, Prionace glauca, whereas declines in relative abundance obtained from the observer data analysis were less accentuated than those in the logbook data analysis, with the trend being positive for night sharks, Carcharhinus signatus, and thresher sharks, Alopias spp. There was no significant change in the fork length at capture over the time period considered for blue sharks, shortfin makos Isurus oxyrinchus, or night sharks. The trends obtained must be viewed cautiously given recognized shortcomings, especially of the log-book dataset, and the highly migratory nature of pelagic sharks, which requires a more comprehensive evaluation of trends throughout their range.
RESUMEN Existe poca información sobre el estado de las poblaciones de tiburones pelágicos en el Océano Atlántico, especialmente en el Golfo de México y el Mar Caribe. Derivamos índices de abundancia relativa para tiburones pelágicos a partir de cuadernos de bitácora e informes de observadores de un programa de observadores científicos de la flota palangrera pelágica de los Estados Unidos (EE.UU.). Las series temporales del programa de cuadernos de bitácora de palangre pelágico (1986–2005) y del programa de observadores de palangre pelágico (1992–2005) se estandarizaron por medio de Modelos Lineales Generalizados (GLMs). Las reducciones en abun-dancia relativa de las seis especies o géneros de tiburones pelágicos que se examinaron variaron entre el 43% para Isurus spp. y el 88% para Prionace glauca, mientras que los descensos en abundancia relativa obtenidos del análisis de los datos de observadores fueron menos acentuados que los del análisis de los datos de los cuadernos de bitácora, con Carcharhinus signatus y Alopias spp. mostrando tendencias positivas. No se encontraron cambios significativos en la longitud furcal de las capturas durante el período analizado para P. glauca, Isurus oxyrinchus o C. signatus. Las tendencias obtenidas deben interpretarse con cautela debido a distintos problemas, en especial con los cuader-nos de bitácora, y el hecho de que los tiburones pelágicos son altamente migratorios, lo cual requiere una evaluación más exaustiva de las tendencias que abarque todo el rango de distribución de estas especies.
introduCtion
There is mounting concern about the status of pelagic shark populations worldwide. While it is widely recog-nized that many populations in the Atlantic Ocean have experienced substantial declines with respect to virgin (unexploited) levels, the extent of these declines has been the subject of intense debate (Baum et al. 2003, Baum and Myers 2004, Burgess et al. 2005a,b, Baum et al. 2005).
Pelagic sharks are often trans-oceanic species and are harvested or caught as bycatch by fishers from several nations. Although it has long been recognized that assess-ment of pelagic shark resources requires a multinational approach, the first assessment of 2 pelagic shark species (shortfin mako, Isurus oxyrinchus, and blue shark, Prionace glauca) in the Atlantic Ocean did not take place until 2004,
under the auspices of the International Commission for the Conservation of Atlantic Tunas (ICCAT). That assess-ment, which was considered very preliminary owing to the limitations of both the quantity and quality of information available, concluded that stock biomass of both North and South Atlantic blue sharks was likely above Maximum Sustainable Yield (MSY), whereas the North Atlantic stock of shortfin mako could be below biomass at MSY, with the magnitude of the decline for the shortfin mako stock in the South Atlantic estimated to be less than in the North Atlantic stock (ICCAT 2005).
Three species of pelagic sharks, the bigeye thresher, Alopias superciliosus, longfin mako, Isurus paucus, and the night shark, Carcharhinus signatus, have been pro-hibited to fisheries in Northwest Atlantic US waters since 2000 (NMFS 2003). In 1997, the night shark was also des-
Cortés et al.
38
ignated by the National Marine Fisheries Service (NMFS) as a candidate species under the Endangered Species Act (ESA). On a global scale, the World Conservation Union (IUCN) Red List of Threatened Species classified the blue shark, shortfin mako, oceanic whitetip shark, Carcharhinus longimanus, and porbeagle, Lamna nasus, as near threatened, the thresher shark, Alopias vulpinus, as data deficient (but the California population as near threatened), and the silky shark, Carcharhinus falciformis, of least concern (pending an update), whereas the bigeye thresher, longfin mako, and night shark were not yet listed (Fowler et al. 2005).
Given the general paucity of data on the status of pelagic shark populations, especially in the Gulf of Mexico (GOM) and Caribbean Sea (CAR), we developed or updat-ed time series of relative abundance for a variety of species based both on mandatory logbooks and observer reports from a scientific observer program of the US pelagic long-
line fleet. Additionally, we examined trends in length of the main species for possible signs of overexploitation.
matErials and mEthods
dataThe pelagic longline fishing grounds for the US fleet
extend from the Grand Banks (about 45°N) in the North Atlantic to 5–10°S, off the South American coast, includ-ing the CAR and the GOM. Eleven geographical areas of longline fishing are defined for classification (Figure 1): the CAR (area 1), GOM (area 2), Florida East coast (FEC, area 3), South Atlantic Bight (SAB, area 4), Mid-Atlantic Bight (MAB, area 5), New England coastal (NEC, area 6), Northeast distant waters (NED, or Grand Banks, area 7), Sargasso Sea (SAR, area 8), North Central Atlantic (NCA, area 9), Tuna North (TUN, area 10), and Tuna South (TUN, area 11).
Figure 1. Map of the western North Atlantic Ocean. Areas are as follows: 1) Caribbean Sea (CAR), 2) Gulf of Mexico (GOM), 3) Florida East coast (FEC), 4) South Atlantic Bight (SAB), 5) Mid-Atlantic Bight (MAB), 6) New England coastal (NEC), 7) Northeast distant waters (NEd or Grand Banks), 8) Sargasso Sea (SAR), 9) North Central Atlantic (NCA), 10) Tuna North (TUN), and 11) Tuna South (TUN).
Data from the US pelagic longline logbooks were available for 1986–2005, and sufficient information to develop time series (here forth referred to as logbook index) was available for blue, mako (the sum of shortfin and longfin makos), thresher (the sum of common and bigeye threshers), silky, oceanic whitetip, and night sharks. Initially, we attempted to include all areas in the analysis, but in some cases we had to restrict the dataset to certain areas owing to insufficient or unbalanced observations by year in the remaining areas. Thus, we only included areas 2, 3, 4, and 5 for silky and night sharks, and areas 1, 2, 3, 4, and 8 for oceanic whitetip sharks. We also developed time series (here forth referred to as restricted logbook index) for areas 1 and 2 only (GOM and CAR).
Data from the US pelagic longline observer program were available for 1992–2005, and information to develop time series (here forth referred to as observer index) was also available for blue, mako (the sum of shortfin, longfin, and unidentified makos), thresher (the sum of common, bigeye, and unidentified threshers), silky, oceanic whitetip, and night sharks. As for the logbook analyses, we initially attempted to include all areas, but had to restrict the data-set to certain areas in all cases. Thus, for mako sharks we included areas 2, 4, 5, 6, and 7 only, areas 2, 3, 4, and 5 for silky, night, and thresher sharks, areas 1, 2, 3, and 4 for oceanic whitetip sharks, and areas 5, 6, and 7 for blue sharks. No analyses were conducted using areas 1 and 2 only owing to small sample sizes.
Based on the methodology used in Brooks et al. (2005) and Cortés (2006), the following factors were considered in the analyses: year, area, quarter (January–March, April–June, July–September, October–December), gear (bottom longline or pelagic longline), presence or absence of light sticks, and whether or not the data were part of experimen-tal fishing (conducted in years 2000–2003 in the northeast distant area [7] only). Additionally, nominal catch rates (catch per thousand hooks) of swordfish, Xiphias gladius, and tuna (the sum of albacore, Thunnus alalunga, skipjack, Euthynnus pelamis, bigeye, Thunnus obesus, and yellow-fin, Thunnus albacares) were calculated for each set, and a categorical factor based on the quartile of those catch rates was assigned to each set (the factors are denoted as Sqr and Tqr, respectively). The reason for creating these factors, which correspond to the <25%, 25–49%, 50–75%, and >75% quantiles of the proportion, was to attempt to control for effects of pelagic shark catch rates associated with changes of fishing operations when the fleets switch between targeted species. We also considered the following interactions: year*area, year*quarter, year*gear, gear*area, as well as the interactions between area and the nominal catch rate quartiles for tuna and swordfish (area*Sqr and
area*Tqr). Note that for the observer analysis the gear factor was not considered because all the observations included in the dataset analyzed corresponded to pelagic longline. Nominal catch rates (not statistically standard-ized) were defined in all cases as catch per 1000 hooks.
To examine length trends, we used records of animals that were brought onboard and measured (fork length; in a straight line) by observers from the pelagic longline observer program. No estimated lengths, which are some-times recorded by the observers, were used. Sufficient observations, combining all areas, were only available for the blue, shortfin mako, and night sharks.
AnalysisRelative abundance indices were estimated using a
Generalized Linear Modeling (GLM) approach assuming a delta lognormal model distribution. A binomial error distribution was used for modeling the proportion of posi-tive sets with a logit function as link between the linear factor component and the binomial error. A lognormal error distribution was used for modeling the catch rates of successful sets, wherein estimated CPUE (catch per unit of effort) rates assume a lognormal distribution (lnCPUE) of a linear function of fixed factors. The models were fit-ted with the SAS GENMOD procedure (SAS Institute Inc. 1999) using a forward stepwise approach in which each potential factor was tested one at a time. Initially, a null model was run with no explanatory variables (factors). Factors were then entered one at a time and the results ranked from smallest to greatest reduction in deviance per degree of freedom when compared to the null model. The factor which resulted in the greatest reduction in deviance per degree of freedom was then incorporated into the model if 2 conditions were met: 1) the effect of the factor was significant at least at the 5% level based on the results of a Chi-Square statistic of a Type III likelihood ratio test, and 2) the deviance per degree of freedom was reduced by at least 1% with respect to the less complex model. Single factors were incorporated first, followed by fixed first-level interactions. The year factor was always included because it is required for developing a time series. Results were summarized in the form of deviance analysis tables includ-ing the deviance for proportion of positive observations and the deviance for the positive catch rates.
Once the final model was selected, it was run using the SAS GLIMMIX macro (which uses iteratively re-weighted likelihoods to fit generalized linear mixed models with the SAS MIXED procedure; Wolfinger and O’Connell 1993, Littell et al. 1996). In this model, any interactions that included the year factor were treated as a random effect. Goodness-of-fit criteria for the final model included
Cortés et al.
40
Akaike’s Information Criterion (AIC), Schwarz’s Bayesian Criterion, and – 2* the residual log likelihood (– 2Res L). The significance of each individual factor was tested with a Type III test of fixed effects, which examines the significance of an effect with all the other effects in the model (SAS Institute Inc. 1999). The final mixed model calculated relative indices as the product of the year effect least squares means (LSMeans) from the binomial and log-normal components. LSMeans estimates were weighted proportionally to observed margins in the input data, and
for the lognormal estimates, a back-transformed log bias correction was applied (Lo et al. 1992).
Logbook analysis results were compared to those from a recent analysis (Brooks et al. 2005) or from an ear-lier analysis (Cramer 2000) of the same source, those from the observer analysis, those from the restricted analysis of areas 1 and 2, and those from Baum et al. (2003), which also used the logbook dataset but only up to 2000. The restricted analysis for the GOM and CAR was also com-pared to Baum and Myers (2004), which compared sur-
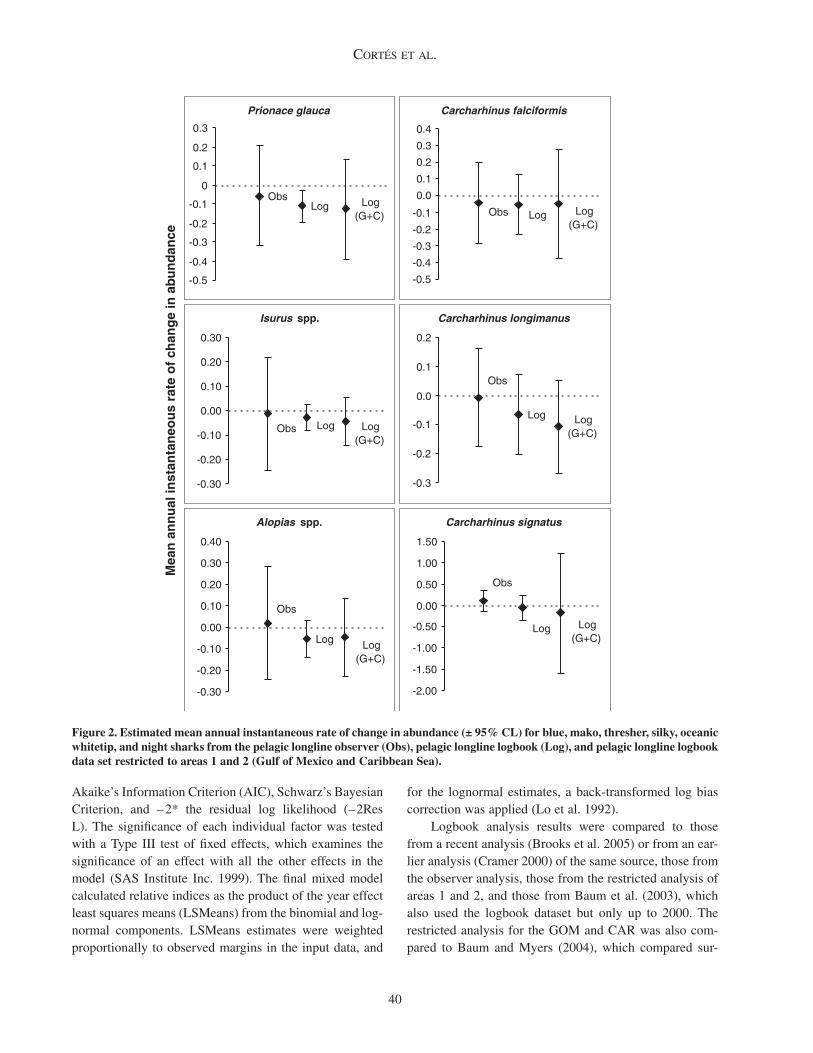
Figure 2. Estimated mean annual instantaneous rate of change in abundance (± 95% CL) for blue, mako, thresher, silky, oceanic whitetip, and night sharks from the pelagic longline observer (Obs), pelagic longline logbook (Log), and pelagic longline logbook data set restricted to areas 1 and 2 (Gulf of Mexico and Caribbean Sea).
Prionace glauca
ObsLog Log
(G+C)
-0.5
-0.4
-0.3
-0.2
-0.1
0
0.1
0.2
0.3
Carcharhinus falciformis
Log(G+C)
Obs Log
-0.5
-0.4
-0.3
-0.2
-0.1
0.0
0.1
0.2
0.3
0.4
Carcharhinus longimanus
Log Log(G+C)
Obs
-0.3
-0.2
-0.1
0.0
0.1
0.2
Alopias spp.
Log Log(G+C)
Obs
-0.30
-0.20
-0.10
0.00
0.10
0.20
0.30
0.40
Isurus spp.
Log(G+C)
LogObs
-0.30
-0.20
-0.10
0.00
0.10
0.20
0.30
Carcharhinus signatus
Log(G+C)
Log
Obs
-2.00
-1.50
-1.00
-0.50
0.00
0.50
1.00
1.50
Mea
n a
nn
ual
inst
anta
neo
us
rate
of
chan
ge
in a
bun
dan
ce
relative abundanCe of PelagiC sharks
41
veys conducted in the 1950s with pelagic longline observer data from the late 1990s in the GOM.
rEsults
Catch ratesSignificant factors. In the analysis of the logbook
data, factors retained for the proportion of positive sets always included year and area, and Sqr to a lesser extent, whereas for the positive catches, the factors quarter (or its interaction with year) and Sqr and Tqr (or their interac-tion with area) also were typically retained in addition to year and area (Table 1). For the observer data, factors retained for the proportion of positive sets also were year and area, with quarter and Sqr (or their interaction with year or area, respectively) also being generally retained,
and Tqr (or its interaction with area) to a lesser extent; for the positive catches, the factors year and area always were retained, and Sqr and Tqr (or their interaction with area), and quarter (or its interaction with year) also were gener-ally retained (Table 1).
Trends in relative abundanceBlue sharks. The logbook index shows very good
agreement with the index developed previously (Brooks et al. 2005) and an 88% decline since 1986 corresponding to a mean instantaneous rate of change in abundance per year (r) of – 0.113 (95% confidence interval [CI]: – 0.197 to – 0.028; Figure 2). This decline was largely driven by a 55% decline in the first 3 years of the series (1986–1988), with 1986 having the lowest number of positive observa-tions (sets with positive catches) in any year (n = 568;
TABLE 1
Factors retained in the models of proportion of positive sets and positive catch for US pelagic longline logbook and observer data by species or genus.
LOGBOOkSpecies or group Proportion positive Positive catchesPrionace glauca area Sqr year area year quarter year*area Tqr*area year*quarter
Isurus spp. area Sqr year Tqr year area Sqr quarter year*area Tqr*area Sqr*area
Alopias spp. year area area year Sqr Tqr year*area year*quarter Sqr*area
Carcharhinus falciformis area Sqr Tqr year year Tqr area quarter year*area Tqr*area Sqr*area
Carcharhinus longimanus area year year area Sqr Tqr Sqr*area year*area year*quarter
Carcharhinus signatus area Sqr year year*area year area Tqr year*area year*quarter year*quarter
OBSERVERSpecies or group Proportion positive Positive catchesPrionace glauca area year Sqr quarter area year quarter year*quarter year*area Tqr*area Sqr*area
Isurus spp. area year Sqr experiment year area Sqr quarter experiment Tqr year*quarter year*area year*area year*quarter Tqr*area
Alopias spp. year quarter area Tqr*area area Tqr Sqr year Sqr*area
Carcharhinus falciformis area Sqr year Tqr Tqr year Sqr area year*quarter year*area Tqr*area
Carcharhinus longimanus area quarter year year Sqr area quarter Tqr year*area Tqr*area Sqr*area
Carcharhinus signatus area Sqr year year*quarter year Tqr year*area Sqr*area year*quarter
Co
rt
és e
t al.
42
Figure 3. Nominal and standardized CPUE (in number) with 95% confidence intervals (dashed lines) for blue sharks from A) the pelagic longline logbook compared to a pre-vious study by Brooks et al. (2005), B) the pelagic longline observer program and C) the pelagic longline logbook restricted to areas 1 and 2 (Gulf of Mexico and Caribbean Sea). All indices are standardized to the mean of the overlapping years. The right panels show the proportion of positive sets and sample size by year.
0.0
1.0
2.0
3.0
4.0
5.0
1986
1987
1988
1989
1990
1991
1992
1993
1994
1995
1996
1997
1998
1999
2000
2001
2002
2003
2004
2005
Year
Logbook Brooks et al. 2005 nominal
0
0.2
0.4
0.6
0.8
1
1986
1988
1990
1992
1994
1996
1998
2000
2002
2004
0
1000
2000
3000
4000
5000
6000
Year
Proportion positive N
0.00.51.01.52.02.53.03.54.0
1986
1987
1988
1989
1990
1991
1992
1993
1994
1995
1996
1997
1998
1999
2000
2001
2002
2003
2004
2005
Year
Logbook OBServ nominalB
0
0.2
0.4
0.6
0.8
1
1992
1994
1996
1998
2000
2002
2004
Year
0
100
200
300
400
500
600
700Proportion positive N
0.0
1.0
2.0
3.0
4.0
5.0
6.0
1986
1987
1988
1989
1990
1991
1992
1993
1994
1995
1996
1997
1998
1999
2000
2001
2002
2003
2004
2005
Year
Logbook_std G+C all areas_std nominalC
0
0.04
0.08
0.12
0.16
0.2
1986
1988
1990
1992
1994
1996
1998
2000
2002
2004
Year
0
100
200
300
400
500
600
700Proportion positive N
A
Pro
po
rtio
n
Nu
mb
erN
um
ber
Nu
mb
er
Pro
po
rtio
nP
rop
ort
ion
Rel
ativ
e in
dex
Rel
ativ
e in
dex
Rel
ativ
e in
dex
relative abundanCe of PelagiC sharks
43
Figure 3A). From 1989 to 2005, the series slowly declined from a relative value of about 0.97 to 0.29. In contrast, the nominal series showed a flatter trend, with a relative decline of 50% from beginning to end. When removing 1986 from the standardized time series, the relative decline since 1987 was still 83%. Diagnostic plots showed good agreement with model assumptions and there were no sys-tematic patterns in the residuals.
The observer index shows a 52% decline since 1992 (r = – 0.057, 95% CI: – 0.320 to 0.206), but larger inter-annual variation than the logbook index, which shows a smoother trend for the overlapping years (Figure 3B). The nominal observer series showed a 43% decline. The restricted logbook index showed a similar trend to the logbook index for all areas, with the exception of a peak in 1992–1993, but collectively showed a similar decline since 1986 (91% vs 88%; r = – 0.128, 95% CI: – 0.394 to 0.138; Figure 3C).
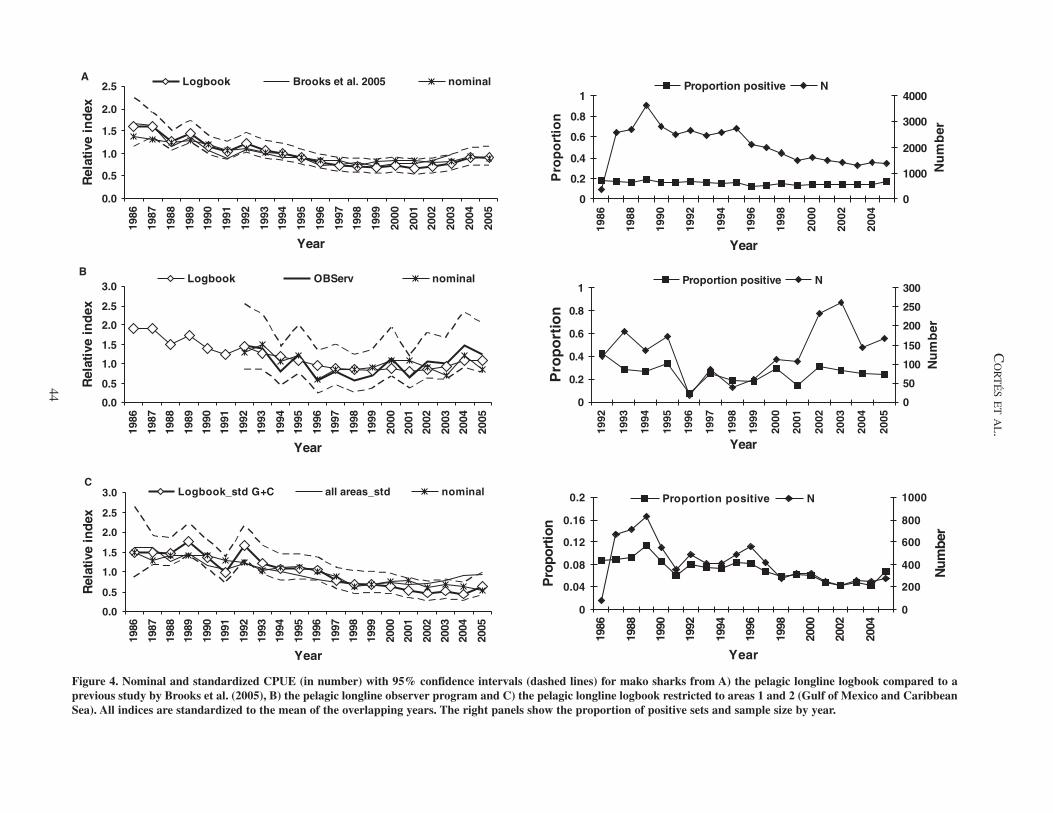
Mako sharks. The logbook index also shows very good agreement with the index developed previously (Brooks et al. 2005) and a 43% decline since 1986 (r = – 0.03, 95% CI: – 0.081 to + 0.022; Figure 2). This decline was largely driven by a 21% decline in the first 3 years of the series (1986–1988), followed by an increase in 1989, and a progressive decline from 1989 to 1999, after which the series progressively started increasing until 2005 (Figure 4A). As with the blue shark, 1986 had the lowest number of positive observations for any year (n = 354). The nominal series also had a concave, but somewhat flat-ter trend, with lower initial and final values and a relative decline of 36% from beginning to end. When removing 1986 from the standardized time series, the relative decline was essentially the same as when including 1986 (43%). Diagnostic plots showed good agreement with model assumptions and there were no systematic patterns in the residuals.
The observer index shows a 15% decline since 1992 (r = – 0.012, 95% CI: – 0.243 to 0.218), but larger inter-annual variation than the logbook index, which shows a smoother trend for the overlapping years (Figure 4B). The trends of both indices are similar, however. The nominal observer series showed a 34% decline. The restricted logbook index showed a trend relatively similar to the logbook index for all areas until 1999, but was reversed for 2000–2005. Collectively, it showed a larger decline since 1986 (57% vs 43%; r = – 0.045, 95% CI: – 0.142 to 0.053; Figure 4).
Thresher sharks. The logbook index trend is similar to that developed previously (Cramer 2000) and shows a 63% decline since 1986 (r = – 0.053, 95% CI: – 0.139 to + 0.033; Figure 2). With the exception of the first and
last year of data (1986 and 2005, respectively), the trend declined (Figure 5A). The number of positive observations for the latter part of the time series (2001–2005, n < 400), and especially for 1986 (n = 112), was lower than for the remaining years. The nominal series showed a less pro-nounced slope, with a relative decline of 46% from begin-ning to end. Diagnostic plots showed good agreement with model assumptions and there were no systematic patterns in the residuals.
The observer index shows a trend opposite to that of the logbook analysis, with a 28% increase since 1992 (r = 0.019, 95% CI: – 0.246 to 0.284); the index from the logbook analysis for the same period of coverage (1992–2005) shows a decrease of 50% (Figure 5B). The number of positive observations in the observer analysis, however, was much smaller (n = 14–84) than that in the logbook analysis (n = 112–1292). In contrast, the nominal observer series showed a 39% decline. The restricted logbook index showed a similar trend to the logbook index for all areas, with a 59% decrease since 1986 (r = – 0.047, 95% CI: – 0.228 to 0.133; Figure 5C). The trend, however, was less precise as a result of the lower sample size.
Silky sharks. The logbook index shows a similar, but smoother, decreasing trend as developed previously (Cramer 2000) and a 50% decline since 1992 (r = – 0.054, 95% CI: – 0.233 to 0.126; Figure 2). This decline was largely driven by a 61% decline in 1992–1998, followed by a generally increasing tendency from 1998 to the end of the time series (Figure 6A). In contrast to some of the cases examined above, the number of positive observa-tions for the period where the sharpest decline in catch rates occurred was actually the largest (n = 703–952). The nominal series also showed a generally declining trend, with a 38% decrease since 1992. Diagnostic plots showed good agreement with model assumptions and there were no systematic patterns in the residuals.
The observer index shows a similar decline since 1992 to that in the logbook data (46% vs 50%), but larger interannual variation (r=–0.047, 95% CI: –0.290 to 0.197; Figures 2B and 6). The nominal observer series showed a 40% decline from beginning to end. The restricted log-book index showed a similar trend to that of the logbook index for all areas, with an initial decrease from 1992 to 1998, followed by an increasing tendency from 1998 to 2005. The logbook index for all areas, however, was much smoother than the restricted index, which still showed a decline of the same magnitude since 1992 (48% vs 50%; r = – 0.051, 95% CI: – 0.377 to 0.275; Figure 6C).
Oceanic whitetip sharks. The logbook index shows a similar trend to that developed previously (Cramer 2000), except for a higher value in the first year of data (1992),
Co
rt
és e
t al.
44
Figure 4. Nominal and standardized CPUE (in number) with 95% confidence intervals (dashed lines) for mako sharks from A) the pelagic longline logbook compared to a previous study by Brooks et al. (2005), B) the pelagic longline observer program and C) the pelagic longline logbook restricted to areas 1 and 2 (Gulf of Mexico and Caribbean Sea). All indices are standardized to the mean of the overlapping years. The right panels show the proportion of positive sets and sample size by year.
0.0
0.5
1.0
1.5
2.0
2.5
1986
1987
1988
1989
1990
1991
1992
1993
1994
1995
1996
1997
1998
1999
2000
2001
2002
2003
2004
2005
Year
Rel
ativ
ein
dex
Logbook Brooks et al. 2005 nominalA
0.0
0.5
1.0
1.5
2.0
2.5
3.0
1986
1987
1988
1989
1990
1991
1992
1993
1994
1995
1996
1997
1998
1999
2000
2001
2002
2003
2004
2005
Year
Rel
ativ
ein
dex
Logbook OBServ nominalB
0
0.2
0.4
0.6
0.8
1
1986
1988
1990
1992
1994
1996
1998
2000
2002
2004
Year
Pro
po
rtio
n
0
1000
2000
3000
4000
Nu
mb
er
Proportion positive N
0
0.2
0.4
0.6
0.8
1
1992
1993
1994
1995
1996
1997
1998
1999
2000
2001
2002
2003
2004
2005
Year
Pro
po
rtio
n
0
50
100
150
200
250
300
Nu
mb
er
Proportion positive N
0.0
0.5
1.0
1.5
2.0
2.5
3.0
1986
1987
1988
1989
1990
1991
1992
1993
1994
1995
1996
1997
1998
1999
2000
2001
2002
2003
2004
2005
Year
Rel
ativ
ein
dex
Logbook_std G+C all areas_std nominalC
0
0.04
0.08
0.12
0.16
0.2
1986
1988
1990
1992
1994
1996
1998
2000
2002
2004
Year
Pro
port
ion
0
200
400
600
800
1000
Num
ber
Proportion positive N
re
la
tiv
e ab
un
da
nC
e of P
el
ag
iC sh
ar
ks
45
0.00.51.01.52.02.53.03.54.0
1986
1987
1988
1989
1990
1991
1992
1993
1994
1995
1996
1997
1998
1999
2000
2001
2002
2003
2004
2005
Year
Rel
ativ
e in
dex
Logbook Cramer_std nominalA
0
0.02
0.04
0.06
0.08
0.1
1986
1988
1990
1992
1994
1996
1998
2000
2002
2004
Year
Pro
po
rtio
n
0200400600800100012001400
Nu
mb
er
Proportion positive N
0.00.51.01.52.02.53.03.5
1986
1987
1988
1989
1990
1991
1992
1993
1994
1995
1996
1997
1998
1999
2000
2001
2002
2003
2004
2005
Year
Rel
ativ
e in
dex
Logbook OBServ nominalB
00.020.040.060.080.1
0.120.14
1992
1993
1994
1995
1996
1997
1998
1999
2000
2001
2002
2003
2004
2005
Year
Pro
po
rtio
n
0
20
40
60
80
100
Nu
mb
er
Proportion positive N
0.0
1.0
2.0
3.0
4.0
5.0
1986
1987
1988
1989
1990
1991
1992
1993
1994
1995
1996
1997
1998
1999
2000
2001
2002
2003
2004
2005
Year
Rel
ativ
e in
dex
Logbook_std G+C all areas_std nominalC
0
0.02
0.04
0.06
0.08
0.1
1986
1988
1990
1992
1994
1996
1998
2000
2002
2004
Year
Pro
po
rtio
n
0
100
200
300
400
500
600
Nu
mb
er
Proportion positive N
Figure 5. Nominal and standardized CPUE (in number) with 95% confidence intervals (dashed lines) for thresher sharks from A) the pelagic longline logbook compared to a previous study by Cramer (2000), B) the pelagic longline observer program and C) the pelagic longline logbook restricted to areas 1 and 2 (Gulf of Mexico and Caribbean Sea). All indices are standardized to the mean of the overlapping years. The right panels show the proportion of positive sets and sample size by year.
Co
rt
és e
t al.
46
Figure 6. Nominal and standardized CPUE (in number) with 95% confidence intervals (dashed lines) for silky sharks from A) the pelagic longline logbook compared to a pre-vious study by Cramer (2000), B) the pelagic longline observer program and C) the pelagic longline logbook restricted to areas 1 and 2 (Gulf of Mexico and Caribbean Sea). All indices are standardized to the mean of the overlapping years. The right panels show the proportion of positive sets and sample size by year.
0.0
0.5
1.0
1.5
2.0
2.5
3.0
1992
1993
1994
1995
1996
1997
1998
1999
2000
2001
2002
2003
2004
2005
Year
Rel
ativ
e in
dex
Logbook Cramer_std nominalA
0
0.02
0.04
0.06
0.08
0.1
1992
1993
1994
1995
1996
1997
1998
1999
2000
2001
2002
2003
2004
2005
Year
Pro
po
rtio
n
0
200
400
600
800
1000
Nu
mb
er
Proportion positive N
0.0
0.5
1.0
1.5
2.0
2.5
3.0
3.5
1992
1993
1994
1995
1996
1997
1998
1999
2000
2001
2002
2003
2004
2005
Year
Rel
ativ
e in
dex
Logbook OBServ nominalB
0
0.1
0.2
0.3
0.4
1992
1993
1994
1995
1996
1997
1998
1999
2000
2001
2002
2003
2004
2005
Year
Pro
po
rtio
n
0
50
100
150
200
Nu
mb
er
Proportion positive N
0.00.51.01.52.02.53.03.54.0
1992
1993
1994
1995
1996
1997
1998
1999
2000
2001
2002
2003
2004
2005
Year
Rel
ativ
e in
dex
logbook_std G+C all areas_std nominalC
0
0.02
0.04
0.06
0.08
0.1
1992
1993
1994
1995
1996
1997
1998
1999
2000
2001
2002
2003
2004
2005
Year
Pro
po
rtio
n
0
100
200
300
400
500
Nu
mb
er
Proportion positive N
re
la
tiv
e ab
un
da
nC
e of P
el
ag
iC sh
ar
ks
47
Figure 7. Nominal and standardized CPUE (in number) with 95% confidence intervals (dashed lines) for oceanic whitetip sharks from A) the pelagic longline logbook com-pared to a previous study by Cramer (2000), B) the pelagic longline observer program and C) the pelagic longline logbook restricted to areas 1 and 2 (Gulf of Mexico and Caribbean Sea). All indices are standardized to the mean of the overlapping years. The right panels show the proportion of positive sets and sample size by year.
0.0
0.5
1.0
1.5
2.0
2.5
3.019
92
1993
1994
1995
1996
1997
1998
1999
2000
2001
2002
2003
2004
2005
Year
Rel
ativ
e in
dex
Logbook Cramer_std nominal
A
0
0.02
0.04
0.06
0.08
0.1
1992
1993
1994
1995
1996
1997
1998
1999
2000
2001
2002
2003
2004
2005
Year
Pro
po
rtio
n
0100200300400500600700800
Nu
mb
er
Proportion positive N
0.0
0.5
1.0
1.5
2.0
2.5
3.0
1992
1993
1994
1995
1996
1997
1998
1999
2000
2001
2002
2003
2004
2005
Year
Rel
ativ
e in
dex
Logbook OBServ nominalB
0
0.1
0.2
0.3
0.4
1992
1993
1994
1995
1996
1997
1998
1999
2000
2001
2002
2003
2004
2005
Year
Pro
po
rtio
n
0
10
20
30
40
50
Nu
mb
er
Proportion positive N
0.00.51.01.52.02.53.03.54.0
1992
1993
1994
1995
1996
1997
1998
1999
2000
2001
2002
2003
2004
2005
Year
Rel
ativ
e in
dex
logbook_std G+C all areas_std nominalC
0
0.02
0.04
0.06
0.08
0.1
1992
1993
1994
1995
1996
1997
1998
1999
2000
2001
2002
2003
2004
2005
Year
Pro
po
rtio
n
0
100
200
300
400
500
Nu
mb
er
Proportion positive N
Co
rt
és e
t al.
48
Figure 8. Nominal and standardized CPUE (in number) with 95% confidence intervals (dashed lines) for night sharks from A) the pelagic longline logbook compared to a previous study by Cramer (2000), B) the pelagic longline observer program and C) the pelagic longline logbook restricted to areas 1 and 2 (Gulf of Mexico and Caribbean Sea). All indices are standardized to the mean of the overlapping years. The right panels show the proportion of positive sets and sample size by year.
0.0
1.0
2.0
3.0
4.0
5.0
6.0
7.0
1992
1993
1994
1995
1996
1997
1998
1999
2000
2001
2002
2003
2004
2005
Year
Rel
ativ
e in
dex
Logbook OBServ nominalB
0
0.2
0.4
0.6
0.8
1
1992
1993
1994
1995
1996
1997
1998
1999
2000
2001
2002
2003
2004
2005
Pro
po
rtio
n
0102030405060708090
Nu
mb
er
Proportion positive N
0
5
10
15
20
1992
1993
1994
1995
1996
1997
1998
1999
2000
2001
2002
2003
2004
2005
Year
Rel
ativ
e in
dex
Logbook_std G+C nominal all areas_stdC
0
0.004
0.008
0.012
0.016
0.02
1992
1993
1994
1995
1996
1997
1998
1999
2000
2001
2002
2003
2004
2005
Pro
po
rtio
n
0
10
20
30
40
50
60
70
80
Nu
mb
er
Proportion positive N
0
0.02
0.04
0.06
0.08
0.1
1992
1993
1994
1995
1996
1997
1998
1999
2000
2001
2002
2003
2004
2005
Year
Pro
po
rtio
n
050100150200250300350
Nu
mb
er
Proportion positive N
0.0
1.0
2.0
3.0
4.0
5.0
1992
1993
1994
1995
1996
1997
1998
1999
2000
2001
2002
2003
2004
2005
Year
Rel
ativ
e in
dex
Logbook nominal Cramer_stdA
Year
Year
relative abundanCe of PelagiC sharks
49
which results in a much steeper decline from 1992 to 1993 (Figure 7A). Overall, the series shows a 57% since 1992 (r = – 0.064, 95% CI: – 0.202 to 0.073; Figure 2). The decline was largely driven by a 37% decline from 1992 to 1993, and a subsequent decline of 53% from 1997 to 2000, after which the time series remained stable (2000–2005). The number of positive observations pro-gressively dropped after 1997. The nominal series also showed a generally declining trend, with a 59% decrease since 1992. Diagnostic plots showed good agreement with model assumptions and there were no systematic patterns in the residuals.
The observer index shows a less pronounced decline than the logbook series (9% vs 57%; r = – 0.007, 95% CI: – 0.176 to 0.162; Figure 7B), while the nominal observer series showed a 36% decline since 1992. The restricted logbook index matched fairly well the logbook index for all areas, but showed a larger decline (75% vs 57%; r = – 0.106, 95% CI: – 0.266 to 0.053; Figure 7C).
Night sharks. The logbook index differs substantially from that reported previously (Cramer 2000), showing a 50% decline since 1992 (r = – 0.054, 95% CI: – 0.354 to 0.246; Figure 2). Several sub-trends can be identified in the time series: an initial decrease from 1993 to 1997 (after an increase from 1992–1993), followed by a rather flat trend from 1997 to 2001 and a dip in 2002, and an increasing tendency towards the end of the time series (2002–2005), although the number of positive observations in 2002–2004 was lower than for the remaining years (Figure 8A). The nominal series showed a generally flatter trend, with a 29% decrease since 1992. Diagnostic plots showed good agreement with model assumptions and there were no sys-tematic patterns in the residuals.
The observer index shows a totally different trend to that of the logbook data for the overlapping years (1994–2005), increasing by 192% since 1994 (r = 0.097, 95% CI: – 0.153 to 0.348; Figure 8B). The nominal observer series showed a much flatter trend, with a 14% overall increase. The restricted logbook index showed a much more accen-tuated decline than the logbook index for all areas (90% vs 55%; r = – 0.179, 95% CI: – 1.588 to 1.230; Figure 8C), but it was largely driven by a very steep decline from 1992 to 1993 (1992 had the largest sample size of any year; n = 72). The restricted logbook index showed many fluctuations, and was based on low sample size, with no positive observations in 2001 and less than 10 positive observations in multiple years.
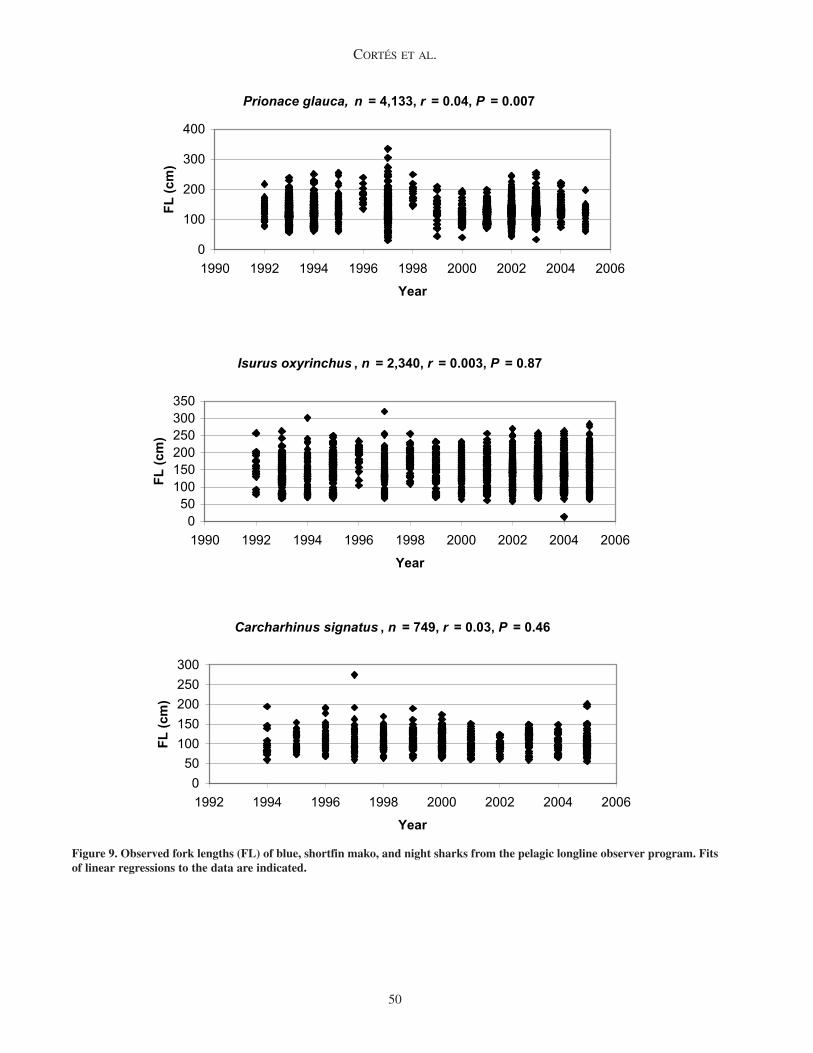
Trends in sizeThere was no clear trend in fork length over the
time period considered for any of the 3 species examined
(Figure 9). The correlation between fork length and year was very low in all cases (r ≤ 0.042) and the regression was not statistically significant, except for the blue shark, which showed a statistically significant negative slope (P = 0.007).
disCussion
Declines in relative abundance for the 6 pelagic shark species or genera examined in the logbook analysis ranged from 43% for mako sharks to 88% for blue sharks (Table 2). Despite smaller sample sizes leading to more uncertain trends and larger interannual variation in the logbook anal-ysis restricted to the Gulf and Caribbean region, declines agreed very well with those of the full logbook analysis for blue, thresher, and silky sharks, whereas the magni-tude of the difference in predicted declines progressively increased for mako, oceanic whitetip, and night sharks. With the exception of silky sharks, changes in relative abundance obtained from the observer analysis were very different from those in the logbook analysis. The trend using observer data was highly positive for night sharks, and thresher sharks to a lesser extent. As was the case for the restricted logbook analysis, sample sizes were lower, the corresponding trends more uncertain, and interannual fluctuation more accentuated in the observer analysis.
Some of the index values particularly in the restricted logbook analyses may not be reflective of true population abundance. A good example is the peak in 1992 and 1993 for blue sharks, which is not the result of low sample size, but could be due to increased local availability as a result of a larger portion of the stock moving through the area during those years. Since catch rates in the restricted log-book analysis are generally lower than in the full logbook analysis (about an order of magnitude for blue sharks), the addition of a few more blue sharks in 1992 and 1993 could explain the observed peaks.
While the full logbook analysis had much larger sample sizes than the observer analysis, which generally covers 3–5% of the total number of sets, and thus is better to estimate trends with more certainty, species identifica-tion and reporting is much better in the observer program than in the logbook program. From an identification per-spective, the most problematic species for observers would be the silky and night sharks, which can be confused with each other and the dusky shark, Carcharhinus obscurus. The increasing trend in night sharks estimated from the observer analysis could be related to progressively bet-ter observer skills in identifying night sharks, which only started to be recorded in 1994 (vs 1992 in the other 5 species), and increased emphasis placed by observer
Cortés et al.
50
Figure 9. Observed fork lengths (FL) of blue, shortfin mako, and night sharks from the pelagic longline observer program. Fits of linear regressions to the data are indicated.
Prionace glauca, n = 4,133, r = 0.04, P = 0.007
0
100
200
300
400
1990 1992 1994 1996 1998 2000 2002 2004 2006
Year
FL (c
m)
Isurus oxyrinchus , n = 2,340, r = 0.003, P = 0.87
050100150200250300350
1990 1992 1994 1996 1998 2000 2002 2004 2006
Year
FL (c
m)
Carcharhinus signatus , n = 749, r = 0.03, P = 0.46
050100150200250300
1992 1994 1996 1998 2000 2002 2004 2006
Year
FL (c
m)
relative abundanCe of PelagiC sharks
51
staff on the verification of identifications of carcharhinid sharks beginning around 1998. In general, sample sizes for oceanic whitetip, thresher, and night sharks in the observer analysis were substantially lower than those for the other 3 species or genera, and thus the trends estimated should be regarded with caution. Conversely, misreporting and species misidentification are likely to be much more prevalent in logbooks. Burgess et al. (2005a) reported that Vietnamese-American longline fishers may sometimes call shortfin makos, “blue sharks” and that any large, brown-colored shark is generally called a “tiger shark.” Burgess et al. (2005a) also stated that changes in reporting practices may have accounted in part for the declines in relative abundance of multiple shark species in the Northwest Atlantic Ocean reported by Baum et al. (2003). Before implementation of the first US Atlantic Shark Management Plan in 1993 (NMFS 1993), all fishers targeting sharks, swordfish or tunas reported shark landings in the pelagic longline logbook from which data were used in Baum et al. (2003) and the present analysis. However, after implementation of the management plan, fishers could temporarily report to a new logbook program designed for fishers targeting sharks from 1993 to 1995. After 1995, fishers again had the option to continue reporting to the pelagic longline program or to a coastal fisheries logbook program that also includes longline gear. Another potential change in reporting practices is a tendency to under-report bycatch over time as fishers develop a growing perception that those reports result in increasingly restrictive manage-ment regimes. These various changes in logbooks and
potentially in reporting practices may have affected both Baum et al.’s (2003) and our analyses.
Additional factors that may have affected the analyses are changes in both hook size and type, not reported in the logbooks, and fishing depth related to the tuna species tar-geted. While we accounted for fishers switching between swordfish and tunas as target species, we did not account for the different depths at which gear is set when they tar-get bigeye vs yellowfin tuna for example.
Comparison of the relative declines reported by Baum et al. (2003) and the present study revealed good agree-ment between the 2 studies (Table 2) as one would expect from analyzing the same dataset covering similar periods. This is true even though the statistical procedures (i.e., GLM) and factors considered differed between studies. We also found relative declines in our analysis of the log-book dataset restricted to the Gulf and Caribbean region, although not as accentuated as those reported by Baum and Myers (2004) for the silky and oceanic whitetip sharks in the GOM exclusively. Our analysis and that of Baum and Myers’ (2004), however, had little temporal overlap (Table 2).
In all, there is little doubt that populations of pelagic and other large-bodied shark species have decreased with respect to unexploited levels in the western North Atlantic Ocean and likely in other bodies of water. While the logbook dataset is the largest available for the western North Atlantic Ocean and the observer dataset is generally more reliable, the numerous caveats identified above and elsewhere by other authors dictate caution in interpreting
TABLE 2
Percent change in relative abundance (from beginning to end of the time series considered) for six shark species or genera reported in the present and two other studies. Logbook G+C is the logbook analysis restricted to the Gulf and Caribbean areas. Baum et al. (2003) used the logbook dataset (as in the present study); Baum and Myers (2004) compared surveys from the 1950s to observer data for 1995-1999. Periods covered are as follows: logbook (1986 –2005), observer (1992–2005), logbook G+C (1986–2005), Baum et al. (2003) (1986–2000). 1Numbers in parentheses refer to the decline in relative abundance during the same period covered by the observer dataset; 2denotes that logbook data start in 1992, not 1986; 3denotes that observer data start in 1994, not 1992.
results. However, there is still some cause for optimism based on the recent trends obtained from both these datas-ets. Relative abundance of mako, thresher, silky, and night sharks in the western North Atlantic Ocean appears to have stabilized or even be increasing in some cases since the late 1990s, and relative abundance of oceanic whitetip sharks is also stable or increasing since 2000. Similarly, based on the logbook dataset, relative abundance of mako, thresher, night and oceanic whitetip sharks in the GOM and CAR seems to have stabilized since the late 1990s, and relative abundance of silky sharks to be increasing in the area since 2000.
Given the highly migratory nature of many of these pelagic species, catch rates derived from other parts of the Atlantic Ocean should also be examined, and in particular catch rates derived from long-term fishery-independent surveys should be carefully analyzed and continued to be monitored. Ultimately, conclusions about the status of pelagic shark stocks should not be based exclusively on the time series examined herein, but on a more comprehensive examination of trends throughout the range of these spe-cies and ideally in combination with information derived from stock assessments.
aCknowlEdgmEnts
We thank J. Carlson for comments on an earlier ver-sion of the manuscript and 2 anonymous referees for con-structive criticism and helpful comments.
litEraturE CitEd
Baum, J.K. and R.A. Myers. 2004. Shifting baselines and the decline of pelagic sharks in the Gulf of Mexico. Ecology Letters 7:135–145.
Baum, J.K., R.A. Myers, D.G. Kehler, B. Worm, S.J. Harley, and P.A. Doherty. 2003. Collapse and conservation of shark pop-ulations in the Northwest Atlantic. Science 299:389–392.
Baum, J.K., D. Kehler, and R.A. Myers. 2005. Robust estimates of decline for pelagic shark populations in the Northwest Atlantic and Gulf of Mexico. Fisheries 30(10):27–29.
Brooks, E.N., M. Ortiz, L.R. Beerkircher, and Y. Apostolaki. 2005. Standardized catch rates for blue shark and shortfin mako shark from the U.S. pelagic logbook and U.S. pelagic observer program, and U.S. weighout data. Collective Volume of Scientific Papers ICCAT 58:1054–1072.
Burgess, G.H., L.R. Beerkircher, G.M. Cailliet, J.K. Carlson, E. Cortés, K.J. Goldman, R.D. Grubbs, J.A. Musick, M.K. Musyl, and C.A. Simpfendorfer. 2005a. Is the collapse of shark populations in the Northwest Atlantic and Gulf of Mexico real? Fisheries 30(10):19–26.
Burgess, G.H., L.R. Beerkircher, G.M. Cailliet, J.K. Carlson, E. Cortés, K.J. Goldman, R.D. Grubbs, J.A. Musick, M.K. Musyl, and C.A. Simpfendorfer. 2005b. Reply to “Robust estimates of decline for pelagic shark populations in the Northwest Atlantic and Gulf of Mexico.” Fisheries 30(10):30–31.
Cortés, J. 2006. Standardized catch rates for blue shark and shortfin mako from the US pelagic longline logbook program. Collective Volume of Scientific Papers ICCAT, SCRS/2006/148.
Cramer, J. 2000. Large pelagic logbook catch rates for sharks. Collective Volume of Scientific Papers ICCAT, SCRS/99/47.
International Commission for the Conservation of Atlantic Tuna (ICCAT). 2005. Report of the 2004 Inter-sessional meeting of the ICCAT sub-committee on by-catches: shark stock assessment. Collective Volume of Scientific Papers ICCAT 58:799–890.
Fowler, S.L., R.D. Cavanagh, M. Camhi, G.H. Cailliet, S.V. Fordham, C.A. Simpfendorfer, and J.A. Musick, eds. 2005. Sharks, Rays and Chimaeras: the Status of the Chondrichthyan Fishes. Status Survey. IUCN SSC Shark Specialist Group. IUCN, Gland, Switzerland and Cambridge, UK, 462 p.
Littell, R.C., G.A. Milliken, W.W. Stroup, and R.D Wolfinger. 1996. SAS System for Mixed Models. Cary, NC, USA, 633 p.
Lo, N.C., L.D. Jacobson, and J.L. Squire. 1992. Indices of rela-tive abundance from fish spotter data based on delta-lognor-mal models. Canadian Journal of Fisheries and Aquatic Sciences 49:2515–2526.
National Marine Fisheries Service (NMFS). 1993. Fishery Management Plan for Sharks of the Atlantic Ocean. NOAA, NMFS, Highly Migratory Species Management Division, 1315 East-West Highway, Silver Spring, MD, USA, 167 p.
National Marine Fisheries Service (NMFS). 2003. Final Amendment 1 to the Fishery Management Plan for Atlantic Tunas, Swordfish and Sharks. NOAA, NMFS, Highly Migratory Species Management Division, 1315 East-West Highway, Silver Spring, MD, USA.
SAS Institute, Inc. 1999. SAS/STAT User’s Guide, Version 8. Cary, NC, USA, 1243 p.
Wolfinger, R. and M. O’Connell. 1993. Generalized linear mixed models: a pseudo-likelihood approach. Journal of Statistical Computation and Simulation 48:233–243.


![taller tiburones Campeche marzo2011 [Modo de compatibilidad] · Campeche, Campeche, 22 de marzo del 2011. ... Objetivos específicos (Pesqueros) ... abastecimiento de pescado fresco](https://static.documents.pub/doc/80x56/5c62340609d3f2344a8b4854/taller-tiburones-campeche-marzo2011-modo-de-compatibilidad-campeche-campeche.jpg)


