34
Performance Baselines and Recommendations January 22, 2019 | Version 9.4
Performance Baselines andRecommendationsJanuary 22, 2019 | Version 9.4

For the most recent version of this document, visit our documentation website.
Performance Baselines and Recommendations 3
Table of Contents1 Performance baselines and recommendations 5
2 Structured Analytics 6
2.1 Structured Analytics results 6
2.2 Structured Analytics settings 6
2.3 Performance recommendations 7
3 Analytics 8
3.1 Analytics index build results 8
3.2 Analytics clustering results 8
3.3 Analytics categorization results 8
4 Import 10
4.1 Native/Full Text import setup 10
4.2 Native/Full Text import results 10
4.3 Import fields 10
5 Export 12
5.1 Export results summary 12
5.2 Export fields 12
6 Productions and branding 14
6.1 Staging production results 14
6.2 Branding production results 14
6.3 Production import results 14
6.4 Production export results 14
6.5 Staging and Branding settings 15
6.6 Production import settings 15
6.7 Production export settings 15
6.8 Performance recommendations 16
7 Imaging 17
7.1 Imaging results 17
7.2 Imaging settings 17
7.3 Performance recommendations 17

Performance Baselines and Recommendations 4
8 Mass Save as PDF 18
8.1 Mass Save as PDF settings and results 18
8.2 Performance recommendations 18
9 Mass conversion 19
9.1 Mass conversion (service bus) 19
9.2 Conclusion 19
10 Processing 20
10.1 Processing profile and data source specifications 20
10.2 Discover + Publish performance baselines 21
10.2.1 Real World data set details 21
10.3 Discover + Publish performance baselines - Data Grid 22
10.3.1 Real world data set details - Data Grid 22
10.4 Inventory performance baselines 23
10.4.1 Inventory settings 23
10.5 Performance recommendations 24
11 OCR 25
11.1 Results summary 25
12 Document review 26
12.1 Document review (service bus) 26
13 Data set details 28
14 Environment details 29
15 Processing environment details 32
Performance Baselines and Recommendations 5
1 Performance baselines and recommendations
Note: Published performance metrics for Relativity 9.4 are added as they become available and areconsidered final.
This documentation provides an overview of performance metrics and pertinent recommendations forRelativity 9.4. For features capable of utilizing either SQL or Data Grid, performance testing was done onboth systems and noted accordingly.
See these related pages:
Unless otherwise noted, the following all hold true for Relativity 9.4 Performance Metrics:
n All results are based on the EDRM Enron V2 data set. For more information about the data setdetails, see Data set details on page 28. For more information about the environment configurationfor this test, see Environment details on page 29.
Note: As of Relativity 9.3, the processor model on the performance Virtual Machines waschanged from 4 x Intel E5-4627 v2 3.3Ghz 8C Processors to 4 x Intel E5-4620 v2 3.3Ghz 8CProcessors. Note that performance in 9.4 may be affected by this processor model update.
n All tests were each performed individually on the environment, without any additional tests occur-ring simultaneously.
n Memory on all relevant machines was cleared immediately prior to running the tests in order to elim-inate any plausible effects of data caching.
n All performance results have a 5%variance.
For any questions, or to receive a copy of the data sets used in this performance test, please [email protected].
Performance Baselines and Recommendations 6
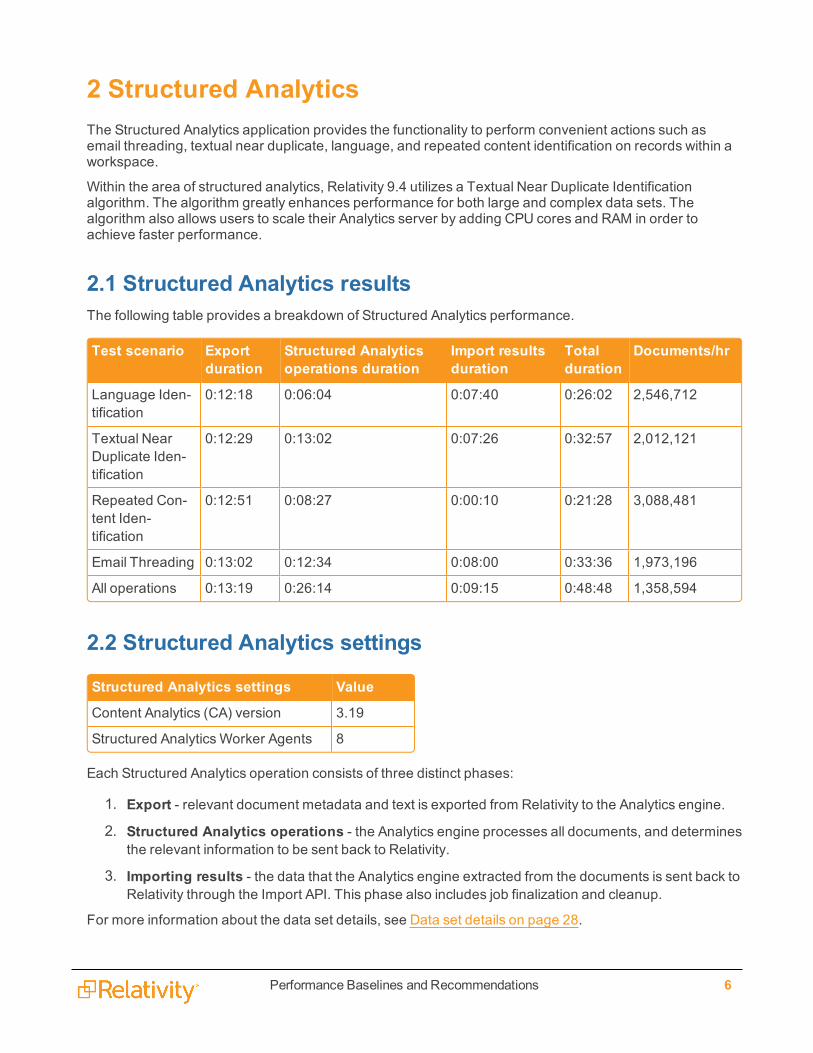
2 Structured AnalyticsThe Structured Analytics application provides the functionality to perform convenient actions such asemail threading, textual near duplicate, language, and repeated content identification on records within aworkspace.
Within the area of structured analytics, Relativity 9.4 utilizes a Textual Near Duplicate Identificationalgorithm. The algorithm greatly enhances performance for both large and complex data sets. Thealgorithm also allows users to scale their Analytics server by adding CPU cores and RAM in order toachieve faster performance.
2.1 Structured Analytics resultsThe following table provides a breakdown of Structured Analytics performance.
Test scenario Exportduration
Structured Analyticsoperations duration
Import resultsduration
Totalduration
Documents/hr
Language Iden-tification
0:12:18 0:06:04 0:07:40 0:26:02 2,546,712
Textual NearDuplicate Iden-tification
0:12:29 0:13:02 0:07:26 0:32:57 2,012,121
Repeated Con-tent Iden-tification
0:12:51 0:08:27 0:00:10 0:21:28 3,088,481
Email Threading 0:13:02 0:12:34 0:08:00 0:33:36 1,973,196
All operations 0:13:19 0:26:14 0:09:15 0:48:48 1,358,594
2.2 Structured Analytics settings
Structured Analytics settings Value
Content Analytics (CA) version 3.19
Structured Analytics Worker Agents 8
Each Structured Analytics operation consists of three distinct phases:
1. Export - relevant document metadata and text is exported from Relativity to the Analytics engine.
2. Structured Analytics operations - the Analytics engine processes all documents, and determinesthe relevant information to be sent back to Relativity.
3. Importing results - the data that the Analytics engine extracted from the documents is sent back toRelativity through the Import API. This phase also includes job finalization and cleanup.
For more information about the data set details, see Data set details on page 28.

Performance Baselines and Recommendations 7
For more information about the environment configuration for this test, see Environment details onpage 29.
2.3 Performance recommendationsThe latest version of Content Analyst (CA 3.19), which this test runs upon, allows for adding CPU power toyour Analytics server. Adding CPU power may result in performance improvements with larger data sets.Contact [email protected] for more detailed recommendations on scaling the analytics servereffectively.
Performance Baselines and Recommendations 8
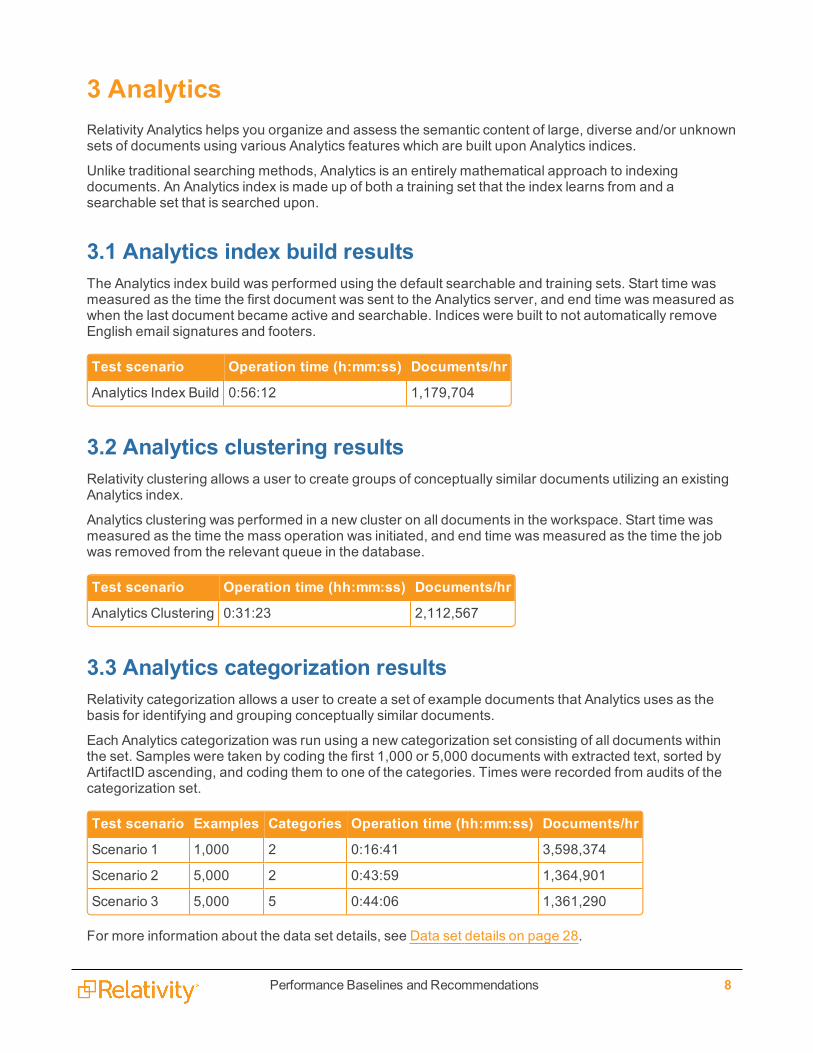
3 AnalyticsRelativity Analytics helps you organize and assess the semantic content of large, diverse and/or unknownsets of documents using various Analytics features which are built upon Analytics indices.
Unlike traditional searching methods, Analytics is an entirely mathematical approach to indexingdocuments. An Analytics index is made up of both a training set that the index learns from and asearchable set that is searched upon.
3.1 Analytics index build resultsThe Analytics index build was performed using the default searchable and training sets. Start time wasmeasured as the time the first document was sent to the Analytics server, and end time was measured aswhen the last document became active and searchable. Indices were built to not automatically removeEnglish email signatures and footers.
Test scenario Operation time (h:mm:ss) Documents/hr
Analytics Index Build 0:56:12 1,179,704
3.2 Analytics clustering resultsRelativity clustering allows a user to create groups of conceptually similar documents utilizing an existingAnalytics index.
Analytics clustering was performed in a new cluster on all documents in the workspace. Start time wasmeasured as the time the mass operation was initiated, and end time was measured as the time the jobwas removed from the relevant queue in the database.
Test scenario Operation time (hh:mm:ss) Documents/hr
Analytics Clustering 0:31:23 2,112,567
3.3 Analytics categorization resultsRelativity categorization allows a user to create a set of example documents that Analytics uses as thebasis for identifying and grouping conceptually similar documents.
Each Analytics categorization was run using a new categorization set consisting of all documents withinthe set. Samples were taken by coding the first 1,000 or 5,000 documents with extracted text, sorted byArtifactID ascending, and coding them to one of the categories. Times were recorded from audits of thecategorization set.
Test scenario Examples Categories Operation time (hh:mm:ss) Documents/hr
Scenario 1 1,000 2 0:16:41 3,598,374
Scenario 2 5,000 2 0:43:59 1,364,901
Scenario 3 5,000 5 0:44:06 1,361,290
For more information about the data set details, see Data set details on page 28.
Performance Baselines and Recommendations 9
For more information about the environment configuration for this test, see Environment details onpage 29.
Performance Baselines and Recommendations 10
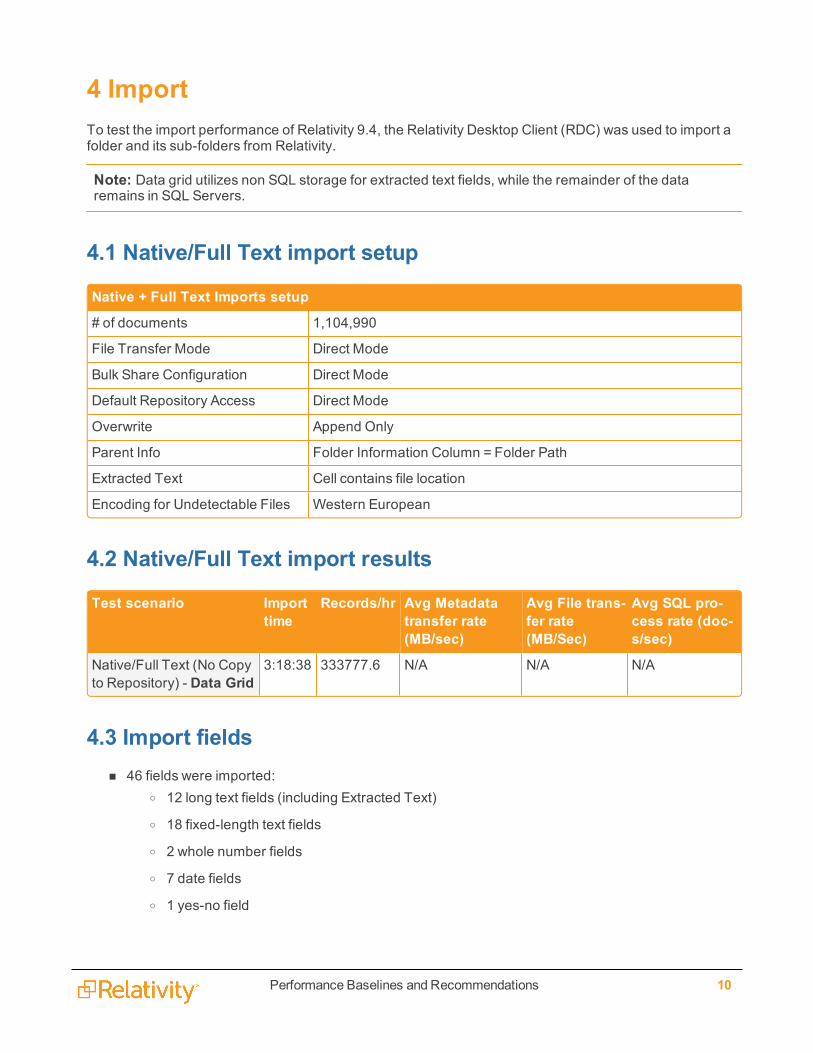
4 ImportTo test the import performance of Relativity 9.4, the Relativity Desktop Client (RDC) was used to import afolder and its sub-folders from Relativity.
Note: Data grid utilizes non SQL storage for extracted text fields, while the remainder of the dataremains in SQL Servers.
4.1 Native/Full Text import setup
Native + Full Text Imports setup
# of documents 1,104,990
File Transfer Mode Direct Mode
Bulk Share Configuration Direct Mode
Default Repository Access Direct Mode
Overwrite Append Only
Parent Info Folder Information Column = Folder Path
Extracted Text Cell contains file location
Encoding for Undetectable Files Western European
4.2 Native/Full Text import results
Test scenario Importtime
Records/hr Avg Metadatatransfer rate(MB/sec)
Avg File trans-fer rate(MB/Sec)
Avg SQL pro-cess rate (doc-s/sec)
Native/Full Text (No Copyto Repository) - Data Grid
3:18:38 333777.6 N/A N/A N/A
4.3 Import fieldsn 46 fields were imported:
o 12 long text fields (including Extracted Text)
o 18 fixed-length text fields
o 2 whole number fields
o 7 date fields
o 1 yes-no field
Performance Baselines and Recommendations 11
o 2 single-choice fields
o 2 decimal fields
o 1 multi-choice field
o 1 single-object field

Performance Baselines and Recommendations 12
5 ExportTo test the export Performance of Relativity 9.4, the Relativity Desktop Client (RDC) was used to export afolder and its sub-folders from Relativity.
All exports were completed in direct mode, copying files directly from the repository. Export was the onlyaction executing on the machine. Images were exported as single-page tiffs. Of the 1,104,990 documentstested, 100,000 had images. Extracted Text was exported into separate files. All metrics are calculatedusing the total number of documents. The average file size of all documents exported was 0.11 MB.
5.1 Export results summary
Export setup
# of documents 1,104,990
File Transfer Mode Direct Mode
# of images 290,148
# of documents with images 99,689
Default Repository Access Direct Mode
Text Precedence Extracted text
Text File Encoding Western European
The following tables provide a breakdown of export performance:
Test scen-ario
Records/hr MB/hr .dat size(MB)
Avg FileTransferRate(MB/sec)
Metadatatransfer rate(MB/sec)
Export time(hh:mm:ss)
File size,natives +images(MB)
Natives + FullText
526,185 65,071 1,050 29.48 6.48 2:06:40 136,561
5.2 Export fieldsn Natives +metadata
o 46 fields were exported:l 11 long text fields (including Extracted Text)
l 18 fixed-length text fields
l 2 whole number fields
l 7 date fields
Performance Baselines and Recommendations 13
l 1 yes-no field
l 2 single-choice fields
l 2 decimal fields
l 1 multi-choice field
l 1 single-object field
Performance Baselines and Recommendations 14
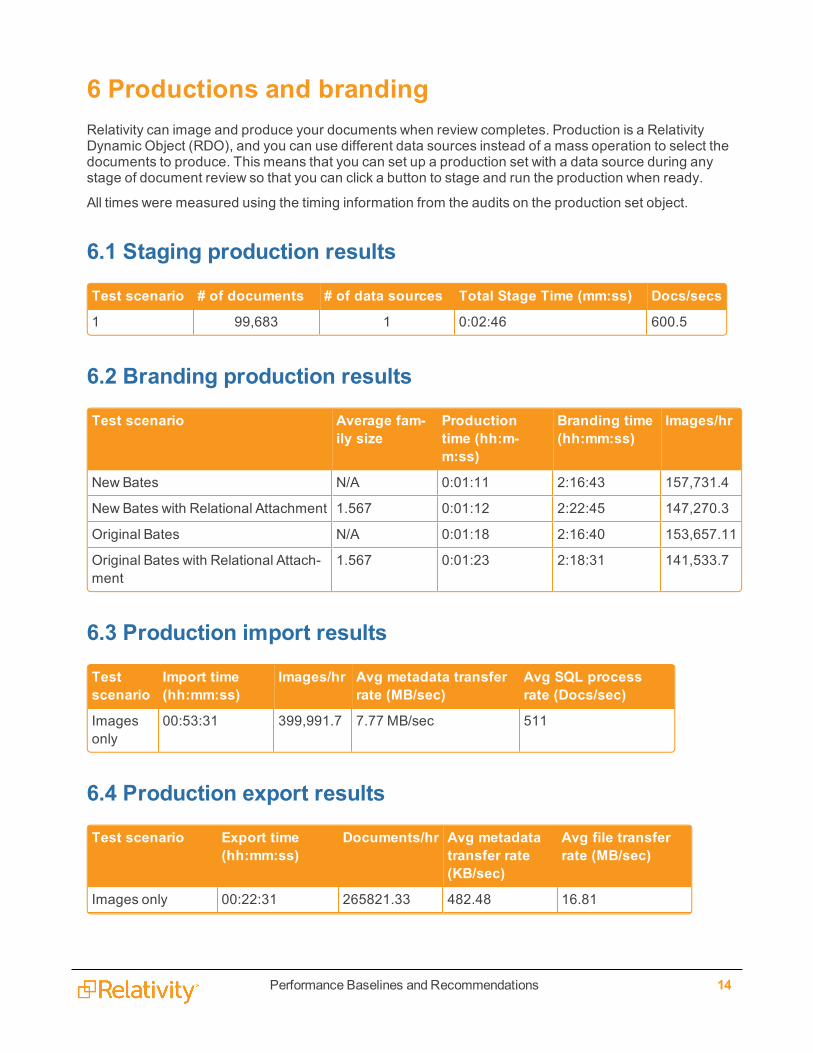
6 Productions and brandingRelativity can image and produce your documents when review completes. Production is a RelativityDynamic Object (RDO), and you can use different data sources instead of a mass operation to select thedocuments to produce. This means that you can set up a production set with a data source during anystage of document review so that you can click a button to stage and run the production when ready.
All times were measured using the timing information from the audits on the production set object.
6.1 Staging production results
Test scenario # of documents # of data sources Total Stage Time (mm:ss) Docs/secs
1 99,683 1 0:02:46 600.5
6.2 Branding production results
Test scenario Average fam-ily size
Productiontime (hh:m-m:ss)
Branding time(hh:mm:ss)
Images/hr
New Bates N/A 0:01:11 2:16:43 157,731.4
New Bates with Relational Attachment 1.567 0:01:12 2:22:45 147,270.3
Original Bates N/A 0:01:18 2:16:40 153,657.11
Original Bates with Relational Attach-ment
1.567 0:01:23 2:18:31 141,533.7
6.3 Production import results
Testscenario
Import time(hh:mm:ss)
Images/hr Avg metadata transferrate (MB/sec)
Avg SQL processrate (Docs/sec)
Imagesonly
00:53:31 399,991.7 7.77 MB/sec 511
6.4 Production export results
Test scenario Export time(hh:mm:ss)
Documents/hr Avg metadatatransfer rate(KB/sec)
Avg file transferrate (MB/sec)
Images only 00:22:31 265821.33 482.48 16.81
Performance Baselines and Recommendations 15
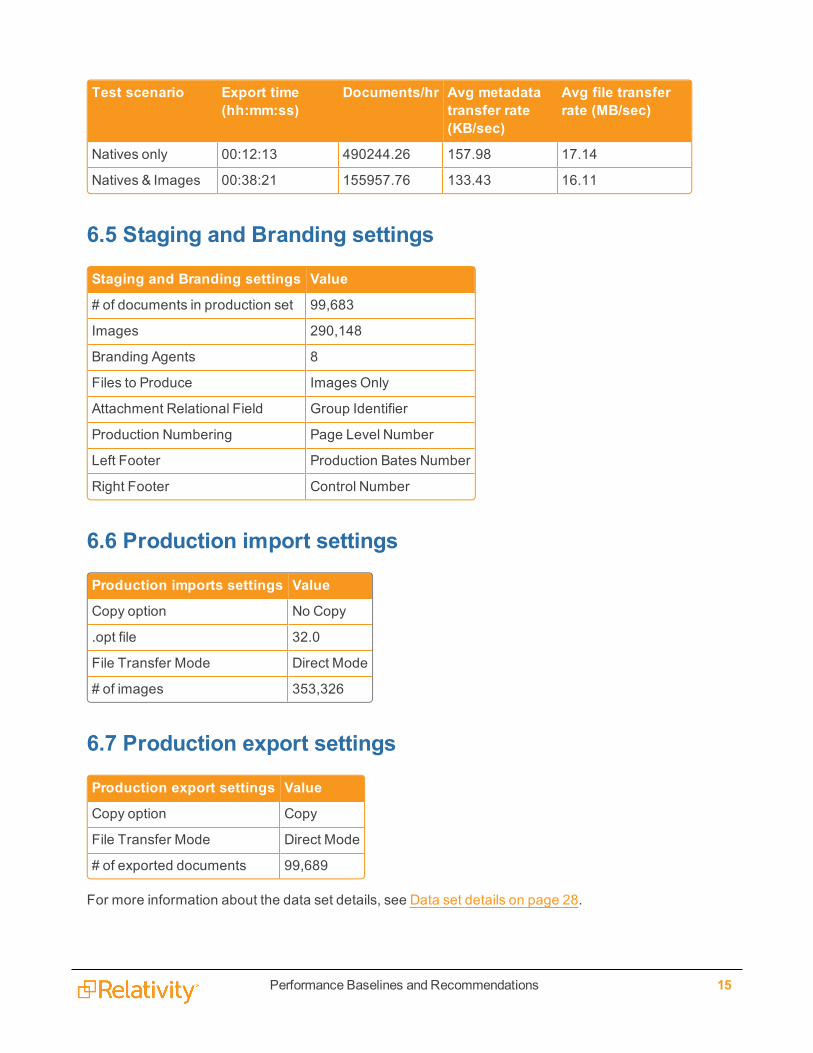
Test scenario Export time(hh:mm:ss)
Documents/hr Avg metadatatransfer rate(KB/sec)
Avg file transferrate (MB/sec)
Natives only 00:12:13 490244.26 157.98 17.14
Natives & Images 00:38:21 155957.76 133.43 16.11
6.5 Staging and Branding settings
Staging and Branding settings Value
# of documents in production set 99,683
Images 290,148
Branding Agents 8
Files to Produce Images Only
Attachment Relational Field Group Identifier
Production Numbering Page Level Number
Left Footer Production Bates Number
Right Footer Control Number
6.6 Production import settings
Production imports settings Value
Copy option No Copy
.opt file 32.0
File Transfer Mode Direct Mode
# of images 353,326
6.7 Production export settings
Production export settings Value
Copy option Copy
File Transfer Mode Direct Mode
# of exported documents 99,689
For more information about the data set details, see Data set details on page 28.

Performance Baselines and Recommendations 16
For more information about the environment configuration for this test, see Environment details onpage 29.
6.8 Performance recommendationsBecause productions rely on saved searches, when constructing the searches used as processing datasources, follow best practices for searching in Relativity.
Performance Baselines and Recommendations 17
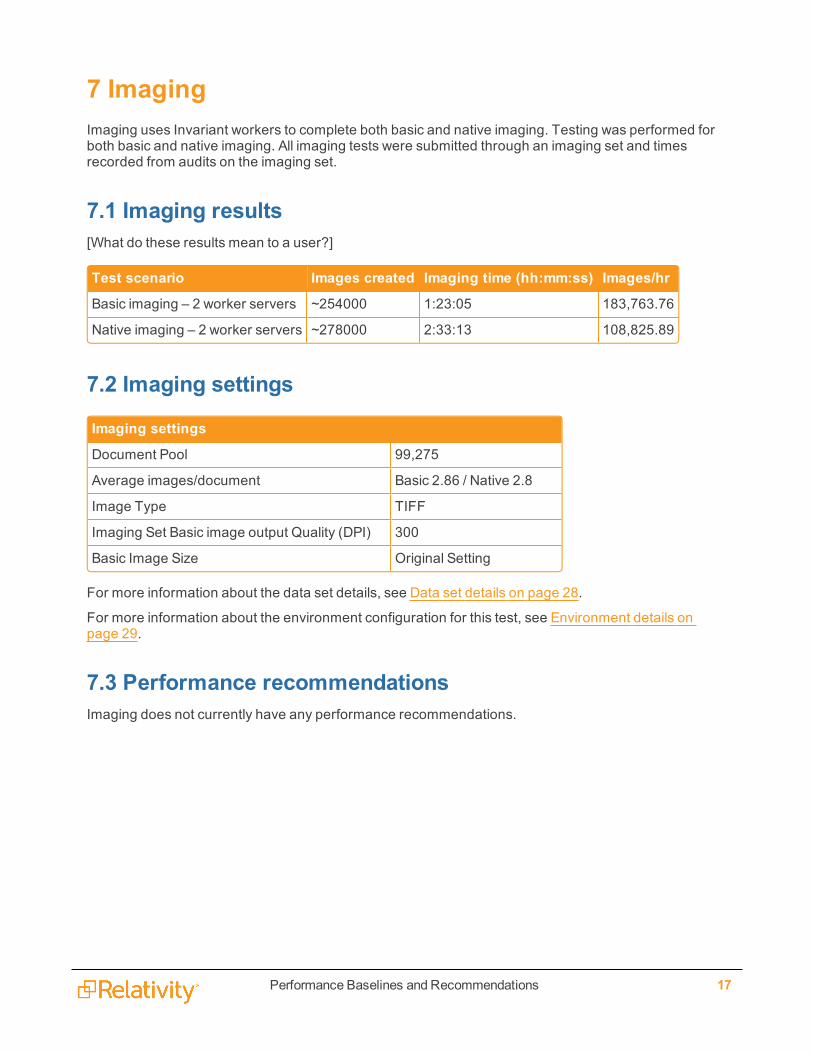
7 ImagingImaging uses Invariant workers to complete both basic and native imaging. Testing was performed forboth basic and native imaging. All imaging tests were submitted through an imaging set and timesrecorded from audits on the imaging set.
7.1 Imaging results[What do these results mean to a user?]
Test scenario Images created Imaging time (hh:mm:ss) Images/hr
Basic imaging – 2 worker servers ~254000 1:23:05 183,763.76
Native imaging – 2 worker servers ~278000 2:33:13 108,825.89
7.2 Imaging settings
Imaging settings
Document Pool 99,275
Average images/document Basic 2.86 / Native 2.8
Image Type TIFF
Imaging Set Basic image output Quality (DPI) 300
Basic Image Size Original Setting
For more information about the data set details, see Data set details on page 28.
For more information about the environment configuration for this test, see Environment details onpage 29.
7.3 Performance recommendationsImaging does not currently have any performance recommendations.
Performance Baselines and Recommendations 18
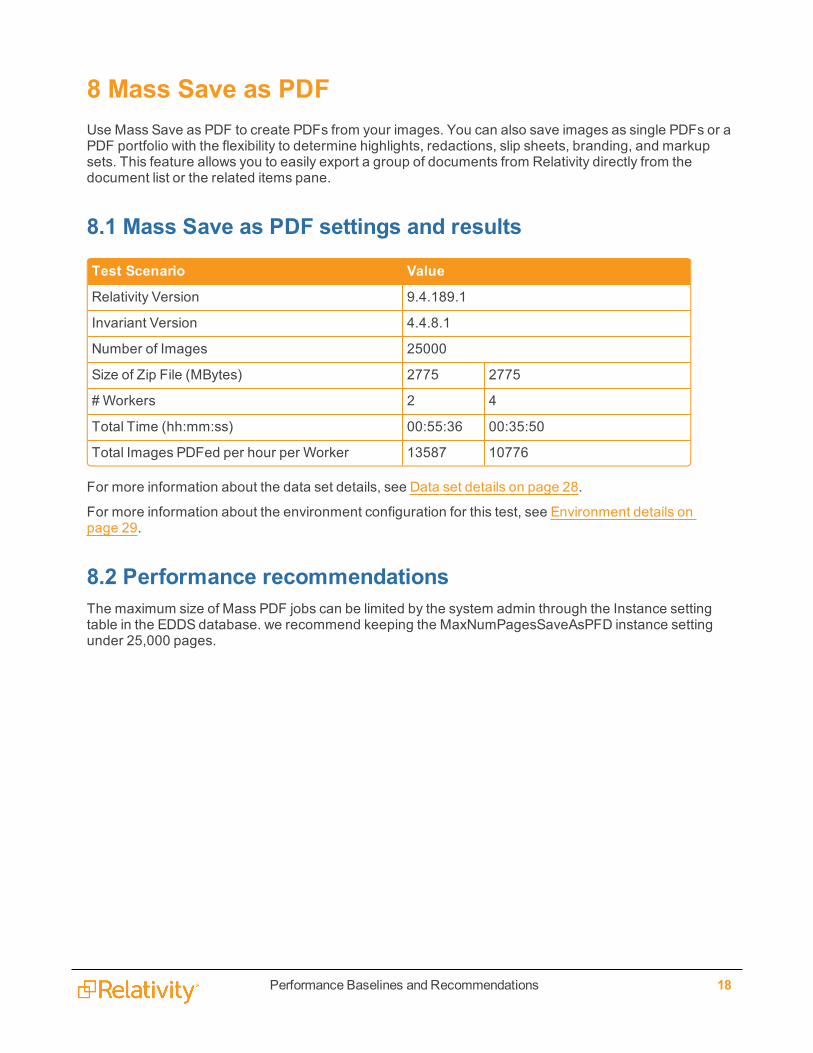
8 Mass Save as PDFUse Mass Save as PDF to create PDFs from your images. You can also save images as single PDFs or aPDF portfolio with the flexibility to determine highlights, redactions, slip sheets, branding, and markupsets. This feature allows you to easily export a group of documents from Relativity directly from thedocument list or the related items pane.
8.1 Mass Save as PDF settings and results
Test Scenario Value
Relativity Version 9.4.189.1
Invariant Version 4.4.8.1
Number of Images 25000
Size of Zip File (MBytes) 2775 2775
# Workers 2 4
Total Time (hh:mm:ss) 00:55:36 00:35:50
Total Images PDFed per hour per Worker 13587 10776
For more information about the data set details, see Data set details on page 28.
For more information about the environment configuration for this test, see Environment details onpage 29.
8.2 Performance recommendationsThe maximum size of Mass PDF jobs can be limited by the system admin through the Instance settingtable in the EDDS database. we recommend keeping the MaxNumPagesSaveAsPFD instance settingunder 25,000 pages.

Performance Baselines and Recommendations 19
9 Mass conversionThese tests were all run on the same environment. The same set of 4 workers/agents were used for all thetests.
9.1 Mass conversion (service bus)The following table provides a comparison of mass conversion performance for various versions ofRelativity:
ReleaseRelativity 9.3 Relativity 9.3 Relativity 9.4
Initial release (Nov2015)
April Update (withCAPI scalability issue fix)
Initial Release(June 2016)
Platform Invariant Invariant Service Bus
Oracle Version 8.5.0 8.5.0 8.5.3
# of Docs converted 99833 99833 99833
# of Work-ers/Agents
4 4 4
Total ConversionDuration
1:38:52 0:25:45 0:08:28
9.2 Conclusionn Relativity 9.4 is 11x faster than Relativity 9.3 (initial release).
n Relativity 9.4 is 3x faster than Relativity 9.3 (Apr 2016 update).
Performance Baselines and Recommendations 20
10 ProcessingRelativity’s processing feature allows you to ingest raw data directly into your workspace without the needfor an external tool.
Note the following details regarding the data on this page:
n The performance speeds included below are based on tests conducted against a specific envir-onment setup. For the details of this setup, see Processing environment details on page 32.
n We recommend that you conduct performance tests against your current environment setup, com-pare your speeds to those included on this page, and then adjust your environment accordingly, ifnecessary.
Note: Performance baseline calculations use the discovered file size, not the source data file size (e.g.,File Size–after Discovery / [Discovery Time + Processing Time]).
Note: To obtain the folders containing the EDRM and Real World test data sets, [email protected].
10.1 Processing profile and data source specificationsThe processing profile used in the job that generated these performance baselines had the followingspecifications.
Note that the only field that was edited to something other than its default value was the Auto-publish setfield, which was set to Yes.
n Default time zone - UTC Coordinated Universal Time
n Defaults OCR languages - English
n DeNIST - Yes
n DeNIST mode - DeNIST all files
n Extract children - Yes
n When extracting children, do not extract - <blank>
n Excel header/footer extraction - Do not extract
n OCR - Enabled
n OCR accuracy - Medium (average speed)
n OCR text separator - Enabled
n Auto-publish set - Yes
n Deduplication method - None
n Default document numbering prefix - REL

Performance Baselines and Recommendations 21
n Default destination folder - <name of workspace>
n Do you want to use source folder structure - Yes
In addition to the above settings, all of the available optional fields were mapped prior to running the job.
For more information on the processing profile fields, see the Relativity Processing User Guide.
The test data used to generate these performance baselines (the Real World data set) was selected forthe Source Path field on the processing data source. Note the following details of the Real World data set:
n File size - 60 GB
n File count - 100,000 assorted fileso 70%emails - 42 GB of various PSTs and loose emails
o 15%Office files - 10 GB of Excels, Word, PPTs,
o 10%PDF - 6GBPDFs
o 5%other (CAD files, Text files) - ~3GB
For information on creating a processing data source, see the Relativity Processing User Guide.
Note: For more information about the environment configuration for this test, see Processingenvironment details on page 32.
10.2 Discover + Publish performance baselinesAll time entries in the following table appear in the (hh:mm) format.
The following graphic depicts howmany GB per hour are both discovered and published, per data set, pertier of workstation setup.
10.2.1 Real World data set detailsThe following graphic represents the Real World Data set only; it depicts the breakdown of total timebetween discover and publish times, per tier of workstation setup for the Real World Data Set only.

Performance Baselines and Recommendations 22
10.3 Discover + Publish performance baselines - Data GridAll time entries in the following table appear in the (hh:mm) format.
The following graphic depicts howmany GB per hour are both discovered and published, per data set, pertier of workstation setup.
10.3.1 Real world data set details - Data GridThe following graphic represents the Real World Data set only; it depicts the breakdown of total timebetween discover and publish times, per tier of workstation setup for the Real World Data Set only.
Performance Baselines and Recommendations 23
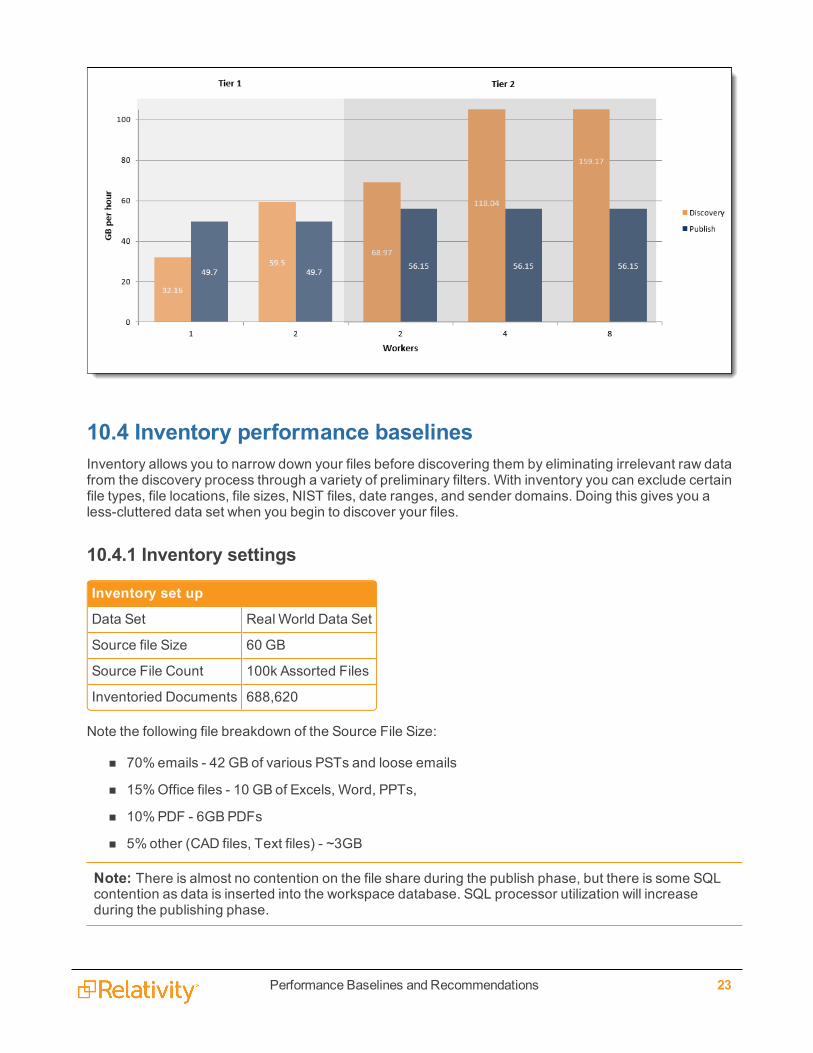
10.4 Inventory performance baselinesInventory allows you to narrow down your files before discovering them by eliminating irrelevant raw datafrom the discovery process through a variety of preliminary filters. With inventory you can exclude certainfile types, file locations, file sizes, NIST files, date ranges, and sender domains. Doing this gives you aless-cluttered data set when you begin to discover your files.
10.4.1 Inventory settings
Inventory set up
Data Set Real World Data Set
Source file Size 60 GB
Source File Count 100k Assorted Files
Inventoried Documents 688,620
Note the following file breakdown of the Source File Size:
n 70%emails - 42 GB of various PSTs and loose emails
n 15%Office files - 10 GB of Excels, Word, PPTs,
n 10%PDF - 6GBPDFs
n 5%other (CAD files, Text files) - ~3GB
Note: There is almost no contention on the file share during the publish phase, but there is some SQLcontention as data is inserted into the workspace database. SQL processor utilization will increaseduring the publishing phase.

Performance Baselines and Recommendations 24
The following graphic depicts howmany GB per hour are processed by howmany workers present in eachtier of workstation setup.
10.5 Performance recommendationsn Worker Threads - by default and if enough memory is available (750 MB/thread), Processing will
run two worker threads per CPU core on each worker server up to 16 worker threads per workermachine. Further improvements could be realized by scaling horizontally with multiple workermachines.
n Worker Machines - when scaling Relativity Processing Worker machines horizontally, it is equallyimportant to scale the file server if you want to continue to see linear improvements in performance.It will do no good to put 20+ worker machines online if your file server does not have the availableIOPS to support them.
n Invariant Queue - during discovery, the Invariant Queue Manager, workers, and default file sharefor the workspace are heavily utilized. CPU, network, and disk resources should be closely mon-itored, to detect and prevent any issues which may impact performance for other processes in thesystem, particularly review and imaging.
n Deleting of a processing set is a background process, and will only proceed while other activity is notongoing for the data store. This process may take days or weeks for large data sets or busy serv-ers. If the data deletion needs to proceed more quickly, we recommend creating the following indexin the relevant data store:
o CREATE INDEX [IX_Matter_StorageId] ON [dbo].[Matter] ([StorageId])
Note: This index must be dropped or disabled prior to further processing work using that datastore.
Performance Baselines and Recommendations 25
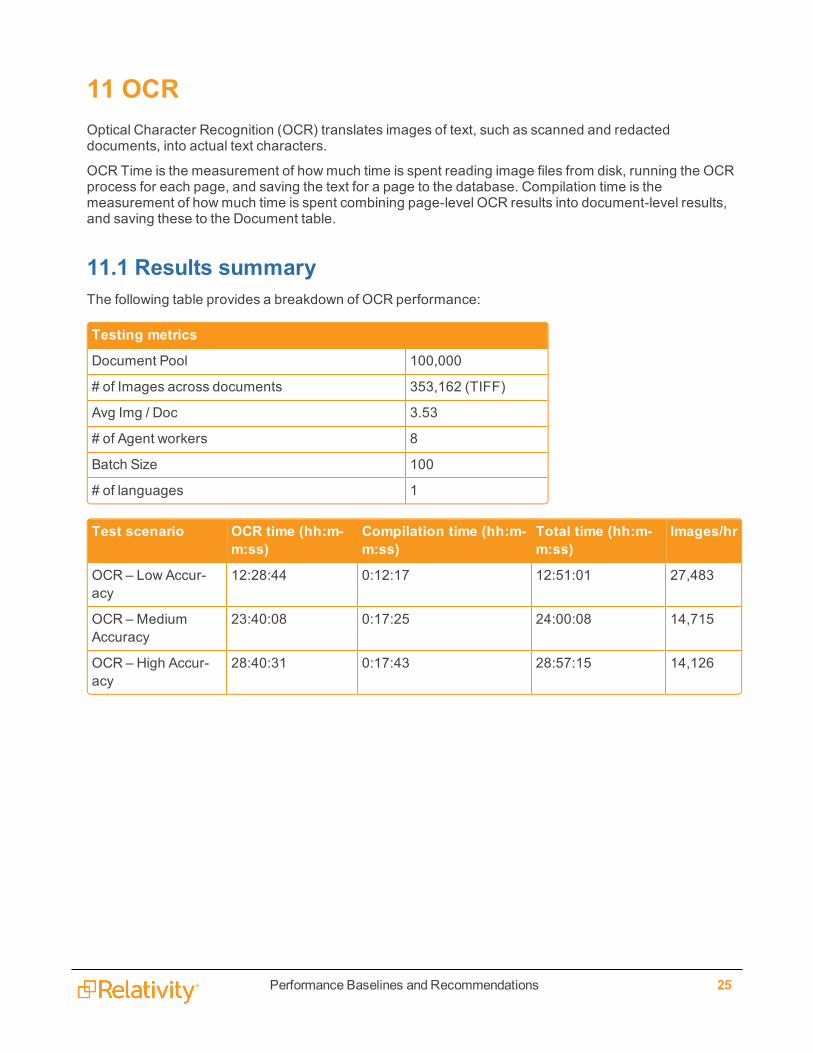
11 OCROptical Character Recognition (OCR) translates images of text, such as scanned and redacteddocuments, into actual text characters.
OCR Time is the measurement of howmuch time is spent reading image files from disk, running the OCRprocess for each page, and saving the text for a page to the database. Compilation time is themeasurement of howmuch time is spent combining page-level OCR results into document-level results,and saving these to the Document table.
11.1 Results summaryThe following table provides a breakdown of OCR performance:
Testing metrics
Document Pool 100,000
# of Images across documents 353,162 (TIFF)
Avg Img / Doc 3.53
# of Agent workers 8
Batch Size 100
# of languages 1
Test scenario OCR time (hh:m-m:ss)
Compilation time (hh:m-m:ss)
Total time (hh:m-m:ss)
Images/hr
OCR – Low Accur-acy
12:28:44 0:12:17 12:51:01 27,483
OCR – MediumAccuracy
23:40:08 0:17:25 24:00:08 14,715
OCR – High Accur-acy
28:40:31 0:17:43 28:57:15 14,126
Performance Baselines and Recommendations 26
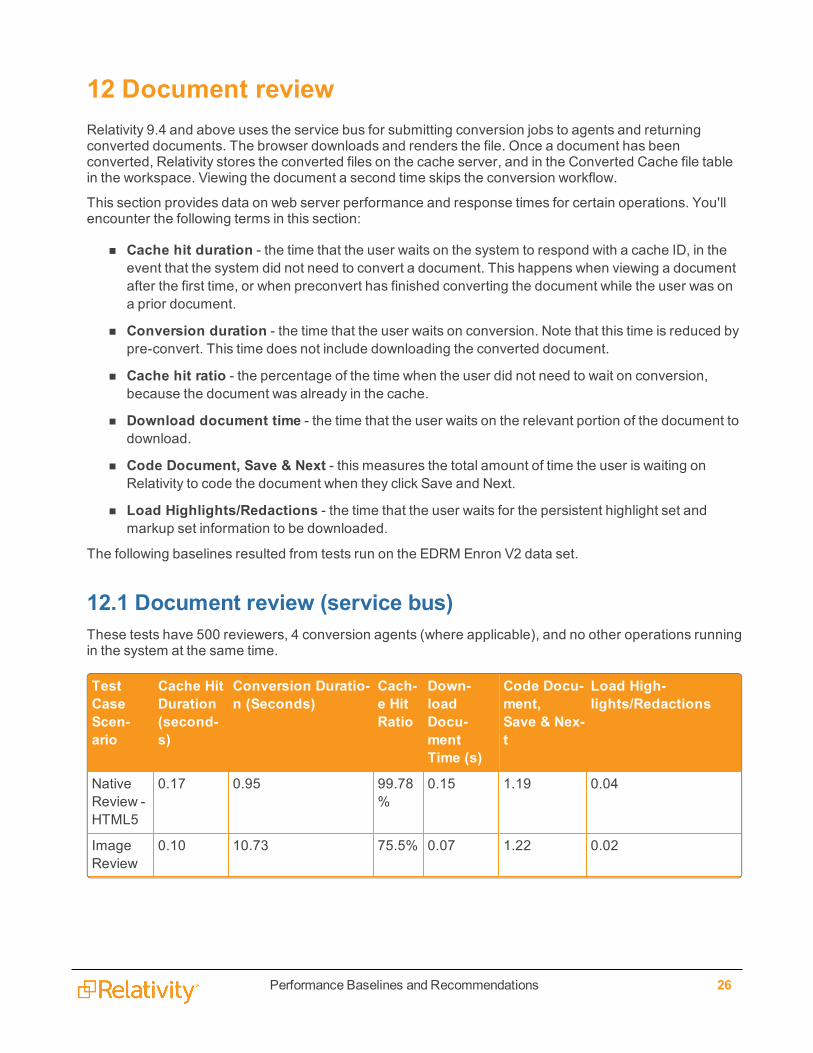
12 Document reviewRelativity 9.4 and above uses the service bus for submitting conversion jobs to agents and returningconverted documents. The browser downloads and renders the file. Once a document has beenconverted, Relativity stores the converted files on the cache server, and in the Converted Cache file tablein the workspace. Viewing the document a second time skips the conversion workflow.
This section provides data on web server performance and response times for certain operations. You'llencounter the following terms in this section:
n Cache hit duration - the time that the user waits on the system to respond with a cache ID, in theevent that the system did not need to convert a document. This happens when viewing a documentafter the first time, or when preconvert has finished converting the document while the user was ona prior document.
n Conversion duration - the time that the user waits on conversion. Note that this time is reduced bypre-convert. This time does not include downloading the converted document.
n Cache hit ratio - the percentage of the time when the user did not need to wait on conversion,because the document was already in the cache.
n Download document time - the time that the user waits on the relevant portion of the document todownload.
n Code Document, Save & Next - this measures the total amount of time the user is waiting onRelativity to code the document when they click Save and Next.
n Load Highlights/Redactions - the time that the user waits for the persistent highlight set andmarkup set information to be downloaded.
The following baselines resulted from tests run on the EDRM Enron V2 data set.
12.1 Document review (service bus)These tests have 500 reviewers, 4 conversion agents (where applicable), and no other operations runningin the system at the same time.
TestCaseScen-ario
Cache HitDuration (second-s)
Conversion Duratio-n (Seconds)
Cach-e HitRatio
Down-loadDocu-mentTime (s)
Code Docu-ment,Save & Nex-t
Load High-lights/Redactions
NativeReview -HTML5
0.17 0.95 99.78%
0.15 1.19 0.04
ImageReview
0.10 10.73 75.5% 0.07 1.22 0.02

Performance Baselines and Recommendations 27
TestCaseScen-ario
Cache HitDuration (second-s)
Conversion Duratio-n (Seconds)
Cach-e HitRatio
Down-loadDocu-mentTime (s)
Code Docu-ment,Save & Nex-t
Load High-lights/Redactions
TextReview(SQL)
N/A N/A N/A 0.17 1.19 0.03
TextReview(DataGrid)
N/A N/A N/A 0.15 1.30 0.02
For more information about the data set details, see Data set details on the next page.
For more information about the environment configuration for this test, see Environment details onpage 29.
Performance Baselines and Recommendations 28
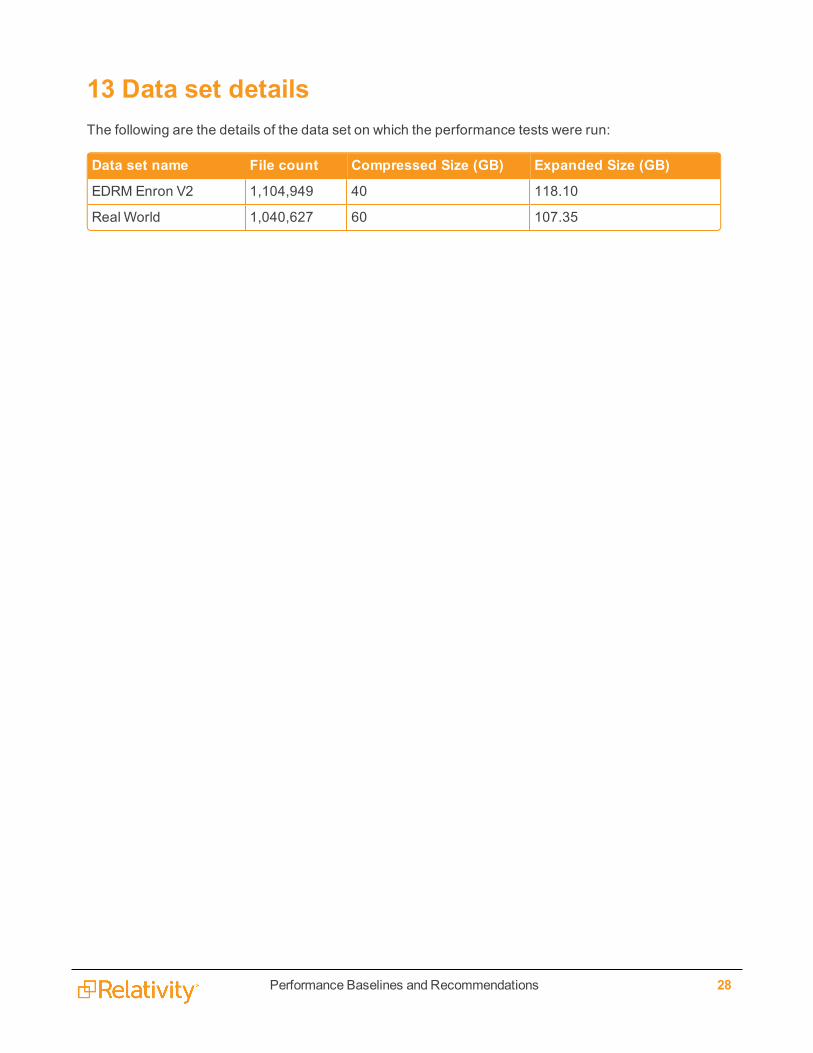
13 Data set detailsThe following are the details of the data set on which the performance tests were run:
Data set name File count Compressed Size (GB) Expanded Size (GB)
EDRM Enron V2 1,104,949 40 118.10
Real World 1,040,627 60 107.35

Performance Baselines and Recommendations 29
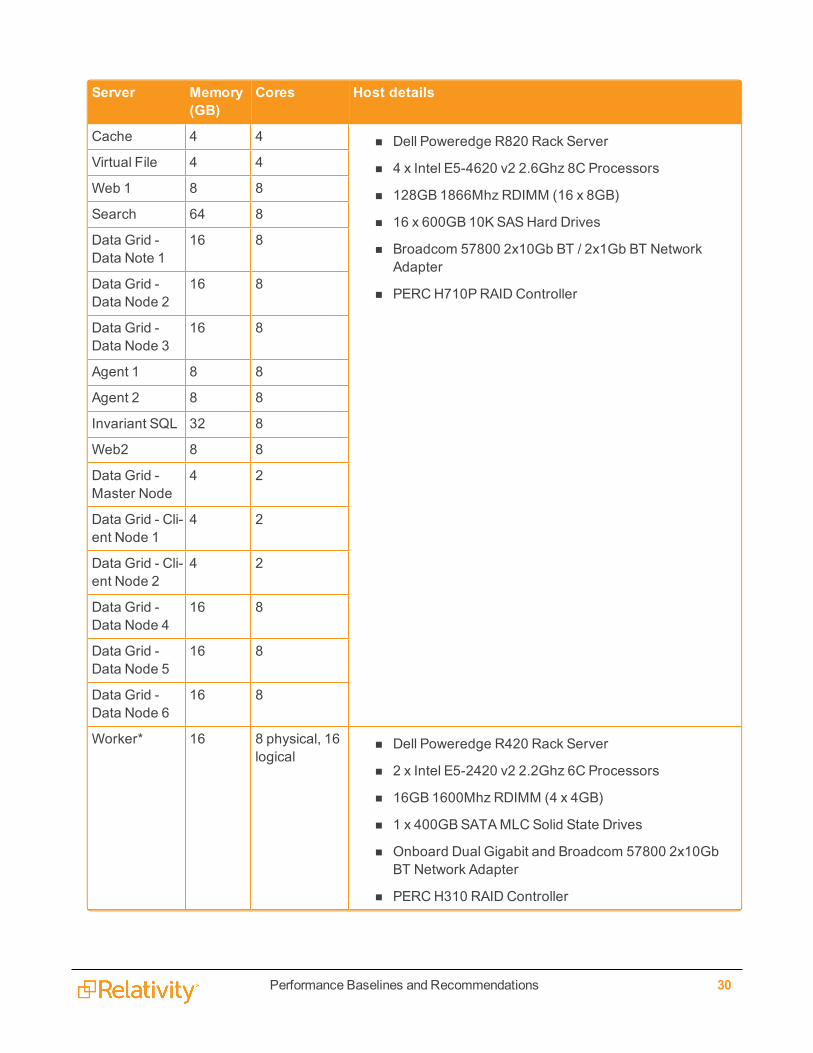
14 Environment detailsThe following table provides Relativity environment server specifications:
Note: As of Relativity 9.3, the processor model on the performance virtual machines was changed from4 x Intel E5-4627 v2 3.3Ghz 8C Processors to 4 x Intel E5-4620 v2 3.3Ghz 8C Processors. Notethat performance in 9.4 may be affected by this processor model update.
Server Memory(GB)
Cores Host details
SQL* 256 32 n Dell PowerEdge R720xd Rack Server
n 2 x Intel E5-2650 v2 2.6Ghz 8C Processors
n 256GB 1866Mhz RDIMM (16 x 16GB)
n 18 x 600GB 10KSASHard Drives, 4 x 1.2TB 10KSASDrives, 4 x 400GBSATAMLC Solid State Drives
n Broadcom 57800 2x10Gb BT / 2x1Gb BT NetworkAdapter
n PERCH710PRAID Controller
Performance Baselines and Recommendations 30
Server Memory(GB)
Cores Host details
Cache 4 4 n Dell Poweredge R820 Rack Server
n 4 x Intel E5-4620 v2 2.6Ghz 8C Processors
n 128GB 1866Mhz RDIMM (16 x 8GB)
n 16 x 600GB 10KSASHard Drives
n Broadcom 57800 2x10Gb BT / 2x1Gb BT NetworkAdapter
n PERCH710PRAID Controller
Virtual File 4 4
Web 1 8 8
Search 64 8
Data Grid -Data Note 1
16 8
Data Grid -Data Node 2
16 8
Data Grid -Data Node 3
16 8
Agent 1 8 8
Agent 2 8 8
Invariant SQL 32 8
Web2 8 8
Data Grid -Master Node
4 2
Data Grid - Cli-ent Node 1
4 2
Data Grid - Cli-ent Node 2
4 2
Data Grid -Data Node 4
16 8
Data Grid -Data Node 5
16 8
Data Grid -Data Node 6
16 8
Worker* 16 8 physical, 16logical
n Dell Poweredge R420 Rack Server
n 2 x Intel E5-2420 v2 2.2Ghz 6C Processors
n 16GB 1600Mhz RDIMM (4 x 4GB)
n 1 x 400GBSATAMLC Solid State Drives
n Onboard Dual Gigabit and Broadcom 57800 2x10GbBT Network Adapter
n PERCH310 RAID Controller
Performance Baselines and Recommendations 31
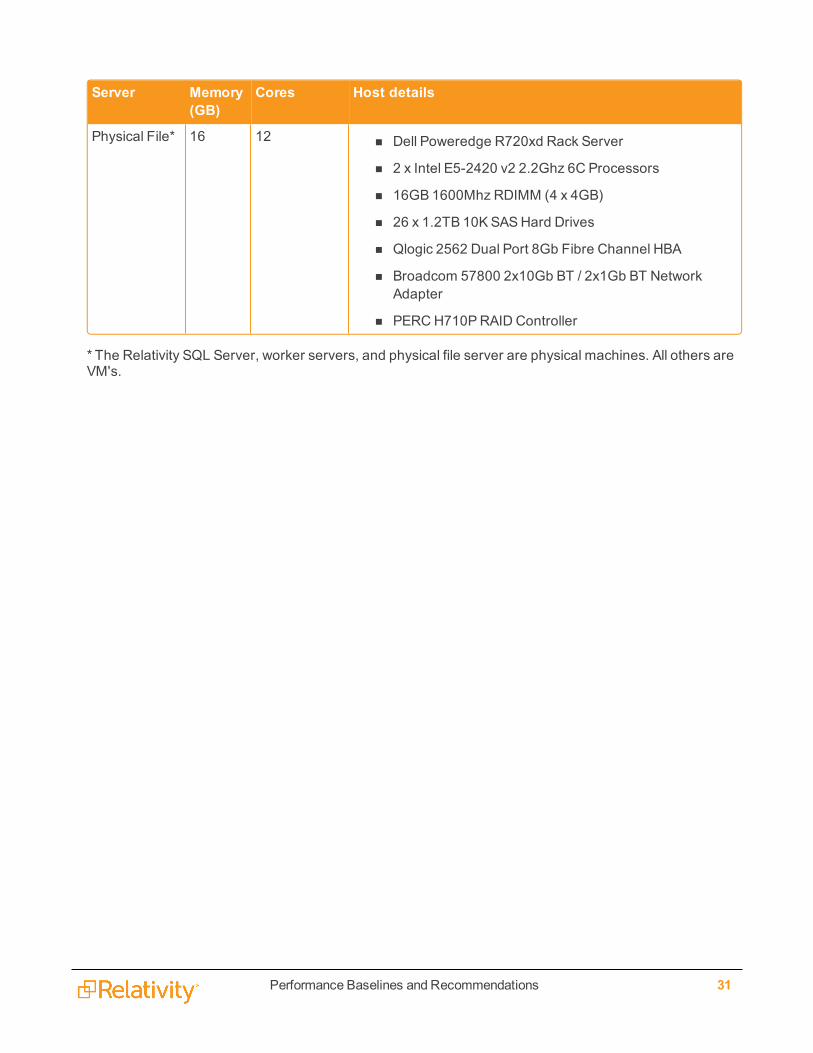
Server Memory(GB)
Cores Host details
Physical File* 16 12 n Dell Poweredge R720xd Rack Server
n 2 x Intel E5-2420 v2 2.2Ghz 6C Processors
n 16GB 1600Mhz RDIMM (4 x 4GB)
n 26 x 1.2TB 10KSASHard Drives
n Qlogic 2562 Dual Port 8Gb Fibre Channel HBA
n Broadcom 57800 2x10Gb BT / 2x1Gb BT NetworkAdapter
n PERCH710PRAID Controller
* The Relativity SQL Server, worker servers, and physical file server are physical machines. All others areVM's.

Performance Baselines and Recommendations 32
15 Processing environment detailsIt's important to determine your infrastructure needs based on your desired throughput. We recommendthat you refer to the applicable tier to locate the necessary hardware components to complete yourprocessing infrastructure.
The below table specifies the environment these tests were conducted on. This environment falls into theTier 2 specifications as outlined in the system requirements page. See Processing system requirements inthe System requirements guide.
Note: As of Relativity 9.4, the processor model on the performance virtual machines was changed from4 x Intel E5-4627 v2 3.3Ghz 8C Processors to 4 x Intel E5-4620 v2 3.3Ghz 8C Processors. Notethat performance degradation in 9.4 may be affected by this processor model update.
Server Memory(GB)
Cores Host details
SQL * 256 32 n Dell PowerEdge R720xd
n 2 x Intel E5-2650 2.6Ghz 8Core Processor
n 16 x 16GB (256GB) 1866MHzRDIMM Memory
n Broadcom 57800 2x10Gb BT /2x1Gb BT Network Adapter
n PERCH710PRAID Controller
Web 8 8 Split between two of the following:
n Dell PowerEdge R820
n 4 x Intel E5-4620 v2 3.3Ghz8C Processors
n 16 x 8GB (128GB) 1866MHzRDIMM Memory
n Broadcom 57800 2x10Gb BT /2x1Gb BT Network Adapter
n PERCH710PRAID Controller
Agent 8 8
File 4 4
Search/CA/Loading 64 8
Invariant SQL 32 8

Performance Baselines and Recommendations 33
Server Memory(GB)
Cores Host details
Worker * 16 n 8 physical
n 16 logical
n Dell PowerEdge R420
n 2 x Intel E5-2420 v2 2.2Ghz6C Processor
n 4 x 4GB (16GB) 1600MhzRDIMM
n Onboard Dual Gigabit andBroadcom 57800 2x10Gb BTNetwork Adapter
File Server * 4 4 n Dell PowerEdge R820xd
n 2 x Intel E5-2620 v2 2.1Ghz6C Processors
n 16GB 1600Mhz RDIMM (4 x4GB)
n 26 x 1.2TB 10KSASHardDrives
n Broadcom 57800 2x10Gb BT /2x1Gb BT Network Adapter
n PERCH710PRAID Controller
* The Relativity SQL Server, worker servers, and physical file server are physical machines. All others areVM's.

Performance Baselines and Recommendations 34
Proprietary RightsThis documentation (“Documentation”) and the software to which it relates (“Software”) belongs toRelativity ODA LLC and/or Relativity’s third party software vendors. Relativity grants written licenseagreements which contain restrictions. All parties accessing the Documentation or Software must: respectproprietary rights of Relativity and third parties; comply with your organization’s license agreement,including but not limited to license restrictions on use, copying, modifications, reverse engineering, andderivative products; and refrain from any misuse or misappropriation of this Documentation or Software inwhole or in part. The Software and Documentation is protected by the Copyright Act of 1976, asamended, and the Software code is protected by the Illinois Trade Secrets Act. Violations can involvesubstantial civil liabilities, exemplary damages, and criminal penalties, including fines and possibleimprisonment.©2019. Relativity ODA LLC. All rights reserved. Relativity® is a registered trademark of RelativityODA LLC.


