46
pointpats Documentation Release 2.0.0 pysal developers Jun 22, 2019

pointpats DocumentationRelease 2.0.0
pysal developers
Jun 22, 2019


CONTENTS:
1 Installation 31.1 Installing released version . . . . . . . . . . . . . . . . . . . . . . . . . . . . . . . . . . . . . . . . 31.2 Installing development version . . . . . . . . . . . . . . . . . . . . . . . . . . . . . . . . . . . . . . 3
2 API reference 52.1 Point Pattern . . . . . . . . . . . . . . . . . . . . . . . . . . . . . . . . . . . . . . . . . . . . . . . 5
2.1.1 pointpats.PointPattern . . . . . . . . . . . . . . . . . . . . . . . . . . . . . . . . . . . . . . 52.2 Point Processes . . . . . . . . . . . . . . . . . . . . . . . . . . . . . . . . . . . . . . . . . . . . . . 9
2.2.1 pointpats.PointProcess . . . . . . . . . . . . . . . . . . . . . . . . . . . . . . . . . . . . . 92.2.2 pointpats.PoissonPointProcess . . . . . . . . . . . . . . . . . . . . . . . . . . . . . . . . . 102.2.3 pointpats.PoissonClusterPointProcess . . . . . . . . . . . . . . . . . . . . . . . . . . . . . 12
2.3 Centrography . . . . . . . . . . . . . . . . . . . . . . . . . . . . . . . . . . . . . . . . . . . . . . . 152.3.1 pointpats.mbr . . . . . . . . . . . . . . . . . . . . . . . . . . . . . . . . . . . . . . . . . . 152.3.2 pointpats.hull . . . . . . . . . . . . . . . . . . . . . . . . . . . . . . . . . . . . . . . . . . 152.3.3 pointpats.mean_center . . . . . . . . . . . . . . . . . . . . . . . . . . . . . . . . . . . . . 162.3.4 pointpats.weighted_mean_center . . . . . . . . . . . . . . . . . . . . . . . . . . . . . . . . 162.3.5 pointpats.manhattan_median . . . . . . . . . . . . . . . . . . . . . . . . . . . . . . . . . . 162.3.6 pointpats.std_distance . . . . . . . . . . . . . . . . . . . . . . . . . . . . . . . . . . . . . . 162.3.7 pointpats.euclidean_median . . . . . . . . . . . . . . . . . . . . . . . . . . . . . . . . . . 172.3.8 pointpats.ellipse . . . . . . . . . . . . . . . . . . . . . . . . . . . . . . . . . . . . . . . . . 172.3.9 pointpats.skyum . . . . . . . . . . . . . . . . . . . . . . . . . . . . . . . . . . . . . . . . . 172.3.10 pointpats.dtot . . . . . . . . . . . . . . . . . . . . . . . . . . . . . . . . . . . . . . . . . . 172.3.11 pointpats._circle . . . . . . . . . . . . . . . . . . . . . . . . . . . . . . . . . . . . . . . . . 18
2.4 Quadrat Based Statistics . . . . . . . . . . . . . . . . . . . . . . . . . . . . . . . . . . . . . . . . . 182.4.1 pointpats.RectangleM . . . . . . . . . . . . . . . . . . . . . . . . . . . . . . . . . . . . . . 182.4.2 pointpats.HexagonM . . . . . . . . . . . . . . . . . . . . . . . . . . . . . . . . . . . . . . 192.4.3 pointpats.QStatistic . . . . . . . . . . . . . . . . . . . . . . . . . . . . . . . . . . . . . . . 20
2.5 Distance Based Statistics . . . . . . . . . . . . . . . . . . . . . . . . . . . . . . . . . . . . . . . . . 212.5.1 pointpats.DStatistic . . . . . . . . . . . . . . . . . . . . . . . . . . . . . . . . . . . . . . . 212.5.2 pointpats.G . . . . . . . . . . . . . . . . . . . . . . . . . . . . . . . . . . . . . . . . . . . 222.5.3 pointpats.F . . . . . . . . . . . . . . . . . . . . . . . . . . . . . . . . . . . . . . . . . . . 232.5.4 pointpats.J . . . . . . . . . . . . . . . . . . . . . . . . . . . . . . . . . . . . . . . . . . . . 242.5.5 pointpats.K . . . . . . . . . . . . . . . . . . . . . . . . . . . . . . . . . . . . . . . . . . . 252.5.6 pointpats.L . . . . . . . . . . . . . . . . . . . . . . . . . . . . . . . . . . . . . . . . . . . 262.5.7 pointpats.Envelopes . . . . . . . . . . . . . . . . . . . . . . . . . . . . . . . . . . . . . . . 262.5.8 pointpats.Genv . . . . . . . . . . . . . . . . . . . . . . . . . . . . . . . . . . . . . . . . . 272.5.9 pointpats.Fenv . . . . . . . . . . . . . . . . . . . . . . . . . . . . . . . . . . . . . . . . . . 282.5.10 pointpats.Jenv . . . . . . . . . . . . . . . . . . . . . . . . . . . . . . . . . . . . . . . . . . 292.5.11 pointpats.Kenv . . . . . . . . . . . . . . . . . . . . . . . . . . . . . . . . . . . . . . . . . 312.5.12 pointpats.Lenv . . . . . . . . . . . . . . . . . . . . . . . . . . . . . . . . . . . . . . . . . 32
i
2.6 Window functions . . . . . . . . . . . . . . . . . . . . . . . . . . . . . . . . . . . . . . . . . . . . 332.6.1 pointpats.Window . . . . . . . . . . . . . . . . . . . . . . . . . . . . . . . . . . . . . . . . 332.6.2 pointpats.as_window . . . . . . . . . . . . . . . . . . . . . . . . . . . . . . . . . . . . . . 352.6.3 pointpats.poly_from_bbox . . . . . . . . . . . . . . . . . . . . . . . . . . . . . . . . . . . 352.6.4 pointpats.to_ccf . . . . . . . . . . . . . . . . . . . . . . . . . . . . . . . . . . . . . . . . . 35
3 References 37
Bibliography 39
Index 41
ii

pointpats Documentation, Release 2.0.0
pointpats is an open-source python library for the statistical analysis of planar point patterns. It is a subpackage ofPySAL (Python Spatial Analysis Library) and is under active development for the inclusion of many newly proposedanalytics for point patterns.
CONTENTS: 1

pointpats Documentation, Release 2.0.0
2 CONTENTS:

CHAPTER
ONE
INSTALLATION
pointpats supports python 3.5 and 3.6 only. Please make sure that you are operating in a python 3 environment.
1.1 Installing released version
pointpats is available on the Python Package Index. Therefore, you can either install directly with pip from thecommand line:
pip install -U pointpats
or download the source distribution (.tar.gz) and decompress it to your selected destination. Open a command shelland navigate to the decompressed folder. Type:
pip install .
1.2 Installing development version
Potentially, you might want to use the newest features in the development version of pointpats on github -pysal/pointpats while have not been incorporated in the Pypi released version. You can achieve that by installingpysal/pointpats by running the following from a command shell:
pip install git+https://github.com/pysal/pointpats.git
You can also fork the pysal/pointpats repo and create a local clone of your fork. By making changes to your localclone and submitting a pull request to pysal/pointpats, you can contribute to the pointpats development.
3

pointpats Documentation, Release 2.0.0
4 Chapter 1. Installation
CHAPTER
TWO
API REFERENCE
2.1 Point Pattern
PointPattern(points[, window, names, . . . ]) Planar Point Pattern Class 2-D.
2.1.1 pointpats.PointPattern
class pointpats.PointPattern(points, window=None, names=None, coord_names=None)Planar Point Pattern Class 2-D.
Parameters
points: array (n,p), n points with p >= 2 attributes on each point. Two attributes must comprisethe spatial coordinate pair. Default is that the first two attributes are the x and y spatialcoordinates.
window: :class:‘.Window‘ Bounding geometric object for the point pattern. If not specified,window will be set to the minimum bounding rectangle of the point pattern.
names: list The names of the attributes.
coord_names: list The names of the attributes defining the two spatial coordinates.
Examples
>>> from pointpats import PointPattern>>> points = [[66.22, 32.54], [22.52, 22.39], [31.01, 81.21],... [9.47, 31.02], [30.78, 60.10], [75.21, 58.93],... [79.26, 7.68], [8.23, 39.93], [98.73, 77.17],... [89.78, 42.53], [65.19, 92.08], [54.46, 8.48]]>>> pp = PointPattern(points)>>> pp.n12>>> pp.mean_nnd21.612139802089246>>> pp.lambda_mbb0.0015710507711240867>>> pp.lambda_hull0.0022667153468973137>>> pp.hull_area5294.00395>>> pp.mbb_area7638.200000000001
5
pointpats Documentation, Release 2.0.0
Attributes
hull Points defining convex hull in counterclockwise order
hull_area Area of convex hull
lambda_hull Intensity based on convex hull
lambda_mbb Intensity based on minimum bounding box
lambda_window Intensity estimate based on area of window
max_nnd Max nearest neighbor distance
mbb Minimum bounding box
mbb_area Area of minimum bounding box
mean_nnd Mean nearest neighbor distance
min_nnd Min nearest neighbor distance
n Number of points
nnd Nearest neighbor distances
tree
window Bounding geometry for the point pattern
Methods
explode(self, mark) Explode a marked point pattern into a sequence ofindividual point patterns.
find_pairs(self, r) Find all pairs of points in the pattern that are withinr units of each other
flip_coordinates(self) Flips the coordinates of a point pattern.get_window(self) Bounding geometry for the point patternknn(self[, k]) Find k nearest neighbors for each point in the patternknn_other(self, other[, k]) Find k nearest neighbors in the pattern for each point
in otherplot(self[, window, title, hull, get_ax]) Plot function for a point pattern.summary(self) Description of the point pattern.superimpose(self, point_pattern) Returns a superimposed point pattern.unique(self) Remove duplicate points in the point pattern.
pointpats.PointPattern
PointPattern.explode(self, mark)Explode a marked point pattern into a sequence of individual point patterns. If the mark has k uniquevalues, then the sequence will be of length k.
Parameters
mark: string The label of the mark to use for the subsetting
Returns
pps: list sequence of PointPattern instances
6 Chapter 2. API reference
pointpats Documentation, Release 2.0.0
pointpats.PointPattern
PointPattern.find_pairs(self, r)Find all pairs of points in the pattern that are within r units of each other
Parameters
r: float diameter of pair circle
Returns
s: set pairs of points within r units of each other
pointpats.PointPattern
PointPattern.flip_coordinates(self)Flips the coordinates of a point pattern.
Doesn’t change the structure of data frame. This function swaps _x and _y variables, which are used torepresent coordinates.
pointpats.PointPattern
PointPattern.get_window(self)Bounding geometry for the point pattern
window.Window
pointpats.PointPattern
PointPattern.knn(self, k=1)Find k nearest neighbors for each point in the pattern
Parameters
k: int number of nearest neighbors to find
Returns
nn: array (n x k) row i column j contains the id for i’s jth nearest neighbor
nnd: array(n x k) row i column j contains the distance between i and its jth nearest neighbor
pointpats.PointPattern
PointPattern.knn_other(self, other, k=1)Find k nearest neighbors in the pattern for each point in other
Parameters
other: :class:‘PointPattern‘
k: int number of nearest neighbors to find
Returns
nn: array (n x k) row i column j contains the id for i’s jth nearest neighbor
nnd: array(n x k) row i column j contains the distance between i and its jth nearest neighbor
2.1. Point Pattern 7

pointpats Documentation, Release 2.0.0
pointpats.PointPattern
PointPattern.plot(self, window=False, title=’Point Pattern’, hull=False, get_ax=False)Plot function for a point pattern.
Parameters
window [boolean] If window is True, plot window of the point pattern. If not, don’t plotwindow.
title [string] Name of the figure.
hull [boolean] If hull is True, plot convex hull of the point pattern. If not, don’t plot convexhull.
get_ax [boolean] If get_ax is True, return the current plot ax.
Returns
ax [matplotlib.axes._subplots.AxesSubplot] Current plot ax. Only return it when get_ax isTrue.
pointpats.PointPattern
PointPattern.summary(self)Description of the point pattern.
pointpats.PointPattern
PointPattern.superimpose(self, point_pattern)Returns a superimposed point pattern.
Parameters
point_pattern: PointPattern instance
Returns
superimposed : PointPattern instance
Examples
>>> from pointpats import PointPattern>>> points1 = [[1, 3], [4, 5], [0, 0]]>>> points2 = [[5, 6], [1, 4], [0, 0]]>>> pp1 = PointPattern(points1)>>> pp2 = PointPattern(points2)>>> pp1.superimpose(pp2).points
x y0 1 31 4 52 0 00 5 61 1 4
8 Chapter 2. API reference

pointpats Documentation, Release 2.0.0
pointpats.PointPattern
PointPattern.unique(self)Remove duplicate points in the point pattern.
Two points in a point pattern are deemed to be identical if their coordinates are the same, and their marksare the same (if any)
Returns
pp: list A deduplicated PointPattern instance
Examples
>>> from pointpats import PointPattern>>> points = [[1.2, 2.1], [1.2, 2.1], [0, 1], [1, 2]]>>> pp = PointPattern(points)>>> pp.unique().df
x y0 1.2 2.12 0.0 1.03 1.0 2.0
add_marksset_window
__init__(self, points, window=None, names=None, coord_names=None)Initialize self. See help(type(self)) for accurate signature.
2.2 Point Processes
PointProcess(window, n, samples[, asPP]) Point Process base class.PoissonPointProcess(window, n, samples[, . . . ]) Poisson point process including 𝑁 -conditioned CSR
process and 𝜆-conditioned CSR process.PoissonClusterPointProcess(window, n,. . . [, . . . ])
Poisson cluster point process (Neyman Scott).
2.2.1 pointpats.PointProcess
class pointpats.PointProcess(window, n, samples, asPP=False, **args)Point Process base class.
Parameters
window [Window] Bounding geometric object to contain point process realizations.
n [int] Size of each realization.
samples [list] Number of realizations.
asPP [bool] Control the data type of value in the “realizations” dictionary. If True, the data typeis point pattern as defined in pointpattern.py; if False, the data type is an two-dimensionalarray.
2.2. Point Processes 9

pointpats Documentation, Release 2.0.0
Attributes
realizations [dictionary] The key is the index of each realization, and the value is simulatedevent points for each realization. The data type of the value is controlled by the parameter“asPP”.
parameters [dictionary] Dictionary of a dictionary. The key is the index of each realization,and the value is a dictionary with the key ‘n’ and the value size of each realization.
Methods
draw(self, parameter) Generate a series of point coordinates within thegiven window.
pointpats.PointProcess
PointProcess.draw(self, parameter)Generate a series of point coordinates within the given window.
Parameters
parameter [dictionary] Key: ‘n’. Value: size of the realization.
Returns
: array A series of point coordinates.
realizesetup
__init__(self, window, n, samples, asPP=False, **args)Initialize self. See help(type(self)) for accurate signature.
2.2.2 pointpats.PoissonPointProcess
class pointpats.PoissonPointProcess(window, n, samples, conditioning=False, asPP=False)Poisson point process including 𝑁 -conditioned CSR process and 𝜆-conditioned CSR process.
Parameters
window [Window] Bounding geometric object to contain point process realizations.
n [int] Size of each realization.
samples [list] Number of realizations.
conditioning [bool] If True, use the 𝜆-conditioned CSR process, number of events would varyacross realizations; if False, use the 𝑁 -conditioned CSR process.
asPP [bool] Control the data type of value in the “realizations” dictionary. If True, the data typeis point pattern as defined in pointpattern.py; if False, the data type is an two-dimensionalarray.
10 Chapter 2. API reference
pointpats Documentation, Release 2.0.0
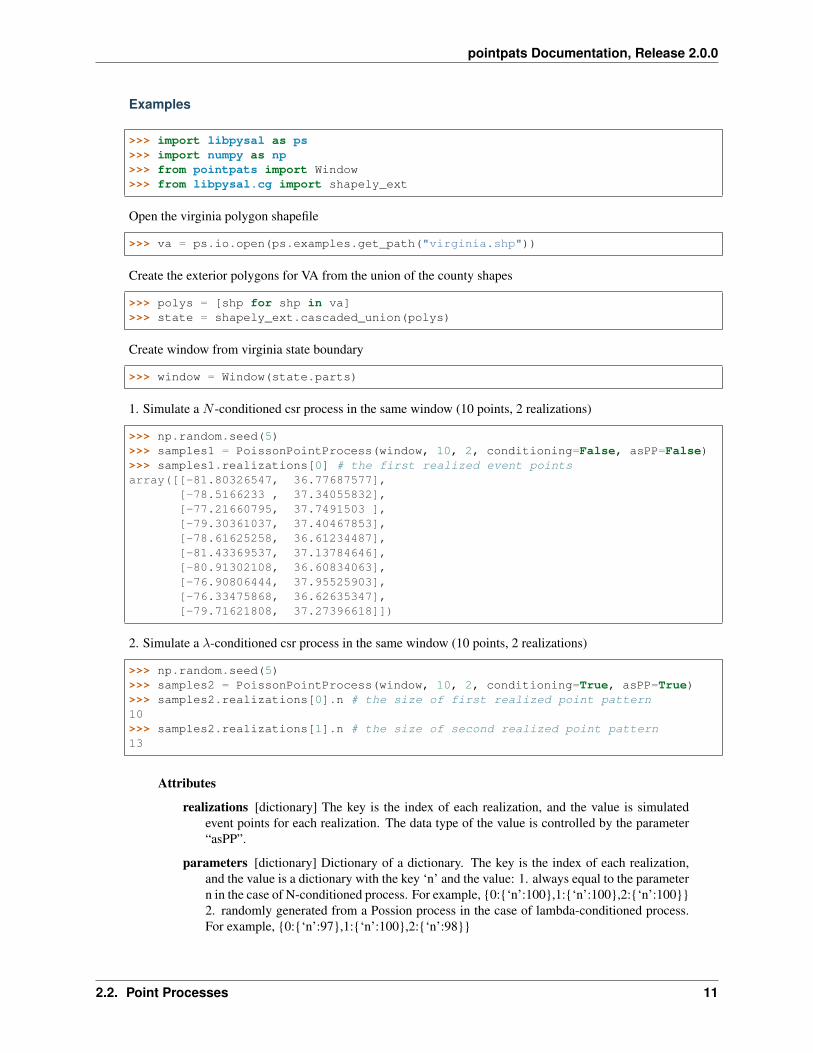
Examples
>>> import libpysal as ps>>> import numpy as np>>> from pointpats import Window>>> from libpysal.cg import shapely_ext
Open the virginia polygon shapefile
>>> va = ps.io.open(ps.examples.get_path("virginia.shp"))
Create the exterior polygons for VA from the union of the county shapes
>>> polys = [shp for shp in va]>>> state = shapely_ext.cascaded_union(polys)
Create window from virginia state boundary
>>> window = Window(state.parts)
1. Simulate a 𝑁 -conditioned csr process in the same window (10 points, 2 realizations)
>>> np.random.seed(5)>>> samples1 = PoissonPointProcess(window, 10, 2, conditioning=False, asPP=False)>>> samples1.realizations[0] # the first realized event pointsarray([[-81.80326547, 36.77687577],
[-78.5166233 , 37.34055832],[-77.21660795, 37.7491503 ],[-79.30361037, 37.40467853],[-78.61625258, 36.61234487],[-81.43369537, 37.13784646],[-80.91302108, 36.60834063],[-76.90806444, 37.95525903],[-76.33475868, 36.62635347],[-79.71621808, 37.27396618]])
2. Simulate a 𝜆-conditioned csr process in the same window (10 points, 2 realizations)
>>> np.random.seed(5)>>> samples2 = PoissonPointProcess(window, 10, 2, conditioning=True, asPP=True)>>> samples2.realizations[0].n # the size of first realized point pattern10>>> samples2.realizations[1].n # the size of second realized point pattern13
Attributes
realizations [dictionary] The key is the index of each realization, and the value is simulatedevent points for each realization. The data type of the value is controlled by the parameter“asPP”.
parameters [dictionary] Dictionary of a dictionary. The key is the index of each realization,and the value is a dictionary with the key ‘n’ and the value: 1. always equal to the parametern in the case of N-conditioned process. For example, {0:{‘n’:100},1:{‘n’:100},2:{‘n’:100}}2. randomly generated from a Possion process in the case of lambda-conditioned process.For example, {0:{‘n’:97},1:{‘n’:100},2:{‘n’:98}}
2.2. Point Processes 11
pointpats Documentation, Release 2.0.0
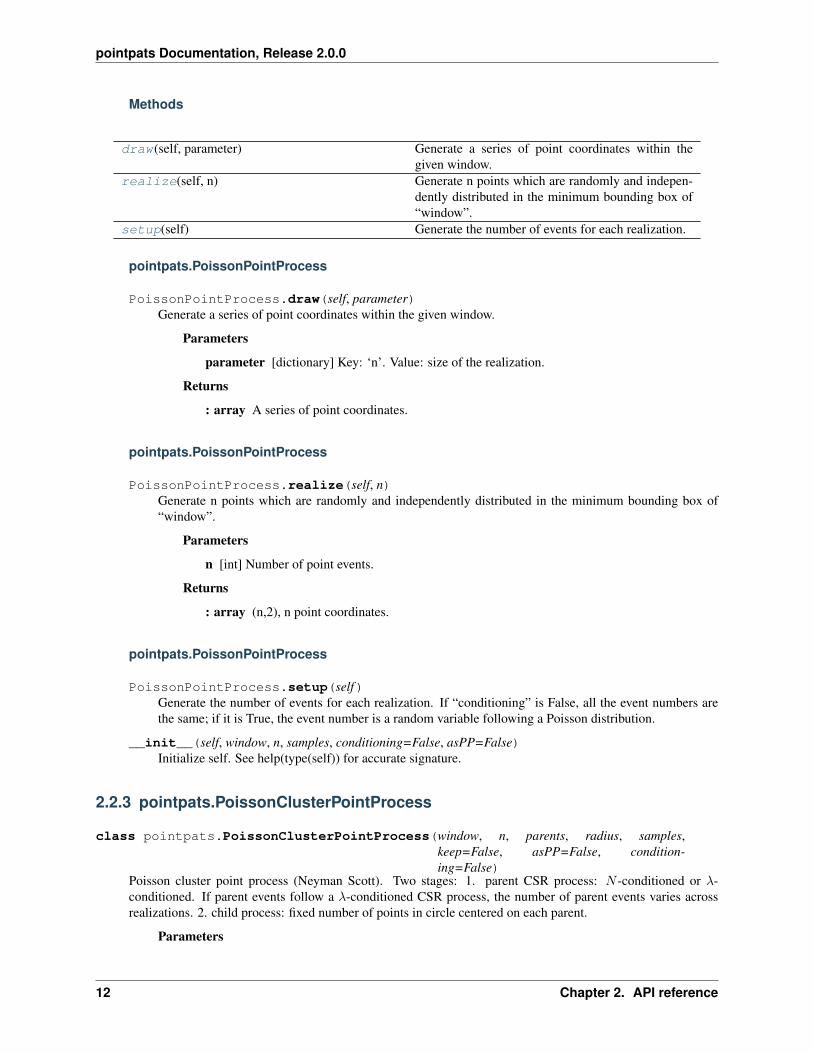
Methods
draw(self, parameter) Generate a series of point coordinates within thegiven window.
realize(self, n) Generate n points which are randomly and indepen-dently distributed in the minimum bounding box of“window”.
setup(self) Generate the number of events for each realization.
pointpats.PoissonPointProcess
PoissonPointProcess.draw(self, parameter)Generate a series of point coordinates within the given window.
Parameters
parameter [dictionary] Key: ‘n’. Value: size of the realization.
Returns
: array A series of point coordinates.
pointpats.PoissonPointProcess
PoissonPointProcess.realize(self, n)Generate n points which are randomly and independently distributed in the minimum bounding box of“window”.
Parameters
n [int] Number of point events.
Returns
: array (n,2), n point coordinates.
pointpats.PoissonPointProcess
PoissonPointProcess.setup(self)Generate the number of events for each realization. If “conditioning” is False, all the event numbers arethe same; if it is True, the event number is a random variable following a Poisson distribution.
__init__(self, window, n, samples, conditioning=False, asPP=False)Initialize self. See help(type(self)) for accurate signature.
2.2.3 pointpats.PoissonClusterPointProcess
class pointpats.PoissonClusterPointProcess(window, n, parents, radius, samples,keep=False, asPP=False, condition-ing=False)
Poisson cluster point process (Neyman Scott). Two stages: 1. parent CSR process: 𝑁 -conditioned or 𝜆-conditioned. If parent events follow a 𝜆-conditioned CSR process, the number of parent events varies acrossrealizations. 2. child process: fixed number of points in circle centered on each parent.
Parameters
12 Chapter 2. API reference

pointpats Documentation, Release 2.0.0
window [Window] Bounding geometric object to contain point process realizations.
n [int] Size of each realization.
parents [int] Number of parents.
radius [float] Radius of the circle centered on each parent.
samples [list] Number of realizations.
asPP [bool] Control the data type of value in the “realizations” dictionary. If True, the data typeis point pattern as defined in pointpattern.py; if False, the data type is an two-dimensionalarray.
conditioning [bool] If True, use the 𝑙𝑎𝑚𝑏𝑑𝑎-conditioned CSR process for parent events, lead-ing to varied number of parent events across realizations; if False, use the 𝑁 -conditionedCSR process.
Examples
>>> import libpysal as ps>>> import numpy as np>>> from pointpats import Window>>> from libpysal.cg import shapely_ext
Open the virginia polygon shapefile
>>> va = ps.io.open(ps.examples.get_path("virginia.shp"))
Create the exterior polygons for VA from the union of the county shapes
>>> polys = [shp for shp in va]>>> state = shapely_ext.cascaded_union(polys)
Create window from virginia state boundary
>>> window = Window(state.parts)
1. Simulate a Poisson cluster process of size 200 with 10 parents and 20 children within 0.5 units of each parent(parent events: 𝑁 -conditioned CSR)
>>> np.random.seed(10)>>> samples1 = PoissonClusterPointProcess(window, 200, 10, 0.5, 1, asPP=True,→˓conditioning=False)>>> samples1.parameters # number of events for the realization{0: {'n': 200}}>>> samples1.num_parents #number of parent events for each realization{0: 10}>>> samples1.children # number of children events centered on each parent event20
2. Simulate a Poisson cluster process of size 200 with 10 parents and 20 children within 0.5 units of each parent(parent events: 𝜆-conditioned CSR)
>>> np.random.seed(10)>>> samples2 = PoissonClusterPointProcess(window, 200, 10, 0.5, 1, asPP=True,→˓conditioning=True)>>> samples2.parameters # number of events for the realization might not be equal→˓to 200
(continues on next page)
2.2. Point Processes 13
pointpats Documentation, Release 2.0.0
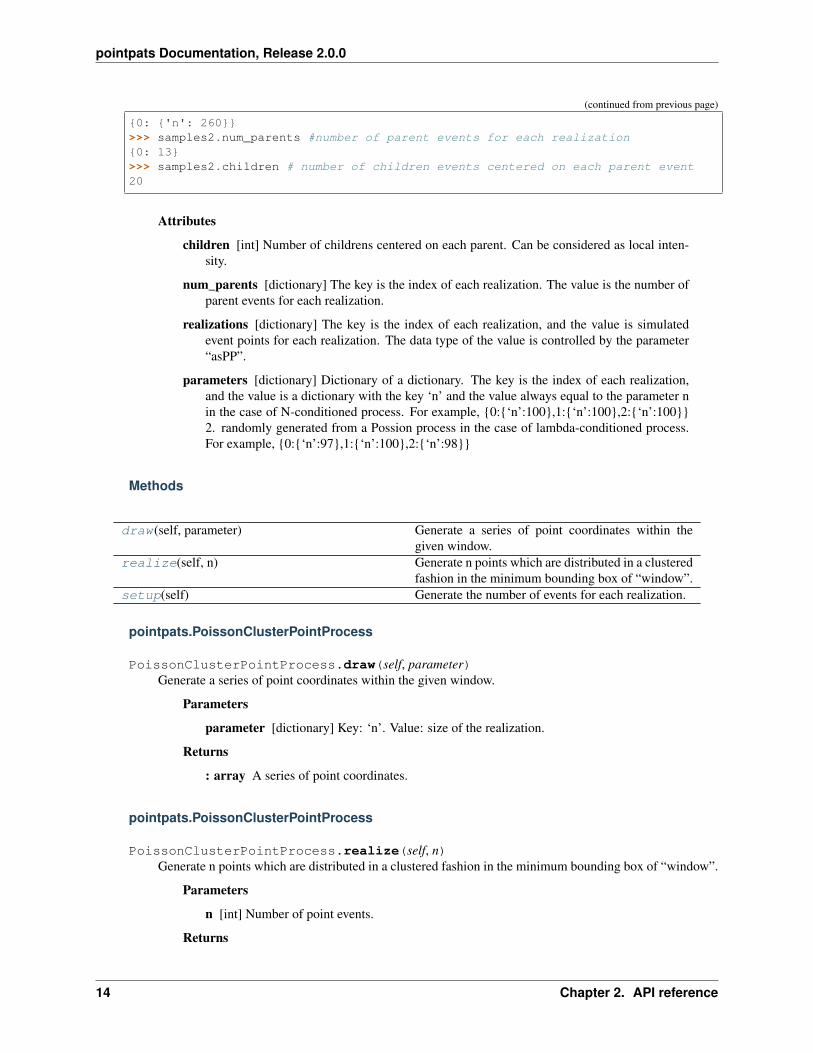
(continued from previous page)
{0: {'n': 260}}>>> samples2.num_parents #number of parent events for each realization{0: 13}>>> samples2.children # number of children events centered on each parent event20
Attributes
children [int] Number of childrens centered on each parent. Can be considered as local inten-sity.
num_parents [dictionary] The key is the index of each realization. The value is the number ofparent events for each realization.
realizations [dictionary] The key is the index of each realization, and the value is simulatedevent points for each realization. The data type of the value is controlled by the parameter“asPP”.
parameters [dictionary] Dictionary of a dictionary. The key is the index of each realization,and the value is a dictionary with the key ‘n’ and the value always equal to the parameter nin the case of N-conditioned process. For example, {0:{‘n’:100},1:{‘n’:100},2:{‘n’:100}}2. randomly generated from a Possion process in the case of lambda-conditioned process.For example, {0:{‘n’:97},1:{‘n’:100},2:{‘n’:98}}
Methods
draw(self, parameter) Generate a series of point coordinates within thegiven window.
realize(self, n) Generate n points which are distributed in a clusteredfashion in the minimum bounding box of “window”.
setup(self) Generate the number of events for each realization.
pointpats.PoissonClusterPointProcess
PoissonClusterPointProcess.draw(self, parameter)Generate a series of point coordinates within the given window.
Parameters
parameter [dictionary] Key: ‘n’. Value: size of the realization.
Returns
: array A series of point coordinates.
pointpats.PoissonClusterPointProcess
PoissonClusterPointProcess.realize(self, n)Generate n points which are distributed in a clustered fashion in the minimum bounding box of “window”.
Parameters
n [int] Number of point events.
Returns
14 Chapter 2. API reference
pointpats Documentation, Release 2.0.0
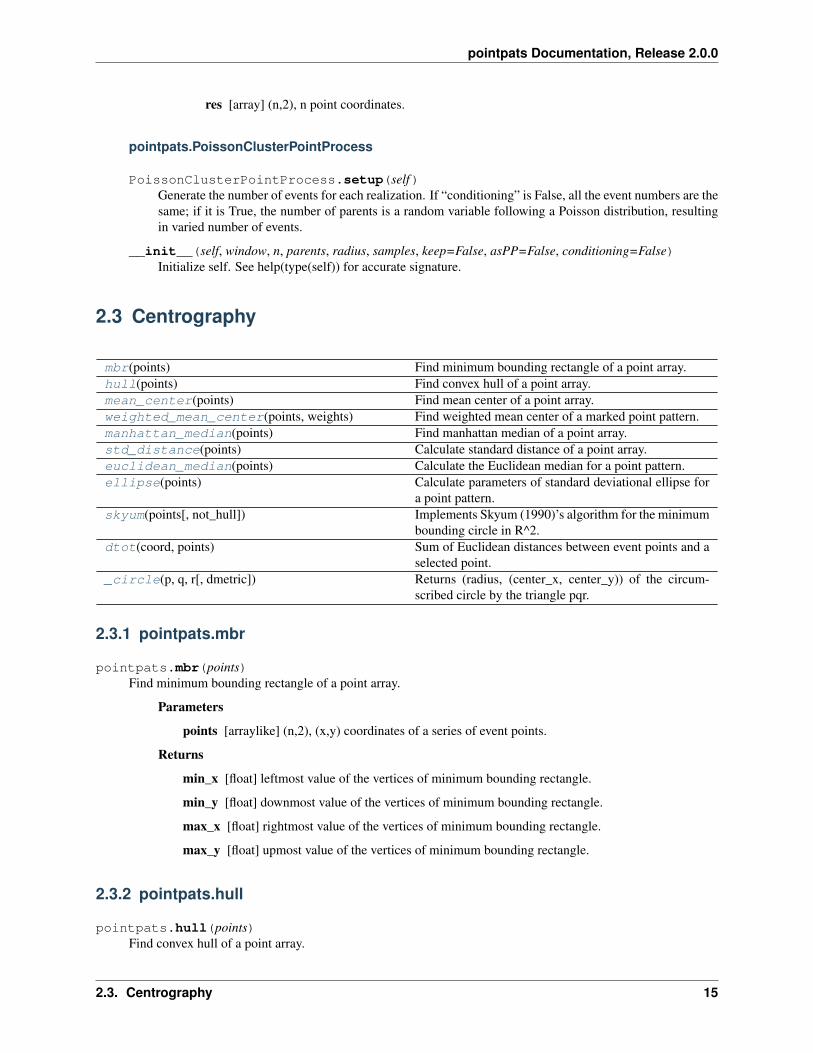
res [array] (n,2), n point coordinates.
pointpats.PoissonClusterPointProcess
PoissonClusterPointProcess.setup(self)Generate the number of events for each realization. If “conditioning” is False, all the event numbers are thesame; if it is True, the number of parents is a random variable following a Poisson distribution, resultingin varied number of events.
__init__(self, window, n, parents, radius, samples, keep=False, asPP=False, conditioning=False)Initialize self. See help(type(self)) for accurate signature.
2.3 Centrography
mbr(points) Find minimum bounding rectangle of a point array.hull(points) Find convex hull of a point array.mean_center(points) Find mean center of a point array.weighted_mean_center(points, weights) Find weighted mean center of a marked point pattern.manhattan_median(points) Find manhattan median of a point array.std_distance(points) Calculate standard distance of a point array.euclidean_median(points) Calculate the Euclidean median for a point pattern.ellipse(points) Calculate parameters of standard deviational ellipse for
a point pattern.skyum(points[, not_hull]) Implements Skyum (1990)’s algorithm for the minimum
bounding circle in R^2.dtot(coord, points) Sum of Euclidean distances between event points and a
selected point._circle(p, q, r[, dmetric]) Returns (radius, (center_x, center_y)) of the circum-
scribed circle by the triangle pqr.
2.3.1 pointpats.mbr
pointpats.mbr(points)Find minimum bounding rectangle of a point array.
Parameters
points [arraylike] (n,2), (x,y) coordinates of a series of event points.
Returns
min_x [float] leftmost value of the vertices of minimum bounding rectangle.
min_y [float] downmost value of the vertices of minimum bounding rectangle.
max_x [float] rightmost value of the vertices of minimum bounding rectangle.
max_y [float] upmost value of the vertices of minimum bounding rectangle.
2.3.2 pointpats.hull
pointpats.hull(points)Find convex hull of a point array.
2.3. Centrography 15

pointpats Documentation, Release 2.0.0
Parameters
points: arraylike (n,2), (x,y) coordinates of a series of event points.
Returns
_ [array] (h,2), points defining the hull in counterclockwise order.
2.3.3 pointpats.mean_center
pointpats.mean_center(points)Find mean center of a point array.
Parameters
points: arraylike (n,2), (x,y) coordinates of a series of event points.
Returns
_ [array] (2,), (x,y) coordinates of the mean center.
2.3.4 pointpats.weighted_mean_center
pointpats.weighted_mean_center(points, weights)Find weighted mean center of a marked point pattern.
Parameters
points [arraylike] (n,2), (x,y) coordinates of a series of event points.
weights [arraylike] a series of attribute values of length n.
Returns
_ [array] (2,), (x,y) coordinates of the weighted mean center.
2.3.5 pointpats.manhattan_median
pointpats.manhattan_median(points)Find manhattan median of a point array.
Parameters
points [arraylike] (n,2), (x,y) coordinates of a series of event points.
Returns
_ [array] (2,), (x,y) coordinates of the manhattan median.
2.3.6 pointpats.std_distance
pointpats.std_distance(points)Calculate standard distance of a point array.
Parameters
points [arraylike] (n,2), (x,y) coordinates of a series of event points.
Returns
_ [float] standard distance.
16 Chapter 2. API reference

pointpats Documentation, Release 2.0.0
2.3.7 pointpats.euclidean_median
pointpats.euclidean_median(points)Calculate the Euclidean median for a point pattern.
Parameters
points: arraylike (n,2), (x,y) coordinates of a series of event points.
Returns
_ [array] (2,), (x,y) coordinates of the Euclidean median.
2.3.8 pointpats.ellipse
pointpats.ellipse(points)Calculate parameters of standard deviational ellipse for a point pattern.
Parameters
points [arraylike] (n,2), (x,y) coordinates of a series of event points.
Returns
_ [float] semi-major axis.
_ [float] semi-minor axis.
theta [float] clockwise rotation angle of the ellipse.
Notes
Implements approach from:
https://www.icpsr.umich.edu/CrimeStat/files/CrimeStatChapter.4.pdf
2.3.9 pointpats.skyum
pointpats.skyum(points, not_hull=True)Implements Skyum (1990)’s algorithm for the minimum bounding circle in R^2.
0. Store points clockwise.
1. Find p in S that maximizes angle(prec(p), p, succ(p) THEN radius(prec(p), p, succ(p)). This is also calledthe lexicographic maximum, and is the last entry of a list of (radius, angle) in lexicographical order. 2a. Ifangle(prec(p), p, succ(p)) <= 90 degrees, then finish. 2b. If not, remove p from set.
2.3.10 pointpats.dtot
pointpats.dtot(coord, points)Sum of Euclidean distances between event points and a selected point.
Parameters
coord [arraylike] (x,y) coordinates of a point.
points [arraylike] (n,2), (x,y) coordinates of a series of event points.
Returns
2.3. Centrography 17

pointpats Documentation, Release 2.0.0
d [float] sum of Euclidean distances.
2.3.11 pointpats._circle
pointpats._circle(p, q, r, dmetric=<function euclidean at 0x7f55a53f80d0>)Returns (radius, (center_x, center_y)) of the circumscribed circle by the triangle pqr.
note, this does not assume that p!=q!=r
2.4 Quadrat Based Statistics
RectangleM (pp[, count_column, count_row, . . . ]) Rectangle grid structure for quadrat-based method.HexagonM (pp, lh) Hexagon grid structure for quadrat-based method.QStatistic(pp[, shape, nx, ny, lh, realizations]) Quadrat analysis of point pattern.
2.4.1 pointpats.RectangleM
class pointpats.RectangleM(pp, count_column=3, count_row=3, rectangle_width=0, rectan-gle_height=0)
Rectangle grid structure for quadrat-based method.
Parameters
pp [PointPattern] Point Pattern instance.
count_column [integer] Number of rectangles in the horizontal direction. Use in pair withcount_row to fully specify a rectangle. Incompatible with rectangle_width and rectan-gle_height.
count_row [integer] Number of rectangles in the vertical direction. Use in pair withcount_column to fully specify a rectangle. Incompatible with rectangle_width and rect-angle_height.
rectangle_width [float] Rectangle width. Use in pair with rectangle_height to fully specify arectangle. Incompatible with count_column & count_row.
rectangle_height [float] Rectangle height. Use in pair with rectangle_width to fully specify arectangle. Incompatible with count_column & count_row.
Attributes
pp [PointPattern] Point Pattern instance.
mbb [array] Minimum bounding box for the point pattern.
points [array] x,y coordinates of the point points.
count_column [integer] Number of columns.
count_row [integer] Number of rows.
num [integer] Number of rectangular quadrats.
Methods
18 Chapter 2. API reference
pointpats Documentation, Release 2.0.0
plot(self[, title]) Plot rectangle tessellation as well as the number ofpoints falling in each rectangle.
point_location_sta(self) Count the point events in each cell.
pointpats.RectangleM
RectangleM.plot(self, title=’Quadrat Count’)Plot rectangle tessellation as well as the number of points falling in each rectangle.
Parameters
title: str, optional Title of the plot. Default is “Quadrat Count”.
pointpats.RectangleM
RectangleM.point_location_sta(self)Count the point events in each cell.
Returns
dict_id_count [dict] keys: rectangle id, values: number of point events in each cell.
__init__(self, pp, count_column=3, count_row=3, rectangle_width=0, rectangle_height=0)Initialize self. See help(type(self)) for accurate signature.
2.4.2 pointpats.HexagonM
class pointpats.HexagonM(pp, lh)Hexagon grid structure for quadrat-based method.
Parameters
pp [PointPattern] Point Pattern instance.
lh [float] Hexagon length (hexagon).
Attributes
pp [PointPattern] Point Pattern instance.
h_length [float] Hexagon length (hexagon).
mbb [array] Minimum bounding box for the point pattern.
points [array] x,y coordinates of the point points.
h_length [float] Hexagon length (hexagon).
count_row_even [integer] Number of even rows.
count_row_odd [integer] Number of odd rows.
count_column [integer] Number of columns.
num [integer] Number of hexagonal quadrats.
Methods
2.4. Quadrat Based Statistics 19

pointpats Documentation, Release 2.0.0
plot(self[, title]) Plot hexagon quadrats as well as the number ofpoints falling in each quadrat.
point_location_sta(self) Count the point events in each hexagon cell.
pointpats.HexagonM
HexagonM.plot(self, title=’Quadrat Count’)Plot hexagon quadrats as well as the number of points falling in each quadrat.
Parameters
title: str, optional Title of the plot. Default is “Quadrat Count”.
pointpats.HexagonM
HexagonM.point_location_sta(self)Count the point events in each hexagon cell.
Returns
dict_id_count [dict] keys: rectangle id, values: number of point events in each hexagoncell.
__init__(self, pp, lh)Initialize self. See help(type(self)) for accurate signature.
2.4.3 pointpats.QStatistic
class pointpats.QStatistic(pp, shape=’rectangle’, nx=3, ny=3, lh=10, realizations=0)Quadrat analysis of point pattern.
Parameters
pp [PointPattern] Point Pattern instance.
shape [string] Grid structure. Either “rectangle” or “hexagon”. Default is “rectangle”.
nx [integer] Number of rectangles in the horizontal direction. Only when shape is specified as“rectangle” will nx be considered.
ny [integer] Number of rectangles in the vertical direction. Only when shape is specified as“rectangle” will ny be considered.
lh [float] Hexagon length (hexagon). Only when shape is specified as “hexagon” will lh beconsidered. Incompatible with nx & ny.
realizations [PointProcess] Point process instance with more than 1 point pattern realiza-tions which would be used for simulation based inference. Default is 0 where no simulationbased inference is performed.
Attributes
pp [PointPattern] Point Pattern instance.
mr [RectangleM or HexagonM ] RectangleM or HexagonM instance.
chi2 [float] Chi-squared test statistic for the observed point pattern pp.
df [integer] Degree of freedom.
20 Chapter 2. API reference

pointpats Documentation, Release 2.0.0
chi2_pvalue [float] p-value based on analytical chi-squared distribution.
chi2_r_pvalue [float] p-value based on simulated sampling distribution. Only available whenrealizations is correctly specified.
chi2_realizations [array] Chi-squared test statistics calculated for all of the simulated csr pointpatterns.
Methods
plot(self[, title]) Plot quadrats as well as the number of points fallingin each quadrat.
pointpats.QStatistic
QStatistic.plot(self, title=’Quadrat Count’)Plot quadrats as well as the number of points falling in each quadrat.
Parameters
title: str, optional Title of the plot. Default is “Quadrat Count”.
__init__(self, pp, shape=’rectangle’, nx=3, ny=3, lh=10, realizations=0)Initialize self. See help(type(self)) for accurate signature.
2.5 Distance Based Statistics
DStatistic(name) Abstract Base Class for distance statistics.G(pp[, intervals, dmin, dmax, d]) Estimates the nearest neighbor distance distribution
function G for a point pattern.F(pp[, n, intervals, dmin, dmax, d]) Estimates the empty space distribution function for a
point pattern: F(d).J(pp[, n, intervals, dmin, dmax, d]) Estimates the J function for a point pattern [LB96]K(pp[, intervals, dmin, dmax, d]) Estimates the K function for a point pattern.L(pp[, intervals, dmin, dmax, d]) Estimates the l function for a point pattern.Envelopes(*args, **kwargs) Abstract base class for simulation envelopes.Genv(pp[, intervals, dmin, dmax, d, pct, . . . ]) Simulation envelope for G function.Fenv(pp[, n, intervals, dmin, dmax, d, pct, . . . ]) Simulation envelope for F function.Jenv(pp[, n, intervals, dmin, dmax, d, pct, . . . ]) Simulation envelope for J function.Kenv(pp[, intervals, dmin, dmax, d, pct, . . . ]) Simulation envelope for K function.Lenv(pp[, intervals, dmin, dmax, d, pct, . . . ]) Simulation envelope for L function.
2.5.1 pointpats.DStatistic
class pointpats.DStatistic(name)Abstract Base Class for distance statistics.
Parameters
name [string] Name of the function. (“G”, “F”, “J”, “K” or “L”)
Attributes
2.5. Distance Based Statistics 21

pointpats Documentation, Release 2.0.0
d [array] The distance domain sequence.
Methods
plot(self[, qq]) Plot the distance function
pointpats.DStatistic
DStatistic.plot(self, qq=False)Plot the distance function
Parameters
qq: Boolean If False the statistic is plotted against distance. If Frue, the quantile-quantileplot is generated, observed vs. CSR.
__init__(self, name)Initialize self. See help(type(self)) for accurate signature.
2.5.2 pointpats.G
class pointpats.G(pp, intervals=10, dmin=0.0, dmax=None, d=None)Estimates the nearest neighbor distance distribution function G for a point pattern.
Parameters
pp [PointPattern] Point Pattern instance.
intervals [int] The length of distance domain sequence.
dmin [float] The minimum of the distance domain.
dmax [float] The maximum of the distance domain.
d [sequence] The distance domain sequence. If d is specified, intervals, dmin and dmax areignored.
Notes
In the analysis of planar point processes, the estimate of 𝐺 is typically compared to the value expected from acompletely spatial random (CSR) process given as:
𝐺(𝑑) = 1− 𝑒−𝜆𝜋𝑑2
where 𝜆 is the intensity (points per unit area) of the point process and 𝑑 is distance.
For a clustered pattern, the empirical function will be above the expectation, while for a uniform pattern theempirical function falls below the expectation.
Attributes
name [string] Name of the function. (“G”, “F”, “J”, “K” or “L”)
d [array] The distance domain sequence.
G [array] The cumulative nearest neighbor distance distribution over d.
22 Chapter 2. API reference

pointpats Documentation, Release 2.0.0
Methods
plot(self[, qq]) Plot the distance function
pointpats.G
G.plot(self, qq=False)Plot the distance function
Parameters
qq: Boolean If False the statistic is plotted against distance. If Frue, the quantile-quantileplot is generated, observed vs. CSR.
__init__(self, pp, intervals=10, dmin=0.0, dmax=None, d=None)Initialize self. See help(type(self)) for accurate signature.
2.5.3 pointpats.F
class pointpats.F(pp, n=100, intervals=10, dmin=0.0, dmax=None, d=None)Estimates the empty space distribution function for a point pattern: F(d).
Parameters
pp [PointPattern] Point Pattern instance.
n [int] Number of empty space points (random points).
intervals [int] The length of distance domain sequence.
dmin [float] The minimum of the distance domain.
dmax [float] The maximum of the distance domain.
d [sequence] The distance domain sequence. If d is specified, intervals, dmin and dmax areignored.
Notes
In the analysis of planar point processes, the estimate of 𝐹 is typically compared to the value expected from aprocess that displays complete spatial randomness (CSR):
𝐹 (𝑑) = 1− 𝑒−𝜆𝜋𝑑2
where 𝜆 is the intensity (points per unit area) of the point process and 𝑑 is distance.
The expectation is identical to the expectation for the G function for a CSR process. However, for a clustered pat-tern, the empirical G function will be below the expectation, while for a uniform pattern the empirical functionfalls above the expectation.
Attributes
d [array] The distance domain sequence.
G [array] The cumulative empty space nearest event distance distribution over d.
Methods
2.5. Distance Based Statistics 23
pointpats Documentation, Release 2.0.0
plot(self[, qq]) Plot the distance function
pointpats.F
F.plot(self, qq=False)Plot the distance function
Parameters
qq: Boolean If False the statistic is plotted against distance. If Frue, the quantile-quantileplot is generated, observed vs. CSR.
__init__(self, pp, n=100, intervals=10, dmin=0.0, dmax=None, d=None)Initialize self. See help(type(self)) for accurate signature.
2.5.4 pointpats.J
class pointpats.J(pp, n=100, intervals=10, dmin=0.0, dmax=None, d=None)Estimates the J function for a point pattern [LB96]
Parameters
pp [PointPattern] Point Pattern instance.
n [int] Number of empty space points (random points).
intervals [int] The length of distance domain sequence.
dmin [float] The minimum of the distance domain.
dmax [float] The maximum of the distance domain.
d [sequence] The distance domain sequence. If d is specified, intervals, dmin and dmax areignored.
Notes
The 𝐽 function is a ratio of the hazard functions defined for 𝐺 and 𝐹 :
𝐽(𝑑) =1−𝐺(𝑑)
1− 𝐹 (𝑑)
where 𝐺(𝑑) is the nearest neighbor distance distribution function (see G) and 𝐹 (𝑑) is the empty space function(see F).
For a CSR process the J function equals 1. Empirical values larger than 1 are indicative of uniformity, whilevalues below 1 suggest clustering.
Attributes
d [array] The distance domain sequence.
j [array] F function over d.
Methods
24 Chapter 2. API reference
pointpats Documentation, Release 2.0.0
plot(self[, qq]) Plot the distance function
pointpats.J
J.plot(self, qq=False)Plot the distance function
Parameters
qq: Boolean If False the statistic is plotted against distance. If Frue, the quantile-quantileplot is generated, observed vs. CSR.
__init__(self, pp, n=100, intervals=10, dmin=0.0, dmax=None, d=None)Initialize self. See help(type(self)) for accurate signature.
2.5.5 pointpats.K
class pointpats.K(pp, intervals=10, dmin=0.0, dmax=None, d=None)Estimates the K function for a point pattern.
Parameters
pp [PointPattern] Point Pattern instance.
intervals [int] The length of distance domain sequence.
dmin [float] The minimum of the distance domain.
dmax [float] The maximum of the distance domain.
d [sequence] The distance domain sequence. If d is specified, intervals, dmin and dmax areignored.
Attributes
d [array] The distance domain sequence.
j [array] K function over d.
Methods
plot(self[, qq]) Plot the distance function
pointpats.K
K.plot(self, qq=False)Plot the distance function
Parameters
qq: Boolean If False the statistic is plotted against distance. If Frue, the quantile-quantileplot is generated, observed vs. CSR.
__init__(self, pp, intervals=10, dmin=0.0, dmax=None, d=None)Initialize self. See help(type(self)) for accurate signature.
2.5. Distance Based Statistics 25

pointpats Documentation, Release 2.0.0
2.5.6 pointpats.L
class pointpats.L(pp, intervals=10, dmin=0.0, dmax=None, d=None)Estimates the l function for a point pattern.
Parameters
pp [PointPattern] Point Pattern instance.
intervals [int] The length of distance domain sequence.
dmin [float] The minimum of the distance domain.
dmax [float] The maximum of the distance domain.
d [sequence] The distance domain sequence. If d is specified, intervals, dmin and dmax areignored.
Attributes
d [array] The distance domain sequence.
l [array] L function over d.
Methods
plot(self) Plot the distance function
pointpats.L
L.plot(self)Plot the distance function
Parameters
qq: Boolean If False the statistic is plotted against distance. If Frue, the quantile-quantileplot is generated, observed vs. CSR.
__init__(self, pp, intervals=10, dmin=0.0, dmax=None, d=None)Initialize self. See help(type(self)) for accurate signature.
2.5.7 pointpats.Envelopes
class pointpats.Envelopes(*args, **kwargs)Abstract base class for simulation envelopes.
Parameters
pp [PointPattern] Point Pattern instance.
intervals [int] The length of distance domain sequence. Default is 10.
dmin [float] The minimum of the distance domain.
dmax [float] The maximum of the distance domain.
d [sequence] The distance domain sequence. If d is specified, intervals, dmin and dmax areignored.
pct [float] 1-alpha, alpha is the significance level. Default is 0.05, 1-alpha is the confidencelevel for the envelope.
26 Chapter 2. API reference

pointpats Documentation, Release 2.0.0
realizations: :class:‘.PointProcess‘ Point process instance with more than 1 realizations.
Attributes
name [string] Name of the function. (“G”, “F”, “J”, “K” or “L”)
observed [array] A 2-dimensional numpy array of 2 columns. The first column is the distancedomain sequence for the observed point pattern. The second column is the specific func-tion (“G”, “F”, “J”, “K” or “L”) over the distance domain sequence for the observed pointpattern.
low [array] A 1-dimensional numpy array. Lower bound of the simulation envelope.
high [array] A 1-dimensional numpy array. Higher bound of the simulation envelope.
mean [array] A 1-dimensional numpy array. Mean values of the simulation envelope.
Methods
calcmapperplot
__init__(self, *args, **kwargs)Initialize self. See help(type(self)) for accurate signature.
2.5.8 pointpats.Genv
class pointpats.Genv(pp, intervals=10, dmin=0.0, dmax=None, d=None, pct=0.05, realiza-tions=None)
Simulation envelope for G function.
Parameters
pp [PointPattern] Point Pattern instance.
intervals [int] The length of distance domain sequence. Default is 10.
dmin [float] The minimum of the distance domain.
dmax [float] Upper limit of distance range. If dmax is None, dmax will be set to maximumnearest neighbor distance.
d [sequence] The distance domain sequence. If d is specified, intervals, dmin and dmax areignored.
pct [float] 1-alpha, alpha is the significance level. Default is 0.05, which means 95% confidencelevel for the envelopes.
realizations: :class:‘.PointProcess‘ Point process instance with more than 1 realizations.
Examples
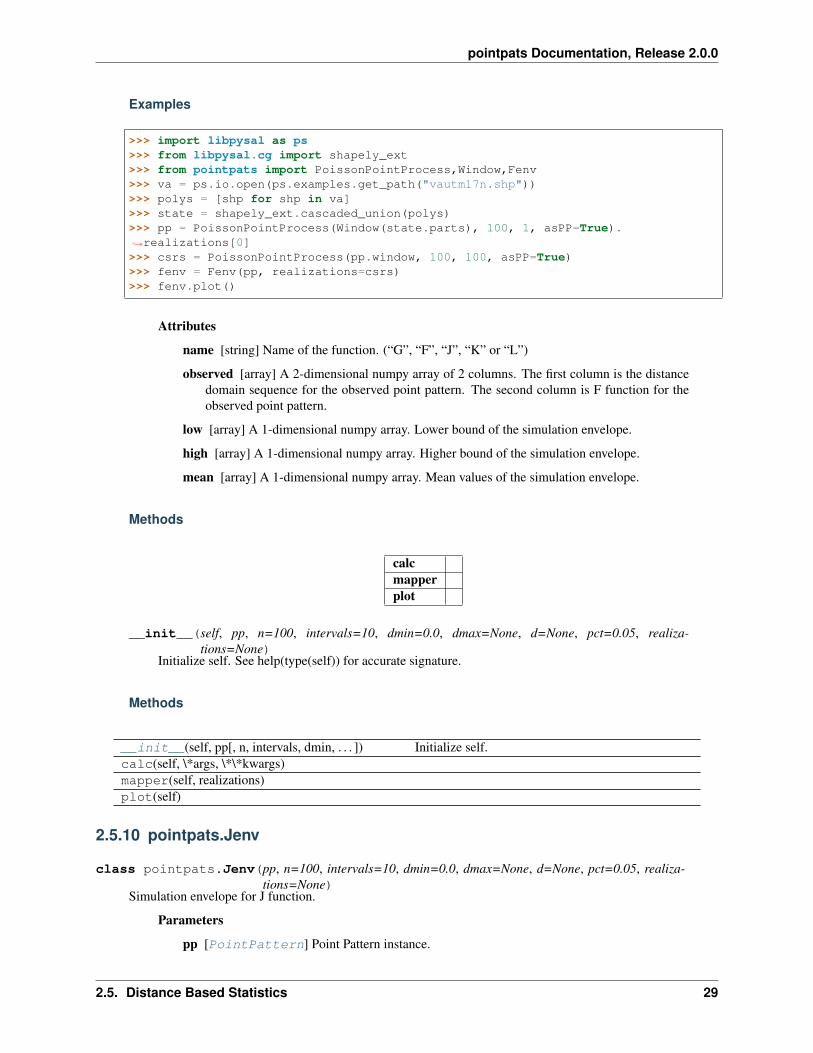
>>> import libpysal as ps>>> from pointpats import Genv, PoissonPointProcess, Window>>> from libpysal.cg import shapely_ext>>> va = ps.io.open(ps.examples.get_path("vautm17n.shp"))
(continues on next page)
2.5. Distance Based Statistics 27

pointpats Documentation, Release 2.0.0
(continued from previous page)
>>> polys = [shp for shp in va]>>> state = shapely_ext.cascaded_union(polys)>>> pp = PoissonPointProcess(Window(state.parts), 100, 1, asPP=True).→˓realizations[0]>>> csrs = PoissonPointProcess(pp.window, 100, 100, asPP=True)>>> genv_bb = Genv(pp, realizations=csrs)>>> genv_bb.plot()
Attributes
name [string] Name of the function. (“G”, “F”, “J”, “K” or “L”)
observed [array] A 2-dimensional numpy array of 2 columns. The first column is the distancedomain sequence for the observed point pattern. The second column is cumulative nearestneighbor distance distribution (G function) for the observed point pattern.
low [array] A 1-dimensional numpy array. Lower bound of the simulation envelope.
high [array] A 1-dimensional numpy array. Higher bound of the simulation envelope.
mean [array] A 1-dimensional numpy array. Mean values of the simulation envelope.
Methods
calcmapperplot
__init__(self, pp, intervals=10, dmin=0.0, dmax=None, d=None, pct=0.05, realizations=None)Initialize self. See help(type(self)) for accurate signature.
2.5.9 pointpats.Fenv
class pointpats.Fenv(pp, n=100, intervals=10, dmin=0.0, dmax=None, d=None, pct=0.05, realiza-tions=None)
Simulation envelope for F function.
Parameters
pp [PointPattern] Point Pattern instance.
n [int] Number of empty space points (random points).
intervals [int] The length of distance domain sequence. Default is 10.
dmin [float] The minimum of the distance domain.
dmax [float] Upper limit of distance range. If dmax is None, dmax will be set to maximumnearest neighbor distance.
d [sequence] The distance domain sequence. If d is specified, intervals, dmin and dmax areignored.
pct [float] 1-alpha, alpha is the significance level. Default is 0.05, which means 95% confidencelevel for the envelopes.
realizations: :class:‘.PointProcess‘ Point process instance with more than 1 realizations.
28 Chapter 2. API reference
pointpats Documentation, Release 2.0.0
Examples
>>> import libpysal as ps>>> from libpysal.cg import shapely_ext>>> from pointpats import PoissonPointProcess,Window,Fenv>>> va = ps.io.open(ps.examples.get_path("vautm17n.shp"))>>> polys = [shp for shp in va]>>> state = shapely_ext.cascaded_union(polys)>>> pp = PoissonPointProcess(Window(state.parts), 100, 1, asPP=True).→˓realizations[0]>>> csrs = PoissonPointProcess(pp.window, 100, 100, asPP=True)>>> fenv = Fenv(pp, realizations=csrs)>>> fenv.plot()
Attributes
name [string] Name of the function. (“G”, “F”, “J”, “K” or “L”)
observed [array] A 2-dimensional numpy array of 2 columns. The first column is the distancedomain sequence for the observed point pattern. The second column is F function for theobserved point pattern.
low [array] A 1-dimensional numpy array. Lower bound of the simulation envelope.
high [array] A 1-dimensional numpy array. Higher bound of the simulation envelope.
mean [array] A 1-dimensional numpy array. Mean values of the simulation envelope.
Methods
calcmapperplot
__init__(self, pp, n=100, intervals=10, dmin=0.0, dmax=None, d=None, pct=0.05, realiza-tions=None)
Initialize self. See help(type(self)) for accurate signature.
Methods
__init__(self, pp[, n, intervals, dmin, . . . ]) Initialize self.calc(self, \*args, \*\*kwargs)mapper(self, realizations)plot(self)
2.5.10 pointpats.Jenv
class pointpats.Jenv(pp, n=100, intervals=10, dmin=0.0, dmax=None, d=None, pct=0.05, realiza-tions=None)
Simulation envelope for J function.
Parameters
pp [PointPattern] Point Pattern instance.
2.5. Distance Based Statistics 29

pointpats Documentation, Release 2.0.0
n [int] Number of empty space points (random points).
intervals [int] The length of distance domain sequence. Default is 10.
dmin [float] The minimum of the distance domain.
dmax [float] Upper limit of distance range. If dmax is None, dmax will be set to maximumnearest neighbor distance.
d [sequence] The distance domain sequence. If d is specified, intervals, dmin and dmax areignored.
pct [float] 1-alpha, alpha is the significance level. Default is 0.05, which means 95% confidencelevel for the envelopes.
realizations: :class:‘.PointProcess‘ Point process instance with more than 1 realizations.
Examples
>>> import libpysal as ps>>> from pointpats import Jenv, PoissonPointProcess, Window>>> from libpysal.cg import shapely_ext>>> va = ps.io.open(ps.examples.get_path("vautm17n.shp"))>>> polys = [shp for shp in va]>>> state = shapely_ext.cascaded_union(polys)>>> pp = PoissonPointProcess(Window(state.parts), 100, 1, asPP=True).→˓realizations[0]>>> csrs = PoissonPointProcess(pp.window, 100, 100, asPP=True)>>> jenv = Jenv(pp, realizations=csrs)>>> jenv.plot()
Attributes
name [string] Name of the function. (“G”, “F”, “J”, “K” or “L”)
observed [array] A 2-dimensional numpy array of 2 columns. The first column is the distancedomain sequence for the observed point pattern. The second column is J function for theobserved point pattern.
low [array] A 1-dimensional numpy array. Lower bound of the simulation envelope.
high [array] A 1-dimensional numpy array. Higher bound of the simulation envelope.
mean [array] A 1-dimensional numpy array. Mean values of the simulation envelope.
Methods
calcmapperplot
__init__(self, pp, n=100, intervals=10, dmin=0.0, dmax=None, d=None, pct=0.05, realiza-tions=None)
Initialize self. See help(type(self)) for accurate signature.
30 Chapter 2. API reference

pointpats Documentation, Release 2.0.0
Methods
__init__(self, pp[, n, intervals, dmin, . . . ]) Initialize self.calc(self, \*args, \*\*kwargs)mapper(self, realizations)plot(self)
2.5.11 pointpats.Kenv
class pointpats.Kenv(pp, intervals=10, dmin=0.0, dmax=None, d=None, pct=0.05, realiza-tions=None)
Simulation envelope for K function.
Parameters
pp [PointPattern] Point Pattern instance.
intervals [int] The length of distance domain sequence. Default is 10.
dmin [float] The minimum of the distance domain.
dmax [float] Upper limit of distance range. If dmax is None, dmax will be set to maximumnearest neighbor distance.
d [sequence] The distance domain sequence. If d is specified, intervals, dmin and dmax areignored.
pct [float] 1-alpha, alpha is the significance level. Default is 0.05, which means 95% confidencelevel for the envelope.
realizations: :class:‘.PointProcess‘ Point process instance with more than 1 realizations.
Examples
>>> import libpysal as ps>>> from pointpats import Kenv, PoissonPointProcess, Window>>> from libpysal.cg import shapely_ext>>> va = ps.io.open(ps.examples.get_path("vautm17n.shp"))>>> polys = [shp for shp in va]>>> state = shapely_ext.cascaded_union(polys)>>> pp = PoissonPointProcess(Window(state.parts), 100, 1, asPP=True).→˓realizations[0]>>> csrs = PoissonPointProcess(pp.window, 100, 100, asPP=True)>>> kenv = Kenv(pp, realizations=csrs)>>> kenv.plot()
Attributes
name [string] Name of the function. (“G”, “F”, “J”, “K” or “L”)
observed [array] A 2-dimensional numpy array of 2 columns. The first column is the distancedomain sequence for the observed point pattern. The second column is K function for theobserved point pattern.
low [array] A 1-dimensional numpy array. Lower bound of the simulation envelope.
high [array] A 1-dimensional numpy array. Higher bound of the simulation envelope.
mean [array] A 1-dimensional numpy array. Mean values of the simulation envelope.
2.5. Distance Based Statistics 31
pointpats Documentation, Release 2.0.0
Methods
calcmapperplot
__init__(self, pp, intervals=10, dmin=0.0, dmax=None, d=None, pct=0.05, realizations=None)Initialize self. See help(type(self)) for accurate signature.
Methods
__init__(self, pp[, intervals, dmin, dmax, . . . ]) Initialize self.calc(self, \*args, \*\*kwargs)mapper(self, realizations)plot(self)
2.5.12 pointpats.Lenv
class pointpats.Lenv(pp, intervals=10, dmin=0.0, dmax=None, d=None, pct=0.05, realiza-tions=None)
Simulation envelope for L function.
Parameters
pp [PointPattern] Point Pattern instance.
intervals [int] The length of distance domain sequence. Default is 10.
dmin [float] The minimum of the distance domain.
dmax [float] Upper limit of distance range. If dmax is None, dmax will be set to maximumnearest neighbor distance.
d [sequence] The distance domain sequence. If d is specified, intervals, dmin and dmax areignored.
pct [float] 1-alpha, alpha is the significance level. Default is 0.05, which means 95% confidencelevel for the envelopes.
realizations: :class:‘.PointProcess‘ Point process instance with more than 1 realizations.
Examples
>>> import libpysal as ps>>> from pointpats import Lenv, PoissonPointProcess, Window>>> from libpysal.cg import shapely_ext>>> va = ps.io.open(ps.examples.get_path("vautm17n.shp"))>>> polys = [shp for shp in va]>>> state = shapely_ext.cascaded_union(polys)>>> pp = PoissonPointProcess(Window(state.parts), 100, 1, asPP=True).→˓realizations[0]>>> csrs = PoissonPointProcess(pp.window, 100, 100, asPP=True)>>> lenv = Lenv(pp, realizations=csrs)>>> lenv.plot()
32 Chapter 2. API reference

pointpats Documentation, Release 2.0.0
Attributes
name [string] Name of the function. (“G”, “F”, “J”, “K” or “L”)
observed [array] A 2-dimensional numpy array of 2 columns. The first column is the distancedomain sequence for the observed point pattern. The second column is L function for theobserved point pattern.
low [array] A 1-dimensional numpy array. Lower bound of the simulation envelope.
high [array] A 1-dimensional numpy array. Higher bound of the simulation envelope.
mean [array] A 1-dimensional numpy array. Mean values of the simulation envelope.
Methods
calcmapperplot
__init__(self, pp, intervals=10, dmin=0.0, dmax=None, d=None, pct=0.05, realizations=None)Initialize self. See help(type(self)) for accurate signature.
Methods
__init__(self, pp[, intervals, dmin, dmax, . . . ]) Initialize self.calc(self, \*args, \*\*kwargs)mapper(self, realizations)plot(self)
2.6 Window functions
Window(parts[, holes]) Geometric container for point patterns.as_window(pysal_polygon) Convert a libpysal polygon to a Window.poly_from_bbox(bbox)to_ccf(poly)
2.6.1 pointpats.Window
class pointpats.Window(parts, holes=[])Geometric container for point patterns.
A window is used to define the area over which the pattern is observed. This area is used in estimating theintensity of the point pattern. See PointPattern.lambda_window.
Parameters
parts: sequence A sequence of rings which bound the positive space point pattern.
holes: sequence A sequence of rings which bound holes in the polygons that bound the pointpattern.
Attributes
2.6. Window functions 33
pointpats Documentation, Release 2.0.0
area Returns the area of the polygon.
bbox Returns the bounding box of the polygon as a list
bounding_box Returns the bounding box of the polygon.
centroid Returns the centroid of the polygon
holes Returns the holes of the polygon in clockwise order.
len Returns the number of vertices in the polygon.
parts Returns the parts of the polygon in clockwise order.
perimeter Returns the perimeter of the polygon.
vertices Returns the vertices of the polygon in clockwise order.
Methods
build_quad_tree_structure(self) Build the quad tree structure for this polygon.contains_point(self, point) Test if polygon contains point
pointpats.Window
Window.build_quad_tree_structure(self)Build the quad tree structure for this polygon. Once the structure is built, speed for testing if a point isinside the ring will be inscreased significantly. :return:
pointpats.Window
Window.contains_point(self, point)Test if polygon contains point
Notes
Points falling exactly on polygon edges may yield unpredictable results
Examples
>>> p = Polygon([Point((0,0)), Point((4,0)), Point((4,5)), Point((2,3)),→˓Point((0,5))])>>> p.contains_point((3,3))1>>> p.contains_point((0,6))0>>> p.contains_point((2,2.9))1>>> p.contains_point((4,5))0>>> p.contains_point((4,0))0>>>
Handles holes
34 Chapter 2. API reference
pointpats Documentation, Release 2.0.0
>>> p = Polygon([Point((0, 0)), Point((0, 10)), Point((10, 10)), Point((10,→˓0))], [Point((2, 2)), Point((4, 2)), Point((4, 4)), Point((2, 4))])>>> p.contains_point((3.0,3.0))False>>> p.contains_point((1.0,1.0))True>>>
filter_contained
__init__(self, parts, holes=[])Returns a polygon created from the objects specified.
__init__(Point list or list of Point lists, holes list ) -> Polygon
Parameters
vertices [list – a list of vertices or a list of lists of vertices.]
holes [list – a list of sub-polygons to be considered as holes.]
is_quad_tree_structure_built : bool – record if the quad tree structure has been built forthis polygon. This quad tree structure could help speed up the contains_point test
Examples
>>> p1 = Polygon([Point((0, 0)), Point((1, 0)), Point((1, 1)), Point((0, 1))])
2.6.2 pointpats.as_window
pointpats.as_window(pysal_polygon)Convert a libpysal polygon to a Window.
Parameters
pysal_polygon: libpysal.cg.shapes.Polygon libpysal Polygon instance.
Returns
Window A Window instance.
2.6.3 pointpats.poly_from_bbox
pointpats.poly_from_bbox(bbox)
2.6.4 pointpats.to_ccf
pointpats.to_ccf(poly)
2.6. Window functions 35

pointpats Documentation, Release 2.0.0
36 Chapter 2. API reference
CHAPTER
THREE
REFERENCES
37
pointpats Documentation, Release 2.0.0
38 Chapter 3. References

BIBLIOGRAPHY
[LB96] M. N. M. Lieshout and A. J. Baddeley. A nonparametric measure of spatial interaction in point patterns.Statistica Neerlandica, 50(3):344–361, 1996. doi:10.1111/j.1467-9574.1996.tb01501.x.
39

pointpats Documentation, Release 2.0.0
40 Bibliography

INDEX
Symbols__init__() (pointpats.DStatistic method), 22__init__() (pointpats.Envelopes method), 27__init__() (pointpats.F method), 24__init__() (pointpats.Fenv method), 29__init__() (pointpats.G method), 23__init__() (pointpats.Genv method), 28__init__() (pointpats.HexagonM method), 20__init__() (pointpats.J method), 25__init__() (pointpats.Jenv method), 30__init__() (pointpats.K method), 25__init__() (pointpats.Kenv method), 32__init__() (pointpats.L method), 26__init__() (pointpats.Lenv method), 33__init__() (pointpats.PointPattern method), 9__init__() (pointpats.PointProcess method), 10__init__() (pointpats.PoissonClusterPointProcess
method), 15__init__() (pointpats.PoissonPointProcess method),
12__init__() (pointpats.QStatistic method), 21__init__() (pointpats.RectangleM method), 19__init__() (pointpats.Window method), 35_circle() (in module pointpats), 18
Aas_window() (in module pointpats), 35
Bbuild_quad_tree_structure() (point-
pats.Window method), 34
Ccontains_point() (pointpats.Window method), 34
Ddraw() (pointpats.PointProcess method), 10draw() (pointpats.PoissonClusterPointProcess
method), 14draw() (pointpats.PoissonPointProcess method), 12DStatistic (class in pointpats), 21
dtot() (in module pointpats), 17
Eellipse() (in module pointpats), 17Envelopes (class in pointpats), 26euclidean_median() (in module pointpats), 17explode() (pointpats.PointPattern method), 6
FF (class in pointpats), 23Fenv (class in pointpats), 28find_pairs() (pointpats.PointPattern method), 7flip_coordinates() (pointpats.PointPattern
method), 7
GG (class in pointpats), 22Genv (class in pointpats), 27get_window() (pointpats.PointPattern method), 7
HHexagonM (class in pointpats), 19hull() (in module pointpats), 15
JJ (class in pointpats), 24Jenv (class in pointpats), 29
KK (class in pointpats), 25Kenv (class in pointpats), 31knn() (pointpats.PointPattern method), 7knn_other() (pointpats.PointPattern method), 7
LL (class in pointpats), 26Lenv (class in pointpats), 32
Mmanhattan_median() (in module pointpats), 16mbr() (in module pointpats), 15
41

pointpats Documentation, Release 2.0.0
mean_center() (in module pointpats), 16
Pplot() (pointpats.DStatistic method), 22plot() (pointpats.F method), 24plot() (pointpats.G method), 23plot() (pointpats.HexagonM method), 20plot() (pointpats.J method), 25plot() (pointpats.K method), 25plot() (pointpats.L method), 26plot() (pointpats.PointPattern method), 8plot() (pointpats.QStatistic method), 21plot() (pointpats.RectangleM method), 19point_location_sta() (pointpats.HexagonM
method), 20point_location_sta() (pointpats.RectangleM
method), 19PointPattern (class in pointpats), 5PointProcess (class in pointpats), 9PoissonClusterPointProcess (class in point-
pats), 12PoissonPointProcess (class in pointpats), 10poly_from_bbox() (in module pointpats), 35
QQStatistic (class in pointpats), 20
Rrealize() (pointpats.PoissonClusterPointProcess
method), 14realize() (pointpats.PoissonPointProcess method),
12RectangleM (class in pointpats), 18
Ssetup() (pointpats.PoissonClusterPointProcess
method), 15setup() (pointpats.PoissonPointProcess method), 12skyum() (in module pointpats), 17std_distance() (in module pointpats), 16summary() (pointpats.PointPattern method), 8superimpose() (pointpats.PointPattern method), 8
Tto_ccf() (in module pointpats), 35
Uunique() (pointpats.PointPattern method), 9
Wweighted_mean_center() (in module pointpats),
16Window (class in pointpats), 33
42 Index


