+ All Categories
Home > Documents > Reliability Assessment of Subsea X-mas Tree Configurations

Reliability Assessment of Subsea X-mas Tree Configurations

Date post: 30-Dec-2016
Category:
Upload: nguyenduong
View: 237 times
Download: 0 times
Share this document with a friend
65
Reliability Assessment of Subsea X-mas Tree Configurations Petter Gullhav Wanvik Subsea Technology Supervisor: Anne Barros, IPK Co-supervisor: Marvin Rausand, IPK Department of Production and Quality Engineering Submission date: June 2015 Norwegian University of Science and Technology
Transcript

Reliability Assessment of Subsea X-mas Tree Configurations

Petter Gullhav Wanvik

Subsea Technology

Supervisor: Anne Barros, IPKCo-supervisor: Marvin Rausand, IPK

Department of Production and Quality Engineering

Submission date: June 2015

Norwegian University of Science and Technology

i

Preface

This work is my master thesis. This was done at the Department of Production and Quality

Engineering at the Norwegian University of Science and Technology (NTNU) as a part of the

study program Subsea Technology. It was written during the spring semester 2015.

The thesis has been guided and supervised by Professor Marvin Rausand and Professor Anne

Barros at the Department of Production and Quality Engineering at NTNU.

During the writing of this thesis some help and guidance have been provided by Endre Will-

mann working with technical assurance at GE Oil & Gas.

The reader of this report should have a basic understanding of oil and gas production in a

subsea production system. The reader should also have an understanding of reliability and reli-

ability analysis.

Trondheim, 10-06-2015

. . . . . . . . . . . . . . . . . . . . . . . . . . . . . . . . . . . .

Petter Gullhav Wanvik

iii

Acknowledgment

I would like to thank my supervisor Professor Marvin Rausand for his help during the writing

of this thesis. He retired one month before submission, but provided very helpful guidance and

support before that.

I would also thank Endre Willmann at GE Oil & Gas and Professor Anne Barros at NTNU for

their input.

P.G.W.

iv

Executive Summary

The focus of this thesis is to provide input for choosing the optimal X-mas Tree (XT) configura-

tion for a subsea production system.

The subsea XT is used to direct, regulate, and stop the flow from a well. These functions and

some more are achieved through several valves, a subsea control module, and some sensors.

The choke valve has the worst inherent reliability of the components on a XT. Because of this

the choke valve is designed for easy retrieval. The choke valve could also be placed in a separate

flow control module. The subsea control module is the XT component with the second worst

reliability. Both these components are modules because it is good method of improving system

maintenance of unreliable components.

The main XT configurations are the vertical XT, the horizontal XT, and the deepwater vertical

XT. The main differences are how the main valves are placed and how the tubing with tubing

hanger is installed.

In subsea reliability it is common to use mean time to failure as a performance indicator and

the exponential distribution to model lifetimes.

A Reliability, Availability, and Maintainability (RAM) analysis is frequently used to analyze

the subsea production system. RAM analysis software use reliability block diagrams, flow dia-

grams, and Monte Carlos next event simulation to simulate the lifetime and the availability of

the subsea production system.

Two main sources of reliability data for subsea components are OREDA (2009) and Molnes

and Strand (2007). When applying component reliability data in a RAM analysis, this often give

a lower availability than experienced in real life. This could relate to how, from when, or from

where the data are collected. Expert judgment can be used to calibrate the data so that the

model fit the real life scenario. The sensitivity and uncertainty of assumptions and the analysis

should also be considered. The model and analysis can then be used to optimize the reliability

of the design.

In OREDA (2009) the vertical XT has a lower inherent reliability than the horizontal XT. The

low reliability may relate to the large share of older generation vertical XTs installed. Under-

standing the quality of the data is difficult and decisions should not be taken solely on the basis

v

of unprocessed data.

A key difference between the XT configurations is the maintainability of the tree and the tub-

ing. Wells that are expected to have many tubing failures should be equipped with a horizontal

XT and a vertical XT should be on a well with few tubing failures. This is mainly due to the or-

der of which the components are installed as the HXT allows the tubing to be retrieved without

retrieving the tree and vice versa for the VXT.

A failure on the wellhead connector will have a large impact on the availability. Interventions

on the horizontal XT are done with a blowout preventer. The height of both these components

puts more strain on the wellhead than the other XT configurations. Tripping out tubing is one

of the more dangerous operations in a well; this combined with the extra strain on the wellhead

may cause bad consequences. This may give an advantage for the VXT in a risk perspective.

A horizontal XT with a flow control module will have improved maintainability, but this adds

potential leak paths and makes the design more complex. The vertical XT and deepwater vertical

XT are easier to retrieve and may be better off with a simpler design without the flow control

module.

The deepwater vertical XT is easier to maintain than a vertical XT. It may be a good choice

of configuration for wells with a medium amount of tubing failures. The DVXT is more com-

plex and has more leak paths than the other two configurations and may have a higher infant

mortality because of this.

OneSubsea (2015) help their customers choose XT configuration with a tree selector tool.

Ranking the importance of different aspects give an output of how the XT configurations fit this

ranking. This gives a good indication of which configuration to choose for a well.

CAPEX and OPEX are important factors in the decision process.

A RAM analysis would give an overall look on the reliability and life cycle cost of the subsea

production system. RAM analysis software is able to process the many varying factors that im-

pact the optimal XT configuration for a subsea production system and should be the foundation

of the decision process.

vi

Sammendrag

Fokus for denne masteroppgaven er å optimalisere valg av juletre konfigurasjon for et under-

vanns petroleums produksjons system.

Et undervanns juletre leder, regulerer og kan stoppe en brønn. Disse funksjonene og noen

til gjøres a flere ventiler, en kontroll modul og noen sensorer.

På et juletre er strupeventilen komponenten med dårligst pålitelighet. Derfor er den de-

signet for og lett kunne bli erstattet. Strupeventilen kan også bli plassert i en egen flyt kontroll

modul. Undervanns kontroll modulen er juletre komponenten med nest dårligst pålitelighet.

Plassering av upålitelige komponenter i moduler er en god metode å forenkle vedlikehold.

De tre konfigurasjonene av juletrær er vertikale, horisontale og dypvanns vertikale juletrær.

Hovedforskjellen er hvordan ventilene er plassert og hvordan tubing og tubing hengeren er in-

stallert.

I pålitelighet på undervanns komponenter er den vanligste ytelsesindikatoren gjennomsnit-

tlig tid til feil (Mean Time To Failure) og den vanligste livstid modellen er eksponential fordelin-

gen.

En pålitelighet, tilgjengelighet og vedlikeholdsvennlighet (RAM) analyse er en vanlig måte å

analysere et undervanns produksjons system. En RAM analyse bruker pålitelighets blokk dia-

gram, flyt diagram og Monte Carlo neste hendelse simulering for å simulere livsløpet og tilgjen-

geligheten til et undervanns produksjons system.

To kilder til pålitelighets data for undervanns komponenter er OREDA (2009) og Molnes and

Strand (2007). Når komponent pålitelighetsdata blir brukt i en RAM analyse kan det gi en lavere

systemtilgjengelighet enn i virkeligheten. Dette kan stamme fra hvordan, fra når og fra hvor

dataen er innhentet. Ekspertvurderinger kan bruker til å kalibrere dataen sånn at modellen

blir mer lik virkeligheten. Usikkerheten og sensitiviteten til antagelsene burde være vurdert.

Modellen og analysen kan så brukes til å optimere påliteligheten til et design.

Det vertikale treet har i OREDA (2009) en lavere pålitelighet enn det horisontale treet. Den

lavere påliteligheten kan stamme fra den store andelen av eldre vertikale trær som er installert.

En god forståelse av kvaliteten av dataen er vanskelig, derfor burde beslutninger ikke tas bare på

grunnlag av slik data.

vii

En viktig forskjell på juletre konfigurasjonene er hvor vedlikeholds vennlig treet og tubingen

er. Brønner som forventes å ha mange tubing feil burde ha horisontalt trær og vertikale trær

burde være på brønner som forventer få tubing feil. Dette kommer fra rekkefølgen tubing og tre

blir installert i siden det horisontale treet tillater at tubingen kan trekkes uten at treet trekker og

motsatt for vertikale trær.

En skade på brønnhodekoblingen vil ha en stor påvirkning på tilgjengeligheten. Interven-

sjoner på horisontale trær gjennomføres med en utblåsningsventil på toppen av treet. Høyden

av disse komponentene utgjør større krefter på brønnhodet enn hos de andre juletre konfig-

urasjonene. Utkjøring av tubing er en av de farligste aksjonene i en brønn; dette kombinert

med ekstra krefter på brønnhodet kan føre til dårlige konsekvenser. Dette kan gi en fordel til det

vertikale treet i et risiko perspektiv.

Et horisontalt tre med en flyt kontroll modul vil ha en forbedret vedlikeholds vennlighet,

men modulen gir flere potensielle lekkasjeveier og gjør designet mer komplekst. Det vertikale

og dypvanns vertikale treet er lettere å ta opp for vedlikehold og kan være bedre tjent med et

enklere design uten flyt kontroll modulen.

Dypvannstreet er enklere å vedlikeholde enn det vertikale. Det kan være et godt valg av kon-

figurasjon for brønner med et medium antall tubingfeil. Dypvannstreet har et mer kompleks

design med flere lekasjeveier enn de andre to konfigurasjonene og kan ha en høyere initiell feil-

rate på grunn av dette.

OneSubsea (2015) hjelper kundene sine med å velge juletre konfigurasjon med et eget verk-

tøy. Rangering av viktigheten til forskjellige aspekter gir et resultat med hvordan hver av de tre

konfigurasjonene passer til denne rangeringen. Dette gir en god indikasjon for hvilket valg som

er best for brønnen.

Innvesterings og operasjonskostnader er viktige faktorer i valget av konfigurasjon.

En RAM analyse vil gi et overblikk på påliteligheten og livstidskostnadene til et undervanns

produksjons system. En data RAM analyse kan prosessere de mange variablene som påvirker

den optimale juletre konfigurasjonen for et undervanns produksjons system og burde være

grunnlaget i en beslutningsprosess.

Contents

Preface . . . . . . . . . . . . . . . . . . . . . . . . . . . . . . . . . . . . . . . . . . . . . . . . i

Acknowledgment . . . . . . . . . . . . . . . . . . . . . . . . . . . . . . . . . . . . . . . . . . iii

Executive Summary . . . . . . . . . . . . . . . . . . . . . . . . . . . . . . . . . . . . . . . . iv

Sammendrag . . . . . . . . . . . . . . . . . . . . . . . . . . . . . . . . . . . . . . . . . . . . vi

1 Introduction 3

1.1 Background . . . . . . . . . . . . . . . . . . . . . . . . . . . . . . . . . . . . . . . . . . 3

1.2 Objectives . . . . . . . . . . . . . . . . . . . . . . . . . . . . . . . . . . . . . . . . . . . 4

1.3 Limitations . . . . . . . . . . . . . . . . . . . . . . . . . . . . . . . . . . . . . . . . . . . 5

1.4 Approach . . . . . . . . . . . . . . . . . . . . . . . . . . . . . . . . . . . . . . . . . . . . 5

1.5 Structure of the Report . . . . . . . . . . . . . . . . . . . . . . . . . . . . . . . . . . . . 6

2 X-Mas Tree Function, Components, and Configurations 7

2.1 Functions of a X-Mas Tree . . . . . . . . . . . . . . . . . . . . . . . . . . . . . . . . . . 7

2.2 Main Components of a X-Mas Tree . . . . . . . . . . . . . . . . . . . . . . . . . . . . . 11

2.3 The Main X-Mas Tree Configurations . . . . . . . . . . . . . . . . . . . . . . . . . . . 15

3 Approaches to Reliability Assessment 21

3.1 Measures of Reliability . . . . . . . . . . . . . . . . . . . . . . . . . . . . . . . . . . . . 21

3.2 Reliability System Analysis . . . . . . . . . . . . . . . . . . . . . . . . . . . . . . . . . . 22

3.3 Reliability Data . . . . . . . . . . . . . . . . . . . . . . . . . . . . . . . . . . . . . . . . 25

4 Qualitative Reliability Analysis of X-Mas Tree Configurations 29

4.1 What to Assess . . . . . . . . . . . . . . . . . . . . . . . . . . . . . . . . . . . . . . . . . 29

4.2 Vertical X-Mas Tree . . . . . . . . . . . . . . . . . . . . . . . . . . . . . . . . . . . . . . 32

viii

CONTENTS 1

4.3 Horizontal X-Mas Tree . . . . . . . . . . . . . . . . . . . . . . . . . . . . . . . . . . . . 33

4.4 Deepwater Vertical X-Mas Tree . . . . . . . . . . . . . . . . . . . . . . . . . . . . . . . 35

5 Qualitative Comparison of X-Mas Tree Configurations 37

5.1 OneSubsea Tree Selector Tool . . . . . . . . . . . . . . . . . . . . . . . . . . . . . . . . 37

5.2 Cost . . . . . . . . . . . . . . . . . . . . . . . . . . . . . . . . . . . . . . . . . . . . . . . 38

6 Evaluation of X-Mas Tree Configurations 41

7 Summary 43

7.1 Summary and Conclusions . . . . . . . . . . . . . . . . . . . . . . . . . . . . . . . . . 43

7.2 Discussion . . . . . . . . . . . . . . . . . . . . . . . . . . . . . . . . . . . . . . . . . . . 46

7.3 Recommendations for Further Work . . . . . . . . . . . . . . . . . . . . . . . . . . . . 47

A Acronyms 49

B Definitions 51

Bibliography 53

Chapter 1

Introduction

1.1 Background

The number of subsea production systems has increased a lot since 1990 (Bai and Bai, 2012).

"The market will see orders for over 3,000 new subsea trees through 2017 (>60% growth from 2008-

2012). Deep and ultra deepwater subsea demand is expected to increase by 90% through 2017

compared to the previous five years" (Quest Offshore, 2013).

Oil and gas development is also being explored in the arctic. Due to ice and icebergs, subsea

production systems are the only viable methods in some areas. This would require very reliable

and safe systems due to the inaccessibility during the winter, both for maintenance and miti-

gation of a potential blowout. The arctic ecosystem is fragile and an oil spill could have a large

impact. Safe and reliable subsea production systems will therefore become more and more im-

portant.

The Åsgard subsea field on the Norwegian Continental Shelf has a lifetime of 20 years, some

parts up to 40 years. The equipment is therefore designed for 20 years or 30 years (Østebø et al.,

2001).

For a subsea oil and gas field repair and intervention are expensive due to unavailability of

the production and mobilization times for vessels. Therefore the lost production and interven-

tion costs are a big part of the life cycle cost of a subsea well (Brandt and Eriksen, 2001).

The subsea X-mas Tree (XT) is an essential part of a subsea production system. There are

lots of possible configurations and equipment provided from different suppliers. The XT comes

3

CHAPTER 1. INTRODUCTION 4

in different variants and often requires detailed engineering for each project. With the decrease

in the oil price the last year there is an increased demand for standardized solutions.

The main companies supplying subsea XTs are FMC Technologies, Aker Solutions, OneSub-

sea, and GE Oil & Gas, market share in that order (Quest Offshore, 2013). Oil producing com-

panies come to the suppliers with an increased focus on reliability and standardized products.

Therefore it is important to both the oil companies and the suppliers to have a good under-

standing of the XT configurations and what the best solution for a specific field is.

The overall reliability of XTs is mostly not a big problem; the interesting part is the difference

in reliability between the main configurations of XTs which is the focus of this master thesis.

In this thesis there are two main sources of information on XTs that overlap to some extent.

Most references are made to Bai and Bai (2012) because this is the most recent. Similar informa-

tion can also be found in Richbourg and Winter (1998). Golan and Sangesland (1993) is a third

even older source has also provided some useful information on the XT.

Previously a master thesis has addressed the reliability of the deepwater vertical XT from GE

Oil & Gas (Stendebakken, 2014). The thesis focus on a single tree and its retrieval rate, this thesis

has been used as a source for reliability data and description the deepwater vertical XT from GE.

The main source on the topic reliability is Rausand and Høyland (2004). Reliability data are

taken from OREDA (2009) and Molnes and Strand (2007). Terminology definitions are often

taken from the vocabulary database IEV Online (2015).

1.2 Objectives

The main objectives of this Master’s thesis are:

1. Carry out and document a literature survey related to subsea x-mas trees.

2. Describe the main functions of a subsea x-mas tree and the reliability of its main compo-

nents.

3. Describe the differences between the main subsea x-mas tree configurations and how

these affect the reliability of the subsea production system.

CHAPTER 1. INTRODUCTION 5

4. Evaluate the reliability data and models that are used to assess the reliability of subsea

x-mas trees.

5. Carry out and document a reliability assessment with focus on the differences between

the main subsea x-mas tree configurations.

6. Describe and evaluate what should be assessed when selecting a x-mas tree configuration

for a new subsea well.

1.3 Limitations

In this report only wet subsea x-mas trees are discussed. Any reference to x-mas trees or the

acronym XT refers to subsea x-mas trees.

The variations of a subsea production field and XTs are endless; it will be difficult to consider

every variation in detail. In this thesis there is a broad focus on XTs for both oil and gas produc-

tion. Injection trees are mostly disregarded. Broader concepts of the XT are discussed rather

than the detailed engineering. Water depth, temperature, pressure, and bore size are only con-

sidered in a broad context.

"Subsea wells can be classified as either satellite wells or clustered wells" (Bai and Bai, 2012).

Satellite wells are more independent than clustered wells that share more functions. This thesis

only considers the clustered wells; however, the difference in small. Clustered wells can be put

on a common template but also this is not considered.

There is limited literature on XT reliability available. This is due to the competition that exists

between the XT suppliers. The XT is also one of the safer and field proven parts of the subsea

production system. This has limited the open research available on XT reliability.

1.4 Approach

Objective 1, 2, and 3 is achieved through a literature survey on XTs. Objective 4 is achieved

through a literature survey on the quality and collection of reliability data.

CHAPTER 1. INTRODUCTION 6

A qualitative reliability system analysis is conducted to achieve objective 5. Objective 6 is

achieved partially through the reliability analysis and partially through a literature survey.

1.5 Structure of the Report

The rest of the report is organized as follows:

Chapter 2 gives an introduction to a x-mas tree’s functions, components, component relia-

bility, and the main configurations.

Chapter 3 introduces reliability and reliability analysis.

In Chapter 4 a qualitative reliability analysis of the x-mas tree configurations is conducted.

Chapter 5 highlights other aspects than reliability that should be taken into consideration

when selecting a x-mas tree configuration.

In Chapter 6 an evaluation of the reliability analysis is conducted.

Summary and recommendations for further work are in Chapter 7.

Acronyms are in Appendix A. Some definitions from the subsea production system are pro-

vided in Appendix B to help the reader understand the terminology.

Chapter 2

X-Mas Tree Function, Components, and

Configurations

Understanding the functions of a XT is an important start for a reliability assessment. This chap-

ter introduces the functions of a XT, what is used to achieve these functions, and the different

configurations available. A literature study is conducted to achieve this goal.

The name XT originates from XTs on platforms or onshore. The valves were stacked on top of

each other and were painted green. This resembled a Christmas tree and thus was named after

its appearance. For subsea application the XT has many of the same functions, but are more

complex and painted yellow.

2.1 Functions of a X-Mas Tree

Bai and Bai (2012) state that the typical functional requirements of a subsea XT are:

1. Direct the produced fluids from the well to the flowline (called production tree) or to

canalize the injection of water or gas into the formation (called injection tree).

2. Regulate the fluid flow through a choke (not always required).

3. Monitor well parameters at the level of the tree, such as well pressure, annulus pressure,

temperature, sand detection, etc.

7

CHAPTER 2. X-MAS TREE FUNCTION, COMPONENTS, AND CONFIGURATIONS 8

4. Safely stop the flow of fluid produced or injected by means of valves actuated by a control

system.

5. Inject into the well or the flowline protection fluids, such as inhibitors for corrosion or

hydrate prevention.

NORSOK D-010 (2013) state similar functions but has one more function that is important:

6. Provide vertical tool access through the swab valve(s) for vertical trees or through crown

plug(s) for horizontal trees.

NORSOK D-010 also has another function embedded in point number three. Not only should

the annulus pressure be monitored, but also pressure adjustment of the annulus should be pro-

vided if necessary.

Point number five is not always implemented because it depends on the properties of the

produced gas or oil.

2.1.1 Functional Analysis

Structured analysis and design techniques are used to model function blocks. Several blocks

can be linked together and form a functional block diagram (Rausand and Høyland, 2004). This

is a useful tool for breaking down the functions and understanding a system.

Integration Definition 0 (IDEF0) is based on and further developed from the structured anal-

ysis and design technique. "For existing systems, IDEF0 can be used to analyze the functions that

the system performs and to record the means by which these are done" ISO 31320-1 (2012).

Functions are represented by boxes and with several arrows pointing in and out. There are

four categories that each is represented on one of the four sides of the box, see Figure 2.1. Each

box has a box name that in the example is X. The four categories are (ISO 31320-1):

Control a condition or set of conditions required for a function to produce correct output.

Output that which is produced by a function

Mechanism the means used by a function to transform input into output.

CHAPTER 2. X-MAS TREE FUNCTION, COMPONENTS, AND CONFIGURATIONS 9

Function

Control

Output

Mechanism

InputX

Figure 2.1: IDEF0 functional block (derived from ISO 31320-1)

Input that which is transformed by a function into output.

Three IDEF0 functional block diagrams have been made for the functions of a XT, see Fig-

ures 2.2, 2.3, and 2.4. The box name is equivalent to the function number from the previous

mentioned functional requirements.

Function five is not represented in a figure because of this an optional function depending

on the conditions of the flow from the well.

It is important to note that an IDEF0 diagram illustrates the function flow, not the actual flow.

In Figure 2.2 the flow from the well comes into the XT and passes through the PMV and then the

PWV, see Figures 2.6 and 2.7. The choke valve is located right after the PWV and then the flow

goes into a connector with the jumper that goes towards the manifold. The two functions to

stop and regulate flow are put in parallel because of their independent functions. The function

to direct the flow through the valves is, however, necessary to fulfill the other two.

Each function described has one or more functional requirements. Figure 2.2 has a function

to stop flow on demand. A functional requirement could be how fast this is done and the leakage

rate after closure. Other function requirements can be how much pressure the valve can contain.

How well the XT fulfills these function requirements affects the performance of the function and

thus the reliability.

The IDEF0 diagrams are a good foundation for a structured view on the functions, this can

be used as boundaries when a XT is analyzed.

CHAPTER 2. X-MAS TREE FUNCTION, COMPONENTS, AND CONFIGURATIONS 10

Direct flow fromwell through valves

and into jumper

XT design

Flow into jumper

Production bore

Connectors

1

Flow from well

Stop flow on demand

Topside control

Flow that can bestopped on demand

PMV and PWV

4Hydraulic power

Regulate flow

Topside control

Regulated flow

Choke valve

2Hydraulic power

Figure 2.2: IDEF0 functional block diagram of XT functions 1, 2, and 4, see Section 2.1.

Monitor annulus Annulus pressure data

Sensors in XT

Annulus pressure3-A

Pressure adjust-ment of annulus

Topside control

Pressureadjustedannulus

ACV and AMV

3-BHydraulic power

Figure 2.3: IDEF0 functional block diagram of XT function 3, see Section 2.1.

Provide accessto the well

Light intervention

Well access

Swab valve orcrown plug

6

Hydraulic poweror wireline

Figure 2.4: IDEF0 functional block of XT function 6, see Section 2.1.

CHAPTER 2. X-MAS TREE FUNCTION, COMPONENTS, AND CONFIGURATIONS 11

Table 2.1: Main XT component reliability from the SubseaMaster database (taken from Molnesand Strand, 2007)

Item: Service time(item years):

No. offailures:

MTTF (years):

Choke valve 224,2 18 14,9Connector (Control/ flow line) 492,4 0 >492,3Connector (Tree cap) 98,4 0 >98,4Connector (XT) 552,0 0 >552,0Piping 5546,3 6 924,4Pressure compensation system 199,1 1 199,1Sensor/ indicator 1018,2 7 169,7Subsea control module 228,0 9 45,6Valve w/actuator 5396,5 33 168,6Wellhead 543,1 1 >543,1XT plug 451,5 2 225,8

2.2 Main Components of a X-Mas Tree

The main components of a XT are described in the following sections. The reliability of a com-

ponent can partially be described with Mean Time To Failure (MTTF), see Section 3.1 for more

information on reliability measures. Table 2.1 shows the main components of a XT and their

MTTF. The number of failures includes both installation (within 6 days) and in-service failures.

The MTTF is calculated from only the in-service failures. This is why there is a disparity between

the service time, number of failures, and the calculated MTTF.

2.2.1 Production Valves

Regulating and stopping flow from a well are accomplished by several valves that make up the

XT. Two examples of how the valves are placed are shown in Figures 2.6 and 2.7.

The most important valve is the Production Master Valve (PMV). This is a part of the sec-

ondary well barrier and essential for the well’s integrity. The PMV is the main valve responsible

for stopping the flow from the well on demand in Figure 2.2, function 4.

The Production Wing Valve (PWV) is placed after the PMV and serves as a redundancy of the

PMV. When the tree valves are required to stop the flow, the PWV is often closed first to allow the

PMV to be closed without flow to reduce wear. The PWV also allow isolation from the flowline

CHAPTER 2. X-MAS TREE FUNCTION, COMPONENTS, AND CONFIGURATIONS 12

during vertical entry into a XT (Golan and Sangesland, 1993).

In Bai and Bai (2012) the PWV is named PMV2, this may cause some confusion therefore

PMV and PWV are used in this thesis.

As seen in Table 2.1 the MTTF of the valves on a XT is 168,6 years. This is one of the more

accurate MTTFs because of the large amount of service time recorded.

2.2.2 Choke Valve

The choke valve regulates the flow from the well; it is responsible for function 2 in Figure 2.2. It

is normally placed on the XT after the PWV, but can also be placed on a manifold. In this report

the choke valve is treated as a part of the XT.

The choke valve is exposed to wear due to erosion, and may require more frequent main-

tenance or replacement than the rest of the XT. The choke valve has the lowest MTTF of the

components listed in Table 2.1. This is why the choke valve should be easy to retrieve (Golan

and Sangesland, 1993). This is achieved by having a choke insert that allow for easy retrieval of

the worn parts of the valve. This allows the choke valve to be replaced without pulling the XT.

A producing well may be required to be changed to an injection well (or vice versa) during

the lifetime of an oil field. This can be achieved through some initial design adaptations on the

XT and later changing the choke valve.

2.2.3 Other Valves

The annulus master valve and annulus workover valve "are used to equalize the pressure between

the upper space and lower space of the tubing hanger during normal production" (Bai and Bai,

2012).

An annulus crossover valve is optional. It allows communication between the annulus and

production bores. This "can be used to allow fluid passage for well kill operations or to overcome

obstructions caused by hydrate formation" (Bai and Bai, 2012).

The swab valve on the vertical x-mas tree and the crown plug on the horizontal x-mas tree

allow intervention into the well with wireline or coiled tubing.

CHAPTER 2. X-MAS TREE FUNCTION, COMPONENTS, AND CONFIGURATIONS 13

2.2.4 Subsea Control Module

The Subsea Control Module (SCM) is an important part of the overall reliability of XT. It provides

actuation and monitoring of most of the XT’s functions. "The typical SCM receives electrical

power, communication signals, and hydraulic power supplies from surface control equipment"

(Bai and Bai, 2012).

The reliability is one of the lowest of the XT components (see Table 2.1). The control mod-

ule has several redundant systems incorporated into it. Despite of this the complex electronic

equipment make the SCM unreliable. The low reliability of the SCM is countered with the mod-

ule being an independently retrievable unit.

Jardine (1986) states that modularization of equipment "is a well known mean of improving

system maintenance". Modularization offers the following benefits (Jardine, 1986):

• Reduction in the actual repair time of failed equipment via quick release modular connec-

tions and better access.

• Reduction in the number of different subsea tasks to be carried out.

• Reduction in the number of different types of spares required for system upkeep.

The module also simplifies the design phase because the module is the same on any XT, no

matter the configuration or size. The content of the SCM will be different, but the connector,

guiding, and size will be the same.

2.2.5 Connectors

The connection between the XT and the wellhead is typically done with a hydraulic connector.

This is a modified BOP connector that has been specialized for subsea application (Bai and Bai,

2012). Table 2.1 shows that the reliability of the connectors is not recorded as a problem. The

critical phase of the connector is during connection. Failures will be discovered quickly due to

function and pressure testing before the well is put into service.

CHAPTER 2. X-MAS TREE FUNCTION, COMPONENTS, AND CONFIGURATIONS 14

2.2.6 Sensors

To fulfill function 3-A (see Figure 2.3) the XT need various sensors. Bai and Bai (2012) state

that the sensors used in a XT are pressure and temperature sensors, placed in the annulus and

production bore and upstream and downstream of the choke.

Golan and Sangesland (1993) state that the sensors generally in a tree are pressure, temper-

ature, sand erosion, valve position, and hydrocarbon leak detection sensors.

Some customers also require that the flow from the well is monitored with a flow meter.

Either a wet gas flow meter or multiphase flow meter depending on the type of well.

The different sensors available for a XT relate to different types of well, fields and oil com-

panies with different specifications. What kind of sensors installed on a XT is therefore tailored

every time.

Some sensors may be required to be changed during the lifetime of the well. Sensors may be

worn out or the conditions of the well may change so much that a well parameter goes beyond

the range of the sensor. As seen in Table 2.1, the MTTF of sensors and indicators a relatively

high. The changing parameters of a well may be a more frequent reason of sensor replacement

than failures.

As mentioned in Section 2.2.2, a production well may be changed to an injection well. This

will also require changing some sensors. This can be solved with placing some sensors and the

choke valve into a retrievable Flow Control Module (FCM). The term FCM is used by GE Oil &

Gas and in this thesis, OneSubsea use the term retrievable process module. A retrievable FCM

has some other benefits as well, such as lower weight of the XT that can be beneficial for rig cost

during installation. However, the main reason for a FCM is improving system maintenance as

previous stated in Section 2.2.4.

For the Åsgard field the minimum lifetime is 20 or 30 years, here the choke valve and multi-

phase flow meter are put into a FCM. The FCM can be replaced with a monohull vessel in less

than 48 hours (Østebø et al., 2001) which can save a lot of time in rig cost and mobilization time.

CHAPTER 2. X-MAS TREE FUNCTION, COMPONENTS, AND CONFIGURATIONS 15

2.3 The Main X-Mas Tree Configurations

The oil companies have different technical requirements that result in adaptations on the XT to

the specific buyer. Also the oil fields require different functions on the XT. This has resulted in a

wide array of XTs installed around the world.

There are two main configurations of XTs. The conventional XT that is called a dual bore tree

or a Vertical X-mas Tree (VXT). The other main configuration is called a Horizontal X-mas Tree

(HXT).

GE Oil & Gas has developed a tree configuration they call the Deepwater Vertical X-mas Tree

(DVXT). The DVXT is not a conventional VXT; it is installed with a Tubing Head Spool (THS) that

incorporates some benefits from the HXT into the VXT. In this thesis the DVXT is treated as an

independent type of XT configuration in addition to the HXT and the VXT. Other XT suppliers

have similar configurations; OneSubsea call theirs a vertical monobore subsea tree.

2.3.1 Vertical X-Mas Tree

A VXT configuration is shown in Figure 2.6. The VXT is also called a conventional XT or a dual

bore XT. The main characteristic of the VXT is that the production and annulus bores run ver-

tically in the tree with the main valves oriented vertically in the main block of the tree (Bai and

Bai, 2012).

The well is completed and the tubing hanger hung in the wellhead before the VXT is installed.

Well completion is when the production tubing suspended in the tubing hanger is landed in the

wellhead or XT.

The VXT lands on top of the wellhead and tubing hanger. The orientation of the VXT is

important because of the asymmetric dual bore and the control lines for downhole equipment

on the tubing hanger (Bai and Bai, 2012).

A VXT is installed with an installation/workover dual-bore riser and a tree running tool. On

a live well a lower marine riser package is required, this functions the same way as a Blowout

Preventer (BOP) and is installed between the tree and the installation/workover riser (Richbourg

and Winter, 1998).

Bai and Bai (2012) state that a VXT is larger and heavier than a HXT. However, OneSubsea

CHAPTER 2. X-MAS TREE FUNCTION, COMPONENTS, AND CONFIGURATIONS 16

(2015) state that the VXT and HXT "typically have the same size, weight, and footprint when

comparing equivalent systems". The conflicting statements may suggest that there may be a

difference, but it is negligible when choosing between the configurations. The main driver of

the weight of the XT is not the configuration but the bore size and pressure rating.

2.3.2 Horizontal X-Mas Tree

A HXT configuration is shown in Figure 2.7. The valves on a HXT are located horizontally to the

sides.

The HXT is installed on top of the wellhead before the well is completed. The well is then

completed through the HXT and the tubing hanger is hung into the HXT. This allows the tubing

to be pulled without the need to pull the tree.

The tubing hanger is installed with casing tubular joint through a regular drilling BOP con-

nected to the HXT. However, this requires a complex landing string with valves that is special

made to the particular BOP used. This is because of the shear rams incapability of cutting cer-

tain parts of the landing string (Bai and Bai, 2012).

2.3.3 Deepwater Vertical X-Mas Tree

The DVXT differs from the VXT because of a THS that is installed on top of the wellhead before

the well is completed.

The THS is a combination of a tubing head and a completion guidebase.

ISO 13628-4 state that the uses of a tubing head are:

1. Provide a crossover between wellheads and subsea trees made by different equipment

manufacturers.

2. Provide a crossover between different sizes and/or pressure ratings of subsea wellheads

and trees.

3. Provide a surface for landing and sealing a tubing hanger if the wellhead is damaged or is

not designed to receive the hanger.

4. Provide means for attaching any guidance equipment to the subsea wellhead.

CHAPTER 2. X-MAS TREE FUNCTION, COMPONENTS, AND CONFIGURATIONS 17

Only number 4 use is valid for the THS but the others may also apply in certain cases.

ISO 13628-4 also state that the tubing hanger may be landed in the tubing head which is the

case on the DVXT configuration. Similar to a HXT the THS provides passive orientation of the

tubing hanger. The DVXT has a monobore tubing hanger. A bore in the THS with an annulus

isolation valve, bypasses the tubing hanger as seen in Figure 2.5, valve 16.

"A completion guidebase, may incorporate piping, flowline connections, and tree piping in-

terface hardware" (Richbourg and Winter, 1998). For the DVXT this means that the flowline

connection is not on the XT as usual. The THS supports a piping spool that connects to the

DVXT and to the jumper. This allows the jumper to be connected before the DVXT is installed

and remain connected if the DVXT is pulled.

The DVXT has a concentric dual-bore design; this means that a dual bore riser is not neces-

sary as with a VXT. A regular subsea BOP can be used together with a marine riser and a tubing

hanger running tool during intervention and installation.

The THS provides guidance with orientation fins that orients the DVXT when it is landing

onto the THS (GE Oil & Gas, 2012).

After the THS is installed onto the wellhead, the well is completed. The DVXT is then in-

stalled on top of the THS as a normal VXT. The connection to the THS consists of two connec-

tors, one with a regular wellhead connector that connects to the THS and tubing hanger. The

other is a smaller but similar connector as the wellhead connector, this connects to the flowline

connector spool on the THS.

The DVXT configuration is heavier than the VXT and HXT, but the weight is distributed be-

tween the two lifts of the THS and the tree. This can be beneficial if the XT weight is around the

crane capacity of the installation vessel. Because of the two main components, the DVXT takes

up more deck space on the installation vessel.

CHAPTER 2. X-MAS TREE FUNCTION, COMPONENTS, AND CONFIGURATIONS 18

ISO 13628-4:2010(E)

© ISO 2010 – All rights reserved 37

Key 1 CAP 13 tubing hanger 2 ASV (manual or failed closed or optional plug) 14 tubing head 3 PSV (manual or failed closed or optional plug) 15 wellhead 4 AWV 16 annulus isolation 5 PWV 17 optional ASV (WOV or AAV) (manual or hyd.) 6 annulus 18 optional XOV 7 production 19 PSV 8 XOV 20 to umbilical line or service line 9 option 21 annulus valves 10 AMV 22 wellhead 11 PMV 23 production line 12 optional master (manual or hyd.)

NOTE The dotted inclusions are optional. A non-pressure-containing tree cap can be considered when two swab closures are included.

Figure 2 — Example of vertical trees on tubing heads

Pro

vide

d by

Sta

ndar

d O

nlin

e A

S fo

r N

TN

U U

nive

rsite

tsbi

blio

teke

t 201

4-09

-30

Figure 2.5: Example of a vertical tree on a tubing head (taken from ISO 13628-4).

37

Figure 18 Subsea well with vertical X-mas tree (dual bore through X-mas tree and TH)

Figure 2.6: Subsea well with VXT, dual bore through XT and TH (taken from Norwegian Oil &Gas, 2012).

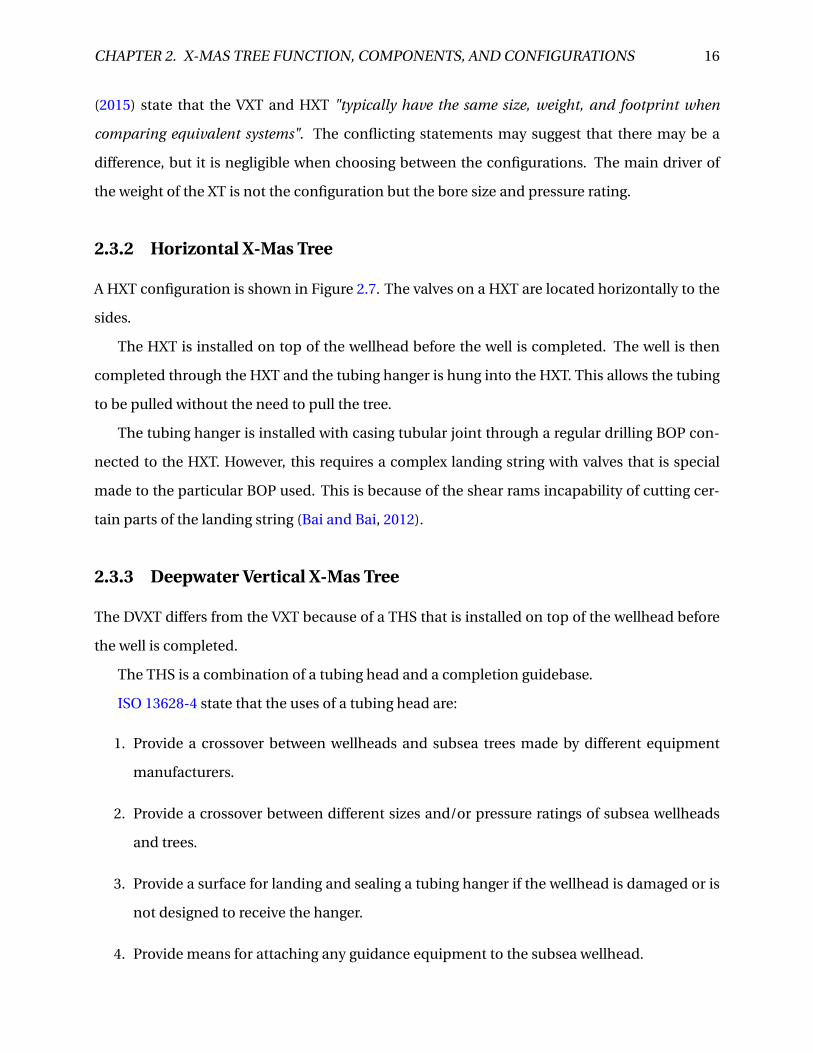
CHAPTER 2. X-MAS TREE FUNCTION, COMPONENTS, AND CONFIGURATIONS 19

38

Figure 19 Subsea well with horizontal X-mas tree

The most significant differences between the vertical and horizontal tree are the position of

the valves and tubing hanger. The X-mas tree is frequently selected out from both

configurations. The advantage of the horizontal X-mas tree is that it has the ability to remove

the tubing without removing the tree. So, if more frequent replacement of the production

tubing is expected compared to the X-mas tree, a horizontal tree may be selected. Installation

of a horizontal X-mas tree reduces the amount of equipment needed, time and cost. It also

allows easier access for well intervention. A disadvantage is when the tree itself has to be

removed. In this case, the upper completion (tubing hanger, tubing, DHSV, etc.) has to be

retrieved which is a time consuming and costly operation. Additional disadvantages would be

that interventions through the tubing are more difficult than a vertical tree since removing or

Figure 2.7: Subsea well with HXT (taken from Norwegian Oil & Gas, 2012).

The main components that vary between VXT and HXT are as follows:

• Tree body: The tree body in a HXT is normally designed to be an

integrated spool. The PMV is located in this tree body, as well as the

annulus valves. The PWV is usually designed to be integrated into

a production wing block, which can be easily connected to the tree body

by flange methods. This design results in components that are inter-

changeable between the HXTs in the industry. In addition, the tubing

hanger system is located in the tree body.

• Tubing hanger system:AVXTutilizes a conventional tubing hanger, which

has a main production bore and an annulus bore. The tubing hanger is

located in the wellhead. However, in an HXT, the tubing hanger is

a monobore tubing hanger with a side outlet through which the

production flow will pass into the PWV. Because the TH in the HXT is

located in the tree body, it needs the crown plugs as the barrier method.

An internal tree cap is the second barrier located above the crown plug.

If dual crown plugs are designed in a TH system, an internal tree cap is

not used.

• Tree cap: The tree cap in a VXT system has the functions of providing

the control interfaces during workover and sealing the tree from

seawater ingress. An HXT, in contrast, has internal tree caps and tree

debris caps.

These differences are illustrated in Figure 22-23.

Figure 22-23 Differences between VXTs and HXTs (Courtesy of Vetco Gray)

738 Y. Bai and Q. Bai

Figure 2.8: XT block assembly, HXT to the left and VXT to the right (taken from Bai and Bai, 2012)

Chapter 3

Approaches to Reliability Assessment

Reliability can defined as the "ability to perform as required, without failure, for a given time

interval, under given conditions" (IEV Online, 2015).

A reliability assessment does not have a good definition compared to the definition of a risk

assessment. Risk assessment is defined as the "overall process comprising a risk analysis and a

risk evaluation" (IEV Online). This can be transferred to the description of a reliability assess-

ment in that an assessment consists of an analysis and an evaluation.

3.1 Measures of Reliability

Rausand and Høyland (2004) use four measures of reliability of non-repairable item. The relia-

bility function, failure rate function z(t), Mean Time To Failure (MTTF), and mean residual life.

FAILURE RATE FUNCTION 21

Fig. 2.4 Empirical bathtub curve.

and hence

A histogram depicting z ( i ) as a function of i typically is of the form given in Fig. 2.4. If YZ is very large, we may use very small time intervals. If we let A t + 0, is it expected that the step function z ( i ) will tend toward a “smooth” curve, as illustrated in Fig. 2.5, which may be interpreted as an estimate for the failure rate function z ( r ) .

This curve is usually called a bathtub curve after its characteristic shape. The failure rate is often high in the initial phase. This can be explained by the fact that there may be undiscovered defects (known as “infant mortality”) in the items; these soon show up when the items are activated. When the item has survived the infant mortality period, the failure rate often stabilizes at a level where it remains for a certain amount of time until it starts to increase as the items begin to wear out. From the shape of the bathtub curve, the lifetime of an item may be divided into three typical intervals: the burn-in period, the useful life period and the wear-out period. The useful life period is also called the chance failure period. Often the items are tested at the factory before they are distributed to the users, and thus much of the infant mortality will be removed before the items are delivered for use. For the majority of mechanical items the failure rate function will usually show a slightly increasing tendency in the useful life period.

- - - - - - - period Useful life period I period

- - - - - - - 0 Time t ’

Fig. 2.5 The bathtub curve. Figure 3.1: The bathtub curve (taken from Rausand and Høyland, 2004).

21

CHAPTER 3. APPROACHES TO RELIABILITY ASSESSMENT 22

The failure rate function and MTTF are the most used in subsea reliability engineering.

The exponential distribution is the most common probability distribution that is used to

model the lifetime of a non-repairable item. The exponential distribution has a constant failure

rate. Rausand and Høyland (2004) state that this distribution "may be a realistic life distribution

for an item during its useful life period". The useful life period is the flat middle part of the bath-

tub curve in Figure 3.1. This is a good assumption since most components will only be in this

part during the lifetime of the system. In addition "most of the commercially available reliability

data sources are based on the assumption of constant failure rates" Rausand and Høyland (2004).

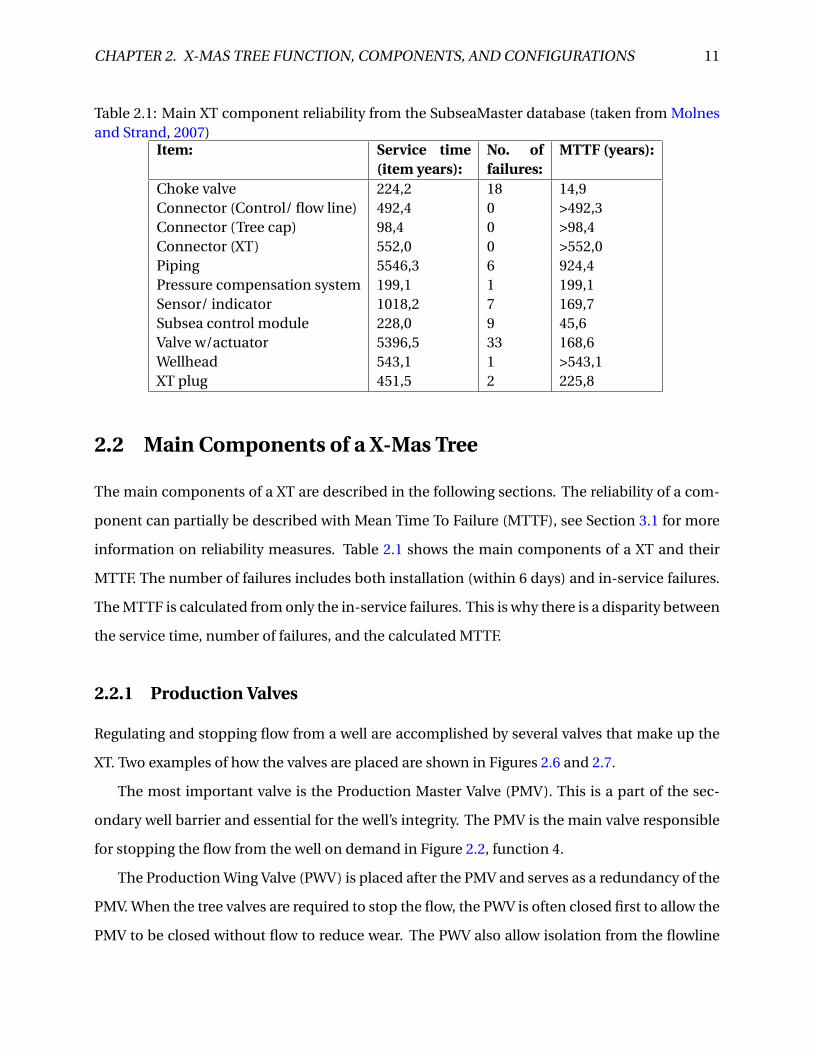
Molnes and Strand (2007) state that SubseaMaster does not include failures within the first

six days after installation into the MTTF calculations. Brandt and Eriksen (2001) refers to this as

the "infant mortality" and are subsea components that sometimes fail shortly after installation

or an intervention. In Figure 3.1 the infant mortality is the same as the burn-in period. By

removing the infant mortality from the calculation of failure rate, the result is more accurate.

To cover the infant mortality in a reliability model, Brandt and Eriksen (2001) state that "an

installation failure probability can be applied".

With the exponential distribution the relationship between the failure rate (λ) and MTTF

is constant, as seen in Equation 3.1, taken from Rausand and Høyland (2004). MTTF is often

used when presenting reliability data because it is a more relatable number than the failure rate.

However, when using MTTF it is important to note that "MTTF is merely a performance indicator,

not a lifetime prediction figure" (Molnes and Sundet, 1993).

MT T F = 1

λ(3.1)

3.2 Reliability System Analysis

Rausand and Høyland (2004) state that "the main reliability measure for a maintained item is

the availability". Availability is defined as the "ability to be in a state to perform as required" (IEV

Online). A more comprehensive definition is that "availability depends upon the combined char-

acteristics of the reliability, recoverability, maintainability, and the maintenance support perfor-

mance" (IEV Online). Rausand and Høyland (2004) mentions that the reliability incorporated

CHAPTER 3. APPROACHES TO RELIABILITY ASSESSMENT 23

under availability is the inherent reliability.

Recoverability and maintenance support performance are the same for the XT configura-

tions and are therefore not further discussed.

Maintainability is defined as the "ability to be retained in, or restored to a state to perform as

required, under given conditions of use and maintenance" (IEV Online).

From these definitions it can be derived that the system reliability is the overall systems abil-

ity to function and the inherent reliability is the ability of an items to function without failure.

A subsea XT is designed to last as long as possible without maintenance. Depending on the

type of XT, the maintainability of the tubing would change. This would affect the availability of

the well. So even when a XT is not considered a maintained system, availability is a key factor in

the system reliability of the well.

3.2.1 RAM Analysis

Calculating the availability of a system such as a subsea production well is very complex. Many

oil companies use Monte Carlo next event simulation data software to simulate the availability,

this is called a Reliability, Availability, and Maintainability (RAM) analysis. Miriam RAM Studio

and Maros are commonly used software for this kind of RAM analyses.

Well intervention and subsea repair costs can be quantified through a RAM analysis. Com-

bined with CAPEX and OPEX (see Section 5.2) this can be used as support in selecting subsea

solutions with the lowest life cycle cost (Brandt and Eriksen, 2001).

The system is modeled with flow diagrams and reliability block diagrams. Then the software

generates random events with a specific probability distribution. Scheduled and conditional

events are also included. This simulates a lifetime scenario, when this is done enough times the

average will show an estimate of the actual lifetime. In Aven and Pedersen (2014) 20 000 simu-

lations were run to give negligible statistical estimation errors. Brandt and Eriksen (2001) state

that the output "will always be uncertain, and rely solidly on the quality of the reliability data." As

well Aven and Pedersen (2014) state that "production assurance analyses are based on the project

team’s knowledge at the time of the analysis. This knowledge is to a large extent reflected in the

assumptions made during the analysis." Knowledge on the system and quality data used right is

essential in achieving an applicable result.

CHAPTER 3. APPROACHES TO RELIABILITY ASSESSMENT 24

Aven and Pedersen (2014) address model uncertainties in a RAM analysis. In the article a

RAM analysis is conducted on a subsea production system as an example. It is suggested that an

importance score in two dimensions are contributed to each assumption made for an analysis.

The two dimensions are:

Sensitivity the effect changing the assumption has on the predicted production availability.

Uncertainty the level of uncertainty related to deviations for the assumptions made.

Aven and Pedersen (2014) use the importance score system on the assumptions for a subsea

production system RAM analysis. An assumption of three months mobilization time stands out

with both high sensitivity and uncertainty. Especially for subsea productions systems mobi-

lization time is very important for the availability in analyses. This enforces the focus on the

inherent reliability of the subsea components.

Drakeley et al. (2001) is an article where RAM analysis for the new technology of an intelli-

gent well is discussed. A methodology for establishing appropriate input data was presented. In

an analysis of new technology establishing appropriate input data is difficult. For new concepts

such as the DVXT this may be a problem. Most of it utilizes proven technology but the system

still requires data to be adapted. An important part of the method in Drakeley et al. (2001) is

uncertainty management. Several actions were taken to minimize the effect of data and model-

ing uncertainties. The actions were; sensitivity analysis, uncertainty distributions such as stan-

dard deviation, highly sensitive and uncertain components were closely followed up, thorough

review of models and input data, and application of expert judgments to calibrate data. The

analysis in Drakeley et al. (2001) suffered from the limited field experience of the new technol-

ogy; however, they still concluded that the analysis contributed to better design increasing the

reliability. This is important with regards to the DVXT, with good control of the uncertainties a

RAM analysis can still provide an adequate decision basis for choosing a XT configuration.

Lee et al. (2004) has conducted a RAM analysis on the subsea production system. In this

analysis the main equipment reducing system availability were found to be the SCM and the

wellhead connector. The SCM is expected to be a low reliability component and is therefore easy

to retrieve. The reason for the low reliability on the wellhead connector is not stated in the arti-

cle. This analysis concluded that the some configuration of the facilities needed to be changed

CHAPTER 3. APPROACHES TO RELIABILITY ASSESSMENT 25

and inspection intervals for maintenance were set to reach the availability goal of 99.0 %. The

goal was reached by adapting a 2 out of 3 system of the subsea wells to facilitate the further

system.

The finding of Lee et al. (2004) of the wellhead connector as one of the equipment reduc-

ing system reliability is somewhat surprising. Jardine (1986) state the wellhead connector to be

"highly reliable". In Table 3.1 the MTTF of the connector and wellhead is very high. The rea-

son for the unavailability caused by the wellhead connector may be explained by Jardine (1986)

which state that "it is necessary to look beyond the equipment’s unreliability and consider its fail-

ure impact, its method and time to repair, i.e. the equipment’s overall importance within its pro-

posed system environment." If the wellhead connector is damaged the well may be permanently

shut down or extensive repairs have to be conducted. This shows the importance of conducting

a RAM analysis, the inherent reliability is not enough to indicate the system reliability.

3.3 Reliability Data

Reliability data are required to accurately model and analyze a system. Molnes and Sundet

(1993) state that "the value of reliability data is time limited. It is therefore vital that operat-

ing companies have the capabilities required both in terms of manpower and software to collect

data on a continuous basis". This data can be used to improve the reliability of the equipment

installed and to later design reliable equipment.

For the Åsgard field, reliability data were used to choose a special durable choke valve to

meet the expected hard use on the field. The chosen choke valve appears to meet the require-

ments of the field proving that using reliability information adds value to a project (Østebø et al.,

2001).

3.3.1 Reliability Data Sources

Good reliability data is essential for a reliability analysis to be useful. There are several sources

of data in different industry sectors. For subsea developments Brandt and Eriksen (2001) state

that component reliability can be obtained from the following sources: general industry data

banks, vendor data, expert judgments, or synthesized data. In subsea oil and gas there are two

CHAPTER 3. APPROACHES TO RELIABILITY ASSESSMENT 26

Table 3.1: Main XT component reliability, derived from OREDA (2009) and SubseaMaster(Molnes and Strand, 2007)

Item: SubseaMasterMTTF (years):

OREDA MTTF (years)All failures:

OREDA MTTF (years)Critical failures:

Choke valve 14,9 6,7 107,4Connector (XT) >552,0 308,5 713,5Sensor/ indicator 169,7 12,7 178,4Subsea control module 45,6 5,4 21,5Valve w/actuator 168,6 207,6 207,6Wellhead >543,1 326,2 439,1

main relevant industry data banks: the Offshore Reliability Database (OREDA) and WellMas-

ter/SubseaMaster.

"OREDA is a project organization sponsored by oil and gas companies with world-wide oper-

ations. OREDA’s main purpose is to collect and exchange reliability data among the participating

companies" (OREDA, 2009).

OREDA reliability data from a participating company is fully available to that one company.

Data from other companies are restricted. The OREDA handbooks are released publicly and

contain a lot of data on specific components. This data in the handbooks are rather old, the

2009 handbook contains data from years from 2000 to 2003. The data in Molnes and Strand

(2007) are collected from 2004 to 2007 and are therefore more up-to-date.

In OREDA (2009) there is reliability data on subsea XTs. OREDA has collected data from 208

VXTs and 62 HXTs. This is more than Molnes and Strand (2007), which contains reliability data

from 104 subsea wells.

SubseaMaster does not distinguish between critical, degraded, and incipient failures which

OREDA does. The data from OREDA is originally presented as failure rate per 106 hours. OREDA

also presents mean, lower, upper and standard deviation of the data to allow the reader to know

the uncertainty of the data. This is not included in the Molnes and Strand (2007) report, but may

be included in the SubseaMaster restricted database.

In Table 3.1 XT components reliability data from OREDA (2009) and Molnes and Strand

(2007) are compared. The components which were similarly described were included. The fail-

ure rate from OREDA has been calculated to MTTF. From the comparison much of the data co-

CHAPTER 3. APPROACHES TO RELIABILITY ASSESSMENT 27

incides. The largest differences are the sensor/ indicator and the SCM. Technology have made

great advances in the last decade, this could explain why the newer data show a considerably

better reliability.

3.3.2 Bottom-up Versus Top-down Approach

Combining data from the OREDA database and conventional reliability block diagrams often

result in a lower reliability than experienced in the field. GE Oil & Gas refers to this as a disparity

between bottom-up approach and top-down approach. This is further researched in Stende-

bakken (2014).

Bottom-up approach refers to reliability models that use specific XT component reliability

data in a reliability model for the whole XT system. The component data in the bottom-up

approach is taken from GE’s own database of components and data received from OREDA on

GE’s trees in service at the oil companies.

Top-down approach refers to high level reliability and availability experienced in the field.

The high level data is from the actual number of times trees are retrieved for service due to

failures.

The disparity may be related to how the failures are reported and classified in the reliability

database. If a failure is not a critical failure, this may not be noticed and may not require the

retrieval of the XT from the seabed. This requires the distinction between light intervention and

heavy workover in the database.

At the end of the bathtub curve (Figure 3.1) the failure rate increases. If some components

on the XT reach this part during the lifetime of the XT this may be a source of deviation in the

bottom-up model. The choke valve described in Section 2.2.2 is a component that has a high

wear. It may be assumed that the failure rate of the choke valve starts increasing during the

lifetime of the XT. To describe this with another probability distribution such as the Weibull

distribution can be more realistic; however, this is most likely not the main source of deviation

in the bottom-up approach.

The disparity between the approaches may be a result of inadequate models, but the most

likely cause is the reporting and classification of failures to the database. A possible cause of

error is when a VXT is retrieved due to a failure in the tubing. The normal procedure is then to

CHAPTER 3. APPROACHES TO RELIABILITY ASSESSMENT 28

overhaul the VXT, failures may then be found and classified as critical. However, the XT would

never have been retrieved because of this failure. Classification of failures and control of in what

setting failures are discovered is critical for achieving good data and models.

GE modifies their data based on experience so that the top-down and bottom-up approaches

correspond. On failures classified as critical, they sometimes use a Pareto rule that implies that

80% of the failures only lead to light intervention and 20% requires a heavy workover. This limits

the retrieval rate in the analysis and closes the gap between bottom-up and top-down.

GE has by this method removed some of the uncertainties of their system model for RAM

analysis. As previously stated from Drakeley et al. (2001) in Section 3.2.1; with good handling of

the uncertainties a good analysis can still be obtained. Especially expert judgments to calibrate

data can be used to close the gap between the bottom-up and top-down approach to achieve

realistic models.

Chapter 4

Qualitative Reliability Analysis of X-Mas

Tree Configurations

In this chapter a qualitative reliability analysis is conducted on the differences between the XT

configurations.

This analysis is a qualitative analysis of the reliability of the XT configurations compared to

each other. A literature survey has been conducted to identify reliability drivers that differentiate

the reliability of the XT configurations.

The analysis is not for a specific type of well, thus XTs are discussed in a broad setting. It is

not specific on water depth or if it is an oil or gas well. Only production wells are analyzed, not

injection wells. It is not differentiated between satellite, cluster, or template wells.

4.1 What to Assess

When discussing the different XT configurations it is important to assess the required functions

of a XT introduced in Section 2.1.

In Section 2.1.1 it is mentioned that the IDEF0 diagrams can be used as functional bound-

aries for an analysis. In an analysis comparing the reliability some functions are more important

that other. The function to stop flow on demand is important for the reliability of the tree, but

will not differentiate the reliability of the different types of XTs. This is because the valves are

basically the same on the different XT configurations.

29

CHAPTER 4. QUALITATIVE RELIABILITY ANALYSIS OF X-MAS TREE CONFIGURATIONS 30

The functions of the different XT configurations are the same. Input, control and output

should also be the same. That leaves mechanism and how the mechanism affects the function as

the main differences. As previous stated the valves are the same on the different configurations.

This leaves the production bore, connectors, and swab valve/crown plug to be analyzed.

An important function of the well is to be able to retrieve the production tubing. This is not

a direct function of the VXT; however, it is for the HXT. Functions like this that are affected by

the XT should also be considered in an analysis.

Redundancy is an important aspect of system reliability. However, the relevant systems dif-

ferentiating the XT configurations do not have redundancy, thus it is not relevant. Jardine (1986)

state that "in deep water, the advantages of redundancy will diminish and the philosophy of sim-

plicity in design will prevail". This analysis do not differentiate between deepwater and shallow

water application of the XTs. Simplicity in design is still a philosophy worth keeping in mind

during the analysis because of the positive impact it has on reliability.

This section aims to identify the reliability drivers that will differentiate the configurations

in a system reliability analysis.

4.1.1 Maintainability

"Statistically, most workover interventions on subsea trees are due to downhole problems rather

than problems with the tree" (Richbourg and Winter, 1998). On the other hand Molnes and

Sundet (1993) state that gas/condensate producing wells has a "history of relatively few failures

and corresponding high tubing reliability". This is a big driver of the system reliability and one

of the main factors when deciding the XT configuration of a well.

The downhole problems of an oil well can be contributed to different characteristics of the

oil. Characteristics such as sand content, water cut, scale, and H2S content are some factors that

may affect the reliability of the tubing. The concentration of these characteristics compared to

tubing failures are not assessed by Molnes and Sundet (1993).

Aven and Pedersen (2014) state that for a subsea production system "the active repair times

are short compared with the mobilization time, and can be ignored". This implies that the only

important factor for a XT is the inherent reliability, if every failure requires the same type of ves-

sel to be mobilized. As far as the author has understood there is no difference in the types of

CHAPTER 4. QUALITATIVE RELIABILITY ANALYSIS OF X-MAS TREE CONFIGURATIONS 31

vessel required to perform maintenance on the different XT configurations. But it may cause a

significant difference of the active repair when the XT has to be retrieved as well. Aven and Ped-

ersen (2014) may not have included extra lifting operations into the statement, just the actual

repair of a component.

How maintainable the XT and the well system are is an important contributor towards the

system reliability. This is also a key difference between the XT configurations so maintainability

should be a focus point of the reliability analysis.

4.1.2 Leak Paths

The function to direct flow is the first function of the XT function block diagram shown in Fig-

ure 2.2. Without this function the next functions will fail. The most important functional re-

quirement to this function is to direct flow without leakage to the surroundings.

The main focus of well integrity (see Appendix B) is well barriers. The XT is a part of the

secondary well barrier in a producing well (NORSOK D-010). This means that a failure in the

XT alone will not lead to a blowout. A leakage may still lead to some fluids released to the en-

vironment. This would also lead to stop in production from the well for some time until the XT

is replaced. This is because "upon confirmation of loss of the primary or secondary well barrier,

the well shall be shut-in and the remaining well barrier verified. Only activities related to the

re-establishment of the well barrier shall be carried out on the effected well" (NORSOK D-010).

ISO 13628-4 state that "the number of potential leak paths should be minimized during sys-

tem design". More leak paths may lead an unacceptable level of safety, a higher probability of

leakage, and a lower system reliability.

The parts of a XT that has the potential of being a direct leak path to the surrounding are the

connectors, wellhead, and XT block. The XT configurations have different number of connec-

tors, forces on wellhead, and design of the bore. This should be looked into in a comparison.

4.1.3 Flow Control Module

As mentioned in Section 2.2.6 the choke valve and some sensors may be put into a retrievable

FCM. This will improve the maintainability of those parts. However, this makes the system more

CHAPTER 4. QUALITATIVE RELIABILITY ANALYSIS OF X-MAS TREE CONFIGURATIONS 32

complex and adds potential leak paths. This may impair the reliability and safety of the tree. The

need for a FCM may be different for the different XT configurations and should be discussed in

the analysis.

4.2 Vertical X-Mas Tree

In Table 4.1 the HXT has over twice the MTTF of the VXT. This may relate to that VXTs were more

frequently used before and newer wells more frequently have HXTs. They also may have newer

more reliable technology, the older VXTs may lower the MTTF and a new VXT may have a higher

MTTF. It is difficult to discuss this further without improved knowledge on the data collected.

4.2.1 Maintainability

The VXT is easier to replace than a HXT because the tubing hanger is hung in the wellhead.

If the tubing is going to be replaced a VXT provides a more comprehensive procedure with

more operations. Disconnecting the jumper and the umbilical has to be done first, then the tree

can be removed and eventually the BOP can be put on the wellhead and the tubing hanger and

tubing retrieved. This is the reason that a well that is expected to have downhole problems is

equipped with a HXT and vice versa. "A HXT is not recommended for use in a gas field because

interventions are rarely needed" (Bai and Bai, 2012). Retrieving the tubing from well with a HXT

is a simpler and less time consuming procedure. What kind of maintenance that is expected in

a well and XT is therefore key in the maintainability of the system. This favors one configuration

over the other in a maintainability perspective depending on the well.

Table 4.1: XT configuration reliability (derived from OREDA, 2009)Item: No of

units:MTTF(years)Allfailures:

MTTF(years)Criticalfailures:

Active repairtime (hours),all failures:

Active repairtime (hours),critical failures:

VXT 208 8,5 46,0 26,6 25,0HXT 62 22,9 116,5 140,0 240,0VXT Wellhead 199 292,7 407,7 288,0 288,0HXT Wellhead 62 193,5 207,6 - -

CHAPTER 4. QUALITATIVE RELIABILITY ANALYSIS OF X-MAS TREE CONFIGURATIONS 33

In shallow waters the time used to retrieve a XT is much shorter than in deep water. When

retrieving the tubing from shallow water the extra time used to pull a VXT may be negligible.

The swab valve of the VXT allows shorter time spent with wireline operations. It is faster to

open the swab valve than to retrieve the crown plug of a HXT in the preparation of a wireline

operation; however, this time is very short and negligible.

4.2.2 Leak Paths

The VXT has a swab valve compared to the HXT which has a crown plug. As seen in Table 2.1

a valve (MTTF of 168,6 years) has a lower MTTF than a XT plug (MTTF of 225,8 years). The XT

plug is assumed to be the crown plug of a HXT.

The two plug failures were both failure to disconnect. The valve failures vary more but the

main contributors were spurious operation and failure to close (Molnes and Strand, 2007).

A valve instead of a plug is therefore a slightly worse option with regards to reliability and

leak paths due to the nature of the failures.

4.2.3 Flow Control Module

Since it easier to retrieve a VXT it may be available for repair on a rig or sent to the manufacturer

for an overhaul, temporarily replaced by a backup XT. Replacing or repairing the choke valve or

a sensor on this occasion may remove the need for pulling the tree because of the choke valve

or the need for replacing this subsea.

A VXT without a FCM would not have the negative effect of the FCM on safety and still have

good maintainability of the choke valve and sensors.

4.3 Horizontal X-Mas Tree

4.3.1 Maintainability

As mentioned in Section 4.2.1 a key difference between a VXT and a HXT is how easy it is to

retrieve the tubing. Bai and Bai (2012) state that "an HXT is applied in complex reservoirs or

CHAPTER 4. QUALITATIVE RELIABILITY ANALYSIS OF X-MAS TREE CONFIGURATIONS 34

those needing frequent workovers that require tubing retrieval, whereas a VXT is often chosen for

simple reservoirs or when the frequency of tubing retrieval workover is low".

Table 4.1 show a considerably worse repair time for the HXT. This relates to the extra time

spent retrieving the tubing before retrieving the HXT.

4.3.2 Leak Paths

All of the XT configurations use a BOP during retrieval of the tubing. The HXT has the BOP

mounted on top of it compared to the VXT where the tree is retrieved first and the BOP is con-

nected to the wellhead. When the BOP is on top of the HXT it adds height to the already high

BOP stack. This increases the moment force on the wellhead. "Bending loads at the flex joint are

a function of the riser bottom tension and the riser bottom angle. These loads can result in large

bending moments at the wellhead due to the moment arm arising from the BOP stack height."

(Golan and Sangesland, 1993). With the increased height from the HXT the strength of the well-

head and connector may be a problem.

As previously discussed in Section 3.2.1, Lee et al. (2004) found the wellhead as a component

reducing availability. The wellhead is critical for the wells integrity and replacing a damaged

wellhead is not possible requiring a new costly well to be drilled. This is shown in the extensive

repair time of the wellhead in Table 4.1.

According to Holand (1997) tripping out is one of the top three most dangerous activities for

a well, retrieval of the tubing is therefore a dangerous activity. This raises the question of which

XT configuration has the safest setup during retrieval of the tubing. The HXT setup with the BOP

on top of the HXT makes this solution more vulnerable.

As seen in Table 4.1 the HXT wellhead has a considerably lower MTTF than the VXT. The

low MTTF of the HXT wellhead may be related to the low number of units recorded. No failures

were recorded as well, how the failure rate then was calculated is uncertain. If the MTTFs are

assumed to be correct, the level of availability and safety may be considerably lower than of the

VXT.

CHAPTER 4. QUALITATIVE RELIABILITY ANALYSIS OF X-MAS TREE CONFIGURATIONS 35

4.3.3 Flow Control Module

On a HXT the cost of pulling the tree is high, this imply that a FCM is the best choice with re-

gards to maintainability. However, this may impair the safety of the HXT with the addition of

complexity and leak paths.

4.4 Deepwater Vertical X-Mas Tree

4.4.1 Maintainability

The DVXT is more maintainable than the VXT. Because of the piping spool on the THS the

jumper is not disconnected when retrieving the tree. The annulus isolation valve also is ben-

eficial as a secondary barrier of the annulus during XT retrieval because it eliminates the need

for a temporary barrier in the annulus. The DVXT is therefore more maintainable for both tree

and tubing problems than the VXT. However, the HXT still has an advantage when over the DVXT

on tubing retrieval.

4.4.2 Leak Paths

The DVXT is a more complicated XT than the other configurations. Extra connections are made

subsea; the THS to wellhead and the XT to the flow spool on the THS. Connections are a vul-

nerable part with regards to leak paths. As seen in Table 2.1 the connectors are a very reliable

component; however, the infant mortality is not assessed.

If the connector fails during installation it has a high chance of being discovered. If a con-

nector is damaged this would require the connector to be replaced or the whole tree replaced.

This would cost a lot of money and installation time. The infant mortality in the burn-in period

is not found to be a problem but may be so. Many connector that is supposed to connect at the

same time make installation difficult and more tedious since more time is spent overseeing and

testing. When the connection is made and the XT put in service the low failure rate means that

in service the extra number of connectors are not a problem for the availability.

CHAPTER 4. QUALITATIVE RELIABILITY ANALYSIS OF X-MAS TREE CONFIGURATIONS 36

4.4.3 Flow Control Module

The cost of pulling a DVXT is the lowest of the three configurations, this may eliminate need for

a FCM from a maintainability perspective.

Chapter 5

Qualitative Comparison of X-Mas Tree

Configurations

This chapter highlights other factors than reliability that are important during the selection of

XT configuration.

5.1 OneSubsea Tree Selector Tool

To help their customers, the XT provider OneSubsea has made a tree selector tool available on

their web page (OneSubsea, 2015). The OneSubsea Tree Selector Tool (TST) is fully available to

their customers, but only a simple version that is available to the public is used in this thesis.

The TST uses ten categories listed in Table 5.1. In each category a slider is placed to rank the

importance of that category to the customer. The importance is rated from none to critical. The

result is given in a percentage on how each tree suits the customer’s ranking of the importance

of the categories.

With every category rated to middle criticality a baseline is established. Changing one cate-

gory at a time gave an indication on how each category affected what the result, this is shown in

Table 5.1.

OneSubsea has three types of XTs that are ranked in the result. A VXT, a HXT and a vertical

monobore subsea tree that looks similar to GE’s DVXT. In the description of OneSubsea’s tree

they mention a tubing spool that lets the annulus bypass the monobore tubing hanger. The

37

CHAPTER 5. QUALITATIVE COMPARISON OF X-MAS TREE CONFIGURATIONS 38

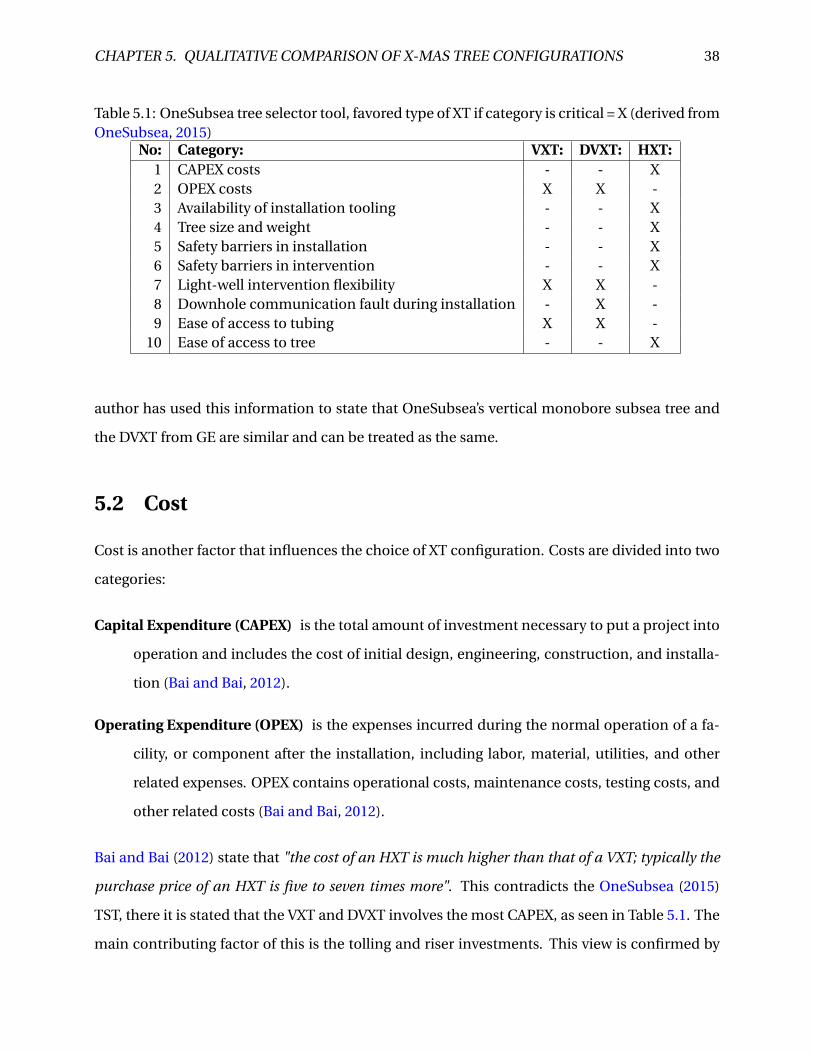
Table 5.1: OneSubsea tree selector tool, favored type of XT if category is critical = X (derived fromOneSubsea, 2015)

No: Category: VXT: DVXT: HXT:1 CAPEX costs - - X2 OPEX costs X X -3 Availability of installation tooling - - X4 Tree size and weight - - X5 Safety barriers in installation - - X6 Safety barriers in intervention - - X7 Light-well intervention flexibility X X -8 Downhole communication fault during installation - X -9 Ease of access to tubing X X -

10 Ease of access to tree - - X

author has used this information to state that OneSubsea’s vertical monobore subsea tree and

the DVXT from GE are similar and can be treated as the same.

5.2 Cost

Cost is another factor that influences the choice of XT configuration. Costs are divided into two

categories:

Capital Expenditure (CAPEX) is the total amount of investment necessary to put a project into

operation and includes the cost of initial design, engineering, construction, and installa-

tion (Bai and Bai, 2012).

Operating Expenditure (OPEX) is the expenses incurred during the normal operation of a fa-

cility, or component after the installation, including labor, material, utilities, and other

related expenses. OPEX contains operational costs, maintenance costs, testing costs, and

other related costs (Bai and Bai, 2012).

Bai and Bai (2012) state that "the cost of an HXT is much higher than that of a VXT; typically the

purchase price of an HXT is five to seven times more". This contradicts the OneSubsea (2015)

TST, there it is stated that the VXT and DVXT involves the most CAPEX, as seen in Table 5.1. The

main contributing factor of this is the tolling and riser investments. This view is confirmed by

CHAPTER 5. QUALITATIVE COMPARISON OF X-MAS TREE CONFIGURATIONS 39

Norwegian Oil & Gas (2012) which state that during installation "a HXT reduces the amount of

equipment needed, time, and cost".

The DVXT this is a more complex tree with more parts than a VXT. The expensive special

dual bore riser that a VXT requires is not necessary for a DVXT. The total CAPEX is not public,

but it can be assumed that the tree itself is more expensive than the VXT. It can also be assumed

that the tooling investments for a DVXT are much lower than a VXT, similar to a HXT.

The OneSubsea (2015) TST favors the VXT and DVXT if OPEX is critical. This is because of

the cost from wireline plug installation or removal on a HXT. On the other hand the HXT has

much lower cost from retrieving the tubing. The OPEX is therefore entirely dependent on what

type of failures that are expected in the well.

The DVXT may have a lower OPEX than the VXT because of the THS. The THS lowers the

amount of operations required during tubing retrieval.

Both the CAPEX and the OPEX is dependent on the variable factors in the subsea production

system. The HXT has the lowest CAPEX, but if the required riser and tooling already are available

the VXT can be favored. The OPEX depends on what type of interventions is expected in the well.

The OPEX discusses is only the cost associated with the tree and operation itself. The cost

of unavailability of the production is also a large contributor. However, this is covered in the

reliability analysis.

Chapter 6

Evaluation of X-Mas Tree Configurations

The selection process of a XT configuration is complex with many uncertainties. A good selec-

tion requires detailed expert knowledge of the production field being developed and the avail-

able configurations.

The selection seems obvious with the statements from Bai and Bai (2012) (see Section 4.2.1),

recommending a VXT for a gas well and a HXT for an oil well. However, the introduction of a

more complex tree that incorporate other benefits, make the selection more difficult. In addi-

tion for shallow water the advantages of the HXT on tubing retrieval may be negligible and the

VXT the best choice even for oil wells.

A key point in the selection process is good data. Good data combined with a RAM analysis

form a good foundation for the selection. Good knowledge of the subsea production system and

the oil/gas field is also important in establishing a realistic model to support the decision.

Molnes and Strand (2007) found that the choke valve and the SCM were the main XT compo-

nents to fail. Both these components are the same and independent of the different XT config-

urations. The low reliability of those components is solved through them being easy to retrieve

and replace with a smaller intervention vessel.

Lee et al. (2004) (see Section 3.2.1) had through a RAM analysis found the main components

to lower availability to be the wellhead and SCM. In choosing between the configurations there

is no influence on the SCM.

The interesting part from Lee et al. (2004) is the finding of the wellhead connector as a com-

ponent reducing system availability. This could have an impact on the selection of XT configu-

41

CHAPTER 6. EVALUATION OF X-MAS TREE CONFIGURATIONS 42

rations. As stated in Section 4.3.2 the HXT may have a higher strain on the wellhead connector

than the other XT configurations due to the combined height of the HXT and BOP during inter-

ventions. This phase is also critical since in would often imply that the dangerous procedure of

tripping out tubing is being conducted.

The DVXT may seem like a good choice despite of the well type. It induces less strain on the

wellhead compared to the HXT and is more maintainable than the VXT. The main problem with

the DVXT can be the increased installation time due to the extra number of connectors. The

DVXT is also a more complex system; simplicity in design increases the reliability and the DVXT

may therefore have worse inherent reliability than the VXT and HXT. This may be overcome with

the technology advances and the increased maintainability of the DVXT.

The author recommends that the end result of the decision process is made on the basis of

a RAM analysis. For wells where many or few tubing interventions are expected a RAM analysis

may not be necessary. In all other wells a RAM analysis should be conducted. Then proba-

bly the DVXT or other monobore XTs would more often be the best choice. This should not be

unexpected since these XTs are the new generation and is being developed to give better perfor-

mance.

Chapter 7

Summary and Recommendations for

Further Work

7.1 Summary and Conclusions

The focus of this thesis is to provide input for choosing the optimal XT configuration for a subsea

production system.

Throughout this thesis many different aspects of XTs are described and discussed through

literature studies. This is the first objective of this thesis.

The second objective in this thesis is to describe the main functions, components and the

reliability of those components. The functions are described in Section 2.1, they are also mod-

eled as functional block diagrams in Section 2.1.1. The subsea XT is used to direct, regulate, and

stop the flow from or to a well.

The main components and their reliability are described in Section 2.2. The functions of a

XT are achieved through several valves, mainly the production master valve, wing valve and the

choke valve. Other main components of the XT are the SCM and sensors.

The choke valve has the worst inherent reliability of the components on a XT. Because of this

the choke valve is designed for easy retrieval. The choke valve could also be placed in a separate

module together with some of the sensors. These are the sensors that are expected to require

replacement either due to failures or the changing characteristics of the well. This module is

called a FCM and is placed on the XT and easy to retrieve by a small intervention vessel. The

43

CHAPTER 7. SUMMARY 44

SCM is the XT component with the second worst reliability. Similar to the FCM, the SCM is

a module that is easy to retrieve and replace. Modularization is a good method of improving

system maintenance of unreliable components.

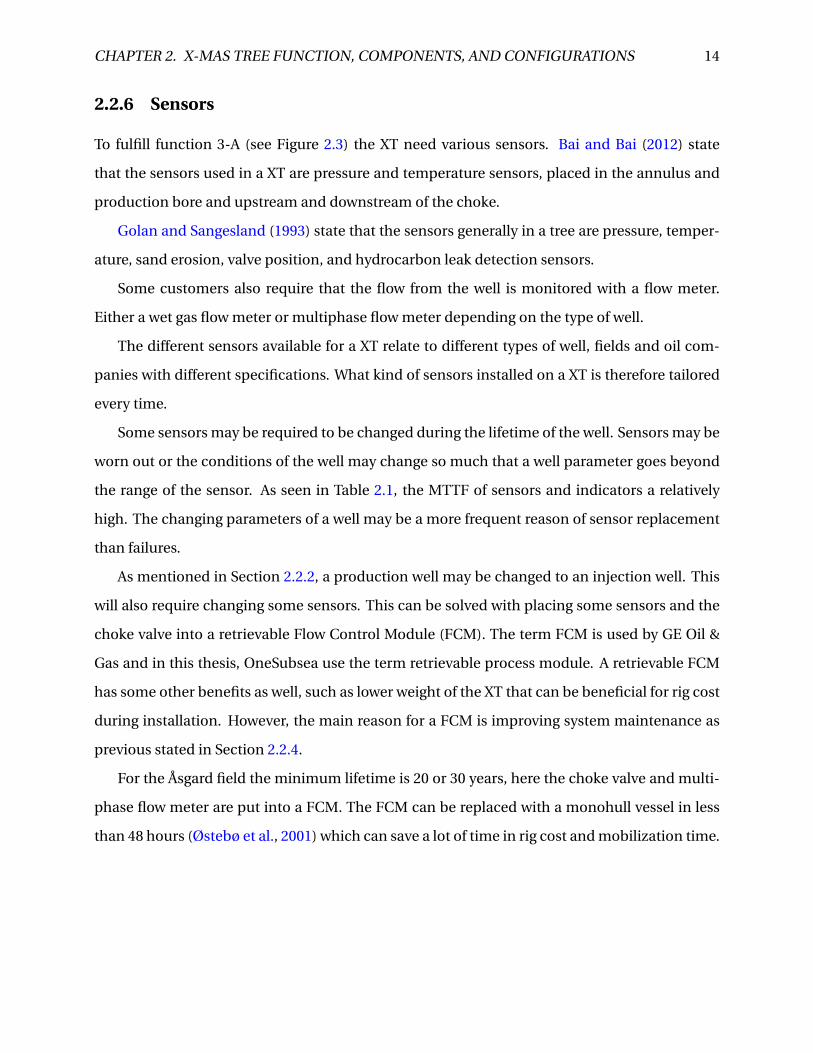
Objective three is to describe the different XT configurations and how they affect the relia-

bility of the subsea production system. The configurations are described in Section 2.3. There

are two main configurations which are the VXT and the HXT. A third configuration is also de-

scribed; the DVXT is a modified version of the VXT. The main differences are how the main

valves are placed and how the tubing with tubing hanger is installed. The DVXT is different from

the VXT because of the THS. The THS is installed on the wellhead, and then the tubing hanger

is installed and hung in the THS. The DVXT can then be installed on top of the THS in the same

way a VXT would be installed on the wellhead.

Objective four is to evaluate the reliability data and models that are used to assess the relia-

bility of a subsea XT, this is done in Chapter 3.

MTTF is the most used performance indicator of subsea reliability. The exponential distribu-

tion is the most frequently used model of a subsea components lifetime. This assumes constant

failure rate during the useful life period of a component, then the failure rate is constant propor-

tional with the MTTF. It is important to note that the "MTTF is merely a performance indicator,

not a lifetime prediction figure" (Molnes and Sundet, 1993).

The subsea production system is maintainable; the main reliability measure is then the avail-

ability. The availability consists of the inherent reliability, maintainability, recoverability, and the

maintenance support performance.

A good and frequently used method to analyze the availability of a subsea production sys-

tem is through RAM analysis software. It uses reliability block diagrams, flow diagrams, and

Monte Carlos next event simulation to simulate the lifetime and the availability of the subsea

production system.

RAM analysis is dependent on quality reliability data and expert knowledge on the system

to give a usable output. The sensitivity and uncertainty of assumptions should be considered.

Lesser quality data may still be useful if used correctly and the uncertainties are managed.

In a RAM analysis the inherent reliability is just one piece of the puzzle. The failure impact

is just as important. The wellhead connector is an example of this; it has high reliability, but will

CHAPTER 7. SUMMARY 45

have a large impact on the availability of the well if it is damaged.

Two main sources of reliability data for subsea components are OREDA (2009) and Molnes

and Strand (2007). There is some disparity between the two data sources. This could relate to

how, from when, or from where the data are collected.

When applying component reliability data in a RAM analysis, this often give a lower avail-

ability than experienced in real life. This most likely relates to the same problems experienced

in the disparity between the different reliability data sources.

A RAM analysis may still prove useful if these problems are handled correctly. Expert judg-

ment can be used to calibrate the data so that the model fit the real life scenario. The model and

analysis can then be used to optimize the reliability of the design.

OREDA (2009) distinguishes between data collected from wells with a HXT and VXT. A lower

MTTF is recorded for the VXT, this may relate to older generation VXTs installed. Understanding

the quality of the data is difficult and decisions should not be taken solely on the basis of data

straight form the OREDA handbook.

Objective five is a reliability assessment on the differences between the XT configurations.

An assessment consists of an analysis and an evaluation. A qualitative analysis is done in Chap-

ter 4 and the evaluation is conducted in Chapter 6.

A key difference between the XT configurations is the maintainability of the tree and the

tubing. Wells that is expected to have many tubing failures should be equipped with a HXT and

a VXT should be on a well with few tubing failures. This is mainly due to the order of which the

components are installed as the HXT allows the tubing to be retrieved without retrieving the tree

and vice versa for the VXT.

A failure on the wellhead connector will have a large impact on the availability. Interventions

on the HXT are done with a BOP on top of the HXT. The height of both these components puts

more strain on the wellhead than the other XT configurations. Tripping out tubing is one of the

more dangerous operations in a well; this combined with the extra strain on the wellhead may

cause bad consequences. This may give an advantage for the VXT in a risk perspective.

A XT with a FCM will have improved maintainability. The FCM adds leak paths and makes

the design more complex. The HXT is the configuration that would benefit the most of a FCM.

The VXT and DVXT are easier to retrieve and may have the benefit of a simpler design without

CHAPTER 7. SUMMARY 46

the FCM.

The DVXT is more maintainable than the VXT and does not have the challenges of the HXT

with the wellhead. This configuration may be a good choice of configuration for wells with a

medium amount of tubing failures. The DVXT is more complex and has more leak paths than

the other two configurations. The DVXT may have a higher infant mortality because of this.

Objective 6 is to describe and evaluate what should be assessed when selecting a XT con-

figuration for a new subsea well. Some factors that should be considered are described and

discussed in the qualitative analysis in Chapter 4. Some non-reliability factors are described in

Chapter 5.

As discussed in Section 3.2.1, Drakeley et al. (2001) suffered from limited field experience

of new technology. Drakeley et al. (2001) concluded that if data and model uncertainties are

handled a RAM analysis may still contribute to better design and reliability.

The expected failure rate of the tubing, the failure rate of the wellhead with different XT

configuration, and whether to have a FCM or not are important reliability drivers that can be

analyzed in RAM analysis software.

CAPEX and OPEX are also important factors in the decision process. The overall life cycle

cost is difficult to estimate. One result from the RAM analysis is the OPEX cost; this could easily

be combined with CAPEX to find optimal XT configuration from a cost perspective.

OneSubsea (2015) help their customers choose XT configuration with a TST. This gives a

basic indication of which configuration to choose for a well.

A RAM analysis would give an overall look on the reliability and life cycle cost of the subsea

production system. RAM analysis software is able to process the many varying factors that im-

pact the optimal XT configuration for a subsea production system and should be the foundation

of the decision process.

7.2 Discussion

The diversity of factors involved in subsea production systems make a general statement on

the optimal XT configuration hard to formulate. In some parts of the industry the factors of

configurations selection is well known. As stated in the Limitations (Section 1.3), the limited

CHAPTER 7. SUMMARY 47

open research and data available are a limitation for this kind of research and has limited the

result of this thesis.

7.3 Recommendations for Further Work

The next step after this thesis may be to conduct a quantitative RAM analysis using software

described in Section 3.2.1. It should investigate the impact of tubing failure on the cost and

availability of a subsea well with different XT configurations. A finding may be an intersection

between tubing failure rate and the optimal XT configurations. A base case scenario of a sub-

sea production system should be established. Then three different setups with the three XT

configurations should be established. The failure rate of the tubing can then be adjusted. The

availability and cost could then be assessed as the tubing failure rate is adjusted.

Another topic of further research can be the effect that a HXT and BOP has on the wellhead.

As discussed in Section 4.3.2 the failure rate of a wellhead with a HXT may have a lower level of

availability and safety than a VXT. This could be researched further, a thorough review of failure

data and loads on the wellhead is recommended. The focus could be on wellheads and the

different XT configurations that are installed on them. A deeper look into more detailed OREDA

data may provide some results on this topic.

Appendix A

Acronyms

BOP blowout preventer

CAPEX capital expenditures

TST tree selector tool

DVXT deepwater vertical x-mas tree

FCM flow control module

GE General Electric

HXT horizontal x-mas tree

IDEF0 integration definition 0

MTTF mean time to failure

OPEX operating expenditure

OREDA offshore reliability database

PMV production master valve

PWV production wing valve

RAM reliability, availability, and maintainability

49

APPENDIX A. ACRONYMS 50

RAMS reliability, availability, maintainability, and safety

SCM subsea control module

THS tubing head spool

VXT vertical x-mas tree

XT x-mas tree

Appendix B

Definitions

Blowout an uncontrolled flow of fluids from a wellhead or wellbore (Holand, 1997).

Conductor housing is the top of the casing conductor, the casing conductor is installed through

the temporary guide base, either by piling or drilling, and provides an installation point

for the permanent guide base and a landing area for the wellhead housing (Bai and Bai,

2012).

Jumper a short pipe connector that is used to transport production fluid between two subsea

components, for example, a tree and a manifold (Bai and Bai, 2012).

Lower marine riser package a device similar to a small BOP attached to the tree mandrel used

for emergency well control and riser disconnect when running, retrieving or working over

a dual bore tree (Richbourg and Winter, 1998).

Manifold an arrangement of piping and/or valves designed to combine, distribute, control, and

often monitor fluid flow (Bai and Bai, 2012).

Permanent guide base is installed on the conductor housing, establishes structural support

and final alignment for the wellhead system. The permanent guide base provides guid-

ance and support for running the BOP stack or the subsea tree (Bai and Bai, 2012).

Production tubing the tubing through which the production fluids are delivered from the reser-

voir to the production tree (Richbourg and Winter, 1998).

51

APPENDIX B. DEFINITIONS 52

Tubing see production tubing.

Tubing hanger a component of the wellhead system for supporting the production tubing in

the well (Richbourg and Winter, 1998).

Well barrier envelope of one or several well barrier elements preventing fluids from flowing

unintentionally from the formation into the wellbore, into another formation, or to the

external environment (NORSOK D-010, 2013).

Well integrity application of technical, operational and organizational solutions to reduce risk

of uncontrolled release of formation fluids and well fluids throughout the life cycle of a

well (NORSOK D-010).

Wellhead a structural and pressure-containing anchoring point on the seabed for the drilling,

casing strings, and completion systems (Bai and Bai, 2012).

Bibliography

Aven, T. and Pedersen, L. M. (2014). On how to understand and present the uncertainties in

production assurance analyses, with a case study related to a subsea production system. Re-

liability Engineering & System Safety, 124(0):165 – 170.

Bai, Y. and Bai, Q. (2012). Subsea engineering handbook. Elsevier/Gulf Professional Pub., Ams-

terdam.

Brandt, H. and Eriksen, R. (2001). RAM Analysis for Deepwater Subsea Developments. Offshore

Technology Conference.

Drakeley, B. K., Douglas, N. I., Haugen, K. E., and Willmann, E. (2001). Application of reliability

analysis techniques to intelligent wells. In Offshore Technology Conference, 4/30/2001, Hous-

ton, Texas.

GE Oil & Gas (2012). T13.4.2 subsea tree system, technical submisson.

Golan, M. and Sangesland, S. (1993). Subsea production systems: an overview. Norges Tekniske

Høgskole, Trondheim.

Holand, P. (1997). Offshore blowouts: causes and control. Gulf Publ. Co., Houston, Tex.

IEV Online (2015). Electropedia, International Electrotechnical Vocabulary. International Elec-

trotechnical Commission. www.electropedia.org available online, accessed: 29.04.2015.

ISO 13628-4 (2010). Petroleum and natural gas industries – Design and operation of subsea pro-

duction systems – Part 4: Subsea wellhead and tree equipment. International Organization for

Standardization, Geneva.

53

BIBLIOGRAPHY 54

ISO 31320-1 (2012). Information technology - Modeling Languages - Part 1: Syntax and Seman-

tics for IDEF0. International Organization for Standardization, Geneva.

Jardine, I. (1986). Production system design: The relationships between reliability, redundancy

and maintenance philosophy. In Modular Subsea Production Systems: Proceedings of an In-

ternational Conference, 25-26 November, London, UK, pages –. Society of Underwater Tech-

nology.

Lee, D., Nam, K., Kim, J., Min, J., Chang, K., and Lee, S. (2004). RAM Study On the Subsea Produc-

tion System of an Offshore Oil And Gas Platform. International Society of Offshore and Polar

Engineers.

Molnes, E. and Strand, G.-O. (2007). SubseaMaster: Experience database for subsea production

systems - Phase 3, Main report. ExproSoft.

Molnes, E. and Sundet, I. (1993). Reliability of well completion equipment. pages –. Society of

Petroleum Engineers.

NORSOK D-010 (2013). NORSOK standard: Well integrity in drilling and well operations, D-010.

The competitive standing of the Norwegian offshore sector, NORSOK.

Norwegian Oil & Gas (2012). An Introduction to Well Integrity. Norwegian Oil and Gas Associa-

tion’s Well Integrity Forum (WIF) and professors at NTNU and UiS.

OneSubsea (2015). OneSubsesa’s subsea tree selector tool - the brain behind your tree selection

process. http://mm.onesubsea.com/treeselector/ available online, accessed: 29.04.2015.

OREDA (2009). OREDA : offshore reliability data handbook, volume 2 : Subsea equipment.

OREDA Participants, Trondheim, 5th edition.

Østebø, R., Kallestad, O., and Grytdal, I. (2001). Subsea Reliability- Success factors for sustainable

deepwater concept development. Offshore Technology Conference.

Quest Offshore (2013). Global Subsea Market Set for 60% Growth in Next Five Years.

Quest Offshore. http://questoffshore.com/wp-content/uploads/2013/09/

Quest-Subsea-PR-Dec-2013.pdf available online, accessed: 25.05.2015.

BIBLIOGRAPHY 55

Rausand, M. and Høyland, A. (2004). System Reliability Theory: Models, Statistical Methods, and

Applications. Wiley, Hoboken, NJ, 2nd edition.

Richbourg, M. A. and Winter, K. A. (1998). Subsea trees and wellheads: The basics. Offshore: The

journal of ocean business, 58(12):49–57.

Stendebakken, O. I. (2014). A reliability study of a Deepwater Vertical Xmas Tree with attention

to XT retrieval rate. Master Thesis at NTNU, Department of Marine Technology.


Recommended