24
Company Report Industry: Oil & Gas Avishek Datta ([email protected]) +91-22-66322254 Reliance Industries At the cusp of transformation
Company Report Industry: Oil & Gas
Avishek Datta ([email protected]) +91-22-66322254
Reliance Industries At the cusp of transformation

May 12, 2016 2
Reliance Industries
Prabhudas Lilladher Pvt. Ltd. and/or its associates (the 'Firm') does and/or seeks to do business with companies covered in its research reports. As a result investors should be aware that the Firm may have a conflict of interest that could affect the objectivity of the report. Investors should consider this report as only a single factor in making their investment decision.
Please refer to important disclosures and disclaimers at the end of the report
Contents Page No.
Investment Argument ................................................................................................. 4
New projects to drive operating profit at 16% CAGR over FY16-18E ................................................ 4
Earnings momentum is back ............................................................................................................. 4
Core business in fine fettle - Refining margins remain healthy ......................................................... 6
Strong demand drives refining margins higher ............................................................................ 6
Demand momentum remain healthy .......................................................................................... 6
Refining capacity addition trails demand .................................................................................... 8
RIL’s GRM outperformance- Multiple factors at play ........................................................................ 9
Meanwhile, weak gasoil margins remain a concern ....................................................................... 10
However, rising discounts from Middle East oil producers is a positive ......................................... 11
Petcoke gasification project to give fillip to margins ....................................................................... 12
Asian integrated crackers benefit from low naphtha prices ........................................................... 13
Sensitivity and Risks .................................................................................................. 17
Financial Analysis ...................................................................................................... 20
Valuation and View ................................................................................................... 21

Reliance Industries
Company Report May 12, 2016
Rating Accumulate
Price Rs975
Target Price Rs1,034
Implied Upside 6.1%
Sensex 25,597
Nifty 7,849
(Prices as on May 11, 2016)
Trading data
Market Cap. (Rs bn) 3,159.0
Shares o/s (m) 3,240.0
3M Avg. Daily value (Rs m) 4,312.7
Major shareholders
Promoters 46.53%
Foreign 7.39%
Domestic Inst. 25.84%
Public & Other 20.24%
Stock Performance
(%) 1M 6M 12M
Absolute (6.2) 5.1 8.9
Relative (8.5) 6.1 15.8
How we differ from Consensus
EPS (Rs) PL Cons. % Diff.
2017 83.1 88.5 -6.1
2018 103.5 103.8 -0.3
Price Performance (RIC: RELI.BO, BB: RIL IN)
Source: Bloomberg
0
200
400
600
800
1,000
1,200
May
-15
Jul-
15
Sep
-15
No
v-1
5
Jan
-16
Mar
-16
May
-16
(Rs)
Stepping on the accelerator: RIL is at the cusp of a major transformation led by
commissioning of the US$18.5bn petrochemical projects in H2FY17E. While the
commissioning of the PTA and PET capacities (part of petrochemicals
expansion), along with higher refining profits, supported 21% YoY earnings
growth in FY16, minimal capacity addition/stabilisation in FY17E, along with
plateauing refining margins, are likely to push earnings growth to FY18E.
Project value accretion to improve with crude prices: RIL’s transformational
petrochemicals project is likely to generate incremental EBITDA of ~Rs155bn
(US$2.3bn) in FY18E. Project economics are likely to improve with higher
commodity prices. Among the projects, ethane substitution along with refinery
offgas cracker project, designed to use refinery offgas for petrochemicals
remain attractive. However, sharp drop in spot LNG prices would impact returns
on petcoke gassification.;We calculate GRM benefit of US$1.3/bbl in FY18E.
Core earnings in fine fettle: RIL’s core business continues to remain healthy as
product demand revival in US, China and India along with trailing capacity
addition support refining margins (GRMs). Though drop in gasoil spreads is a
concern, benefits like rising discounts from the Middle East producers and lower
operating cost is to aid refining margins. Also, sharp drop in naphtha prices will
benefit the Asian integrated naphtha crackers, as cracker margins are supported
by delays in new US and Chinese supplies, given crude price correction.
Initiate with an ‘Accumulate’: We initiate with an ‘Accumulate’ on RIL at a PT of
Rs1,034 based on SOTP. We expect RIL’s earnings (excl. telecom) to grow at
~11% CAGR over FY16-18E, ROE to expand 120bps over FY16-18E on the back of
improved fundamentals. However, the continued uncertainty on Reliance Jio’s
(RJio’s) launch date and rising capex (US$23bn) remains an overhang.
Key financials (Y/e March) 2015 2016 2017E 2018E
Revenues (Rs m) 3,287,720 2,331,580 2,938,657 3,115,302
Growth (%) (15.7) (29.1) 26.0 6.0
EBITDA (Rs m) 316,710 401,390 427,776 537,708
PAT (Rs m) 227,190 274,170 269,254 335,419
EPS (Rs) 70.2 84.6 83.1 103.5
Growth (%) 3.2 20.5 (1.8) 24.6
Net DPS (Rs) 13.0 14.0 15.0 16.0
Profitability & Valuation 2015 2016 2017E 2018E
EBITDA margin (%) 9.6 17.2 14.6 17.3
RoE (%) 11.0 12.0 11.0 13.2
RoCE (%) 8.0 8.7 8.3 9.8
EV / sales (x) 1.2 1.8 1.4 1.3
EV / EBITDA (x) 12.7 10.2 9.7 7.7
PE (x) 13.9 11.5 11.7 9.4
P / BV (x) 1.5 1.3 1.3 1.2
Net dividend yield (%) 1.3 1.4 1.5 1.6
Source: Company Data; PL Research
Reliance Industries
May 12, 2016 4
Investment Argument
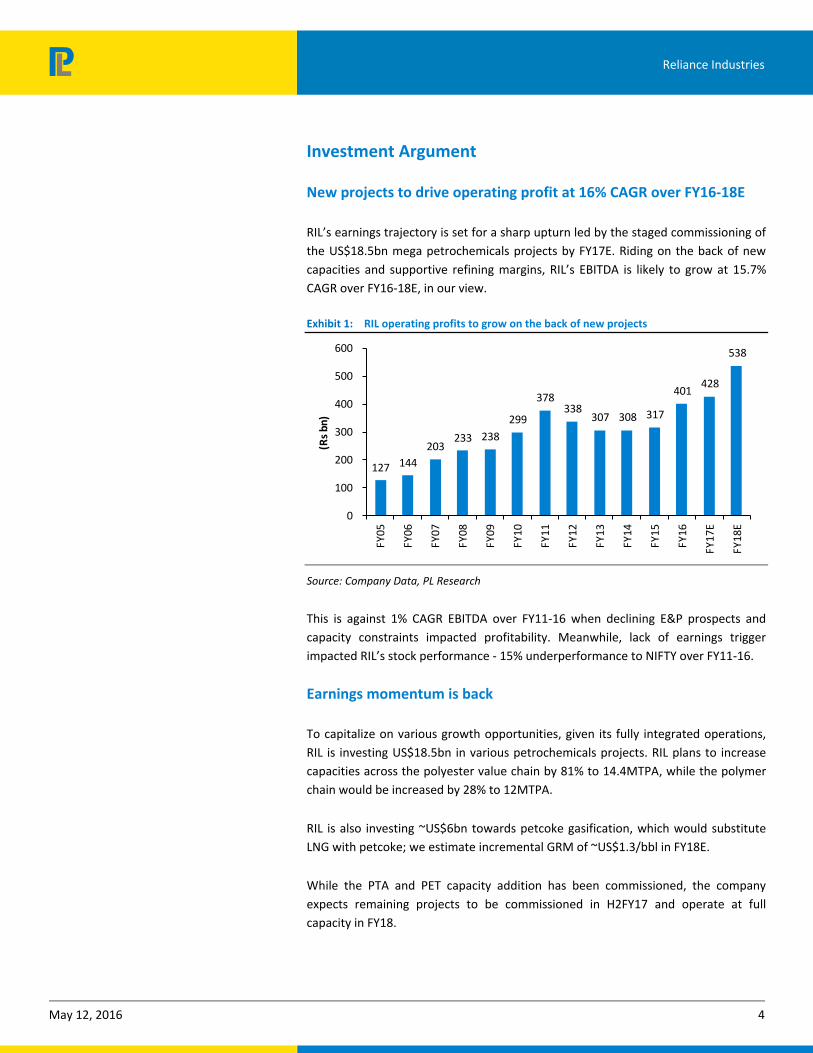
New projects to drive operating profit at 16% CAGR over FY16-18E
RIL’s earnings trajectory is set for a sharp upturn led by the staged commissioning of
the US$18.5bn mega petrochemicals projects by FY17E. Riding on the back of new
capacities and supportive refining margins, RIL’s EBITDA is likely to grow at 15.7%
CAGR over FY16-18E, in our view.
Exhibit 1: RIL operating profits to grow on the back of new projects
127 144
203 233 238
299
378 338
307 308 317
401 428
538
0
100
200
300
400
500
600
FY05
FY06
FY07
FY08
FY09
FY10
FY11
FY12
FY13
FY14
FY15
FY16
FY17
E
FY
18
E
(Rs
bn
)
Source: Company Data, PL Research
This is against 1% CAGR EBITDA over FY11-16 when declining E&P prospects and
capacity constraints impacted profitability. Meanwhile, lack of earnings trigger
impacted RIL’s stock performance - 15% underperformance to NIFTY over FY11-16.
Earnings momentum is back
To capitalize on various growth opportunities, given its fully integrated operations,
RIL is investing US$18.5bn in various petrochemicals projects. RIL plans to increase
capacities across the polyester value chain by 81% to 14.4MTPA, while the polymer
chain would be increased by 28% to 12MTPA.
RIL is also investing ~US$6bn towards petcoke gasification, which would substitute
LNG with petcoke; we estimate incremental GRM of ~US$1.3/bbl in FY18E.
While the PTA and PET capacity addition has been commissioned, the company
expects remaining projects to be commissioned in H2FY17 and operate at full
capacity in FY18.
Reliance Industries
May 12, 2016 5
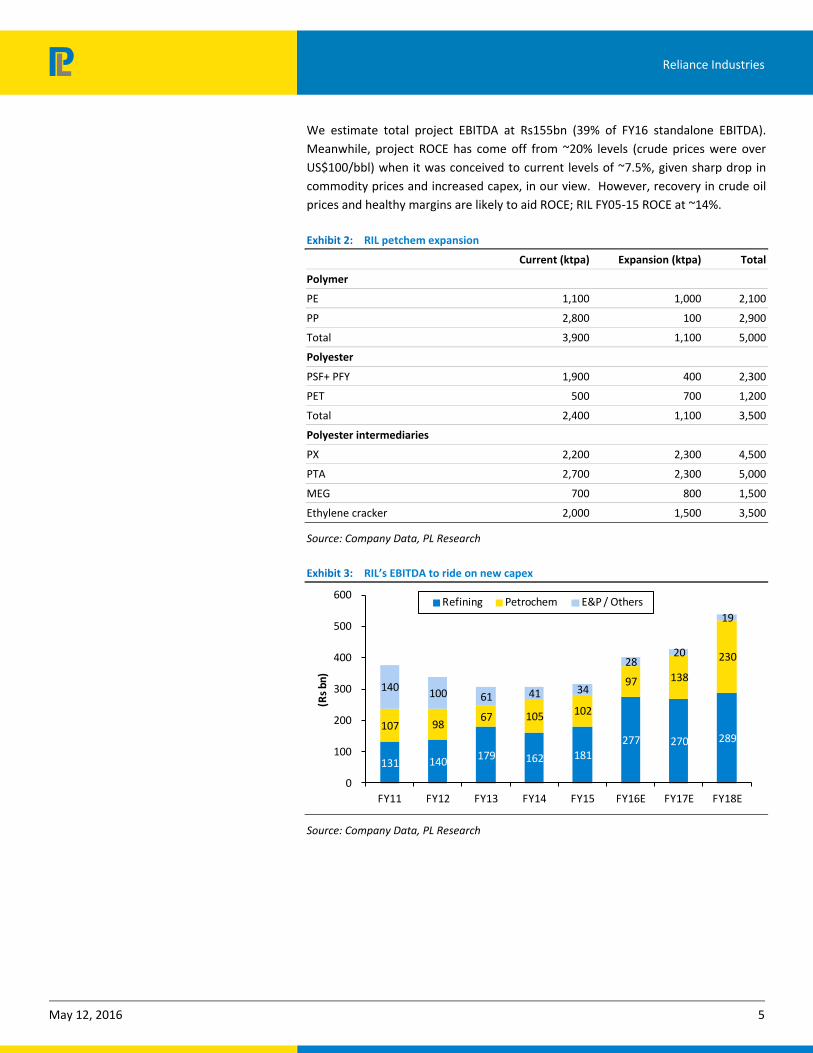
We estimate total project EBITDA at Rs155bn (39% of FY16 standalone EBITDA).
Meanwhile, project ROCE has come off from ~20% levels (crude prices were over
US$100/bbl) when it was conceived to current levels of ~7.5%, given sharp drop in
commodity prices and increased capex, in our view. However, recovery in crude oil
prices and healthy margins are likely to aid ROCE; RIL FY05-15 ROCE at ~14%.
Exhibit 2: RIL petchem expansion
Current (ktpa) Expansion (ktpa) Total
Polymer
PE 1,100 1,000 2,100
PP 2,800 100 2,900
Total 3,900 1,100 5,000
Polyester
PSF+ PFY 1,900 400 2,300
PET 500 700 1,200
Total 2,400 1,100 3,500
Polyester intermediaries
PX 2,200 2,300 4,500
PTA 2,700 2,300 5,000
MEG 700 800 1,500
Ethylene cracker 2,000 1,500 3,500
Source: Company Data, PL Research
Exhibit 3: RIL’s EBITDA to ride on new capex
131 140 179 162 181
277 270 289 107 98
67 105 102
97 138
230
140 100 61 41 34
28 20
19
0
100
200
300
400
500
600
FY11 FY12 FY13 FY14 FY15 FY16E FY17E FY18E
(Rs
bn)
Refining Petrochem E&P / Others
Source: Company Data, PL Research
Reliance Industries
May 12, 2016 6
Core business in fine fettle - Refining margins remain healthy
Strong demand drives refining margins higher
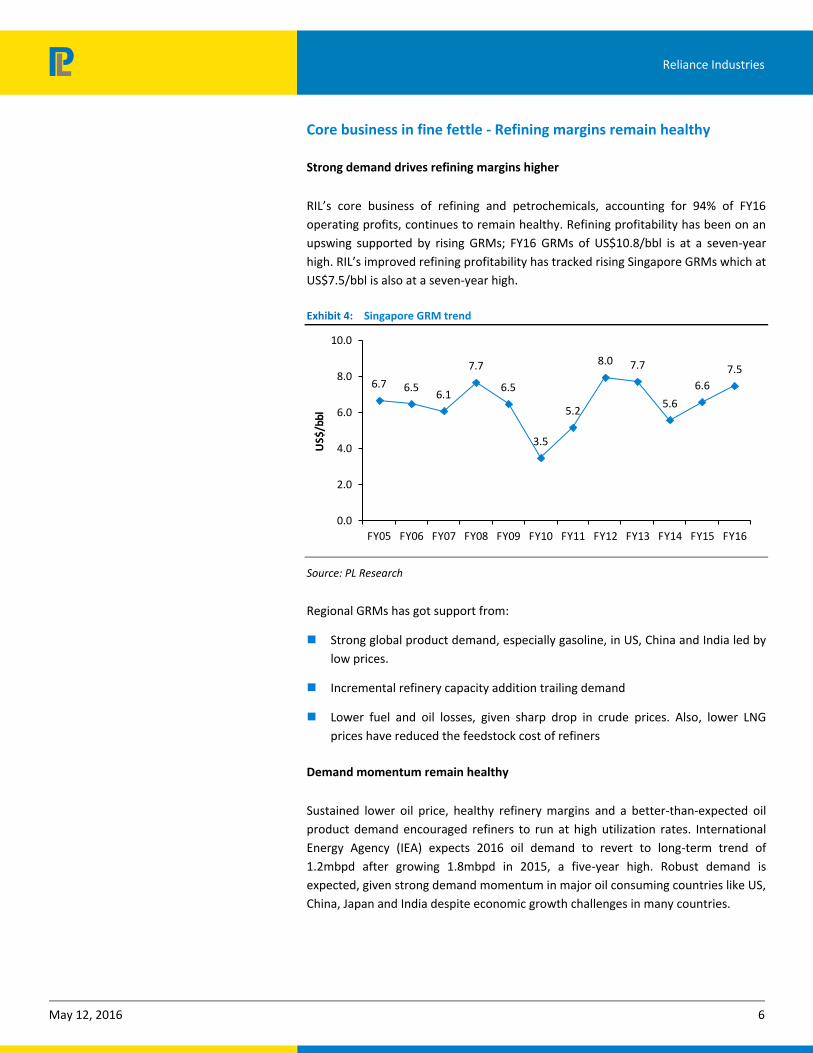
RIL’s core business of refining and petrochemicals, accounting for 94% of FY16
operating profits, continues to remain healthy. Refining profitability has been on an
upswing supported by rising GRMs; FY16 GRMs of US$10.8/bbl is at a seven-year
high. RIL’s improved refining profitability has tracked rising Singapore GRMs which at
US$7.5/bbl is also at a seven-year high.
Exhibit 4: Singapore GRM trend
6.7 6.56.1
7.7
6.5
3.5
5.2
8.0 7.7
5.6
6.6
7.5
0.0
2.0
4.0
6.0
8.0
10.0
FY05 FY06 FY07 FY08 FY09 FY10 FY11 FY12 FY13 FY14 FY15 FY16
US$
/bbl
Source: PL Research
Regional GRMs has got support from:
Strong global product demand, especially gasoline, in US, China and India led by
low prices.
Incremental refinery capacity addition trailing demand
Lower fuel and oil losses, given sharp drop in crude prices. Also, lower LNG
prices have reduced the feedstock cost of refiners
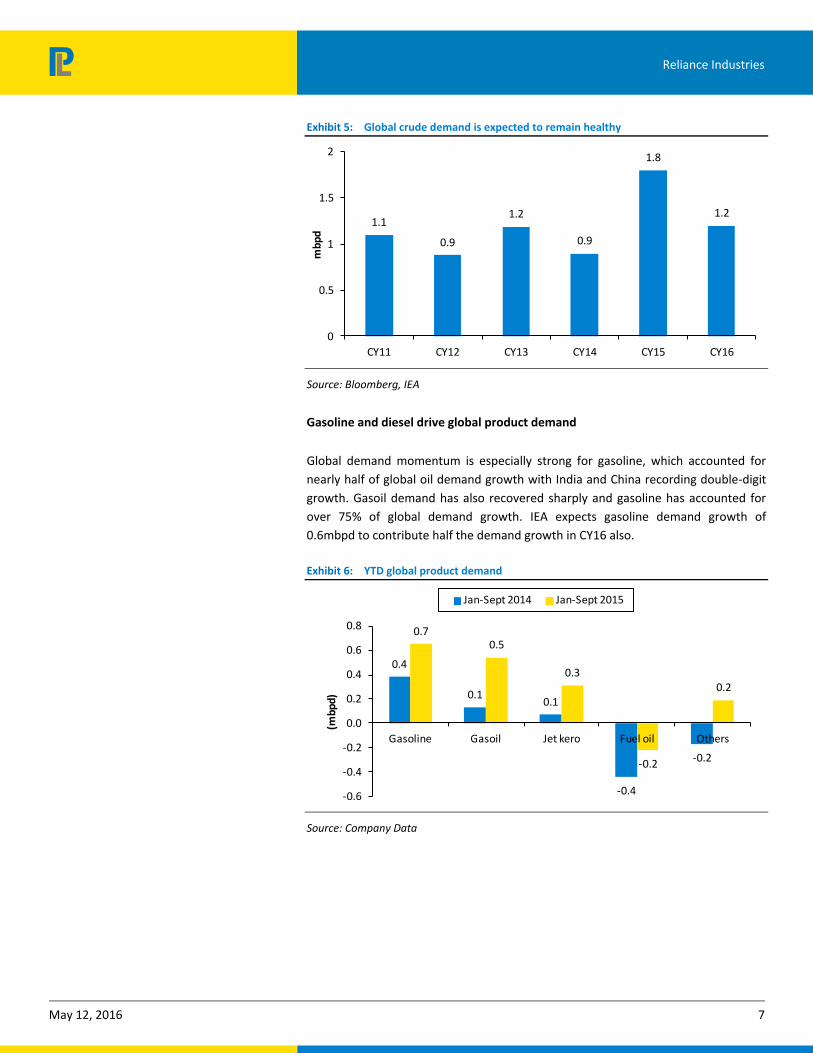
Demand momentum remain healthy
Sustained lower oil price, healthy refinery margins and a better-than-expected oil
product demand encouraged refiners to run at high utilization rates. International
Energy Agency (IEA) expects 2016 oil demand to revert to long-term trend of
1.2mbpd after growing 1.8mbpd in 2015, a five-year high. Robust demand is
expected, given strong demand momentum in major oil consuming countries like US,
China, Japan and India despite economic growth challenges in many countries.
Reliance Industries
May 12, 2016 7
Exhibit 5: Global crude demand is expected to remain healthy
1.1
0.9
1.2
0.9
1.8
1.2
0
0.5
1
1.5
2
CY11 CY12 CY13 CY14 CY15 CY16
mbp
d
Source: Bloomberg, IEA
Gasoline and diesel drive global product demand
Global demand momentum is especially strong for gasoline, which accounted for
nearly half of global oil demand growth with India and China recording double-digit
growth. Gasoil demand has also recovered sharply and gasoline has accounted for
over 75% of global demand growth. IEA expects gasoline demand growth of
0.6mbpd to contribute half the demand growth in CY16 also.
Exhibit 6: YTD global product demand
0.4
0.10.1
-0.4
-0.2
0.70.5
0.3
-0.2
0.2
-0.6
-0.4
-0.2
0.0
0.2
0.4
0.6
0.8
Gasoline Gasoil Jet kero Fuel oil Others
(mbp
d)
Jan-Sept 2014 Jan-Sept 2015
Source: Company Data
Reliance Industries
May 12, 2016 8
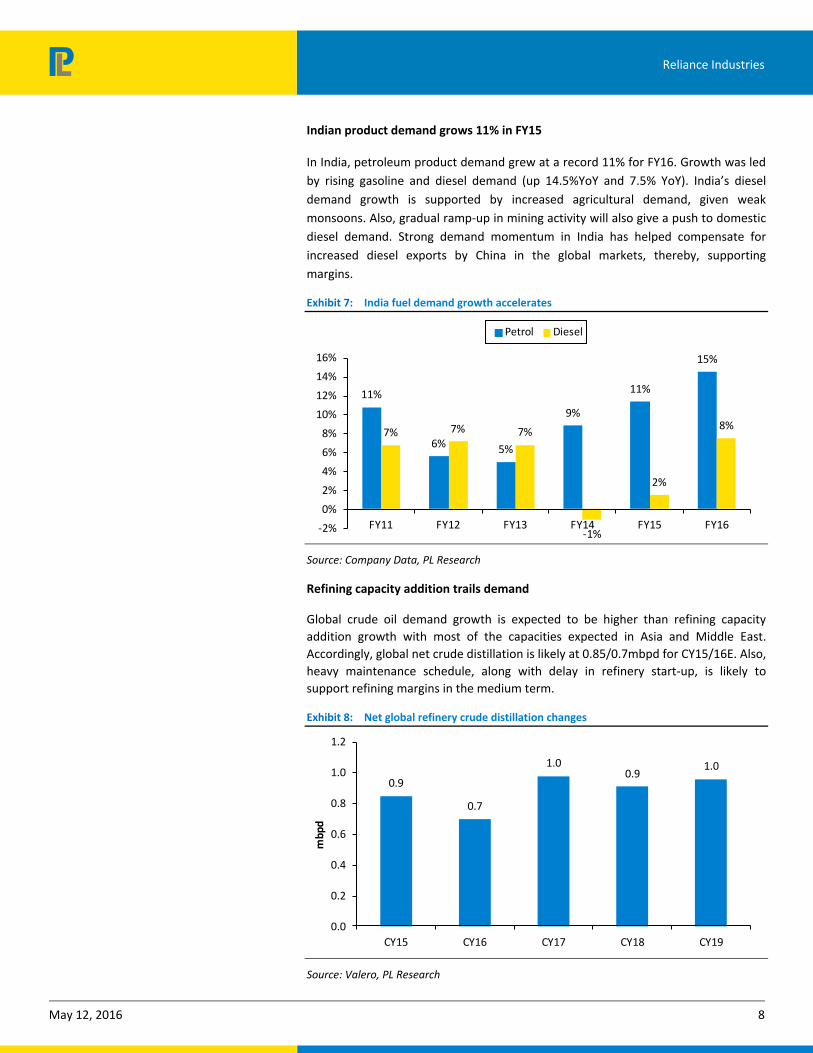
Indian product demand grows 11% in FY15
In India, petroleum product demand grew at a record 11% for FY16. Growth was led
by rising gasoline and diesel demand (up 14.5%YoY and 7.5% YoY). India’s diesel
demand growth is supported by increased agricultural demand, given weak
monsoons. Also, gradual ramp-up in mining activity will also give a push to domestic
diesel demand. Strong demand momentum in India has helped compensate for
increased diesel exports by China in the global markets, thereby, supporting
margins.
Exhibit 7: India fuel demand growth accelerates
11%
6% 5%
9%
11%
15%
7% 7% 7%
-1%
2%
8%
-2%
0%
2%
4%
6%
8%
10%
12%
14%
16%
FY11 FY12 FY13 FY14 FY15 FY16
Petrol Diesel
Source: Company Data, PL Research
Refining capacity addition trails demand
Global crude oil demand growth is expected to be higher than refining capacity
addition growth with most of the capacities expected in Asia and Middle East.
Accordingly, global net crude distillation is likely at 0.85/0.7mbpd for CY15/16E. Also,
heavy maintenance schedule, along with delay in refinery start-up, is likely to
support refining margins in the medium term.
Exhibit 8: Net global refinery crude distillation changes
0.9
0.7
1.00.9
1.0
0.0
0.2
0.4
0.6
0.8
1.0
1.2
CY15 CY16 CY17 CY18 CY19
mbp
d
Source: Valero, PL Research
Reliance Industries
May 12, 2016 9
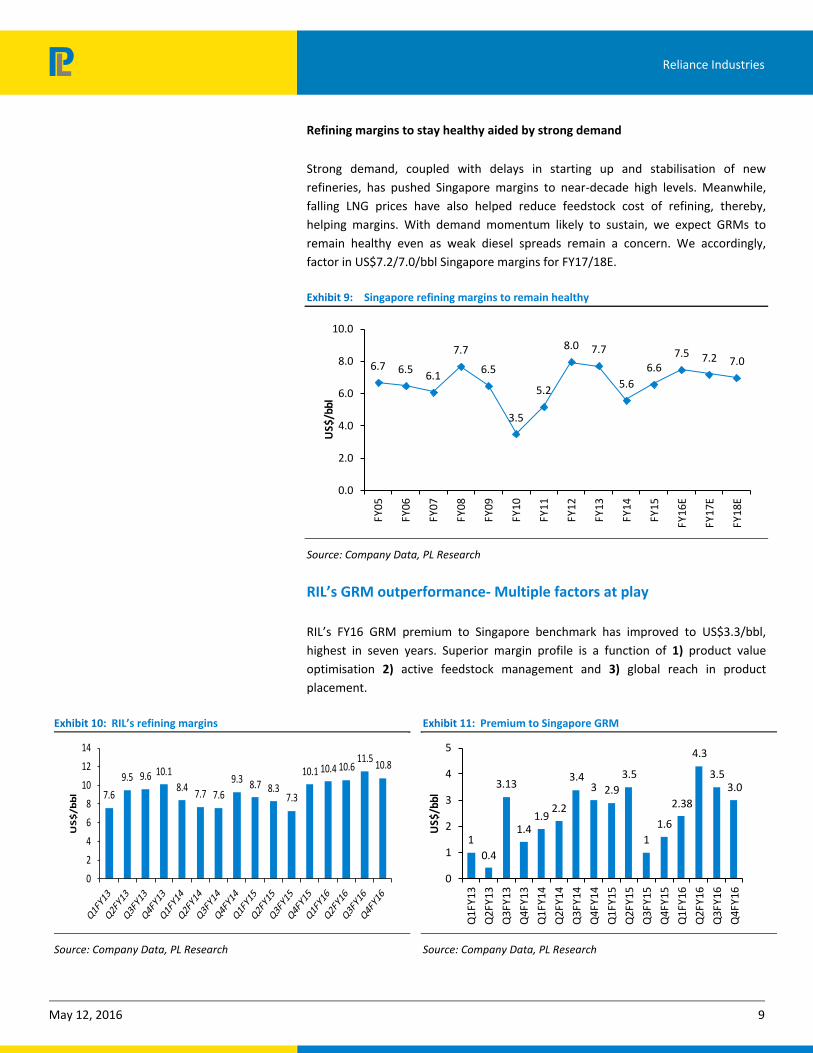
Refining margins to stay healthy aided by strong demand
Strong demand, coupled with delays in starting up and stabilisation of new
refineries, has pushed Singapore margins to near-decade high levels. Meanwhile,
falling LNG prices have also helped reduce feedstock cost of refining, thereby,
helping margins. With demand momentum likely to sustain, we expect GRMs to
remain healthy even as weak diesel spreads remain a concern. We accordingly,
factor in US$7.2/7.0/bbl Singapore margins for FY17/18E.
Exhibit 9: Singapore refining margins to remain healthy
6.7 6.56.1
7.7
6.5
3.5
5.2
8.0 7.7
5.6
6.67.5 7.2 7.0
0.0
2.0
4.0
6.0
8.0
10.0
FY05
FY06
FY07
FY
08
FY
09
FY10
FY11
FY12
FY13
FY14
FY
15
FY
16
E
FY17
E
FY18
E
US$
/bbl
Source: Company Data, PL Research
RIL’s GRM outperformance- Multiple factors at play
RIL’s FY16 GRM premium to Singapore benchmark has improved to US$3.3/bbl,
highest in seven years. Superior margin profile is a function of 1) product value
optimisation 2) active feedstock management and 3) global reach in product
placement.
Exhibit 10: RIL’s refining margins
7.6
9.5 9.6 10.1
8.47.7 7.6
9.3 8.7 8.37.3
10.1 10.4 10.611.5
10.8
0
2
4
6
8
10
12
14
US
$/b
bl
Source: Company Data, PL Research
Exhibit 11: Premium to Singapore GRM
1
0.4
3.13
1.41.9
2.2
3.43 2.9
3.5
1
1.6
2.38
4.3
3.53.0
0
1
2
3
4
5
Q1
FY
13
Q2
FY
13
Q3
FY
13
Q4
FY
13
Q1
FY
14
Q2
FY
14
Q3
FY
14
Q4
FY
14
Q1
FY
15
Q2
FY
15
Q3
FY
15
Q4
FY
15
Q1
FY
16
Q2
FY
16
Q3
FY
16
Q4
FY
16
US
$/b
bl
Source: Company Data, PL Research

Reliance Industries
May 12, 2016 10
Product value optimisation: RIL has increased production of light distillates,
primarily petrol, to capitalise on gasoline margin strength. In FY16, RIL has increased
production of higher margin gasoline and alkylates to 15.2MMT. Also, RIL’s inherent
capability to swing production trend to match highest value product drives margin
outperformance.
Feedstock management: RIL’s superior refining configuration provides flexibility to
switch grades and process a wide range of crude - 149 different crude varieties till
date. The company is the first refiner to process cheaper Basra Heavy crude from
Iraq. Also, the company is also tying up with Iranian crude oil to optimise margins.
Product placement strategy: RIL has a global presence when it comes to product
placement. For the middle distillates, RIL places bulk of the products in the Middle
East, Europe and Africa. However, for gasoline, the company places majority of
products in the Middle East, Americas, South East Asia and Africa.
Exhibit 12: RIL middle distillate placement by region
Middle East25%
Africa19%
Latin America
13%
SE Asia7%
Australia1%
Europe
35%
Source: PL Research
Exhibit 13: RIL gasoline placement by region
Middle East
47%
Africa
15%
Americas
19%
SE Asia
18%
Australia1%
Source: PL Research
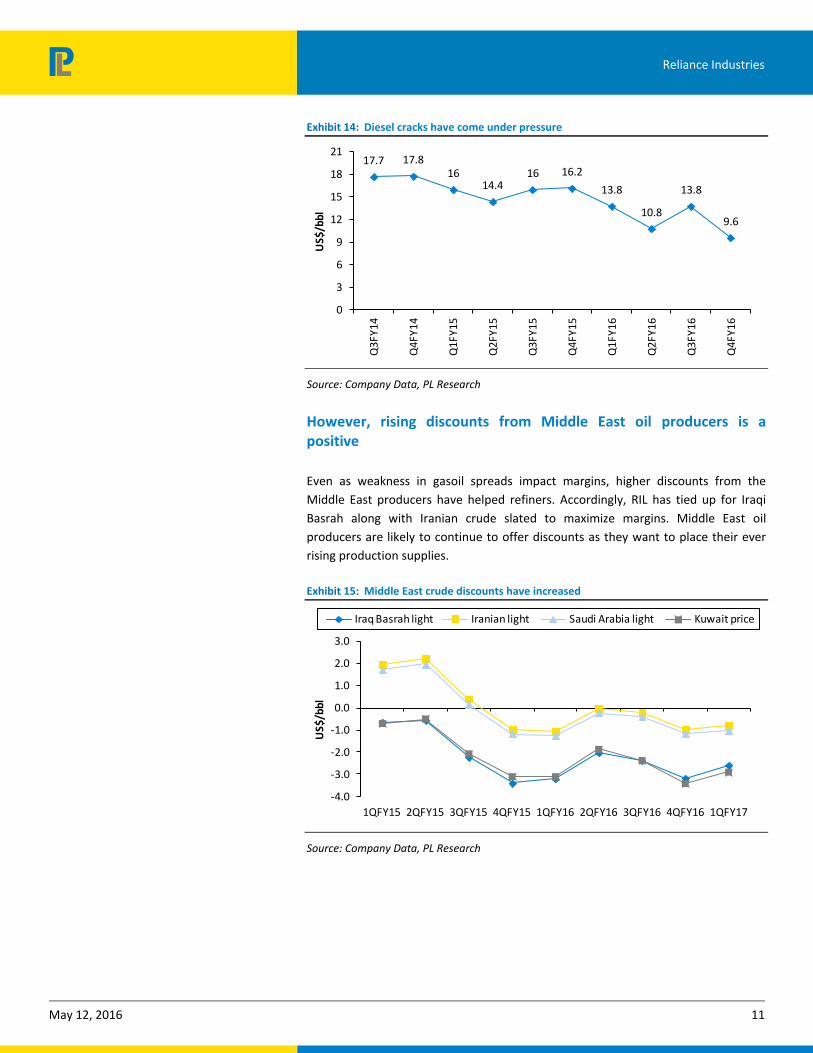
Meanwhile, weak gasoil margins remain a concern
Even as the benchmark indices continue to remain healthy, weakness in gasoil cracks
is a concern. Q4FY16 gasoil spreads fell to US$9.6/bbl (-US4.2/bbl QoQ) led by
increased exports from China amidst weakening industrial demand. FY16 gasoil
spreads of US$12/bbl is lower than FY14/15 levels of ~US$17/16/bbl.
Higher diesel supplies from new capacities being commissioned in the Middle East
and Asia which have heavy diesel slate, is likely to exert pressure on cracks.
With diesel forming ~40% in RIL’s product slate against ~16% in benchmark
Singapore GRM, premiums will come under pressure, in our view. Accordingly, we
factor in US$10.75/11.25/bbl for FY16/17/18E refining margins. This includes
US$0.25/1.25/bbl benefit from petcoke gasification in FY17/18E.
Reliance Industries
May 12, 2016 11
Exhibit 14: Diesel cracks have come under pressure
17.7 17.816
14.416 16.2
13.8
10.8
13.8
9.6
0
3
6
9
12
15
18
21
Q3F
Y14
Q4
FY
14
Q1F
Y15
Q2
FY
15
Q3F
Y15
Q4F
Y15
Q1
FY
16
Q2F
Y16
Q3
FY
16
Q4F
Y16
US$
/bbl
Source: Company Data, PL Research
However, rising discounts from Middle East oil producers is a positive
Even as weakness in gasoil spreads impact margins, higher discounts from the
Middle East producers have helped refiners. Accordingly, RIL has tied up for Iraqi
Basrah along with Iranian crude slated to maximize margins. Middle East oil
producers are likely to continue to offer discounts as they want to place their ever
rising production supplies.
Exhibit 15: Middle East crude discounts have increased
-4.0
-3.0
-2.0
-1.0
0.0
1.0
2.0
3.0
1QFY15 2QFY15 3QFY15 4QFY15 1QFY16 2QFY16 3QFY16 4QFY16 1QFY17
US$
/bbl
Iraq Basrah light Iranian light Saudi Arabia light Kuwait price
Source: Company Data, PL Research

Reliance Industries
May 12, 2016 12
Petcoke gasification project to give fillip to margins
Even as weakness in diesel cracks put pressure on RIL’s margins, completion of the
~US$6bn petcoke gasification project scheduled for commissioning in H2FY17 is a
positive. The project is designed to convert low-value petroleum coke/coal into high
value Syngas for further use as fuels and for hydrogen and chemicals production. It
will also replace expensive LNG currently being used.
While the project is value-accretive, sharp correction in spot LNG prices (~US$5
currently from ~US$15/bbl last year) has eroded some of the value. We estimate
incremental GRMs of US$1.3/bbl post the project completion. With the project
scheduled for graded completion, we have assumed RIL’s GRMs at
US$10.75/11.3/bbl for FY17/18E.
Exhibit 16: Syngas economics
LNG delivered cost (US$/mmbtu) 8.7*
Syngas production cost (US$/mmbtu) 3.0
Benefit (US$/mmbtu) 5.7
Exchange rate (US$/Rs) 67
Avg refinery gas consumption (mmscmd) 9
EBITDA (Rs m) 43,897
EBITDA (US$/bbl) 1.3
Source: PL Research * FOB of $7 + shipping + 5% duty + inland pipeline charges
Exhibit 17: RIL GRM build-up
5.66.6 7.5 7.2 7.0
1.92
3.3 3.3 3.0
0.3 1.3
0
2
4
6
8
10
12
FY14 FY15 FY16 FY17 FY18
US$
/bbl
Singapore GRM Premium to Singapore Petcoke gassification
Source: Company Data, PL Research
Reliance Industries
May 12, 2016 13
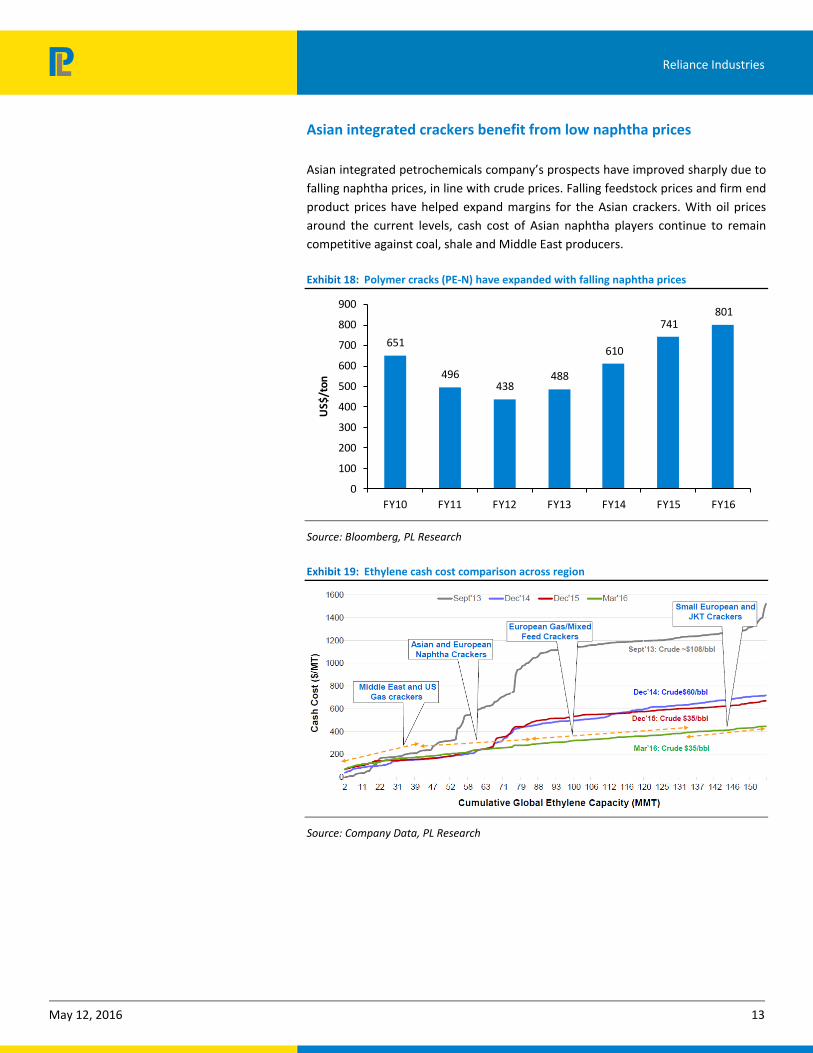
Asian integrated crackers benefit from low naphtha prices
Asian integrated petrochemicals company’s prospects have improved sharply due to
falling naphtha prices, in line with crude prices. Falling feedstock prices and firm end
product prices have helped expand margins for the Asian crackers. With oil prices
around the current levels, cash cost of Asian naphtha players continue to remain
competitive against coal, shale and Middle East producers.
Exhibit 18: Polymer cracks (PE-N) have expanded with falling naphtha prices
651
496438
488
610
741801
0
100
200
300
400
500
600
700
800
900
FY10 FY11 FY12 FY13 FY14 FY15 FY16
US$
/ton
Source: Bloomberg, PL Research
Exhibit 19: Ethylene cash cost comparison across region
Source: Company Data, PL Research
Reliance Industries
May 12, 2016 14
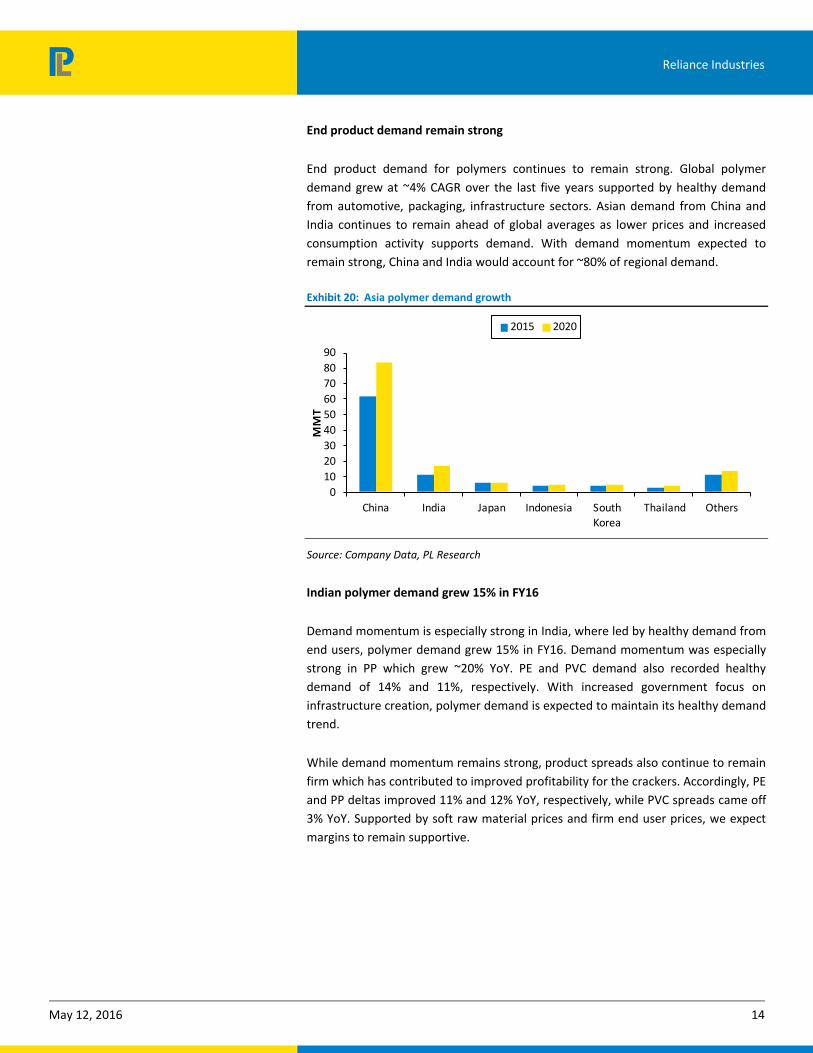
End product demand remain strong
End product demand for polymers continues to remain strong. Global polymer
demand grew at ~4% CAGR over the last five years supported by healthy demand
from automotive, packaging, infrastructure sectors. Asian demand from China and
India continues to remain ahead of global averages as lower prices and increased
consumption activity supports demand. With demand momentum expected to
remain strong, China and India would account for ~80% of regional demand.
Exhibit 20: Asia polymer demand growth
0
10
20
30
40
50
60
70
80
90
China India Japan Indonesia South
Korea
Thailand Others
MM
T2015 2020
Source: Company Data, PL Research
Indian polymer demand grew 15% in FY16
Demand momentum is especially strong in India, where led by healthy demand from
end users, polymer demand grew 15% in FY16. Demand momentum was especially
strong in PP which grew ~20% YoY. PE and PVC demand also recorded healthy
demand of 14% and 11%, respectively. With increased government focus on
infrastructure creation, polymer demand is expected to maintain its healthy demand
trend.
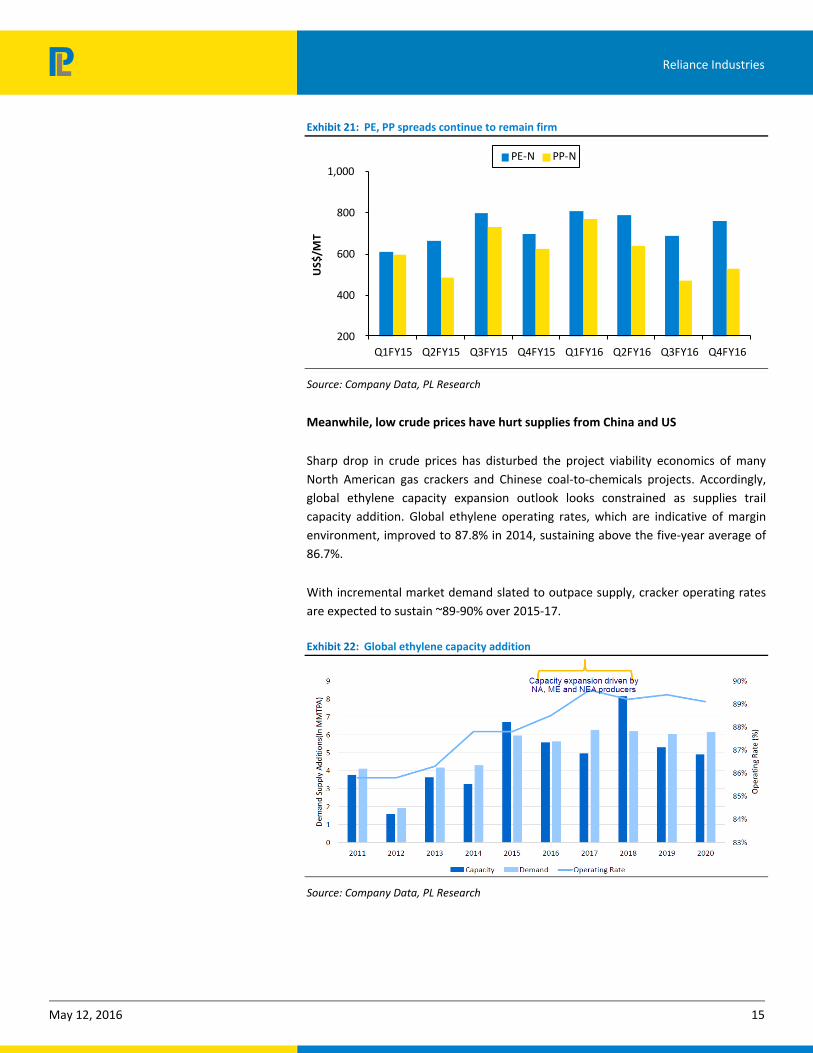
While demand momentum remains strong, product spreads also continue to remain
firm which has contributed to improved profitability for the crackers. Accordingly, PE
and PP deltas improved 11% and 12% YoY, respectively, while PVC spreads came off
3% YoY. Supported by soft raw material prices and firm end user prices, we expect
margins to remain supportive.
Reliance Industries
May 12, 2016 15
Exhibit 21: PE, PP spreads continue to remain firm
200
400
600
800
1,000
Q1FY15 Q2FY15 Q3FY15 Q4FY15 Q1FY16 Q2FY16 Q3FY16 Q4FY16
US$
/MT
PE-N PP-N
Source: Company Data, PL Research
Meanwhile, low crude prices have hurt supplies from China and US
Sharp drop in crude prices has disturbed the project viability economics of many
North American gas crackers and Chinese coal-to-chemicals projects. Accordingly,
global ethylene capacity expansion outlook looks constrained as supplies trail
capacity addition. Global ethylene operating rates, which are indicative of margin
environment, improved to 87.8% in 2014, sustaining above the five-year average of
86.7%.
With incremental market demand slated to outpace supply, cracker operating rates
are expected to sustain ~89-90% over 2015-17.
Exhibit 22: Global ethylene capacity addition
Source: Company Data, PL Research

Reliance Industries
May 12, 2016 16
Polyester margins likely to remain resilient
Polyester margins continue to remain steady supported by inventory restocking.
However, weakening Chinese demand remains a concern, partly compensated by
intermediary margin trend. India’s polyester demand grew at 5% in FY16 led by PET
which was up 7%. Integrated chain margins were also supported by healthy
intermediary spreads; PX up 3%, while MEG margins up 14% YoY.
Exhibit 23: Integrated polyester spreads have remained steady
0.0
10.0
20.0
30.0
40.0
50.0
60.0
70.0
0.0
10.0
20.0
30.0
40.0
50.0
60.0
70.0
1QFY
14
2QFY
14
3QFY
14
4QFY
14
1QFY
15
2QFY
15
3QFY
15
4QFY
15
1QFY
16
2QFY
16
3QFY
16
4QFY
16
Rs/
kg
Rs/
kgPOY integ PSF integ (RHS)
Source: Company Data, PL Research
Reliance Industries
May 12, 2016 17
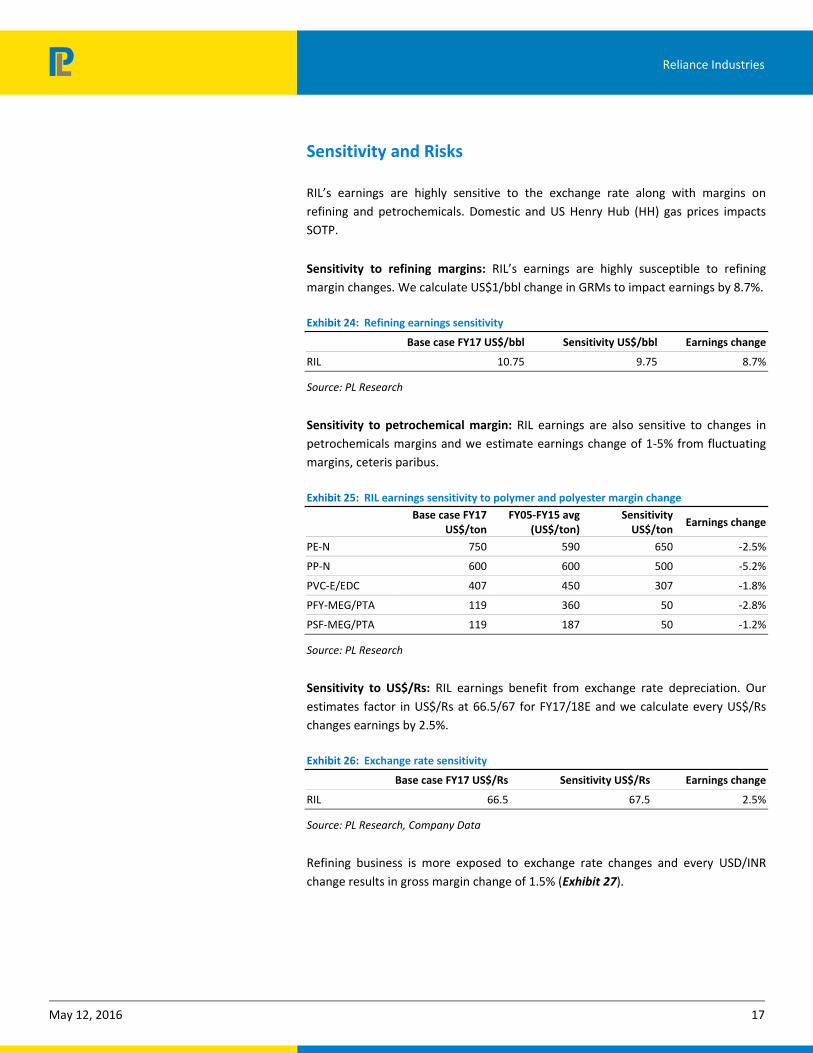
Sensitivity and Risks
RIL’s earnings are highly sensitive to the exchange rate along with margins on
refining and petrochemicals. Domestic and US Henry Hub (HH) gas prices impacts
SOTP.
Sensitivity to refining margins: RIL’s earnings are highly susceptible to refining
margin changes. We calculate US$1/bbl change in GRMs to impact earnings by 8.7%.
Exhibit 24: Refining earnings sensitivity
Base case FY17 US$/bbl Sensitivity US$/bbl Earnings change
RIL 10.75 9.75 8.7%
Source: PL Research
Sensitivity to petrochemical margin: RIL earnings are also sensitive to changes in
petrochemicals margins and we estimate earnings change of 1-5% from fluctuating
margins, ceteris paribus.
Exhibit 25: RIL earnings sensitivity to polymer and polyester margin change
Base case FY17
US$/ton FY05-FY15 avg
(US$/ton) Sensitivity
US$/ton Earnings change
PE-N 750 590 650 -2.5%
PP-N 600 600 500 -5.2%
PVC-E/EDC 407 450 307 -1.8%
PFY-MEG/PTA 119 360 50 -2.8%
PSF-MEG/PTA 119 187 50 -1.2%
Source: PL Research
Sensitivity to US$/Rs: RIL earnings benefit from exchange rate depreciation. Our
estimates factor in US$/Rs at 66.5/67 for FY17/18E and we calculate every US$/Rs
changes earnings by 2.5%.
Exhibit 26: Exchange rate sensitivity
Base case FY17 US$/Rs Sensitivity US$/Rs Earnings change
RIL 66.5 67.5 2.5%
Source: PL Research, Company Data
Refining business is more exposed to exchange rate changes and every USD/INR
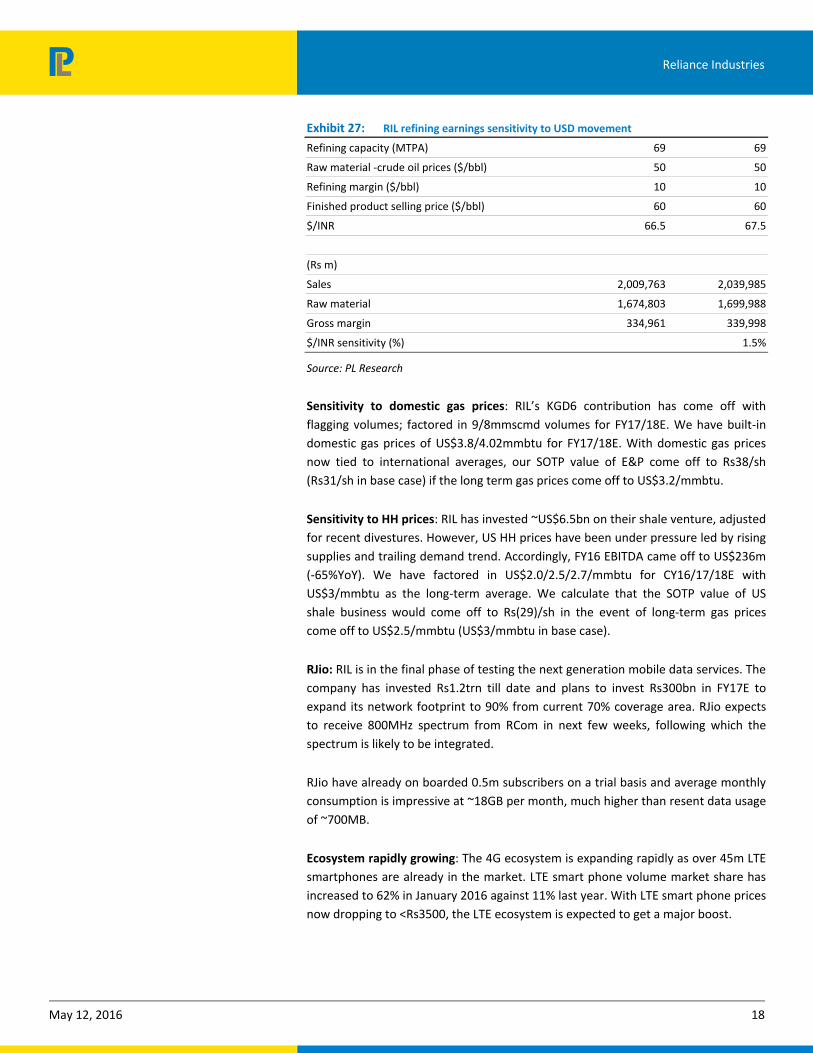
change results in gross margin change of 1.5% (Exhibit 27).
Reliance Industries
May 12, 2016 18
Exhibit 27: RIL refining earnings sensitivity to USD movement
Refining capacity (MTPA) 69 69
Raw material -crude oil prices ($/bbl) 50 50
Refining margin ($/bbl) 10 10
Finished product selling price ($/bbl) 60 60
$/INR 66.5 67.5
(Rs m)
Sales 2,009,763 2,039,985
Raw material 1,674,803 1,699,988
Gross margin 334,961 339,998
$/INR sensitivity (%) 1.5%
Source: PL Research
Sensitivity to domestic gas prices: RIL’s KGD6 contribution has come off with
flagging volumes; factored in 9/8mmscmd volumes for FY17/18E. We have built-in
domestic gas prices of US$3.8/4.02mmbtu for FY17/18E. With domestic gas prices
now tied to international averages, our SOTP value of E&P come off to Rs38/sh
(Rs31/sh in base case) if the long term gas prices come off to US$3.2/mmbtu.
Sensitivity to HH prices: RIL has invested ~US$6.5bn on their shale venture, adjusted
for recent divestures. However, US HH prices have been under pressure led by rising
supplies and trailing demand trend. Accordingly, FY16 EBITDA came off to US$236m
(-65%YoY). We have factored in US$2.0/2.5/2.7/mmbtu for CY16/17/18E with
US$3/mmbtu as the long-term average. We calculate that the SOTP value of US
shale business would come off to Rs(29)/sh in the event of long-term gas prices
come off to US$2.5/mmbtu (US$3/mmbtu in base case).
RJio: RIL is in the final phase of testing the next generation mobile data services. The
company has invested Rs1.2trn till date and plans to invest Rs300bn in FY17E to
expand its network footprint to 90% from current 70% coverage area. RJio expects
to receive 800MHz spectrum from RCom in next few weeks, following which the
spectrum is likely to be integrated.
RJio have already on boarded 0.5m subscribers on a trial basis and average monthly
consumption is impressive at ~18GB per month, much higher than resent data usage
of ~700MB.
Ecosystem rapidly growing: The 4G ecosystem is expanding rapidly as over 45m LTE
smartphones are already in the market. LTE smart phone volume market share has
increased to 62% in January 2016 against 11% last year. With LTE smart phone prices
now dropping to <Rs3500, the LTE ecosystem is expected to get a major boost.
Reliance Industries
May 12, 2016 19
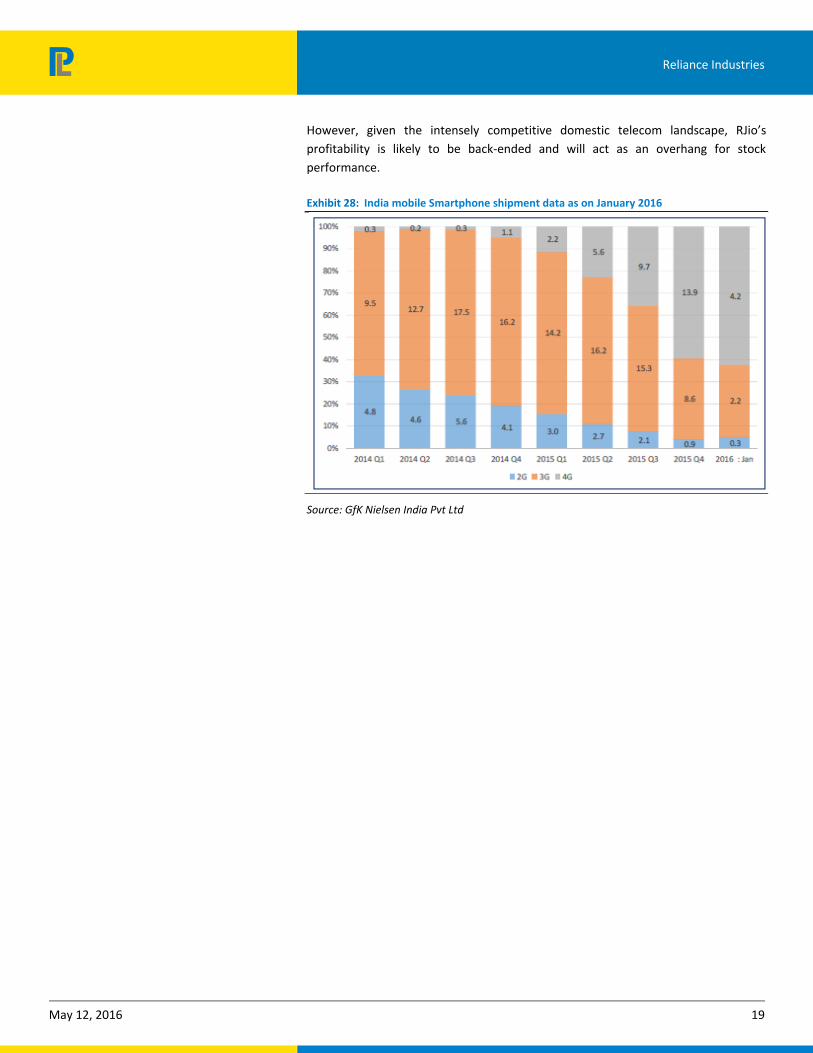
However, given the intensely competitive domestic telecom landscape, RJio’s
profitability is likely to be back-ended and will act as an overhang for stock
performance.
Exhibit 28: India mobile Smartphone shipment data as on January 2016
Source: GfK Nielsen India Pvt Ltd
Reliance Industries
May 12, 2016 20
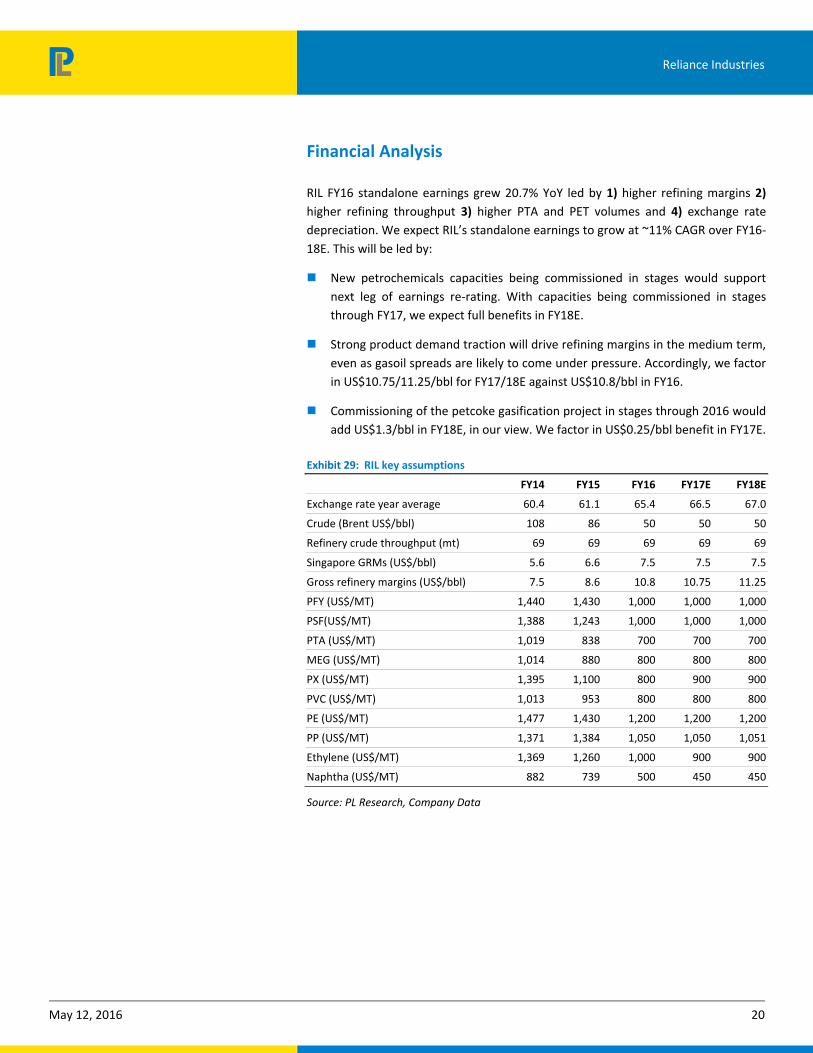
Financial Analysis
RIL FY16 standalone earnings grew 20.7% YoY led by 1) higher refining margins 2)
higher refining throughput 3) higher PTA and PET volumes and 4) exchange rate
depreciation. We expect RIL’s standalone earnings to grow at ~11% CAGR over FY16-
18E. This will be led by:
New petrochemicals capacities being commissioned in stages would support
next leg of earnings re-rating. With capacities being commissioned in stages
through FY17, we expect full benefits in FY18E.
Strong product demand traction will drive refining margins in the medium term,
even as gasoil spreads are likely to come under pressure. Accordingly, we factor
in US$10.75/11.25/bbl for FY17/18E against US$10.8/bbl in FY16.
Commissioning of the petcoke gasification project in stages through 2016 would
add US$1.3/bbl in FY18E, in our view. We factor in US$0.25/bbl benefit in FY17E.
Exhibit 29: RIL key assumptions
FY14 FY15 FY16 FY17E FY18E
Exchange rate year average 60.4 61.1 65.4 66.5 67.0
Crude (Brent US$/bbl) 108 86 50 50 50
Refinery crude throughput (mt) 69 69 69 69 69
Singapore GRMs (US$/bbl) 5.6 6.6 7.5 7.5 7.5
Gross refinery margins (US$/bbl) 7.5 8.6 10.8 10.75 11.25
PFY (US$/MT) 1,440 1,430 1,000 1,000 1,000
PSF(US$/MT) 1,388 1,243 1,000 1,000 1,000
PTA (US$/MT) 1,019 838 700 700 700
MEG (US$/MT) 1,014 880 800 800 800
PX (US$/MT) 1,395 1,100 800 900 900
PVC (US$/MT) 1,013 953 800 800 800
PE (US$/MT) 1,477 1,430 1,200 1,200 1,200
PP (US$/MT) 1,371 1,384 1,050 1,050 1,051
Ethylene (US$/MT) 1,369 1,260 1,000 900 900
Naphtha (US$/MT) 882 739 500 450 450
Source: PL Research, Company Data

Reliance Industries
May 12, 2016 21
Valuation and View
We have valued RIL based on SOTP, given the well-diversified nature of the
company. Salient highlights of the valuation matrix are:
We have valued core refining and petrochemicals at 7x FY17E EBITDA.
We have added incremental value of full blown EBITDA from new projects,
reflected in FY18E and discounted the same at 12%.
We have taken net debt based on FY17E.
We have valued domestic Exploration & Production (E&P) on DCF and assumed
long-term gas price of US$4.2/mmbtu. We have also added 10% premium to the
blocks yet to be monetized. We have assumed 9/8mmscmd gas volumes at
KGD6 volumes against ~11 mmscmd for FY16.
RJio is being valued at 8x FY18 EV/E and discounted back to FY17.
Reliance Retail is being valued based on peer valuation comparison.
Exhibit 30: RIL SOTP
(Rs bn) (Rs / share) Comments
EV of Petrochem & Refining 2,195 991 @ EV/EBITDA of 7x FY17E
Less: Net Debt 540 184 Estimated as on FY17E, net of cash and liquid investments
Add: Key investments
- E&P Assets 103 35 @10% premium to NAV of known reserves (D6, NEC, CBM)
- Organised retail & other key investments 80 27 On book value of investment in retail and Infra subs
- Infotel (BWA) -130 -44 Based on RJio's 8x FY18E EV/E discounted back
- Shale Gas NPV (Marcellus + Eagle Ford) -75 -25 NPV based on HH of US$2-2.5/mmbtu
- New projects 687 234 EV of new petchem projects @EV/EBITDA of 7x
Total value of investments & other assets 665 226
Equity value (Rs m) 3,039 1,034
Source: PL Research

Reliance Industries
May 12, 2016 22
Income Statement (Rs m)
Y/e March 2015 2016 2017E 2018E
Net Revenue 3,287,720 2,331,580 2,938,657 3,115,302
Raw Material Expenses 2,843,930 1,826,939 2,355,025 2,405,927
Gross Profit 443,790 504,641 583,632 709,375
Employee Cost — — — —
Other Expenses 127,080 103,251 155,856 171,667
EBITDA 316,710 401,390 427,776 537,708
Depr. & Amortization 84,880 95,660 107,468 129,131
Net Interest 23,670 24,540 36,902 38,239
Other Income 86,520 75,820 71,111 73,368
Profit before Tax 294,680 357,010 354,516 443,705
Total Tax 67,490 82,840 85,263 108,286
Profit after Tax 227,190 274,170 269,254 335,419
Ex-Od items / Min. Int. — — — —
Adj. PAT 227,190 274,170 269,254 335,419
Avg. Shares O/S (m) 3,236.0 3,240.0 3,240.0 3,240.0
EPS (Rs.) 70.2 84.6 83.1 103.5
Cash Flow Abstract (Rs m)
Y/e March 2015 2016 2017E 2018E
C/F from Operations 493,701 370,709 531,974 511,094
C/F from Investing (475,340) (575,390) (219,120) (26,700)
C/F from Financing (325,729) 210,616 (173,045) (419,907)
Inc. / Dec. in Cash (307,368) 5,935 139,809 64,487
Opening Cash 366,240 115,710 68,920 75,812
Closing Cash 115,710 68,920 75,812 83,393
FCFF 322,950 (695,579) 204,468 322,174
FCFE 408,239 (677,462) 252,942 354,779
Key Financial Metrics
Y/e March 2015 2016 2017E 2018E
Growth
Revenue (%) (15.7) (29.1) 26.0 6.0
EBITDA (%) 2.9 26.7 6.6 25.7
PAT (%) 3.3 20.7 (1.8) 24.6
EPS (%) 3.2 20.5 (1.8) 24.6
Profitability
EBITDA Margin (%) 9.6 17.2 14.6 17.3
PAT Margin (%) 6.9 11.8 9.2 10.8
RoCE (%) 8.0 8.7 8.3 9.8
RoE (%) 11.0 12.0 11.0 13.2
Balance Sheet
Net Debt : Equity 0.4 0.4 0.4 0.4
Net Wrkng Cap. (days) (5) (4) (20) (21)
Valuation
PER (x) 13.9 11.5 11.7 9.4
P / B (x) 1.5 1.3 1.3 1.2
EV / EBITDA (x) 12.7 10.2 9.7 7.7
EV / Sales (x) 1.2 1.8 1.4 1.3
Earnings Quality
Eff. Tax Rate 22.9 23.2 24.1 24.4
Other Inc / PBT 29.4 21.2 20.1 16.5
Eff. Depr. Rate (%) 3.6 2.8 2.9 3.4
FCFE / PAT 179.7 (247.1) 93.9 105.8
Source: Company Data, PL Research.
Balance Sheet Abstract (Rs m)
Y/e March 2015 2016 2017E 2018E
Shareholder's Funds 2,161,760 2,401,760 2,473,550 2,602,368
Total Debt 984,969 1,003,086 1,051,560 1,084,165
Other Liabilities 180,551 200,595 209,396 221,675
Total Liabilities 3,327,280 3,605,441 3,734,506 3,908,209
Net Fixed Assets 1,903,160 2,382,890 2,494,542 2,392,111
Goodwill — — — —
Investments 1,485,950 1,291,153 1,416,070 1,688,948
Net Current Assets (61,830) (68,602) (176,106) (172,849)
Cash & Equivalents 115,710 68,920 75,812 83,393
Other Current Assets 473,030 397,101 378,907 385,851
Current Liabilities 650,570 534,623 630,825 642,093
Other Assets — — — —
Total Assets 3,327,280 3,605,441 3,734,506 3,908,210
Quarterly Financials (Rs m)
Y/e March Q1FY16 Q2FY16 Q3FY16 Q4FY16
Net Revenue 658,170 608,170 565,670 499,570
EBITDA 93,070 98,330 102,720 107,270
% of revenue 14.1 16.2 18.2 21.5
Depr. & Amortization 22,650 23,720 24,050 25,240
Net Interest 5,970 6,940 6,090 5,540
Other Income 18,180 16,170 22,890 18,580
Profit before Tax 82,630 83,840 95,470 95,070
Total Tax 19,450 18,230 23,290 21,870
Profit after Tax 63,180 65,610 72,180 73,200
Adj. PAT 63,180 65,610 72,180 73,200
Key Operating Metrics
Y/e March 2015 2016 2017E 2018E
Brent (US$/bbl) 85.6 50.0 50.0 50.0
GRM(US$/bbl) 8.6 10.9 11.0 11.6
Refining thruput (MTPA) 67.9 69.6 69.0 69.0
US$/Rs 61.1 65.4 66.5 67.0
Source: Company Data, PL Research.

Reliance Industries
May 12, 2016 23
THIS PAGE IS INTENTIONALLY LEFT BLANK
Reliance Industries
May 12, 2016 24
Prabhudas Lilladher Pvt. Ltd.
3rd Floor, Sadhana House, 570, P. B. Marg, Worli, Mumbai-400 018, India
Tel: (91 22) 6632 2222 Fax: (91 22) 6632 2209
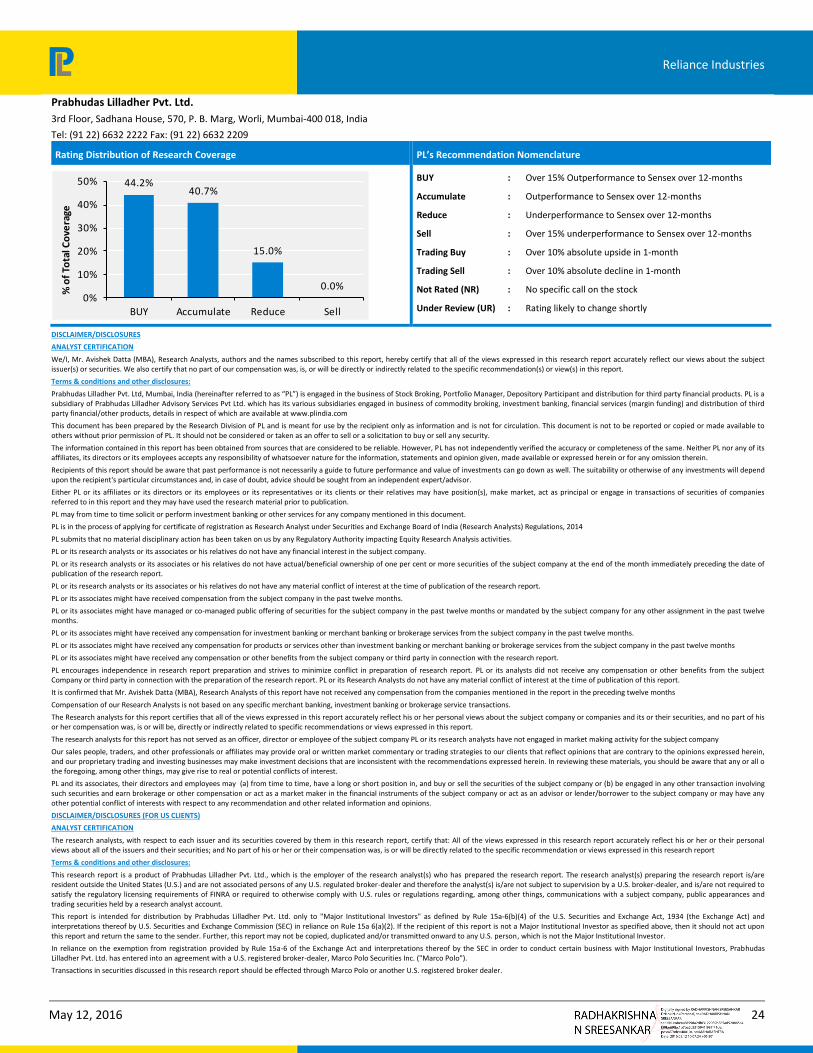
Rating Distribution of Research Coverage PL’s Recommendation Nomenclature
44.2%40.7%
15.0%
0.0%0%
10%
20%
30%
40%
50%
BUY Accumulate Reduce Sell
% o
f To
tal C
ove
rage
BUY : Over 15% Outperformance to Sensex over 12-months
Accumulate : Outperformance to Sensex over 12-months
Reduce : Underperformance to Sensex over 12-months
Sell : Over 15% underperformance to Sensex over 12-months
Trading Buy : Over 10% absolute upside in 1-month
Trading Sell : Over 10% absolute decline in 1-month
Not Rated (NR) : No specific call on the stock
Under Review (UR) : Rating likely to change shortly
DISCLAIMER/DISCLOSURES
ANALYST CERTIFICATION
We/I, Mr. Avishek Datta (MBA), Research Analysts, authors and the names subscribed to this report, hereby certify that all of the views expressed in this research report accurately reflect our views about the subject issuer(s) or securities. We also certify that no part of our compensation was, is, or will be directly or indirectly related to the specific recommendation(s) or view(s) in this report.
Terms & conditions and other disclosures:
Prabhudas Lilladher Pvt. Ltd, Mumbai, India (hereinafter referred to as “PL”) is engaged in the business of Stock Broking, Portfolio Manager, Depository Participant and distribution for third party financial products. PL is a subsidiary of Prabhudas Lilladher Advisory Services Pvt Ltd. which has its various subsidiaries engaged in business of commodity broking, investment banking, financial services (margin funding) and distribution of third party financial/other products, details in respect of which are available at www.plindia.com
This document has been prepared by the Research Division of PL and is meant for use by the recipient only as information and is not for circulation. This document is not to be reported or copied or made available to others without prior permission of PL. It should not be considered or taken as an offer to sell or a solicitation to buy or sell any security.
The information contained in this report has been obtained from sources that are considered to be reliable. However, PL has not independently verified the accuracy or completeness of the same. Neither PL nor any of its affiliates, its directors or its employees accepts any responsibility of whatsoever nature for the information, statements and opinion given, made available or expressed herein or for any omission therein.
Recipients of this report should be aware that past performance is not necessarily a guide to future performance and value of investments can go down as well. The suitability or otherwise of any investments will depend upon the recipient's particular circumstances and, in case of doubt, advice should be sought from an independent expert/advisor.
Either PL or its affiliates or its directors or its employees or its representatives or its clients or their relatives may have position(s), make market, act as principal or engage in transactions of securities of companies referred to in this report and they may have used the research material prior to publication.
PL may from time to time solicit or perform investment banking or other services for any company mentioned in this document.
PL is in the process of applying for certificate of registration as Research Analyst under Securities and Exchange Board of India (Research Analysts) Regulations, 2014
PL submits that no material disciplinary action has been taken on us by any Regulatory Authority impacting Equity Research Analysis activities.
PL or its research analysts or its associates or his relatives do not have any financial interest in the subject company.
PL or its research analysts or its associates or his relatives do not have actual/beneficial ownership of one per cent or more securities of the subject company at the end of the month immediately preceding the date of publication of the research report.
PL or its research analysts or its associates or his relatives do not have any material conflict of interest at the time of publication of the research report.
PL or its associates might have received compensation from the subject company in the past twelve months.
PL or its associates might have managed or co-managed public offering of securities for the subject company in the past twelve months or mandated by the subject company for any other assignment in the past twelve months.
PL or its associates might have received any compensation for investment banking or merchant banking or brokerage services from the subject company in the past twelve months.
PL or its associates might have received any compensation for products or services other than investment banking or merchant banking or brokerage services from the subject company in the past twelve months
PL or its associates might have received any compensation or other benefits from the subject company or third party in connection with the research report.
PL encourages independence in research report preparation and strives to minimize conflict in preparation of research report. PL or its analysts did not receive any compensation or other benefits from the subject Company or third party in connection with the preparation of the research report. PL or its Research Analysts do not have any material conflict of interest at the time of publication of this report.
It is confirmed that Mr. Avishek Datta (MBA), Research Analysts of this report have not received any compensation from the companies mentioned in the report in the preceding twelve months
Compensation of our Research Analysts is not based on any specific merchant banking, investment banking or brokerage service transactions.
The Research analysts for this report certifies that all of the views expressed in this report accurately reflect his or her personal views about the subject company or companies and its or their securities, and no part of his or her compensation was, is or will be, directly or indirectly related to specific recommendations or views expressed in this report.
The research analysts for this report has not served as an officer, director or employee of the subject company PL or its research analysts have not engaged in market making activity for the subject company
Our sales people, traders, and other professionals or affiliates may provide oral or written market commentary or trading strategies to our clients that reflect opinions that are contrary to the opinions expressed herein, and our proprietary trading and investing businesses may make investment decisions that are inconsistent with the recommendations expressed herein. In reviewing these materials, you should be aware that any or all o the foregoing, among other things, may give rise to real or potential conflicts of interest.
PL and its associates, their directors and employees may (a) from time to time, have a long or short position in, and buy or sell the securities of the subject company or (b) be engaged in any other transaction involving such securities and earn brokerage or other compensation or act as a market maker in the financial instruments of the subject company or act as an advisor or lender/borrower to the subject company or may have any other potential conflict of interests with respect to any recommendation and other related information and opinions.
DISCLAIMER/DISCLOSURES (FOR US CLIENTS)
ANALYST CERTIFICATION
The research analysts, with respect to each issuer and its securities covered by them in this research report, certify that: All of the views expressed in this research report accurately reflect his or her or their personal views about all of the issuers and their securities; and No part of his or her or their compensation was, is or will be directly related to the specific recommendation or views expressed in this research report
Terms & conditions and other disclosures:
This research report is a product of Prabhudas Lilladher Pvt. Ltd., which is the employer of the research analyst(s) who has prepared the research report. The research analyst(s) preparing the research report is/are resident outside the United States (U.S.) and are not associated persons of any U.S. regulated broker-dealer and therefore the analyst(s) is/are not subject to supervision by a U.S. broker-dealer, and is/are not required to satisfy the regulatory licensing requirements of FINRA or required to otherwise comply with U.S. rules or regulations regarding, among other things, communications with a subject company, public appearances and trading securities held by a research analyst account.
This report is intended for distribution by Prabhudas Lilladher Pvt. Ltd. only to "Major Institutional Investors" as defined by Rule 15a-6(b)(4) of the U.S. Securities and Exchange Act, 1934 (the Exchange Act) and interpretations thereof by U.S. Securities and Exchange Commission (SEC) in reliance on Rule 15a 6(a)(2). If the recipient of this report is not a Major Institutional Investor as specified above, then it should not act upon this report and return the same to the sender. Further, this report may not be copied, duplicated and/or transmitted onward to any U.S. person, which is not the Major Institutional Investor.
In reliance on the exemption from registration provided by Rule 15a-6 of the Exchange Act and interpretations thereof by the SEC in order to conduct certain business with Major Institutional Investors, Prabhudas Lilladher Pvt. Ltd. has entered into an agreement with a U.S. registered broker-dealer, Marco Polo Securities Inc. ("Marco Polo").
Transactions in securities discussed in this research report should be effected through Marco Polo or another U.S. registered broker dealer.


