47
Reliance Mutual Fund – R*Shares ETF offerings November 2015
Reliance Mutual Fund –
R*Shares ETF offerings
November 2015

Confidential Slide
What is an Exchange Traded Fund (ETF)?
An ETF is a MF Scheme or security that endeavor to replicate the
value of an underlying i.e index or a commodity
2
Confidential Slide
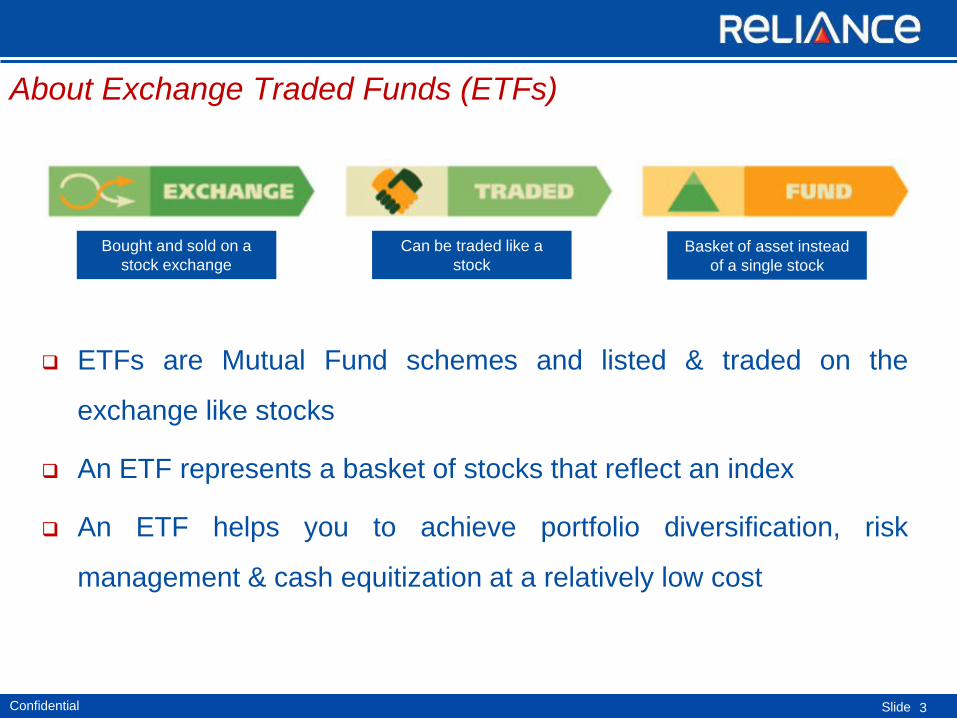
ETFs are Mutual Fund schemes and listed & traded on the
exchange like stocks
An ETF represents a basket of stocks that reflect an index
An ETF helps you to achieve portfolio diversification, risk
management & cash equitization at a relatively low cost
About Exchange Traded Funds (ETFs)
Basket of asset instead
of a single stock
Can be traded like a
stock
Bought and sold on a
stock exchange
3
Confidential Slide
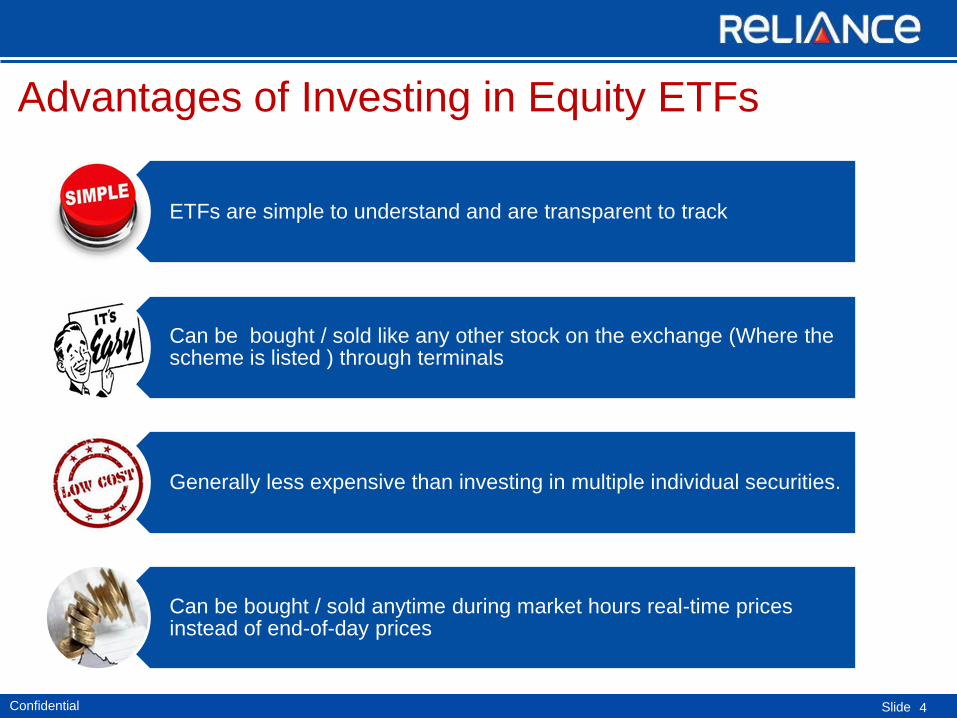
Advantages of Investing in Equity ETFs
ETFs are simple to understand and are transparent to track
Can be bought / sold like any other stock on the exchange (Where the scheme is listed ) through terminals
Generally less expensive than investing in multiple individual securities.
Can be bought / sold anytime during market hours real-time prices instead of end-of-day prices
4

Confidential Slide
Applications of ETFs in Various Strategies
#Subject to the market condition and availability of spread and liquidity.
• ETFs can be used for a given percentage of each asset class to provide a liquidity buffer across the asset allocation.#
Liquidity Management
• ETFs allow investors to gain exposure to an asset class that may be underrepresented in the asset allocation of investor’s portfolio.
Portfolio Completion
• ETFs assist in remaining fully invested while maintaining liquidity, thus minimizing the cash drag effect on the portfolio.
Cash Equitization
• Since ETFs are passive funds which may help to maintain market exposure while there are changes in sector/stock allocations in a portfolio, it avoids the risk of missing any market movement.
Portfolio Transitions
5
Confidential Slide
Exchange Traded Funds (ETFs)
Global and Indian Scenario
6

Confidential Slide 7
Globally ETFs have witnessed strong growth across
markets
Source: ETFGI, Nov 2015 Note: Past performance may or may not be sustained in the future.
Confidential Slide 8
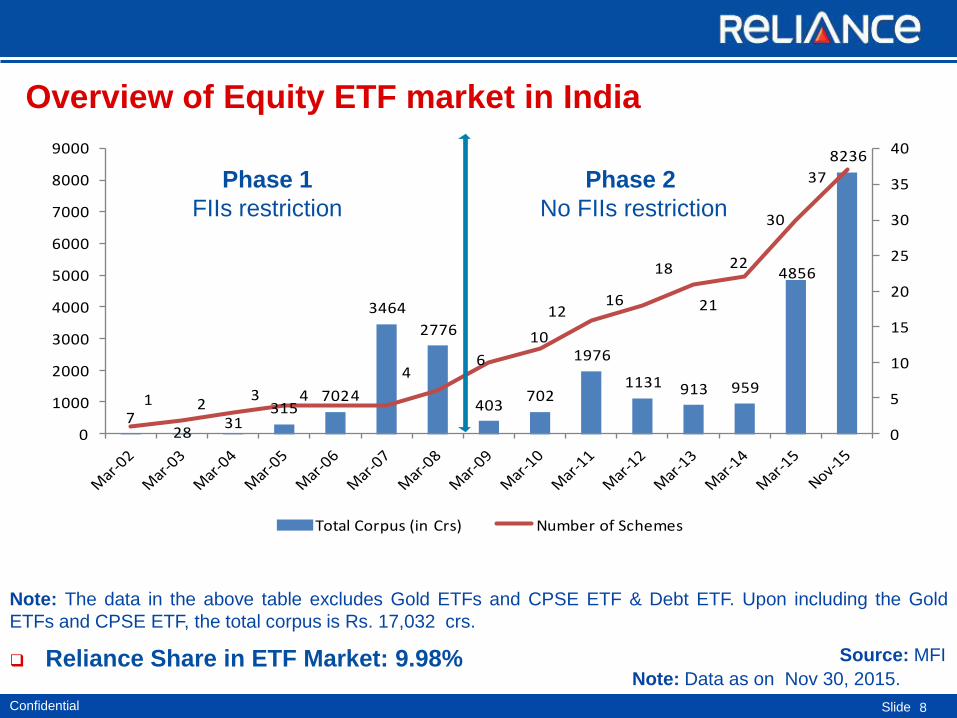
Overview of Equity ETF market in India
Source: MFI
Note: The data in the above table excludes Gold ETFs and CPSE ETF & Debt ETF. Upon including the Gold
ETFs and CPSE ETF, the total corpus is Rs. 17,032 crs.
Reliance Share in ETF Market: 9.98% Note: Data as on Nov 30, 2015.
728
31315
702
3464
2776
403702
1976
1131 913 959
4856
8236
1 23 4 4
46
10
1216
18
21
22
30
37
0
5
10
15
20
25
30
35
40
0
1000
2000
3000
4000
5000
6000
7000
8000
9000
Total Corpus (in Crs) Number of Schemes
Phase 1
FIIs restriction
Phase 2
No FIIs restriction
Confidential Slide 9
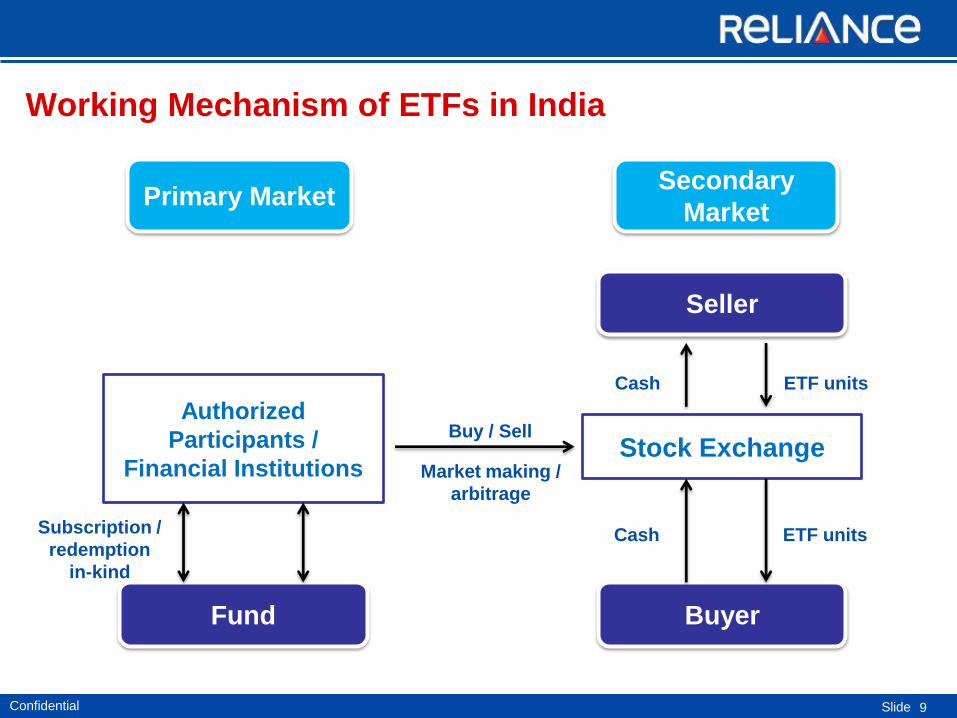
Working Mechanism of ETFs in India
Primary Market Secondary
Market
Authorized
Participants /
Financial Institutions Stock Exchange
Fund Buyer
Seller
Buy / Sell
Market making /
arbitrage
Cash ETF units
Cash ETF units Subscription /
redemption
in-kind

Confidential Slide 10
Equity
• Our equity offerings cater to all type of investors’ risk profile
• Investment style approach varies from conservative, moderate, aggressive to very aggressive
• Our products include :
• Market - Cap Based – Large Cap, Mid & Small Cap, Multi Cap
• Sector Focus – Banking, Power, Pharma, Media & Entertainment
• Theme Based – Infrastructure, Natural Resources (partly investing in overseas securities)
• Index Linked & Exchange Traded Funds
• Our portfolio comprises of well diversified , high quality fixed income papers which aims to deliver relatively stable returns
• Our products are present across the yield curve:
• Liquid – Nil mark to market component & low volatility
• Ultra–Short Term & Short Term - Short to medium term horizon with medium risk appetite
• Long Term - Credit specific & gilt funds
• Hybrid - Stability of Debt + Power of Equity
Fixed Income
Gold
• Gold portfolio consists of Exchange Traded Fund & Fund of Fund which enable to reap the returns of gold in non-physical
form in a relatively cost effective & convenient way
Our Product Portfol io

Confidential Slide
To be a significant player in the ETF segment
RCAM is committed towards increasing its number of products, AAUM and market share over the
next few years.
To offer a bouquet of ETFs including Generic, Thematic, Sector Specific
and Active ETFs.
RCAM is committed towards bringing out ETFs across various categories.
To focus on product innovation
RCAM is focused on innovating its product offerings and is exploring opportunities like Sector
ETFs, Commodity ETFs, Derivative ETFs, Style ETFs, Bond/Liquid ETFs, Inverse ETFs,
Leveraged ETFs, Synthetic ETFs.
To create a market through substantial education & awareness
As the Indian ETF market is at a nascent stage, RCAM is committed towards the growth of the
market by means of education and awareness.
11
RCAM Objective
Confidential Slide
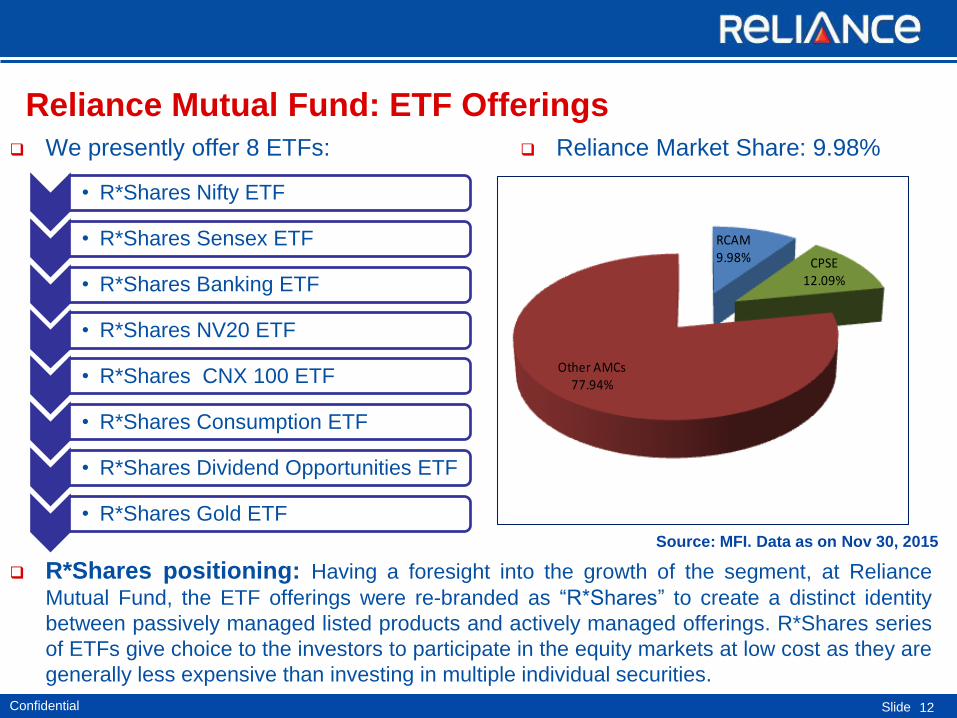
R*Shares positioning: Having a foresight into the growth of the segment, at Reliance
Mutual Fund, the ETF offerings were re-branded as “R*Shares” to create a distinct identity
between passively managed listed products and actively managed offerings. R*Shares series
of ETFs give choice to the investors to participate in the equity markets at low cost as they are
generally less expensive than investing in multiple individual securities.
12
Reliance Mutual Fund: ETF Offerings
We presently offer 8 ETFs: Reliance Market Share: 9.98%
Source: MFI. Data as on Nov 30, 2015
• R*Shares Nifty ETF
• R*Shares Sensex ETF
• R*Shares Banking ETF
• R*Shares NV20 ETF
• R*Shares CNX 100 ETF
• R*Shares Consumption ETF
• R*Shares Dividend Opportunities ETF
• R*Shares Gold ETF
RCAM9.98% CPSE
12.09%
Other AMCs77.94%

Confidential Slide
R*Shares Nifty ETF
13
(An Open Ended Index Exchange Traded Fund)
[Rajiv Gandhi Equity Savings Scheme (RGESS) qualified scheme]
Confidential Slide 14
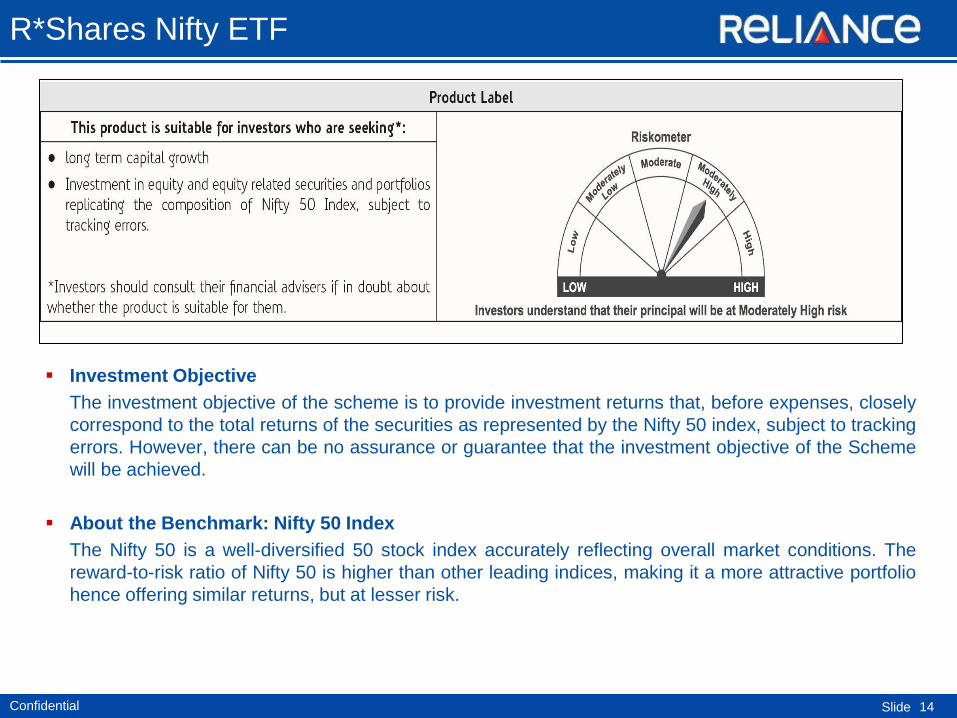
Investment Objective
The investment objective of the scheme is to provide investment returns that, before expenses, closely
correspond to the total returns of the securities as represented by the Nifty 50 index, subject to tracking
errors. However, there can be no assurance or guarantee that the investment objective of the Scheme
will be achieved.
About the Benchmark: Nifty 50 Index
The Nifty 50 is a well-diversified 50 stock index accurately reflecting overall market conditions. The
reward-to-risk ratio of Nifty 50 is higher than other leading indices, making it a more attractive portfolio
hence offering similar returns, but at lesser risk.
R*Shares Nifty ETF

Confidential Slide 15
R*Shares Nifty ETF
Top 10 Stocks Top 10 Sectors
Note: The sectors mentioned in the table is not a recommendation to buy/sell in the said sectors. The scheme currently holding investments in the said
sectors and may or may not have future position in the same. The stocks mentioned forms a part of the portfolio of the scheme and may or may not form a
part of the portfolio in future. Please read Scheme Information Document carefully for more details and risk factors. Source: RMF Website
Stock Allocation (%)
INFOSYS LTD 7.63
HDFC BANK LTD 7.49
ITC LTD 6.76
HDFC LTD 6.71
ICICI BANK LTD 5.61
RELIANCE INDUSTRIES LTD 5.60
TATA CONSULTANCY SERVICES LTD 4.28
TATA MOTORS LTD 2.88
SUN PHARMACEUTICALS INDUSTRIES LTD 2.79
Sector Allocation (%)
Banks 24.53
Software 16.05
Consumer Non Durables 10.11
Auto 9.58
Pharmaceuticals 6.84
Finance 6.71
Petroleum Products 6.42
Cement 2.83
Power 2.43
Confidential Slide 16
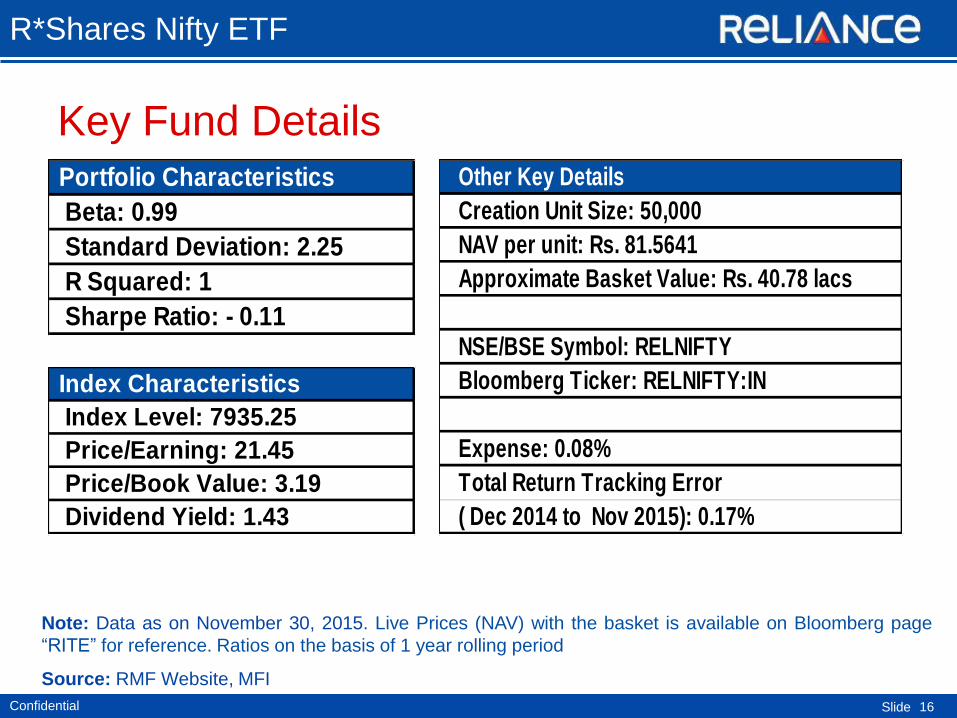
Key Fund Details
R*Shares Nifty ETF
Source: RMF Website, MFI
Note: Data as on November 30, 2015. Live Prices (NAV) with the basket is available on Bloomberg page
“RITE” for reference. Ratios on the basis of 1 year rolling period
Portfolio Characteristics
Beta: 0.99
Standard Deviation: 2.25
R Squared: 1
Sharpe Ratio: - 0.11
Index Characteristics
Index Level: 7935.25
Price/Earning: 21.45
Price/Book Value: 3.19
Dividend Yield: 1.43
Other Key Details
Creation Unit Size: 50,000
NAV per unit: Rs. 81.5641
Approximate Basket Value: Rs. 40.78 lacs
NSE/BSE Symbol: RELNIFTY
Bloomberg Ticker: RELNIFTY:IN
Expense: 0.08%
Total Return Tracking Error
( Dec 2014 to Nov 2015): 0.17%

Confidential Slide
R*Shares Sensex ETF
17
(An Open Ended Index Exchange Traded Fund)
[Rajiv Gandhi Equity Savings Scheme (RGESS) qualified scheme]

Confidential Slide 18
Investment Objective
The investment objective of the scheme is to provide investment returns closely corresponding to the
total returns of the securities as represented by the S&P BSE Sensex Index before expenses, subject
to tracking errors. However, there can be no assurance or guarantee that the investment objective of
the Scheme will be achieved
About the Benchmark: S&P BSE Sensex Index
S&P BSE Sensex, first compiled in 1986, was calculated on a “Market Capitalization-Weighted”
methodology of 30 component stocks representing large, well-established and financially sound
companies across key sectors. S&P BSE Sensex today is widely reported in both domestic and
international markets.
R*Shares Sensex ETF

Confidential Slide 19
R*Shares Sensex ETF
Top 10 Stocks Top 10 Sectors
Note: The sectors mentioned in the table is not a recommendation to buy/sell in the said sectors. The scheme currently holding investments in the said
sectors and may or may not have future position in the same. The stocks mentioned forms a part of the portfolio of the scheme and may or may not form a
part of the portfolio in future. Please read Scheme Information Document carefully for more details and risk factors. Source: RMF Website
Stock Allocation (%)
INFOSYS LTD 9.38
HDFC BANK LTD 9.09
ITC LTD 8.31
HDFC LTD 8.28
RELIANCE INDUSTRIES LTD 6.90
ICICI BANK LTD 6.87
TATA CONSULTANCY SERVICES LTD 5.20
TATA MOTORS LTD 3.48
SUN PHARMACEUTICALS INDUSTRIES LTD 3.41
Stock Allocation (%)
Banks 22.73
Software 16.17
Auto 11.69
Consumer Non Durables 10.81
Pharmaceuticals 8.38
Finance 8.28
Petroleum Products 6.90
Telecom - Services 2.02
Oil 1.82

Confidential Slide 20
Key Fund Details
R*Shares Sensex ETF
Source: RMF Website , MFI
Note: Data as on November 30, 2015. Live Prices (NAV) with the basket is available on Bloomberg page
“RITE” for reference . Ratios on the basis of 1 year rolling period
Portfolio Characteristics
Beta: 0.99
Standard Deviation: 2.26
R Squared: 0.99
Sharpe Ratio: - 0.13
Index Characteristics
Index Level: 26145.67
Price/Earning: 20.55
Price/Book Value: 2.74
Dividend Yield: 1.42
Other Key Details
Creation Unit Size: 10,000
NAV per unit: Rs. 265.7466
Approximate Basket Value: Rs. 26.57 lacs
NSE/BSE Symbol: RELSENSEX
Bloomberg Ticker: RSENSEX:IN
Expense: 0.08%
Total Return Tracking Error
( Dec 2014 to Nov 2015): 0.13%
Confidential Slide
R*Shares Banking ETF
21
(An open ended, exchange listed, index linked scheme)
Confidential Slide 22
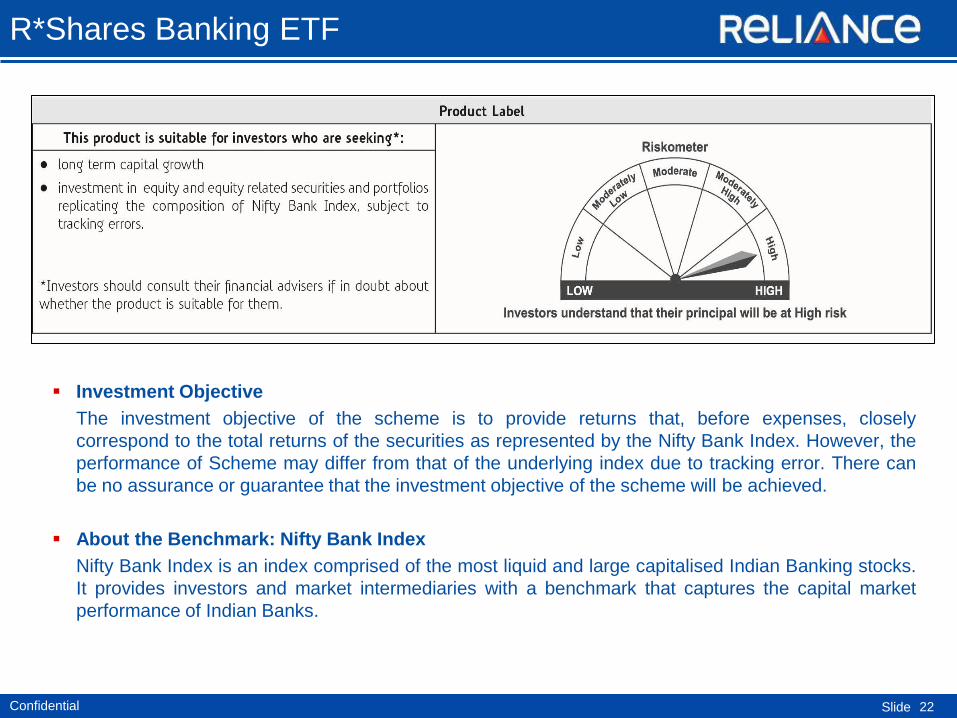
Investment Objective
The investment objective of the scheme is to provide returns that, before expenses, closely
correspond to the total returns of the securities as represented by the Nifty Bank Index. However, the
performance of Scheme may differ from that of the underlying index due to tracking error. There can
be no assurance or guarantee that the investment objective of the scheme will be achieved.
About the Benchmark: Nifty Bank Index
Nifty Bank Index is an index comprised of the most liquid and large capitalised Indian Banking stocks.
It provides investors and market intermediaries with a benchmark that captures the capital market
performance of Indian Banks.
R*Shares Banking ETF
Confidential Slide
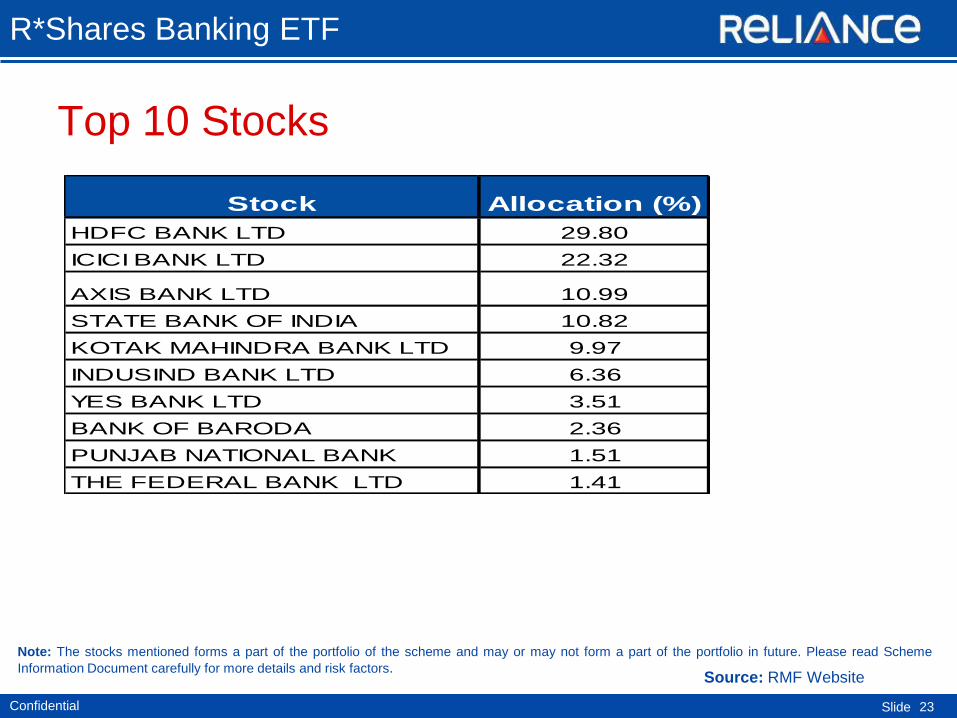
Top 10 Stocks
23
R*Shares Banking ETF
Note: The stocks mentioned forms a part of the portfolio of the scheme and may or may not form a part of the portfolio in future. Please read Scheme
Information Document carefully for more details and risk factors. Source: RMF Website
Stock Allocation (%)
HDFC BANK LTD 29.80
ICICI BANK LTD 22.32
AXIS BANK LTD 10.99
STATE BANK OF INDIA 10.82
KOTAK MAHINDRA BANK LTD 9.97
INDUSIND BANK LTD 6.36
YES BANK LTD 3.51
BANK OF BARODA 2.36
PUNJAB NATIONAL BANK 1.51
THE FEDERAL BANK LTD 1.41
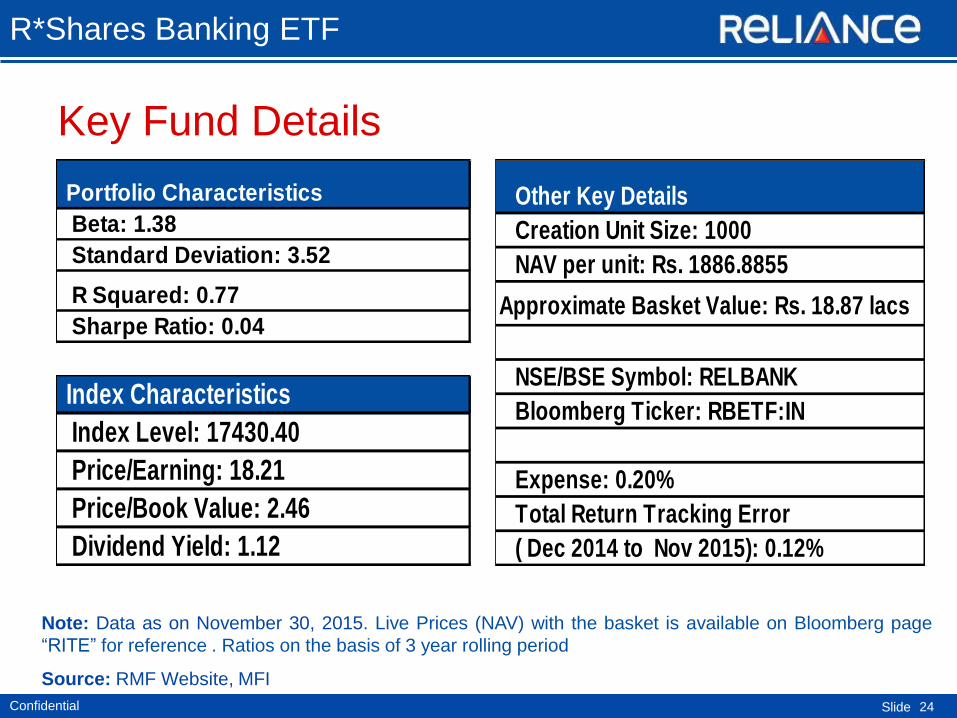
Confidential Slide 24
R*Shares Banking ETF
Key Fund Details
Source: RMF Website, MFI
Note: Data as on November 30, 2015. Live Prices (NAV) with the basket is available on Bloomberg page
“RITE” for reference . Ratios on the basis of 3 year rolling period
Other Key Details
Creation Unit Size: 1000
NAV per unit: Rs. 1886.8855
Approximate Basket Value: Rs. 18.87 lacs
NSE/BSE Symbol: RELBANK
Bloomberg Ticker: RBETF:IN
Expense: 0.20%
Total Return Tracking Error
( Dec 2014 to Nov 2015): 0.12%
Portfolio Characteristics
Beta: 1.38
Standard Deviation: 3.52
R Squared: 0.77
Sharpe Ratio: 0.04
Index Characteristics
Index Level: 17430.40
Price/Earning: 18.21
Price/Book Value: 2.46
Dividend Yield: 1.12
Confidential Slide
R*Shares NV20 ETF
25
(An Open Ended Index Exchange Traded Fund)
[Rajiv Gandhi Equity Savings Scheme (RGESS) qualified scheme]
Confidential Slide 26
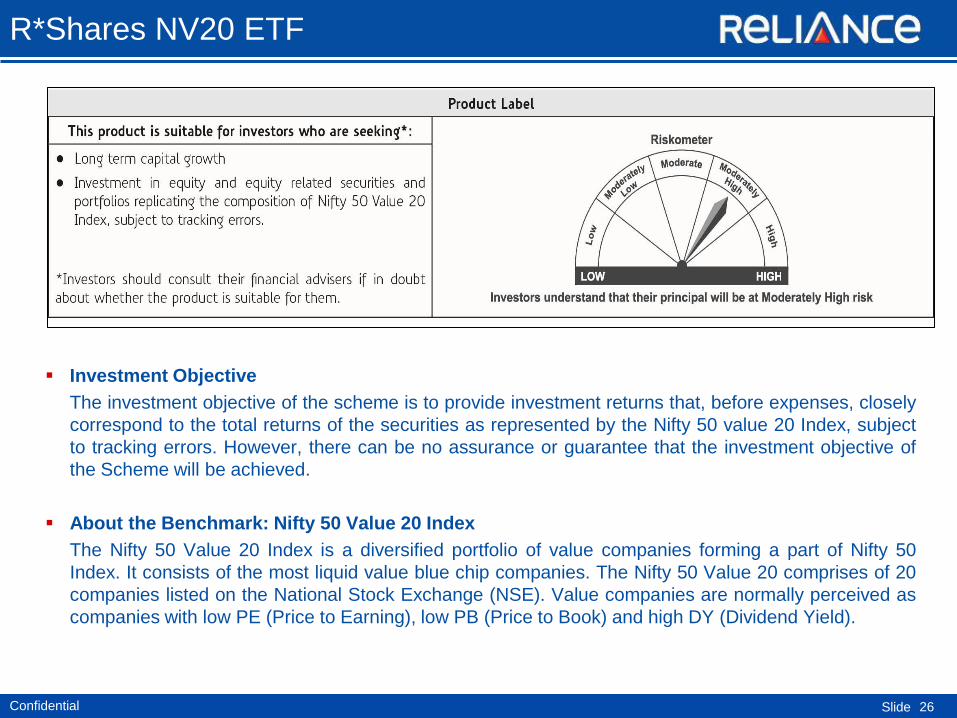
Investment Objective
The investment objective of the scheme is to provide investment returns that, before expenses, closely
correspond to the total returns of the securities as represented by the Nifty 50 value 20 Index, subject
to tracking errors. However, there can be no assurance or guarantee that the investment objective of
the Scheme will be achieved.
About the Benchmark: Nifty 50 Value 20 Index
The Nifty 50 Value 20 Index is a diversified portfolio of value companies forming a part of Nifty 50
Index. It consists of the most liquid value blue chip companies. The Nifty 50 Value 20 comprises of 20
companies listed on the National Stock Exchange (NSE). Value companies are normally perceived as
companies with low PE (Price to Earning), low PB (Price to Book) and high DY (Dividend Yield).
R*Shares NV20 ETF
Confidential Slide 27
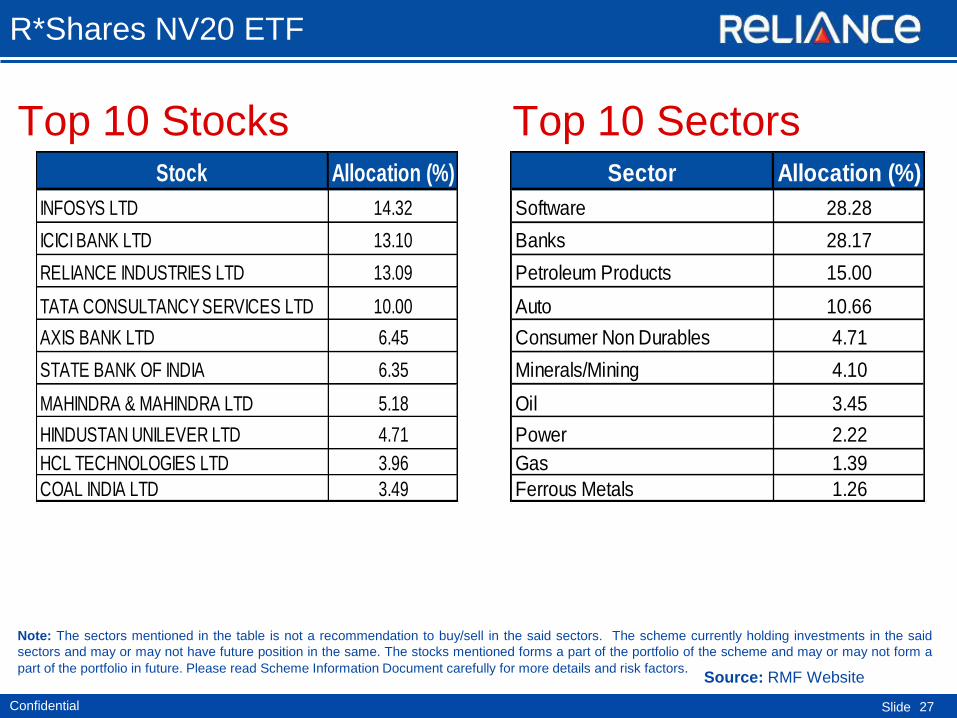
R*Shares NV20 ETF
Top 10 Stocks Top 10 Sectors
Note: The sectors mentioned in the table is not a recommendation to buy/sell in the said sectors. The scheme currently holding investments in the said
sectors and may or may not have future position in the same. The stocks mentioned forms a part of the portfolio of the scheme and may or may not form a
part of the portfolio in future. Please read Scheme Information Document carefully for more details and risk factors. Source: RMF Website
Stock Allocation (%)
INFOSYS LTD 14.32
ICICI BANK LTD 13.10
RELIANCE INDUSTRIES LTD 13.09
TATA CONSULTANCY SERVICES LTD 10.00
AXIS BANK LTD 6.45
STATE BANK OF INDIA 6.35
MAHINDRA & MAHINDRA LTD 5.18
HINDUSTAN UNILEVER LTD 4.71
HCL TECHNOLOGIES LTD 3.96
COAL INDIA LTD 3.49
Sector Allocation (%)
Software 28.28
Banks 28.17
Petroleum Products 15.00
Auto 10.66
Consumer Non Durables 4.71
Minerals/Mining 4.10
Oil 3.45
Power 2.22
Gas 1.39
Ferrous Metals 1.26
Confidential Slide 28
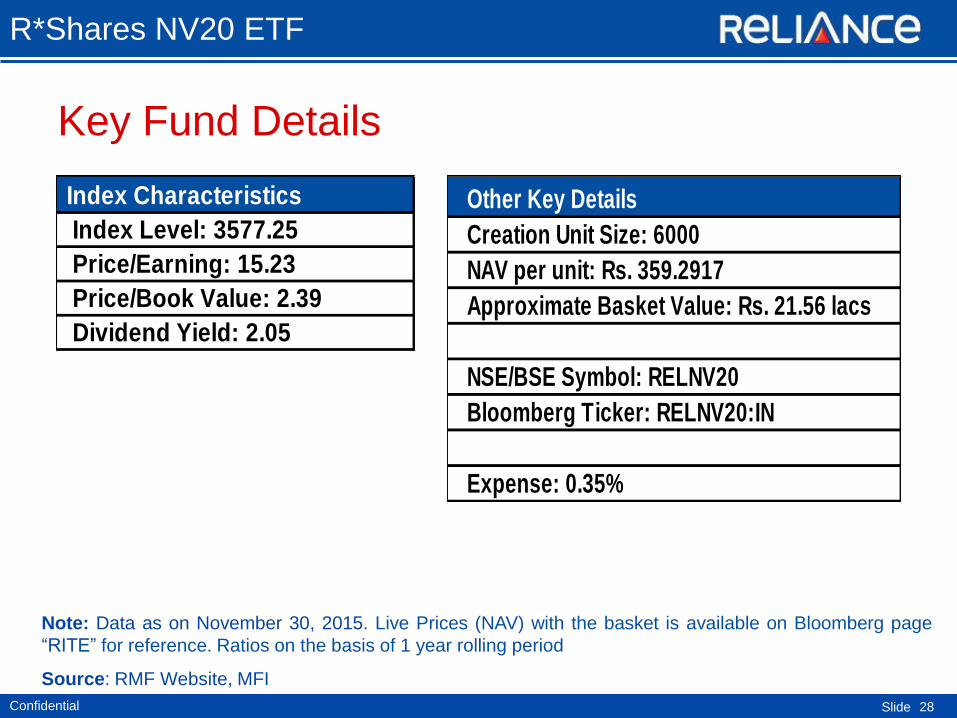
Key Fund Details
R*Shares NV20 ETF
Source: RMF Website, MFI
Note: Data as on November 30, 2015. Live Prices (NAV) with the basket is available on Bloomberg page
“RITE” for reference. Ratios on the basis of 1 year rolling period
Index Characteristics
Index Level: 3577.25
Price/Earning: 15.23
Price/Book Value: 2.39
Dividend Yield: 2.05
Other Key Details
Creation Unit Size: 6000
NAV per unit: Rs. 359.2917
Approximate Basket Value: Rs. 21.56 lacs
NSE/BSE Symbol: RELNV20
Bloomberg Ticker: RELNV20:IN
Expense: 0.35%
Confidential Slide
R*Shares CNX 100 ETF
29
(An Open Ended Index Exchange Traded Fund)
[Rajiv Gandhi Equity Savings Scheme (RGESS) qualified scheme]
Confidential Slide 30
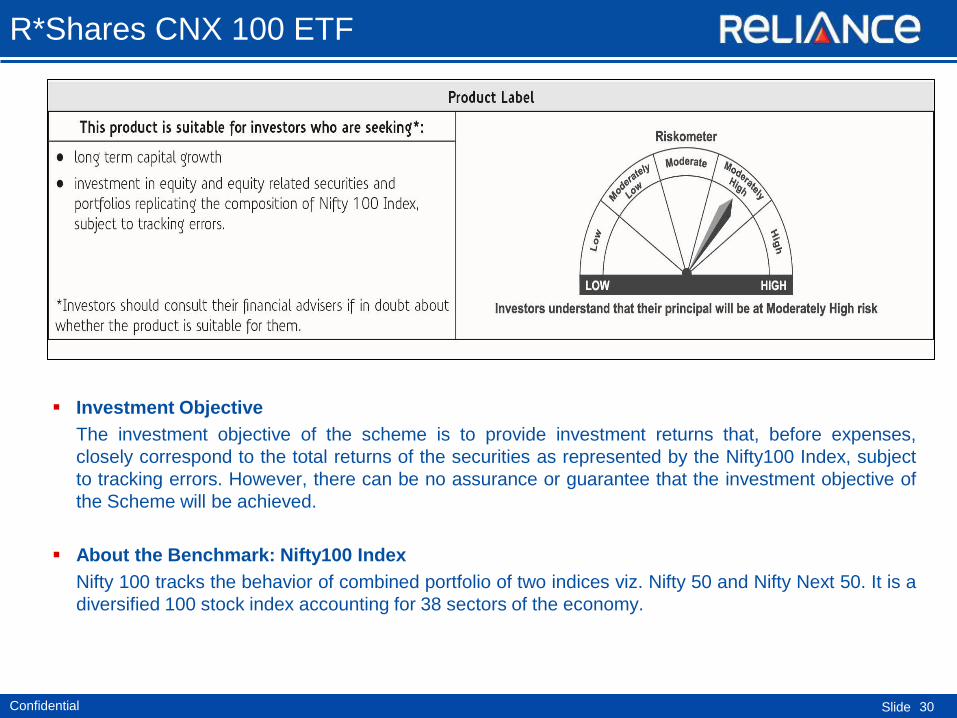
Investment Objective
The investment objective of the scheme is to provide investment returns that, before expenses,
closely correspond to the total returns of the securities as represented by the Nifty100 Index, subject
to tracking errors. However, there can be no assurance or guarantee that the investment objective of
the Scheme will be achieved.
About the Benchmark: Nifty100 Index
Nifty 100 tracks the behavior of combined portfolio of two indices viz. Nifty 50 and Nifty Next 50. It is a
diversified 100 stock index accounting for 38 sectors of the economy.
R*Shares CNX 100 ETF
Confidential Slide 31
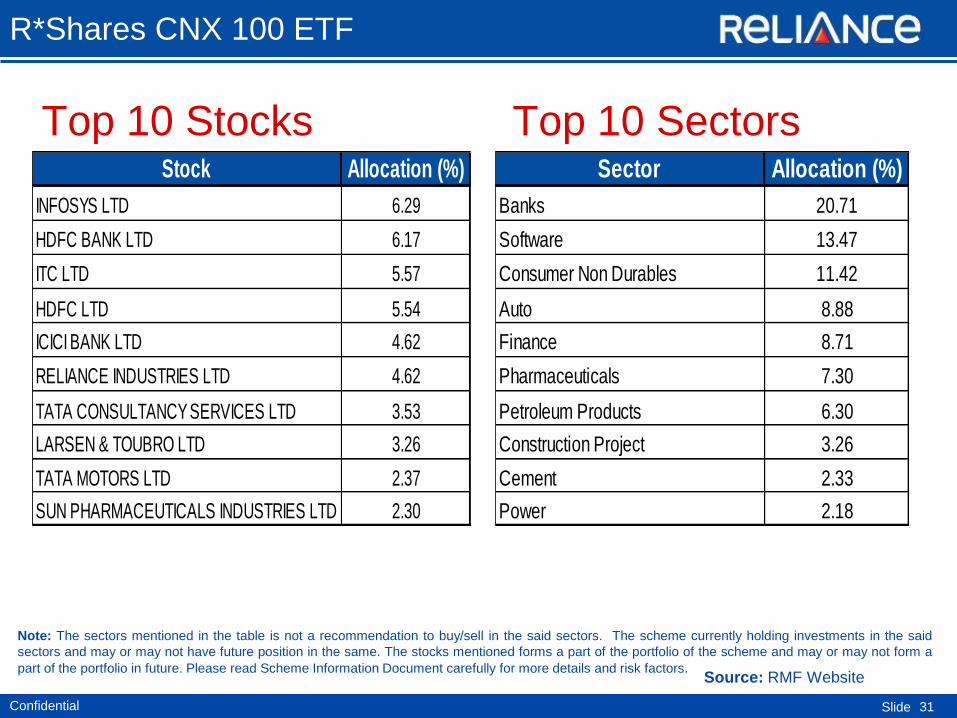
R*Shares CNX 100 ETF
Top 10 Stocks Top 10 Sectors
Note: The sectors mentioned in the table is not a recommendation to buy/sell in the said sectors. The scheme currently holding investments in the said
sectors and may or may not have future position in the same. The stocks mentioned forms a part of the portfolio of the scheme and may or may not form a
part of the portfolio in future. Please read Scheme Information Document carefully for more details and risk factors. Source: RMF Website
Stock Allocation (%)
INFOSYS LTD 6.29
HDFC BANK LTD 6.17
ITC LTD 5.57
HDFC LTD 5.54
ICICI BANK LTD 4.62
RELIANCE INDUSTRIES LTD 4.62
TATA CONSULTANCY SERVICES LTD 3.53
LARSEN & TOUBRO LTD 3.26
TATA MOTORS LTD 2.37
SUN PHARMACEUTICALS INDUSTRIES LTD 2.30
Sector Allocation (%)
Banks 20.71
Software 13.47
Consumer Non Durables 11.42
Auto 8.88
Finance 8.71
Pharmaceuticals 7.30
Petroleum Products 6.30
Construction Project 3.26
Cement 2.33
Power 2.18

Confidential Slide 32
Key Fund Details
R*Shares CNX 100 ETF
Source: RMF Website, MFI.
Note: Data as on November 30, 2015. Live Prices (NAV) with the basket is available on Bloomberg page
“RITE” for reference . Ratios on the basis of 1 year rolling period
Other Key Details
Creation Unit Size: 100,000
NAV per unit: Rs. 81.7634
Approximate Basket Value: Rs. 81.76 lacs
NSE/BSE Symbol: RELCNX100
Bloomberg Ticker: RCNX100:IN
Expense: 1.50%
Total Return Tracking Error
( Dec 2014 to Nov 2015): 0.17%
Index Characteristics
Index Level: 8057.20
Price/Earning: 21.5
Price/Book Value: 3.11
Dividend Yield: 1.47
Portfolio Characteristics
Beta: 0.99
Standard Deviation: 2.26
R Squared: 0.99
Sharpe Ratio: - 0.10

Confidential Slide
R*Shares Consumption ETF
33
(An Open Ended Index Exchange Traded Fund)
Confidential Slide 34
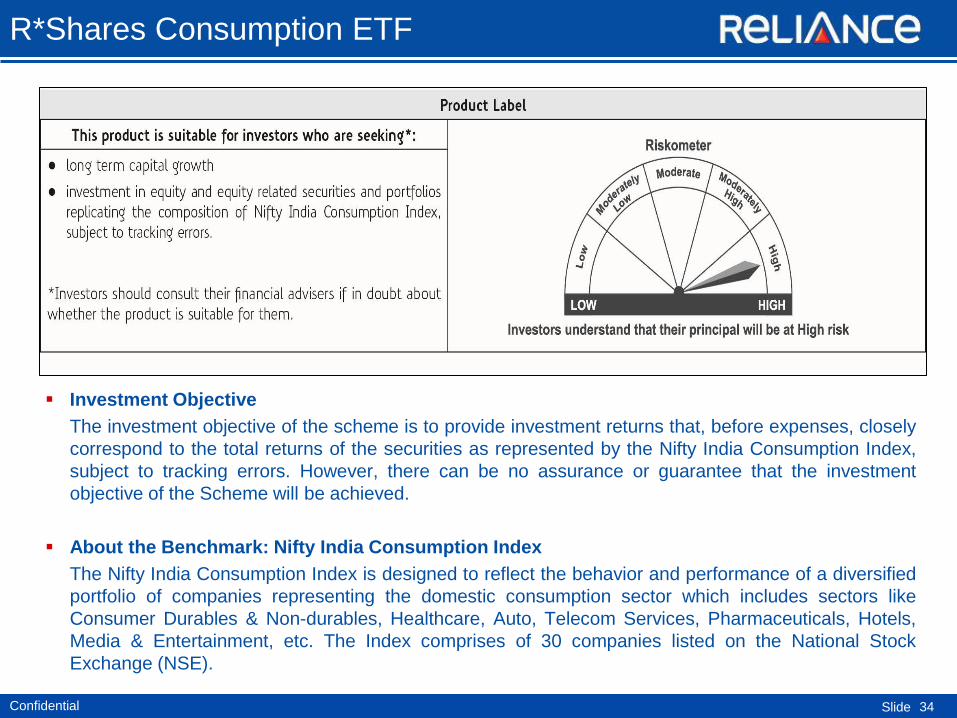
Investment Objective
The investment objective of the scheme is to provide investment returns that, before expenses, closely
correspond to the total returns of the securities as represented by the Nifty India Consumption Index,
subject to tracking errors. However, there can be no assurance or guarantee that the investment
objective of the Scheme will be achieved.
About the Benchmark: Nifty India Consumption Index
The Nifty India Consumption Index is designed to reflect the behavior and performance of a diversified
portfolio of companies representing the domestic consumption sector which includes sectors like
Consumer Durables & Non-durables, Healthcare, Auto, Telecom Services, Pharmaceuticals, Hotels,
Media & Entertainment, etc. The Index comprises of 30 companies listed on the National Stock
Exchange (NSE).
R*Shares Consumption ETF
Confidential Slide 35
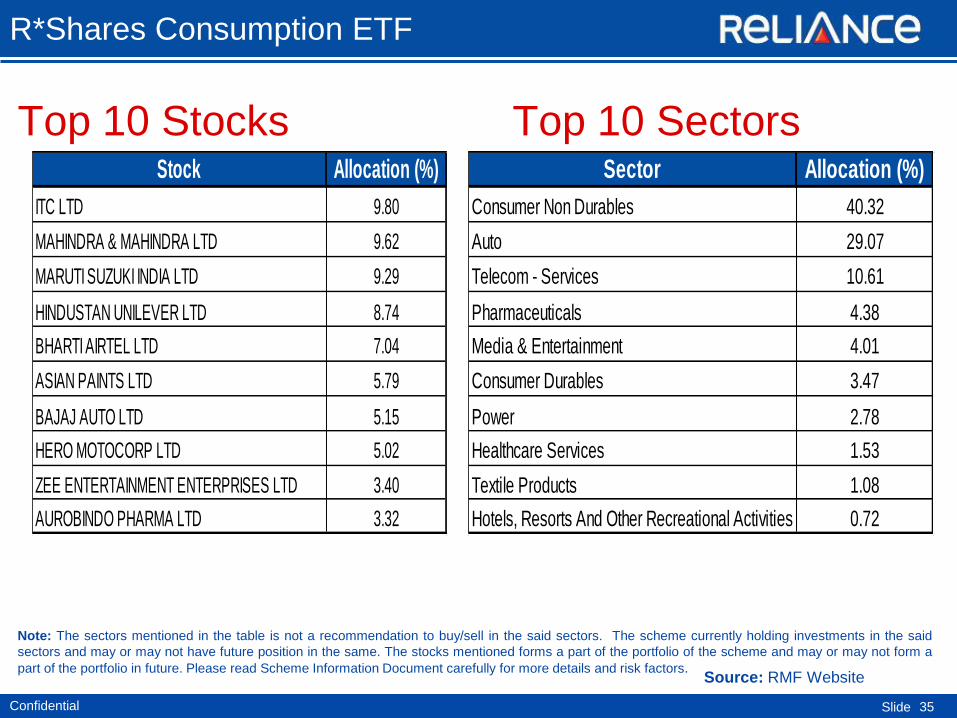
R*Shares Consumption ETF
Top 10 Stocks Top 10 Sectors
Note: The sectors mentioned in the table is not a recommendation to buy/sell in the said sectors. The scheme currently holding investments in the said
sectors and may or may not have future position in the same. The stocks mentioned forms a part of the portfolio of the scheme and may or may not form a
part of the portfolio in future. Please read Scheme Information Document carefully for more details and risk factors. Source: RMF Website
Stock Allocation (%)
ITC LTD 9.80
MAHINDRA & MAHINDRA LTD 9.62
MARUTI SUZUKI INDIA LTD 9.29
HINDUSTAN UNILEVER LTD 8.74
BHARTI AIRTEL LTD 7.04
ASIAN PAINTS LTD 5.79
BAJAJ AUTO LTD 5.15
HERO MOTOCORP LTD 5.02
ZEE ENTERTAINMENT ENTERPRISES LTD 3.40
AUROBINDO PHARMA LTD 3.32
Sector Allocation (%)
Consumer Non Durables 40.32
Auto 29.07
Telecom - Services 10.61
Pharmaceuticals 4.38
Media & Entertainment 4.01
Consumer Durables 3.47
Power 2.78
Healthcare Services 1.53
Textile Products 1.08
Hotels, Resorts And Other Recreational Activities 0.72

Confidential Slide 36
Key Fund Details
R*Shares Consumption ETF
Source: RMF Website, MFI
Note: Data as on November 30, 2015. Live Prices (NAV) with the basket is available on Bloomberg page
“RITE” for reference . Ratios on the basis of 1 year rolling period
Other Key Details
Creation Unit Size: 150,000
NAV per unit: Rs. 36.1492
Approximate Basket Value: Rs. 54.22 lacs
NSE/BSE Symbol: RELCONS
Bloomberg Ticker: RCONSUM:IN
Expense: 0.35%
Total Return Tracking Error
( Dec 2014 to Nov 2015): 0.26%
Portfolio Characteristics
Beta: 0.87
Standard Deviation: 2.23
R Squared: 0.79
Sharpe Ratio: -0.01
Index Characteristics
Index Level: 3546.85
Price/Earning: 30.11
Price/Book Value: 4.93
Dividend Yield: 1.09
Confidential Slide
R*Shares Dividend Opportunities ETF
37
(An Open Ended Index Exchange Traded Fund)

Confidential Slide 38
Investment Objective
The investment objective of the scheme is to provide investment returns that, before expenses,
closely correspond to the total returns of the securities as represented by the Nifty Dividend
Opportunities 50 Index, subject to tracking errors. However, there can be no assurance or guarantee
that the investment objective of the Scheme will be achieved.
About the Benchmark: Nifty Dividend Opportunities 50 Index
The Nifty Dividend Opportunities 50 Index is designed to provide exposure to high yielding companies
listed on NSE while meeting stability and tradability requirements. The Nifty Dividend Opportunities 50
Index comprises of 50 companies. The methodology employs a yield driven selection criteria that aims
to maximize yield while providing stability and tradability. Currently the index comprises of companies
from 25 different sectors.
R*Shares Dividend Opportunities ETF

Confidential Slide 39
R*Shares Dividend Opportunities ETF
Top 10 Stocks Top 10 Sectors
Note: The sectors mentioned in the table is not a recommendation to buy/sell in the said sectors. The scheme currently holding investments in the said
sectors and may or may not have future position in the same. The stocks mentioned forms a part of the portfolio of the scheme and may or may not form a
part of the portfolio in future. Please read Scheme Information Document carefully for more details and risk factors. Source: RMF Website
Stock Allocation (%)
ITC LTD 9.97
HINDUSTAN UNILEVER LTD 9.89
COAL INDIA LTD 8.05
OIL & NATURAL GAS CORPORATION LTD 7.96
BAJAJ AUTO LTD 6.40
HERO MOTOCORP LTD 6.24
NTPC LTD 5.12
BHARAT PETROLEUM CORPORATION LTD 4.42
INDIAN OIL CORPORATION LTD 3.92
BANK OF BARODA 3.20
Sector Allocation (%)
Consumer Non Durables 22.52
Auto 12.65
Banks 12.34
Petroleum Products 10.98
Oil 10.42
Minerals/Mining 9.48
Power 5.69
Finance 5.55
Industrial Products 2.55
Cement 2.38
Confidential Slide 40
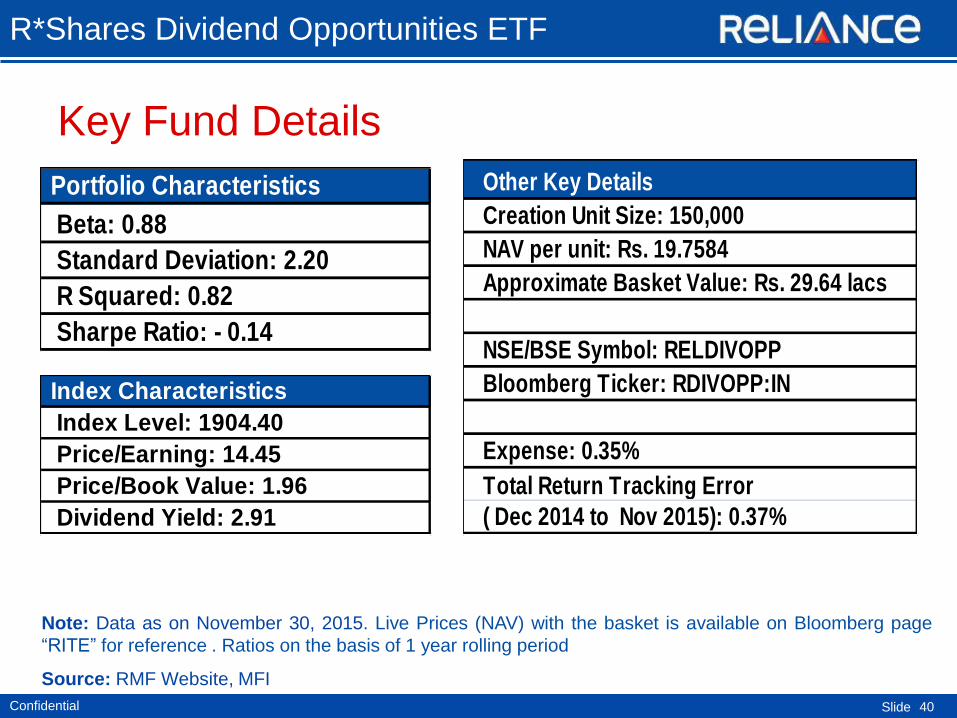
Key Fund Details
R*Shares Dividend Opportunities ETF
Source: RMF Website, MFI
Note: Data as on November 30, 2015. Live Prices (NAV) with the basket is available on Bloomberg page
“RITE” for reference . Ratios on the basis of 1 year rolling period
Other Key Details
Creation Unit Size: 150,000
NAV per unit: Rs. 19.7584
Approximate Basket Value: Rs. 29.64 lacs
NSE/BSE Symbol: RELDIVOPP
Bloomberg Ticker: RDIVOPP:IN
Expense: 0.35%
Total Return Tracking Error
( Dec 2014 to Nov 2015): 0.37%
Portfolio Characteristics
Beta: 0.88
Standard Deviation: 2.20
R Squared: 0.82
Sharpe Ratio: - 0.14
Index Characteristics
Index Level: 1904.40
Price/Earning: 14.45
Price/Book Value: 1.96
Dividend Yield: 2.91
Confidential Slide
R*Shares Gold ETF
41
(An Open Ended Gold Exchange Traded Fund that tracks the
domestic prices of gold through investments in physical gold)

Confidential Slide 42
Investment Objective
The investment objective is to seek to provide returns that closely correspond to returns provided by
price of gold through investment in physical Gold (and Gold related securities as permitted by
Regulators from time to time). However, the performance of the scheme may differ from that of the
domestic prices of Gold due to expenses and or other related factors. However, there can be no
assurance that the investment objective of the scheme will be achieved.
About the Benchmark: Physical Gold
The Physical Gold has fineness (or purity) of 995 parts per 1000 (99.5%) or higher.
R*Shares Gold ETF
Confidential Slide
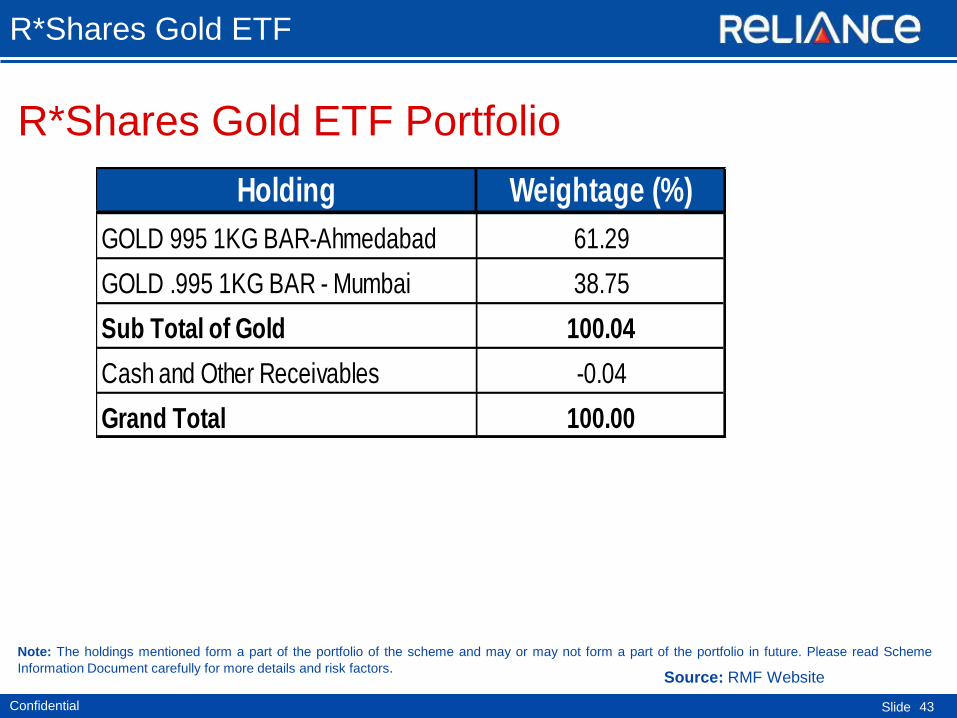
R*Shares Gold ETF Portfolio
43
R*Shares Gold ETF
Source: RMF Website
Note: The holdings mentioned form a part of the portfolio of the scheme and may or may not form a part of the portfolio in future. Please read Scheme
Information Document carefully for more details and risk factors.
Holding Weightage (%)
GOLD 995 1KG BAR-Ahmedabad 61.29
GOLD .995 1KG BAR - Mumbai 38.75
Sub Total of Gold 100.04
Cash and Other Receivables -0.04
Grand Total 100.00
Confidential Slide 44
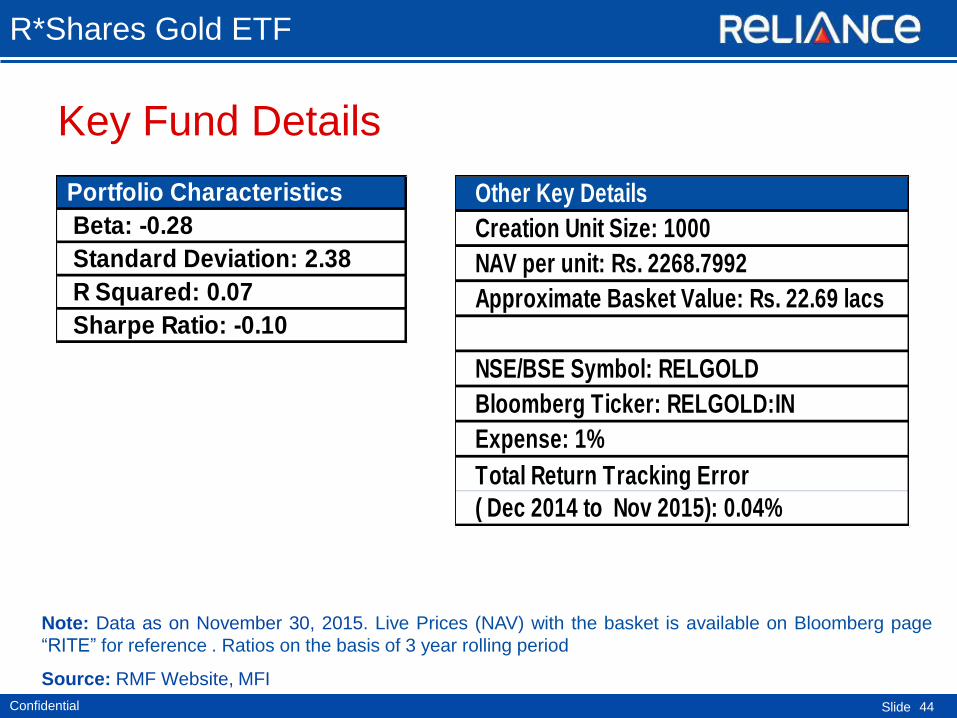
Key Fund Details
Source: RMF Website, MFI
Note: Data as on November 30, 2015. Live Prices (NAV) with the basket is available on Bloomberg page
“RITE” for reference . Ratios on the basis of 3 year rolling period
R*Shares Gold ETF
Portfolio Characteristics
Beta: -0.28
Standard Deviation: 2.38
R Squared: 0.07
Sharpe Ratio: -0.10
Other Key Details
Creation Unit Size: 1000
NAV per unit: Rs. 2268.7992
Approximate Basket Value: Rs. 22.69 lacs
NSE/BSE Symbol: RELGOLD
Bloomberg Ticker: RELGOLD:IN
Expense: 1%
Total Return Tracking Error
( Dec 2014 to Nov 2015): 0.04%
Confidential Slide
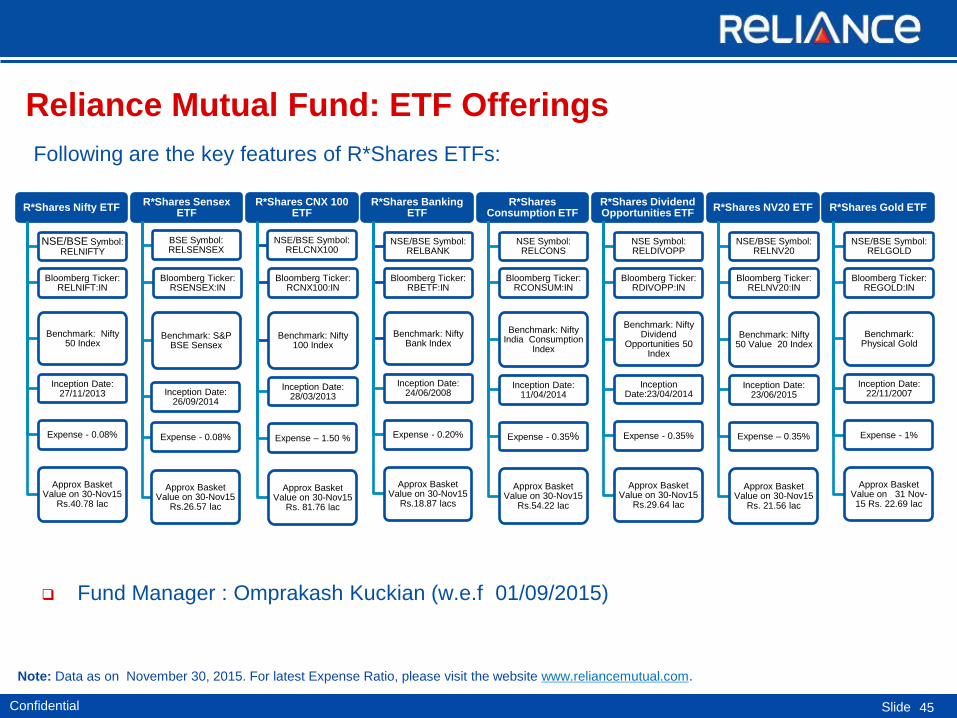
Reliance Mutual Fund: ETF Offerings
Fund Manager : Omprakash Kuckian (w.e.f 01/09/2015)
Following are the key features of R*Shares ETFs:
45
Note: Data as on November 30, 2015. For latest Expense Ratio, please visit the website www.reliancemutual.com.
R*Shares Nifty ETF
NSE/BSE Symbol: RELNIFTY
Bloomberg Ticker: RELNIFT:IN
Benchmark: Nifty 50 Index
Inception Date: 27/11/2013
Expense - 0.08%
Approx Basket Value on 30-Nov15
Rs.40.78 lac
R*Shares Sensex ETF
BSE Symbol: RELSENSEX
Bloomberg Ticker: RSENSEX:IN
Benchmark: S&P BSE Sensex
Inception Date: 26/09/2014
Expense - 0.08%
Approx Basket Value on 30-Nov15
Rs.26.57 lac
R*Shares CNX 100 ETF
NSE/BSE Symbol: RELCNX100
Bloomberg Ticker: RCNX100:IN
Benchmark: Nifty 100 Index
Inception Date: 28/03/2013
Expense – 1.50 %
Approx Basket Value on 30-Nov15
Rs. 81.76 lac
R*Shares Banking ETF
NSE/BSE Symbol: RELBANK
Bloomberg Ticker: RBETF:IN
Benchmark: Nifty Bank Index
Inception Date: 24/06/2008
Expense - 0.20%
Approx Basket Value on 30-Nov15
Rs.18.87 lacs
R*Shares Consumption ETF
NSE Symbol: RELCONS
Bloomberg Ticker: RCONSUM:IN
Benchmark: Nifty India Consumption
Index
Inception Date: 11/04/2014
Expense - 0.35%
Approx Basket Value on 30-Nov15
Rs.54.22 lac
R*Shares Dividend Opportunities ETF
NSE Symbol: RELDIVOPP
Bloomberg Ticker: RDIVOPP:IN
Benchmark: Nifty Dividend
Opportunities 50 Index
Inception Date:23/04/2014
Expense - 0.35%
Approx Basket Value on 30-Nov15
Rs.29.64 lac
R*Shares NV20 ETF
NSE/BSE Symbol: RELNV20
Bloomberg Ticker: RELNV20:IN
Benchmark: Nifty 50 Value 20 Index
Inception Date: 23/06/2015
Expense – 0.35%
Approx Basket Value on 30-Nov15
Rs. 21.56 lac
R*Shares Gold ETF
NSE/BSE Symbol: RELGOLD
Bloomberg Ticker: REGOLD:IN
Benchmark: Physical Gold
Inception Date: 22/11/2007
Expense - 1%
Approx Basket Value on 31 Nov-15 Rs. 22.69 lac

Confidential Slide
Scheme Specific Risk Factors: Trading volumes and settlement periods may restrict liquidity in equity and debt investments.
Investment in Debt is subject to price, credit, and interest rate risk. The NAV of the Scheme may be affected, inter alia, by changes in
the market conditions, interest rates, trading volumes, settlement periods and transfer procedures. The NAV may also be subjected to
risk associated with tracking error, investment in derivatives or script lending as may be permissible by the Scheme Information
Document.
BSE Disclaimer: It is to be distinctly understood that the permission given by BSE Ltd. should not in any ways be deemed or
construed that the SID has been cleared or approved by BSE Ltd. nor does it certify the correctness or completeness of any of the
contents of the SID. The investors are advised to refer to the SID for the full text of the Disclaimer clause of the BSE Ltd.
NSE Disclaimer: It is to be distinctly understood that the permission given by NSE should not in any way be deemed or construed that
the Scheme Information Document has been cleared or approved by NSE nor does it certify the correctness or completeness of any of
the contents of the Draft Scheme Information Document. The investors are advised to refer to the Scheme Information Document for
the full text of the Disclaimer Clause of NSE
Disclaimers The information herein is meant only for general reading purposes and the views being expressed only constitute opinions and
therefore cannot be considered as guidelines, recommendations or as a professional guide for the readers. Certain factual and
statistical information (historical as well as projected) pertaining to Industry and markets have been obtained from independent third-
party sources, which are deemed to be reliable. It may be noted that since RCAM has not independently verified the accuracy or
authenticity of such information or data, or for that matter the reasonableness of the assumptions upon which such data and
information has been processed or arrived at; RCAM does not in any manner assures the accuracy or authenticity of such data and
information. Some of the statements & assertions contained in these materials may reflect RCAM’s views or opinions, which in turn
may have been formed on the basis of such data or information.
Before making any investments, the readers are advised to seek independent professional advice, verify the contents in order to arrive
at an informed investment decision. None of the Sponsor, the Investment Manager, the Trustee, their respective directors, employees,
affiliates or representatives shall be liable in any way for any direct, indirect, special, incidental, consequential, punitive or exemplary
damages, including on account of lost profits arising from the information contained in this material.
Mutual Fund investments are subject to market risks, read all scheme related documents carefully.
46

Thank you


