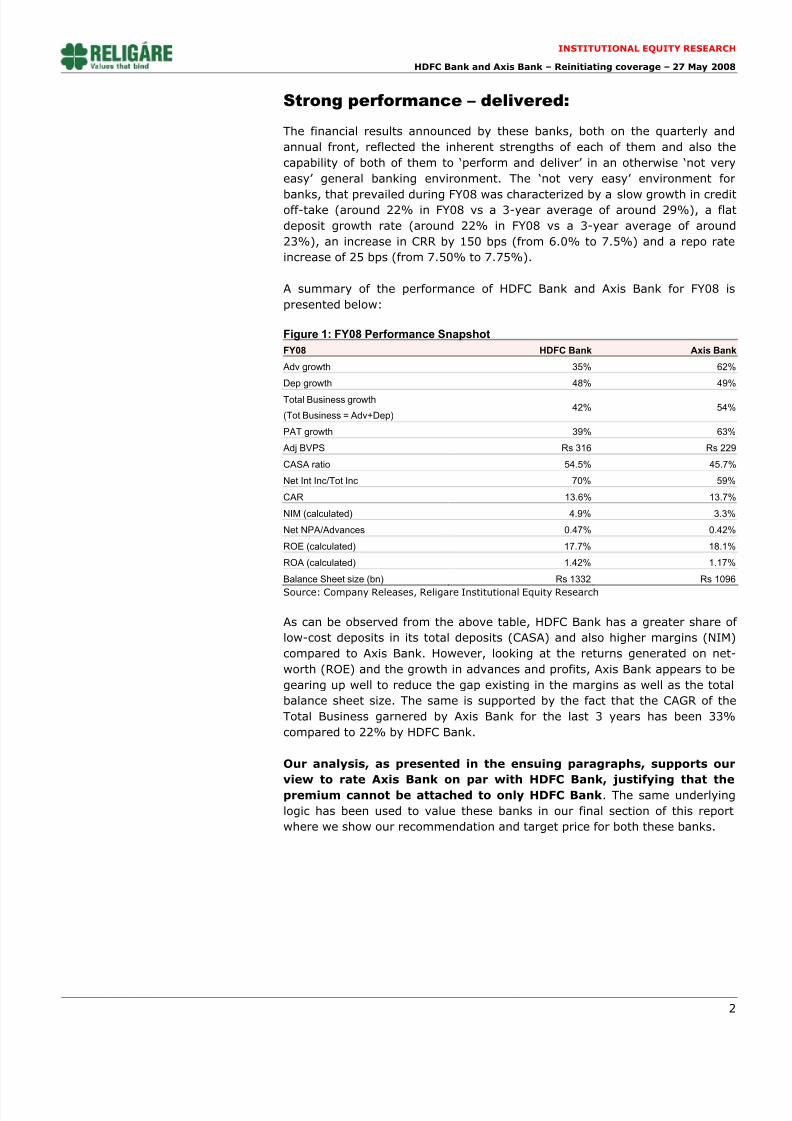
+ All Categories
Home > Documents > Religare-hdfc Bank & Axis_bank-reinitiating Coverage-28may08

Religare-hdfc Bank & Axis_bank-reinitiating Coverage-28may08

Date post: 07-Apr-2018
Category:
Upload: abhinav-chitranshu
View: 219 times
Download: 0 times
Share this document with a friend
17
 Institutional Equity Research Ke y data 27 May 2008 HDFC Bank Sector  Banking Market Cap Rs472bn/US$11bn 52 Wk H/L (Rs) 1825/1050.3 BSE Avg. daily vol. (6 month) 780,152  BSE Code 500180 NSE Code HDFCBANK Bloomberg HDFCB IN Reuters HDBK.BO  Sensex 16,276 Nifty 4,860  Shareholding pattern (%) 31-Dec-07 31-Mar-08 FIIs 50.3 49.3 MFs and institutions 6.2 5.8 Promoters 23.3 23.3 Others 20.2 21.7 Axis Bank Sector  Banking Market Cap Rs264bn/US$6.1bn 52 Wk H/L (Rs) 1291.5/522.55 BSE Avg. daily vol. (6 month) 1,308,114  BSE Code 532215 NSE Code AXISBANK Bloomberg AXSB IN Reuters AXIS.BO  Sensex 16,276 Nifty 4,860  Shareholding pattern (%) 31-Dec-07 31-Mar-08 FIIs 39.3 39.1 MFs and institutions 8.3 8.3 Promoters 43.0 42.5 Others 9.4 10.1 Ravi Sankar J S [email protected] +91 22 6655 0148 HDFC Bank Accumulate Current Price: Rs 1330 Target price: Rs 1590 Axis Bank Accumulate Current Price: Rs 740 Target price: Rs 960 We are reinitiating our coverage on HDFC Bank and Axis Bank with an  Accumulate’ recommendation for both.  Strong performance – Delivered:  Both banks delivered strong numbers for FY08 even in a ‘not very easy’ environment. 3 year CAGR of Total Business garnered by Axis Bank is 33% vs 22% by HDFC Bank. FY08 HDFC Bank Axis Bank Adv Growth 35% 62% Dep Growth 48% 49% PAT Growth 39% 63% CASA 55% 46% NII / Total Income 70% 59% Adj BVPS (Rs) 316 229 NIM (calculated) 4.9% 3.3% ROE (calculated) 17.7% 18.1% ROA (calculated) 1.42% 1.17%   HDFC Bank has higher ROA but Axis has higher efficiency:  Our analysis of a modified definition of ROA shows that Axis Bank has a consistent track of greater efficiency than HDFC Bank. 3 year average efficiency, as per our calculations, for Axis Bank is 0.6 compared to 0.4 for HDFC Bank.  We defined efficiency as traditional ROA + Int Paid/Assets – Int Paid/(Total Deposits + Total Borrowings)  HDFC Bank-CBoP merger - Near term stress; speedy integration key:  RBI green signal to the merger with effective date May 23, 2008  CBoP’s lower CASA (24.5%), quality of retail loans, integration on human resource and technology fronts key performance determinants for post-merger entity  Axis Bank – Loan portfolio might be carrying greater risk:  Sudden emergence of around 10% corporate loan exposure to ‘Gems and Jewellery’ segment needs to be watched closely for risk involved.  High rate of capital consumption indicated by fall in Capital Adequacy Ratio. Our analysis, as presented in the ensuing paragraphs, supports our view to rate Axis Bank on par with HDFC Bank, justifying the fact that the valuation premium cannot be attached to only HDFC Bank. Based on a FY10E BVPS of Rs 306 and Rs 506 for Axis Bank and HDFC Bank respectively, we recommend accumulation of the stocks with a price target of Rs 960 for Axis Bank and Rs 1590 for HDFC Bank. We have provided for a 10% discount on a fair valuation of 3.5 times PBV for both these banks to reflect the heightened macro economic environment. Reinitiating coverage
Transcript

8/6/2019 Religare-hdfc Bank & Axis_bank-reinitiating Coverage-28may08

http://slidepdf.com/reader/full/religare-hdfc-bank-axisbank-reinitiating-coverage-28may08 1/17

  Institutional Equity

Research

Key data  27 May 2008 

HDFC Bank

Sector  Banking

Market Cap Rs472bn/US$11bn

52 Wk H/L (Rs) 1825/1050.3

BSE Avg. dai ly vol. (6 month) 780,152 

BSE Code 500180

NSE Code HDFCBANK

Bloomberg HDFCB IN

Reuters HDBK.BO 

Sensex 16,276

Nifty 4,860 

Shareholding pattern (%)

31-Dec-07 31-Mar-08FIIs 50.3 49.3

MFs and institutions 6.2 5.8

Promoters 23.3 23.3

Others 20.2 21.7

Axis Bank

Sector  Banking

Market Cap Rs264bn/US$6.1bn

52 Wk H/L (Rs) 1291.5/522.55

BSE Avg. dai ly vol. (6 month) 1,308,114 

BSE Code 532215NSE Code AXISBANK

Bloomberg AXSB IN

Reuters AXIS.BO 

Sensex 16,276

Nifty 4,860 

Shareholding pattern (%)

31-Dec-07 31-Mar-08

FIIs 39.3 39.1

MFs and institutions 8.3 8.3

Promoters 43.0 42.5

Others 9.4 10.1

Ravi Sankar J [email protected]+91 22 6655 0148

HDFC BankAccumulate Current Price: Rs 1330 Target price: Rs 1590

Axis BankAccumulate Current Price: Rs 740 Target price: Rs 960

We are reinitiating our coverage on HDFC Bank and Axis Bank with an

 ‘Accumulate’ recommendation for both.

•  Strong performance – Delivered:

  Both banks delivered strong numbers for FY08 even in a ‘not very

easy’ environment. 3 year CAGR of Total Business garnered by Axis

Bank is 33% vs 22% by HDFC Bank. 

FY08 HDFC Bank Axis Bank

Adv Growth 35% 62%

Dep Growth 48% 49%

PAT Growth 39% 63%

CASA 55% 46%

NII / Total Income 70% 59%

Adj BVPS (Rs) 316 229

NIM (calculated) 4.9% 3.3%

ROE (calculated) 17.7% 18.1%

ROA (calculated) 1.42% 1.17%


•  HDFC Bank has higher ROA but Axis has higher efficiency:

  Our analysis of a modified definition of ROA shows that Axis Bank hasa consistent track of greater efficiency than HDFC Bank. 3 year

average efficiency, as per our calculations, for Axis Bank is 0.6

compared to 0.4 for HDFC Bank.

  We defined efficiency as traditional ROA + Int Paid/Assets – Int 

Paid/(Total Deposits + Total Borrowings)

•  HDFC Bank-CBoP merger - Near term stress; speedy integration

key:

  RBI green signal to the merger with effective date May 23, 2008

  CBoP’s lower CASA (24.5%), quality of retail loans, integration on

human resource and technology fronts key performance determinants

for post-merger entity

•  Axis Bank – Loan portfolio might be carrying greater risk:

  Sudden emergence of around 10% corporate loan exposure to ‘Gems

and Jewellery’ segment needs to be watched closely for risk involved.

  High rate of capital consumption indicated by fall in Capital Adequacy

Ratio.

Our analysis, as presented in the ensuing paragraphs, supports our view to

rate Axis Bank on par with HDFC Bank, justifying the fact that the valuation

premium cannot be attached to only HDFC Bank. Based on a FY10E BVPS of 

Rs 306 and Rs 506 for Axis Bank and HDFC Bank respectively, we

recommend accumulation of the stocks with a price target of Rs 960

for Axis Bank and Rs 1590 for HDFC Bank. We have provided for a 10%

discount on a fair valuation of 3.5 times PBV for both these banks to reflect

the heightened macro economic environment.

Reinitiating coverage

8/6/2019 Religare-hdfc Bank & Axis_bank-reinitiating Coverage-28may08

http://slidepdf.com/reader/full/religare-hdfc-bank-axisbank-reinitiating-coverage-28may08 2/17


2

INSTITUTIONAL EQUITY RESEARCH

HDFC Bank and Axis Bank – Reinitiating coverage – 27 May 2008 

Strong performance – delivered: The financial results announced by these banks, both on the quarterly and

annual front, reflected the inherent strengths of each of them and also the

capability of both of them to ‘perform and deliver’ in an otherwise ‘not very

easy’ general banking environment. The ‘not very easy’ environment for

banks, that prevailed during FY08 was characterized by a slow growth in credit

off-take (around 22% in FY08 vs a 3-year average of around 29%), a flat

deposit growth rate (around 22% in FY08 vs a 3-year average of around

23%), an increase in CRR by 150 bps (from 6.0% to 7.5%) and a repo rate

increase of 25 bps (from 7.50% to 7.75%).

A summary of the performance of HDFC Bank and Axis Bank for FY08 is

presented below:

Figure 1: FY08 Performance Snapshot

FY08 HDFC Bank Axis Bank

Adv growth 35% 62%

Dep growth 48% 49%

Total Business growth

(Tot Business = Adv+Dep)42% 54%

PAT growth 39% 63%

Adj BVPS Rs 316 Rs 229

CASA ratio 54.5% 45.7%

Net Int Inc/Tot Inc 70% 59%

CAR 13.6% 13.7%

NIM (calculated) 4.9% 3.3%

Net NPA/Advances 0.47% 0.42%

ROE (calculated) 17.7% 18.1%

ROA (calculated) 1.42% 1.17%

Balance Sheet size (bn) Rs 1332 Rs 1096

Source: Company Releases, Religare Institutional Equity Research

As can be observed from the above table, HDFC Bank has a greater share of 

low-cost deposits in its total deposits (CASA) and also higher margins (NIM)

compared to Axis Bank. However, looking at the returns generated on net-

worth (ROE) and the growth in advances and profits, Axis Bank appears to be

gearing up well to reduce the gap existing in the margins as well as the total

balance sheet size. The same is supported by the fact that the CAGR of the

Total Business garnered by Axis Bank for the last 3 years has been 33%

compared to 22% by HDFC Bank.

Our analysis, as presented in the ensuing paragraphs, supports our

view to rate Axis Bank on par with HDFC Bank, justifying that the

premium cannot be attached to only HDFC Bank. The same underlying

logic has been used to value these banks in our final section of this report

where we show our recommendation and target price for both these banks.

8/6/2019 Religare-hdfc Bank & Axis_bank-reinitiating Coverage-28may08

http://slidepdf.com/reader/full/religare-hdfc-bank-axisbank-reinitiating-coverage-28may08 3/17


3

INSTITUTIONAL EQUITY RESEARCH

HDFC Bank and Axis Bank – Reinitiating coverage – 27 May 2008 

HDFC Bank delivers a higher ROA, but……… let us

look at this closely:

Figure 1 contains the calculated ROA values for both these banks. HDFC

Bank’s ROA is 1.42 compared to 1.17 of Axis. This value of ROA has been

arrived at using the traditional textbook formula for ROA i.e. Return generated

over Total Assets. If we were to break this variable into smaller parts, it is:

Net Int Inc/Assets + Non-Int Inc/Assets – Op Exp/Assets –

Prov/Asset . We modified the ratio in terms of calculating Net Int Inc/Assets.

The normal way to calculate this is Int Earned/Assets – Int Paid/Assets, but

we replaced Int Paid/Assets with Int paid/Int-bearing liabilities (i.e. Total

deposits and Total borrowings).

The idea of this change is to understand the efficiency of a bank in using its

assets to generate income and the cost it pays for its funds, removing the

differences arising out of a different debt-equity mix in the Total Assets of 

different banks.

The results were very interesting! HDFC Bank’s ‘net efficiency’ for FY08 was

0.23% compared to 0.57% of Axis Bank. The 3-year average for HDFC Bank 

came to 0.40% whereas for Axis Bank the same was 0.59%. This is contrary 

to the plain ROA value that remained at 1.4% for HDFC Bank for the last 3

years and 1.1% for Axis Bank. The below table contains these details:

Figure 2: ROA Analysis

Details HDFC Bank Axis Bank

2005-06 2006-07 2007-08 2005-06 2006-07 2007-08

Cost of funds 3.9% 4.9% 5.5% 4.6% 5.4% 5.4%

ROA Analysis

Int Earned / Assets 7.2% 8.4% 9.0% 6.6% 7.4% 7.7%

Int Paid / Assets 3.1% 3.9% 4.4% 4.1% 4.9% 4.8%

Net Int / Assets 4.1% 4.5% 4.7% 2.5% 2.5% 2.8%

Non-Int / Assets 1.8% 1.8% 2.0% 1.7% 1.6% 2.0%

Total Inc / Assets 5.9% 6.3% 6.7% 4.1% 4.2% 4.8%

Op Exp / Assets 2.7% 2.9% 3.3% 1.9% 2.0% 2.4%

Prov / Assets 1.8% 2.0% 1.9% 1.2% 1.1% 1.3%


ROA 1.4% 1.4% 1.4% 1.1% 1.1% 1.2%


Net efficiency

(ROA + Int-paid/Assets - Int-paid/Int-liabs) 0.62% 0.35% 0.23% 0.66% 0.53% 0.57%

Source: Company Releases, Religare Institutional Equity Research (Values calculated on AvgAssets)

What the above table also shows is the fact that HDFC Bank is unable to make

the best use of its higher interest earnings capacity and is losing this

advantage to higher costs (of funds, operating expenses and provisions). The

 ‘net efficiency’ for HDFC Bank has been constantly falling while it has remained

at reasonably higher levels for Axis Bank.

We believe that Axis Bank will continue to maintain its higher efficiency levels

and, therefore, feel that the valuation gap existing between HDFC Bank and 

  Axis Bank (the former being valued higher currently) should reduceconsiderably, if not reverse.

8/6/2019 Religare-hdfc Bank & Axis_bank-reinitiating Coverage-28may08

http://slidepdf.com/reader/full/religare-hdfc-bank-axisbank-reinitiating-coverage-28may08 4/17


4

INSTITUTIONAL EQUITY RESEARCH

HDFC Bank and Axis Bank – Reinitiating coverage – 27 May 2008 

HDFC Bank - CBoP merger: Stress in near term;

Concerns on speedy integration

•  On Feb 25, 2008, HDFC Bank approved the acquisition of Centurion Bank

of Punjab (CBoP)

•  CBoP shareholders will get 1 share of HDFC Bank for every 29 shares held

by them.

•  RBI approved the merger and the amalgamation; effective date May 23,

2008.

•  HDFC group, the promoters of HDFC Bank, would infuse further capital to

keep their shareholding level intact after the merger.

•  A capital dilution of around 25% would take place consequent to the

merger and preferential allotment to promoters (HDFC group).

Our discussion with HDFC Bank officials indicated that the bank is geared up to

publish merged financials for Q1 FY09 i.e. June 2008. On the subject of theimpact that this merger would most likely have on the performance of the

existing HDFC Bank’s operations and financials, the management felt that

there might be short-term hiccups like any normal reorganization would have

and that it would take at least 2 quarters to streamline all operations

effectively.  The challenge, as HDFC Bank perceives, lies in quick and 

successful integration of technology and manpower. We cannot agree more! 

When asked about the price paid for CBoP, the bank mentioned that the

merger was viewed not as much as an inorganic growth strategy as a normal

growth strategy where growth is coming few months earlier had HDFC Bank

grown organically through branch expansion. CBoP has around 395 branches.

This indicates that the price might have been not really on the ‘cheap’ or ‘fair’ side but the management has confidence in itself to reap quick longer term

benefits through the deal. 

Our estimates on the financials of the merged entity as presented in the

Annexure to this report on the financial data shows that the merger is

earnings dilutive in the near term i.e. at least until FY10. Even though the

margins of the bank might not be hit, the ROE and ROA should dip during

FY09 and FY10. A table comparing HDFC Bank with and without the merger is

presented below. It is to be noted that the CASA ratio of CBoP as of Dec 2007 

(last published reports by the company) stood at 24.5%.

Figure 3: HDFC Bank – with and without CBoPDetails Without Merger With Merger & promoter money infusion

2008-09E 2009-10E 2008-09E 2009-10E

CASA 54% 55% 49% 50%

NIM 4.75% 4.80% 4.75% 4.79%

Adj BVPS (Rs) 391 445 453 506

EPS (Rs) 62 81 58 76

CAR 12.8% 12.5% 14.1% 13.4%

ROE 17.0% 18.7% 15.9% 15.5%

ROA 1.48% 1.59% 1.42% 1.53%

Source: Company Releases, Religare Institutional Equity Research 

8/6/2019 Religare-hdfc Bank & Axis_bank-reinitiating Coverage-28may08

http://slidepdf.com/reader/full/religare-hdfc-bank-axisbank-reinitiating-coverage-28may08 5/17


5

INSTITUTIONAL EQUITY RESEARCH

HDFC Bank and Axis Bank – Reinitiating coverage – 27 May 2008 

CBoP has not announced its FY08 (and Q4) financials yet and as per the latest

Dec 2007 Q3 reports, the bank’s balance sheet size was Rs 254 bn with a CAR

of 11.5%. Of its total advances, 60% were made to the retail segment of 

which mortgage and personal loans comprised more than 50%. The quality of 

these loans and the provisioning required to be made for these loans are the

other key areas unclear from HDFC Bank’s standpoint, in terms of the merger. 

We used the last 4 quarters information as basis for our combined estimates.

Axis Bank – Does the loan portfolio carry a higher 

risk…..?

Retail assets constitute around 23% of the total loan book of Axis Bank. The

break-up of these loans is as follows:

Figure 4: Axis Bank – Retail loan portfolio

As of  Mar-08 Dec-07 Jun-07

Retail Adv (%) Retail Adv (%) Retail Adv (%)

Housing 57 58 56

Personal 16 12 13

Vehicles 16 19 23

Source: Company Releases, Religare Institutional Equity Research

The wholesale (corporate and SME) segment constitutes the balance of the

bank’s loan portfolio i.e. around 77%. The major components of the corporate

loan book are:

Figure 5: Axis Bank – Corporate loan portfolio

As of  Mar-08 Dec-07 Jun-07

Corp Adv (%) Corp Adv (%) Corp Adv (%)

Financial 10.5 9.9 15.4Gems & Jewelry 9.6  

Infra 7.9 9.3 6.3

Real Estate 7.0 8.6 9.6

Trade 6.5 7.3 2.5

Textiles 5.9 9.1 7.2

Metals 5.0 4.1

Telecom 4.7

Food 4.0 4.6 6.8

Chemicals 3.5 3.5 2.3

Source: Company Releases, Religare Institutional Equity Research

Though Axis Bank has shown considerable growth in its advances, we havesome concerns on the kind of exposures that it has taken to achieve this. Our

concerns are two-pronged:

(1) Retail - Slowdown in housing / real estate markets and the trickle down

effect that it might have in terms of slower loan growth and possible

delinquencies. 

(2) Corporate –  Around 10% exposure to ‘Gems and Jewellery’ segment that 

happened during Q4 FY08; an industry that is vulnerable to adverse

developments on the global credit crunch front and the heated ‘bullion’ 

market. The sudden emergence of such high exposure in a single segment and

that too a relatively sensitive segment is something we would like to watch

carefully to understand if the growth (also the return) is coming at the cost of 

exposure to some high risk segments. As we understand from the sector-

8/6/2019 Religare-hdfc Bank & Axis_bank-reinitiating Coverage-28may08

http://slidepdf.com/reader/full/religare-hdfc-bank-axisbank-reinitiating-coverage-28may08 6/17


6

INSTITUTIONAL EQUITY RESEARCH

HDFC Bank and Axis Bank – Reinitiating coverage – 27 May 2008 

insiders, this exposure is largely ‘unfunded’ i.e. the bank does not have any

immediate credit risk involved but they too share the same feeling with us that 

this might be a risky sector to have high exposures.

The movement of the Capital Adequacy Ratio of the bank for the past 4

quarters has been:

Jun 2007 11.5%

Sep 2007 17.6%

Dec 2007 16.9%

Mar 2008 13.7%


The decline in the CAR indicates the need for more equity infusion in the near

future to maintain its current growth rates. The bank raised Rs 45 bn equity

during Q2 FY08. Our estimates, which carry slower growth assumptions than

the current pace, indicate that the bank would need fresh capital not before

FY10. However, if the actual growth rate turns out to be faster, then the bank

might need new equity during FY10 itself.

Aggressive banks both – Axis has the edge

Both HDFC Bank and Axis Bank command the highest levels of CASA ratio in

the industry. According to our analysis, HDFC Bank’s average CASA ratio

comes to around 56% for FY08, even though, on a point-to-point basis the

CASA fell from 58% as of FY07 to 55% as of FY08. For Axis Bank, the CASA as

of FY07 was 40% and increased to 46% as of FY08 giving an average CASA of 

43%.

We expect Axis Bank to continue maintaining its CASA around 47-48% for the

next two years that will improve its average CASA to 46-47% during FY09 andFY10. Though HDFC Bank has a higher CASA ratio, the merger with CBoP that 

has a lower CASA of about 25%, would bring its low-cost-deposit ratio to

around 50% for the next two years i.e. FY09 and FY10, bringing down its

average CASA, as per our estimates. Therefore, over the next two years, Axis

Bank will carry the advantage of higher low-cost-deposit ratio to improve /

maintain its margins.

Figure 6: Avg Yield (Adv), Avg Cost (Dep) and CASA comparison

2%

5%

8%

11%

14%

2005-06 2006-07 2007-08

35%

40%

45%

50%

55%

60%

HDBK - CASA (RHS) Axis - CASA (RHS) HDBK - Adv yield

Axis - Adv y ield HDBK - Dep cos t Axis - Dep cos t

 Source: Religare Institutional Equity Research

8/6/2019 Religare-hdfc Bank & Axis_bank-reinitiating Coverage-28may08

http://slidepdf.com/reader/full/religare-hdfc-bank-axisbank-reinitiating-coverage-28may08 7/17


7

INSTITUTIONAL EQUITY RESEARCH

HDFC Bank and Axis Bank – Reinitiating coverage – 27 May 2008 

HDFC Bank has a higher average yield on its advances. This advantage comes

to the bank due to its better product-mix and superior bargaining power in

terms of pricing. However, as we mentioned in the above paragraph, the

decrease in CASA ratio and the high cost of fixed deposits that the bank

carries in its deposit portfolio will increase in the cost of total deposits and will

eat away most of this advantage during the next year. Therefore, in the near

term, we feel that Axis Bank will have an edge over HDFC Bank in terms of 

costs and margins.

Even on the operating expenses front, Axis Bank has shown greater control.

Figure 2 (ROA Analysis) shows that Axis Bank has a lower Op Expenses/Assets

and Provisions/Assets ratio compared to HDFC Bank. We expect that Axis will

continue to keep its expenses under check and improve its ROA and efficiency.

Valuation and Recommendation:

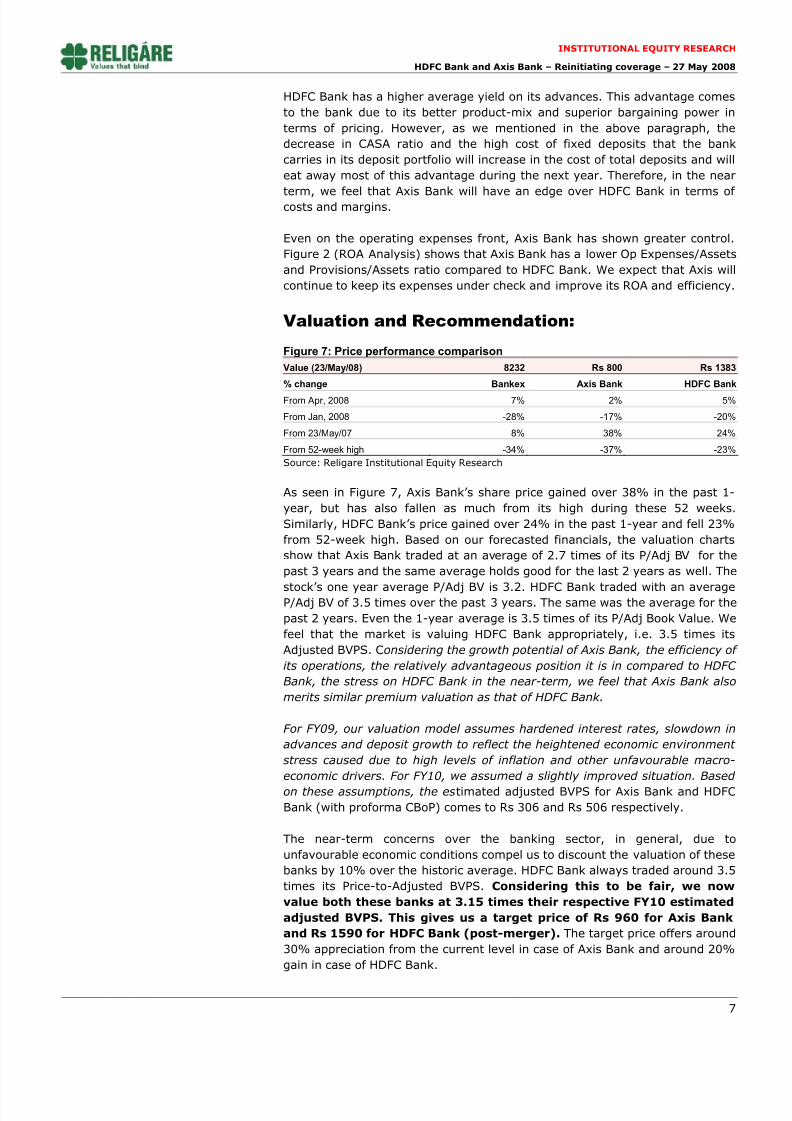
Figure 7: Price performance comparison

Value (23/May/08) 8232 Rs 800 Rs 1383

% change Bankex Axis Bank HDFC Bank

From Apr, 2008 7% 2% 5%

From Jan, 2008 -28% -17% -20%

From 23/May/07 8% 38% 24%

From 52-week high -34% -37% -23%

Source: Religare Institutional Equity Research

As seen in Figure 7, Axis Bank’s share price gained over 38% in the past 1-

year, but has also fallen as much from its high during these 52 weeks.

Similarly, HDFC Bank’s price gained over 24% in the past 1-year and fell 23%

from 52-week high. Based on our forecasted financials, the valuation charts

show that Axis Bank traded at an average of 2.7 times of its P/Adj BV for thepast 3 years and the same average holds good for the last 2 years as well. The

stock’s one year average P/Adj BV is 3.2. HDFC Bank traded with an average

P/Adj BV of 3.5 times over the past 3 years. The same was the average for the

past 2 years. Even the 1-year average is 3.5 times of its P/Adj Book Value. We

feel that the market is valuing HDFC Bank appropriately, i.e. 3.5 times its

Adjusted BVPS. Considering the growth potential of Axis Bank, the efficiency of 

its operations, the relatively advantageous position it is in compared to HDFC 

Bank, the stress on HDFC Bank in the near-term, we feel that Axis Bank also

merits similar premium valuation as that of HDFC Bank.

For FY09, our valuation model assumes hardened interest rates, slowdown in

advances and deposit growth to reflect the heightened economic environment stress caused due to high levels of inflation and other unfavourable macro-

economic drivers. For FY10, we assumed a slightly improved situation. Based 

on these assumptions, the estimated adjusted BVPS for Axis Bank and HDFC

Bank (with proforma CBoP) comes to Rs 306 and Rs 506 respectively.

The near-term concerns over the banking sector, in general, due to

unfavourable economic conditions compel us to discount the valuation of these

banks by 10% over the historic average. HDFC Bank always traded around 3.5

times its Price-to-Adjusted BVPS. Considering this to be fair, we now

value both these banks at 3.15 times their respective FY10 estimated

adjusted BVPS. This gives us a target price of Rs 960 for Axis Bank

and Rs 1590 for HDFC Bank (post-merger). The target price offers around30% appreciation from the current level in case of Axis Bank and around 20%

gain in case of HDFC Bank.

8/6/2019 Religare-hdfc Bank & Axis_bank-reinitiating Coverage-28may08

http://slidepdf.com/reader/full/religare-hdfc-bank-axisbank-reinitiating-coverage-28may08 8/17


8

INSTITUTIONAL EQUITY RESEARCH

HDFC Bank and Axis Bank – Reinitiating coverage – 27 May 2008 

Key risks to our call would be further worsening of the macro-economic

scenario (affecting both banks), adverse developments in terms of the merger

of CBoP (affecting HDFC Bank) and the quality of asset-growth (affecting Axis

Bank). Positives that would act as catalysts to the price objective would be a

favourable change in the macro-economic scenario affecting both these banks.

The sector might be under pressure in the short-term on the bourses providing

good buying opportunities in terms of these two banks at low levels. Our

recommendation is to Accumulate these strong banks to benefit from a

recovery in the sector outlook.

Figure 8: Stock price movement - graph

400

600

800

1000

1200

1400

1600

1800

2000

May-08Apr-08Feb-08Jan-08Nov-07Oct-07Aug-07Jul-07Jun-07

(Rs)

6000

7000

8000

9000

10000

11000

12000

13000

Axis (RHS) HDBK (RHS) Bankex

 Source: Religare Institutional Equity Research

8/6/2019 Religare-hdfc Bank & Axis_bank-reinitiating Coverage-28may08

http://slidepdf.com/reader/full/religare-hdfc-bank-axisbank-reinitiating-coverage-28may08 9/17


9

INSTITUTIONAL EQUITY RESEARCH

HDFC Bank and Axis Bank – Reinitiating coverage – 27 May 2008 

Stock performanceHDFC Bank

Absolute Perf. From Apr 04

250

750

1,250

1,750

2,250

Apr-04 Apr-05 Apr-06 Apr-07 Apr-08

Sensex HDFC Bank BSE Bank Index


Relative Perf. From Apr 04

60

70

80

90

100

110

120

130

140

150

Apr-04 Apr-05 Apr-06 Apr-07 Apr-08

Sensex HDFC Bank BSE Bank Index

 Relative Perf. From Apr 05 to Mar 06

70

80

90

100

110

120

Apr-05 Jun-05 Sep-05 Dec-05 Mar-06

Sensex HDFC Bank BSE Bank Index


Relative Perf. From Apr 06 to Mar 07

80

90

100

110

120

130

Apr-06 Jun-06 Sep-06 Dec-06 Mar-07

Sensex HDFC Bank BSE Bank Index

 Relative Perf. From Apr 07 to Mar 08

95

100

105

110

115

120

125

130135

Apr-07 Jun-07 Sep-07 Dec-07 Mar-08

Sensex HDFC Bank BSE Bank Index


Relative Perf. From Apr 08

95

97

99

101

103

105

107

109

1-Apr 16-Apr 1-May 16-May

Sensex HDFC Bank BSE Bank Index

Source: Bloomberg, Religare Institutional Equity Research

8/6/2019 Religare-hdfc Bank & Axis_bank-reinitiating Coverage-28may08

http://slidepdf.com/reader/full/religare-hdfc-bank-axisbank-reinitiating-coverage-28may08 10/17


10

INSTITUTIONAL EQUITY RESEARCH

HDFC Bank and Axis Bank – Reinitiating coverage – 27 May 2008 

12 month forward rolling band chartsHDFC Bank

P/E Band

0

500

1,000

1,500

2,000

2,500

Apr-02 Apr-03 Apr-04 Apr-05 Apr-06 Apr-07 Apr-08

(Rs)

30x

25x

20x

15x

35x


P/ABV Band

0

500

1,000

1,500

2,000

2,500

A pr -02 A pr -03 A pr -04 A pr -05 A pr -06 A pr -07 A pr -08

(Rs)5x

4x

3x

2x

Source: Bloomberg, Religare Institutional Equity Research

8/6/2019 Religare-hdfc Bank & Axis_bank-reinitiating Coverage-28may08

http://slidepdf.com/reader/full/religare-hdfc-bank-axisbank-reinitiating-coverage-28may08 11/17

8/6/2019 Religare-hdfc Bank & Axis_bank-reinitiating Coverage-28may08

http://slidepdf.com/reader/full/religare-hdfc-bank-axisbank-reinitiating-coverage-28may08 12/17


12

INSTITUTIONAL EQUITY RESEARCH

HDFC Bank and Axis Bank – Reinitiating coverage – 27 May 2008 

Vidur Pendharkar Head of Technical ResearchInstitutional Businessvidur.p@rel igare.in+91 022-66550109

Technical View

HDFC Bank Close Price Rs.1332.70

The monthly candlestick chart of HDFC Bank shows that it is still in a major

uptrend. In fact, it is oscillating within an “upward sloping channel” (pink

lines) as depicted in the chart above. The monthly averages are still positively

phased and are pegged at Rs.1371 (12 months ema) and Rs.1169 (24 months

ema), respectively.

The support line of the channel is pegged at Rs.1250 for this month and would

roughly increase by Rs.50 per month. A break of this channel would result in

the uptrend getting over and it going into a sideways trend or a downtrend.

Long term players should keep a strict stop loss below Rs.1150 (in close) on

longs in this stock. One could see a recovery to Rs.1458 or at best the

Rs.1550-1600 area. Unless and until this is taken out one could see a broad

consolidation taking place in this stock. One can hold at current levels.

8/6/2019 Religare-hdfc Bank & Axis_bank-reinitiating Coverage-28may08

http://slidepdf.com/reader/full/religare-hdfc-bank-axisbank-reinitiating-coverage-28may08 13/17

8/6/2019 Religare-hdfc Bank & Axis_bank-reinitiating Coverage-28may08

http://slidepdf.com/reader/full/religare-hdfc-bank-axisbank-reinitiating-coverage-28may08 14/17


14

INSTITUTIONAL EQUITY RESEARCH

HDFC Bank and Axis Bank – Reinitiating coverage – 27 May 2008 

12 month forward rolling band chartsAxis Bank

P/E Band

0

200

400

600

800

1,000

1,200

1,400

1,600

Apr-02 Apr-03 Apr-04 Apr-05 Apr-06 Apr-07 Apr-08

(Rs)28x

21x

14x

7x


P/ABV Band

0

200

400

600

800

1,000

1,200

1,400

A pr -02 A pr -03 A pr -04 A pr -05 A pr -06 A pr -07 A pr -08

(Rs)4.5x

3.5x

2.5x

1.5x

Source: Bloomberg, Religare Institutional Equity Research

8/6/2019 Religare-hdfc Bank & Axis_bank-reinitiating Coverage-28may08

http://slidepdf.com/reader/full/religare-hdfc-bank-axisbank-reinitiating-coverage-28may08 15/17


15

INSTITUTIONAL EQUITY RESEARCH

HDFC Bank and Axis Bank – Reinitiating coverage – 27 May 2008 

Axis Bank - Financials

Income statement (Rs mn) 

 Y/E, 31st March  FY06 FY07 FY08 FY09E FY10E

Int Income

Int on adv 15280 27029 47457 69401 88919

Tol Int Inc 28888 45604 70053 97983 120840


Int Exp

Int on dep 15517 24808 37425 50486 61642

Tot Int exp 18106 29933 44200 59583 73901


Net Int Inc 10782 15671 25854 38399 46938


Tot Other Inc 7296 10101 17955 24587 33410


Op Exp

Emp Cost 2402 3814 6703 9048 11763

Total Op exp 8141 12146 21549 29834 38784

 Total Prov 5087 7036 11549 16133 20381

Net profit 4851 6590 10710 17019 21183


Balance Sheet (Rs mn) 

  Y/E, 31st March FY06 FY07 FY08 FY09E FY10E

Liabilities

Capital 2787 2816 3577 3577 3577

Reserves 25935 31116 80918 94589 110750

Net Worth 28722 33932 84495 98166 114327

Deposits 401135 587856 876260 1139138 1423923

Borrowings & Other Liabs 67454 110784 135025 179774 238057

Total 497311 732572 1095780 1417077 1776307

Assets

Cash & Bal with RBI / banks 36418 69183 119171 125244 126729

Investments 215274 268972 337050 434390 502813

Advances 223142 368765 596610 805424 1047051

Fixed and Other Assets 22477 25653 42949 52020 99713

Total 497311 732572 1095780 1417077 1776307 

Ratios

  Y/E, 31st March FY06 FY07 FY08 FY09E FY10E

No. of Shares 279 282 358 358 358

Earnings Per Share (Rs.) 17 23 30 48 59

Book Value (Rs.) 103 120 236 274 320Adjusted Book Value (Rs.) 97 112 229 263 306

Dividend Per Share (Rs.) 4 4 6 8 12

Valuation Ratios (x)

Price/Earnings 43 32 25 16 12

Price/ BV 7.2 6.1 3.1 2.7 2.3

Price/Adjusted BV 7.6 6.6 3.2 2.8 2.4

Performance Ratios (%)

Average Yield on funds 7.6 8.4 8.9 9.0 8.7

Average cost of Funds 4.6 5.4 5.4 5.3 5.2

Interest Spread 3.0 3.0 3.5 3.7 3.5

Net Interest Margin 2.9 2.9 3.3 3.5 3.4

 Yields (%)Average Yield on Adv. 8.1 9.1 9.8 9.9 9.6

Average Yield on Invts 7.2 7.2 6.9 7.0 6.6

Average Cost of Deposits 4.3 5.0 5.1 5.0 4.8

Earnings Quality (%)

Net Int. Inc/Total Income 60 61 59 61 58

Other Income/Opr. Profit 73 74 81 74 80

Cost/Income 45 47 49 47 48

Return on Avg. Net Worth 18.4 21.0 18.1 18.6 19.9

Return on Average Assets 1.1 1.1 1.2 1.4 1.3

Asset Quality (%)

Capital Adequacy Ratio 11.1 11.6 13.7 12.4 12.0

Gr. NPA/Gr. Advances 1.66 1.13 0.83 0.90 0.93

Net NPA/Net Advances 0.75 0.62 0.42 0.50 0.47

Coverage Ratio% 55 45 50 45 50

Credit / Deposit Ratio 56 63 68 71 74

Incremental C/D Ratio 80 78 79 79 85

Investment / Assets 43 37 31 31 28

Growth Rates (%)

Advances 43 65 62 35 30

Deposits 26 47 49 30 25

Interest Income 50 58 54 40 23

Interest Expended 52 65 48 35 24

Net interest Income 47 45 65 49 22

Other Income 75 38 78 37 36

Operating Profit 76 37 63 49 25

EPS 76 37 63 49 25

Net Profit 42 34 28 59 24 

8/6/2019 Religare-hdfc Bank & Axis_bank-reinitiating Coverage-28may08

http://slidepdf.com/reader/full/religare-hdfc-bank-axisbank-reinitiating-coverage-28may08 16/17


16

INSTITUTIONAL EQUITY RESEARCH

HDFC Bank and Axis Bank – Reinitiating coverage – 27 May 2008 

Vidur Pendharkar Head of Technical ResearchInstitutional Businessvidur.p@rel igare.in+91 022-66550109

Technical View

AXIS Bank Close Price Rs.740.40

The monthly candlestick chart of Axis Bank shows that it is still in a major

uptrend. The monthly averages are still positively phased and are pegged at

Rs.780.40 (12 months ema) and Rs.605.85 (24 months ema), respectively.

The support line (trendline in green) is pegged at Rs.635 for this month andwould roughly increase by Rs.25 per month. A break of this trendline would

result in the uptrend getting over and it going into a sideways trend or a

downtrend. Long term players should keep a strict stop loss below this

trendline. The oscillators are exhibiting signs of weakness and any recovery

will meet with some profit-taking at higher levels. Looking at the overall

picture Axis Bank faces stiff resistance at Rs.926 and in an optimistic scenario

Rs.1040-1075 area in the months ahead. Support is pegged from the recent

low of Rs.692 and further down at Rs.635. One can hold at current levels and

use rallies to the above mentioned resistance levels for booking profits.

8/6/2019 Religare-hdfc Bank & Axis_bank-reinitiating Coverage-28may08

http://slidepdf.com/reader/full/religare-hdfc-bank-axisbank-reinitiating-coverage-28may08 17/17


17

INSTITUTIONAL EQUITY RESEARCH

HDFC Bank and Axis Bank – Reinitiating coverage – 27 May 2008 

Religare Securities Ltd. Taj Building, 210, D.N. Road, Mumbai - 400001 For inquiries contact:

Email: [email protected]

Phone: 6655 0000

DISCLAIMER: Religare Securities Limited (Religare) has two independent equity research groups: Institutional Equities (Institutional Equity Research) andPriority Client Group (Religare Research). Religare Institutional Equity Research is aimed to service the institutional clients of Religare Securities Limitedincluding the Portfolio Management Services of Religare whereas Religare Research is published with a view to service all segments of clients including Retail,HNIs and Institutional clients and PMS.

This document has been prepared by Religare Securities Limited – Institutional Equities. Affiliates of Religare- Institutional Equities may have issued other reports that are contrary with and reach different conclusion from the information presented in this report. The views and opinions expressed in this documentmay or may not match or may be contrary with the views, estimates, rating and target price of the Priority Client Group of Religare Securities Limited.

We are not soliciting any action based upon this material. This report is not to be construed as an offer to sell or the solicitation of an offer to buy any security in

any jurisdiction where such an offer or solicitation would be illegal. It is for the general information of clients of Religare-Institutional Business. It does notconstitute a personal recommendation or take into account the particular investment objectives, financial situations, or needs of individual clients Religare-Institutional will not treat recipients as customers by virtue of their receiving this report. We have reviewed the report, and in so far as it includes current or historical information, it is believed to be reliable. It should be noted that the information contained herein is from publicly available data or other sources believedto be reliable. Neither Religare, nor any person connected with it, accepts any liability arising from the use of this document.

This document is prepared for assistance only and is not intended to be and must not alone be taken as the basis for any investment decision. The investmentdiscussed or views expressed may not be suitable for all investors. The user assumes the entire risk of any use made of this information. The recipients of thismaterial should rely on their own investigations and take their own professional advice. Each recipient of this document should make such investigations as itdeems necessary to arrive at an independent evaluation of an investment in the securities of companies referred to in this document (including the merits andrisks involved), and should consult its own advisors to determine the merits and risks of such an investment. Price and value of the investments referred to in thismaterial may go up or down. Past performance is not a guide for future performance. Certain transactions -including those involving futures, options and other derivatives as well as non investment grade securities - involve substantial risk and are not suitable for all investors. Reports based on technical analysis centerson studying charts of a stock's price movement and trading volume, as opposed to focusing on a company's fundamentals and as such, may not match with areport on a company's fundamentals.

Opinions expressed are our current opinions as of the date appearing on this material only. We do not undertake to advise you as to any change of our views

expressed in this document. While we would endeavor to update the information herein on a reasonable basis, Religare, its subsidiaries and associatedcompanies, their directors and employees are under no obligation to update or keep the information current. Also there may be regulatory, compliance, or other reasons that may prevent Religare and affiliates from doing so. Prospective investors and others are cautioned that any forward-looking statements are notpredictions and may be subject to change without notice.

This report is not directed or intended for distribution to, or use by, any person or entity who is a citizen or resident of or located in any locality, state, country or other jurisdiction, where such distribution, publication, availability or use would be contrary to law, regulation or which would subject Religare and affiliates to anyregistration or licensing requirement within such jurisdiction. The securities described herein may or may not be eligible for sale in all jurisdictions or to certaincategory of investors. Persons in whose possession this document may come are required to inform themselves of and to observe such restriction.

Religare and its affiliates, officers, directors, and employees may: (a) from time to time, have long or short positions in, and buy or sell the securities thereof, of company (ies) mentioned herein or (b) be engaged in any other transaction involving such securities and earn brokerage or other compensation or act as amarket maker in the financial instruments of the company (ies) discussed herein or act as advisor or lender / borrower to such company (ies) or have other potential conflict of interest with respect to any recommendation and related information and opinions. Without limiting any of the foregoing, in no event shallReligare, any of its affiliates or any third party involved in, or related to, computing or compiling the information have any liability for any damages of any kind.

Copy right in this document vests exclusively with Religare. This information should not be reproduced or redistributed or passed on directly or indirectly inany form to any other person or published, copied, in whole or in part, for any purpose, without prior written permission from Religare. We do not guarantee theintegrity of any e-mails or attached files and are not responsible for any changes made to them by any other person.

The analyst for this report certifies that all of the views expressed in this report accurately reflect his or her personal views about the subject company or companies and its or their securities, and no part of his or her compensation was, is or will be, directly or indirectly related to specific recommendations or viewsexpressed in this report. Analyst’s holding in the stocks mentioned in the report: NIL 

Rating definition

Buy : > 15% returns relative to Sensex Accumulate : +5 to +15% returns relative to Sensex

Sell : > (-)15% returns relative to Sensex Reduce : (-) 5 to (-) 15% returns relative to Sensex 

Hold : Upto + / (-) 5% returns relative to Sensex 


Recommended