55


Religious Communities in India: A Development Profile
Amit Thorat
Religions and Development Research Programme
Working Paper Series
Indian Institute of Dalit Studies
New Delhi
2011

1
Religious Communities in India: A Development Profile
Amit Thorat*
1. Introduction
The objective of this paper is to look at various religious groups across India and
observe the level of development that each group has reached. The intention is to
compare and contrast the differences in the level and nature of development,
across different religious groups. Subsequently, an attempt is made to explain
why these differences exist and what are the possible factors that might be
influencing group-specific levels of well-being. An attempt is also made to look at
how religion might be instrumental, if at all, in deciding the well-being of people
or, as economists would like to say, the standard of living. To measure the well-
being, a set of few economic, social and health variables have been chosen as
indicators and the corresponding data has been compared across religions.
The paper begins with an observation and comparison of group demographics
and composition, such as aggregate population, male-female ratio, rural-urban
break-up, literacy level, etc., and follows by examining the economic
characteristic of groups, such as poverty level, employment rate, workforce
participation rate and land ownership patterns amongst others. Finally, the
health status of women and children across religious groups based on a wide
range of health indicators is presented.
2. Demographic and Group Characteristics
2.1. Population
According to rural-urban and male-female population break-ups across religious
communities in India, based on the 2001 census data, the Hindus are clearly the
* Amit Thorat is with National Council of Applied Economic Research (NCAER) New Delhi
2
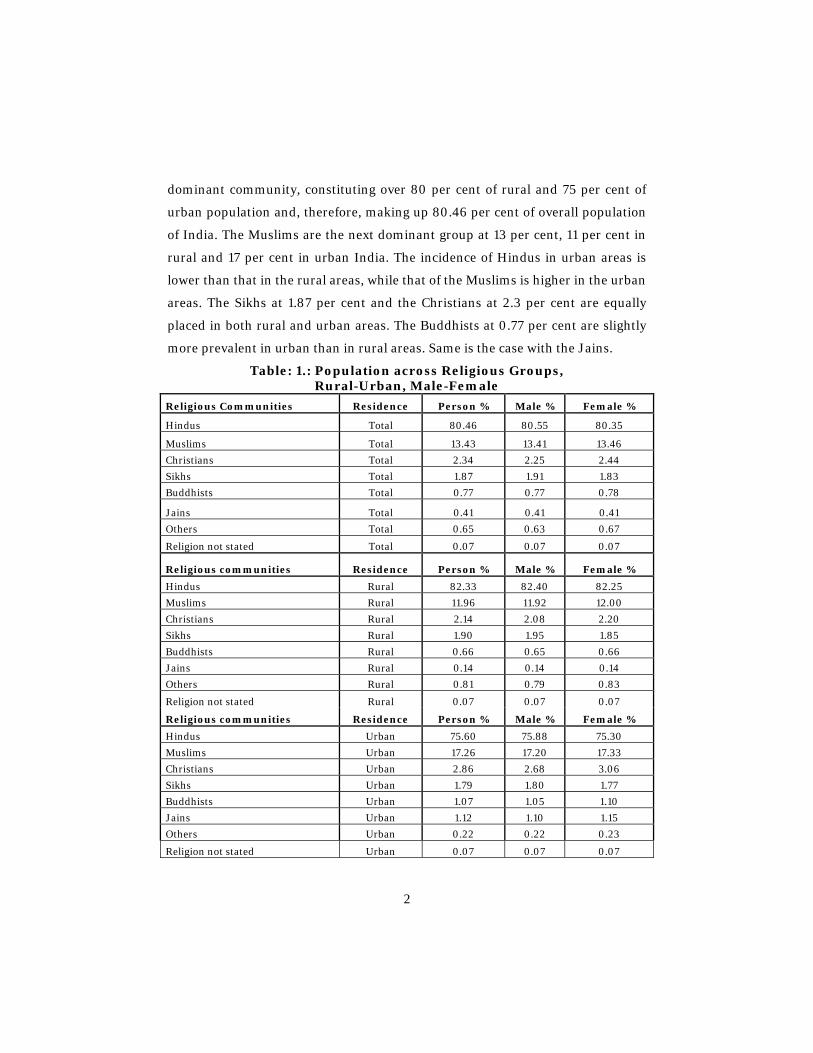
dominant community, constituting over 80 per cent of rural and 75 per cent of
urban population and, therefore, making up 80.46 per cent of overall population
of India. The Muslims are the next dominant group at 13 per cent, 11 per cent in
rural and 17 per cent in urban India. The incidence of Hindus in urban areas is
lower than that in the rural areas, while that of the Muslims is higher in the urban
areas. The Sikhs at 1.87 per cent and the Christians at 2.3 per cent are equally
placed in both rural and urban areas. The Buddhists at 0.77 per cent are slightly
more prevalent in urban than in rural areas. Same is the case with the Jains.
Table: 1.: Population across Religious Groups, Rural-Urban, Male-Female
Religious Communities Residence Person % Male % Female %
Hindus Total 80.46 80.55 80.35
Muslims Total 13.43 13.41 13.46
Christians Total 2.34 2.25 2.44
Sikhs Total 1.87 1.91 1.83
Buddhists Total 0.77 0.77 0.78
Jains Total 0.41 0.41 0.41
Others Total 0.65 0.63 0.67
Religion not stated Total 0.07 0.07 0.07
Religious communities Residence Person % Male % Female %
Hindus Rural 82.33 82.40 82.25
Muslims Rural 11.96 11.92 12.00
Christians Rural 2.14 2.08 2.20
Sikhs Rural 1.90 1.95 1.85
Buddhists Rural 0.66 0.65 0.66
Jains Rural 0.14 0.14 0.14
Others Rural 0.81 0.79 0.83
Religion not stated Rural 0.07 0.07 0.07
Religious communities Residence Person % Male % Female %
Hindus Urban 75.60 75.88 75.30
Muslims Urban 17.26 17.20 17.33
Christians Urban 2.86 2.68 3.06
Sikhs Urban 1.79 1.80 1.77
Buddhists Urban 1.07 1.05 1.10
Jains Urban 1.12 1.10 1.15
Others Urban 0.22 0.22 0.23
Religion not stated Urban 0.07 0.07 0.07

3
Across the top five religious groups, the distribution of the male and female
population corresponds more or less to the overall population distribution, across
both rural and urban areas. Table 1 shows the absolute number of males and
females falling within each religious group. This shows that even the religious
minority groups are large enough and are sizable in their own right.
Table: 2: Populations Count across Religious Groups by Sex, 2004/05
Religious Communities
Rural Urban Total
Male Female Male Female Male Female
Hindus 314767333.00 298807825.00 101487198.00 91403149.00 416254531.00 390210974.00
Muslims 42213658.00 41242227.00 21238197.00 19532451.00 63451855.00 60774678.00
Christians 7155423.00 7438422.00 2860791.00 3076122.00 10016214.00 10514544.00
Sikhs 7469927.00 6782792.00 2203618.00 1969663.00 9673545.00 8752455.00
Jains 332416.00 334458.00 1092354.00 998139.00 1424770.00 1332597.00
Buddhists 2086166.00 1862437.00 1144056.00 1157972.00 3230222.00 3020409.00
Others 1212530.00 1271548.00 104146.00 122140.00 1316676.00 1393688.00
Total 375267114.00 357768803.00 130192945.00 118332021.00 505460059.00 476100824.00
2.2. Literacy
Table 3 looks at the literacy rates among the various religious communities in
India and shows the rural-urban and male-female break-up in terms of overall
literacy. A discussion of the trends in literacy as revealed by this data follows
below.
Table 3: Literacy Rates among Religious Communities in India: Rural-Urban and Male-Female:
Religious (Total) Communities Person Male Female
Hindus 54.92 64.22 44.92
Muslims 48.05 54.99 40.63
Christians 69.45 72.76 66.17
Sikhs 60.56 65.03 55.56
Buddhists 62.16 71.05 52.83
Jains 84.09 86.67 81.35
Others 38.57 49.78 27.27
Religion not stated 52.09 60.58 42.66
All Religions 54.51 63.24 45.15
4
Source: Census of India, 2001
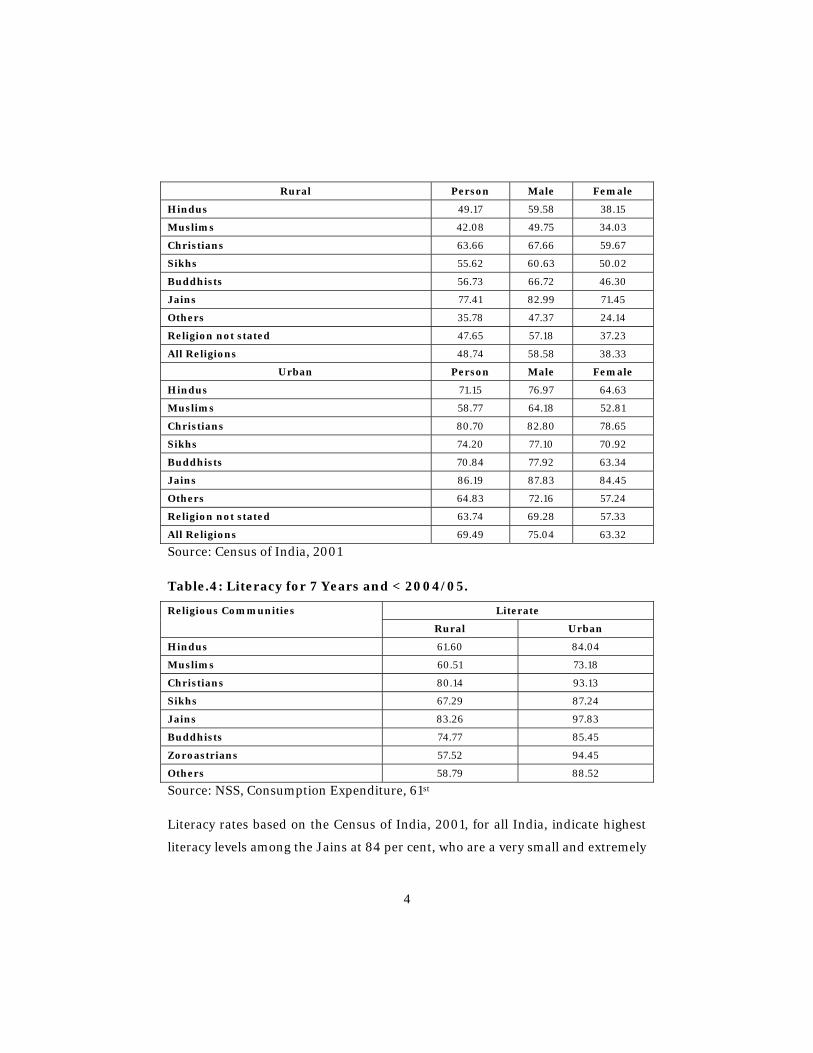
Table.4: Literacy for 7 Years and < 2004/05.
Religious Communities
Literate
Rural Urban
Hindus 61.60 84.04
Muslims 60.51 73.18
Christians 80.14 93.13
Sikhs 67.29 87.24
Jains 83.26 97.83
Buddhists 74.77 85.45
Zoroastrians 57.52 94.45
Others 58.79 88.52
Source: NSS, Consumption Expenditure, 61st
Literacy rates based on the Census of India, 2001, for all India, indicate highest
literacy levels among the Jains at 84 per cent, who are a very small and extremely
Rural Person Male Female
Hindus 49.17 59.58 38.15
Muslims 42.08 49.75 34.03
Christians 63.66 67.66 59.67
Sikhs 55.62 60.63 50.02
Buddhists 56.73 66.72 46.30
Jains 77.41 82.99 71.45
Others 35.78 47.37 24.14
Religion not stated 47.65 57.18 37.23
All Religions 48.74 58.58 38.33
Urban Person Male Female
Hindus 71.15 76.97 64.63
Muslims 58.77 64.18 52.81
Christians 80.70 82.80 78.65
Sikhs 74.20 77.10 70.92
Buddhists 70.84 77.92 63.34
Jains 86.19 87.83 84.45
Others 64.83 72.16 57.24
Religion not stated 63.74 69.28 57.33
All Religions 69.49 75.04 63.32

5
prosperous business community in India. They are followed by the Christians at
nearly 70 per cent, who have benefited immensely from Western style missionary
schools and colleges and other educational institutions. Next are the Sikhs and
the Buddhists at 60 per cent and 62 per cent respectively. The Sikhs generally are
a prosperous community, who can provide education to their children if so
desired; however, being involved in farming and dairy in rural areas and
businesses in urban areas, many of them may choose to simply concentrate on
their traditional work. The Buddhists (except for the tribal convert in the north-
east), on the other hand, have traditionally been excluded from education and
economic ownership of assets of any form. Thus in the post-independent India,
education has been their only real source of emancipation and progress. The
majority of the Hindus follow next at 54 per cent while the Muslims have the
lowest rates at 48 per cent. This could be also because a majority of them are
educated at the Madarsas than formal schools.
A similar pattern is observed across the rural landscape. In fact, nearly 75 per
cent of the country’s population being rural, this obviously affects the overall
average which resembles it more closely. The urban story is somewhat different.
The Jains again show highest literacy rates and are followed by the Christians.
However, it’s the prosperous Sikhs in urban areas who marginally outscore the
traditionally deprived Buddhists. Even the Hindus outscore them by 1percentage
point margin. If we look at the latest estimates of literacy based on the NSSO’s
Consumption Expenditure Survey (61st round, 2004/2005), though these two
data sets are not comparable strictly, we find that the pattern of literacy rates is
the same across both data sets, that is the relative ranking of religious groups is
the same. Also rates have changed over the intervening five years. Comparing the
NSS data for 2004/5 with Census data for 2001, we find literacy rates have risen
for the Buddhist and the Muslims by 12 per cent,and the Christians by around 10
per cent. For the Hindus, there is a rise of 7 per cent, with the Jains remaining
nearly at the same high. Again one needs to remember here that the rates are not

6
strictly comparable as the census is a house-to-house survey while the NSS is a
sample based one.
2.3. Household Size
A look at the average household size of families across religious communities
indicates that there is not much difference in average household size across rural
and urban regions. The exception here is the rural Zoroastrians, who being a tiny
minority have historically married within their own community as well as
families and probably live in large joint families, thus showing a large average of
eight members per family. Additionally very few such families would be found in
the rural areas, as most are well educated and prefer urban settings, thus
increasing the likelihood of a few large families in rural areas. Of the remaining
religious groups in rural areas, the Muslims, Sikhs, Hindus, Buddhists and the
others share an average household size of five members. While the Christians and
the Jains, who have the highest literacy levels, show the lowest averages.
Table 5: Average Household Size of Different Religious Communities as They Vary in Rural and Urban Areas
Religious Communities Rural Household Size Urban Household Size
Buddhists 5 5
Christians 4 4
Hindus 5 4
Jains 4 5
Muslims 5 5
Others 5 4
Sikhs 5 5
Zoroastrians 8 3
Source: NSSO, 61st Consumption Expenditure Round
7
In urban regions, unlike the rural, the Zoroastrians have the lowest average
family size of three members. Next, the Christians with an average of three are
joined here by the Hindus and the others. The rest show an average size of five
members.
3.. Education - School Attendance (NSS, 61st Round, 2004/2005)
This section deals with the education standards and rate of school enrolment
across religious groups. First, we observe school attendance (largely public
schools) of boys and girls in the 6-14 age group,, across the religious
communities, at all India level. In this group for males as well as females, the
Jains register the highest rate of enrolment at nearly 55 per cent and 57 per cent
respectively. They are followed by the Christians and the Buddhists. It is
interesting to see how minor religious communities are performing better than
the religious majors in terms of school attendance. This is most definitely an
indication of a progressive mind set and reflects a perception that education is a
sure means to prosperity, in the context of their minority status and low
bargaining power. Next come the Sikhs and the Hindus. The lowest enrolment
rates are seen for the Muslims and the Zoroastrians. Low enrolment rate for the
Zoroastrians is surprising as this community is known for being highly educated.
However, being a closed community, this could indicate that majority of them
obtained education probably at home through private education. Again the
Muslims could be choosing Madarsa education† that is primarily language
(Persian, Urdu, etc.,) and religious studies (the Koran). Female enrolment rates
are seen to follow the same religious pattern as that for the male counterparts but
are lower across all the groups, except for the Jains, where they enjoy a 3 per cent
† Madrasa is an institution of learning, where Islamic sciences including literary and
philosophical ones are taught" (Encyclopaedia of Islam - Leiden E.J.Brill). Avowed aim of madrasa education is to inculcate the belief and practice of Islam among its followers and guide them to follow Kuran and traditions of the Prophet. The foundation of Madrasa education is therefore, basically standing on two pillars of Quran (Collection of God's revelations to Prophet Mohammad) and Sunna (Tradition of Prophet Mohammad).

8
higher enrolment rate. This could be as males are expected to join the family
business quite early, while females could go on receiving higher levels of
education. For the rest, the difference in enrolment rate between the males and
the females range from 3 per cent to 7 per cent .
Table 6: Percentage of School Attendance of Males and Females between the Years 6-14 across Various Religious Communities
Religious
Communities
Males (6-14 years) Females (6-14 years)
Not attending Attending Not attending Attending
Jains 45.32 54.68 42.80 57.20
Christians 47.78 52.22 52.86 47.14
Buddhists 50.18 49.82 53.57 46.43
Sikhs 52.17 47.83 55.66 44.34
Hindus 53.24 46.76 60.26 39.74
Others 56.90 43.10 60.70 39.30
Muslims 57.73 42.27 62.48 37.52
Zoroastrians 58.45 41.55 65.69 34.31
Source: NSSO, 61st Employment/Unemployment Round
3.1. Percentage of Boys and Girls Enrolled in Primary, Secondary and Tertiary Education
Moving on to attendance across schooling levels, we find that religious groups
which registered low and very low overall enrolment rates above, show the
highest rates at the primary level. The enrolment pattern at primary level is
exactly the opposite of the enrolment pattern we observed in the table above. The
rates vary over a range of 15 per cent, from the lowest to the highest, for the
primary level, for the males across groups.
9
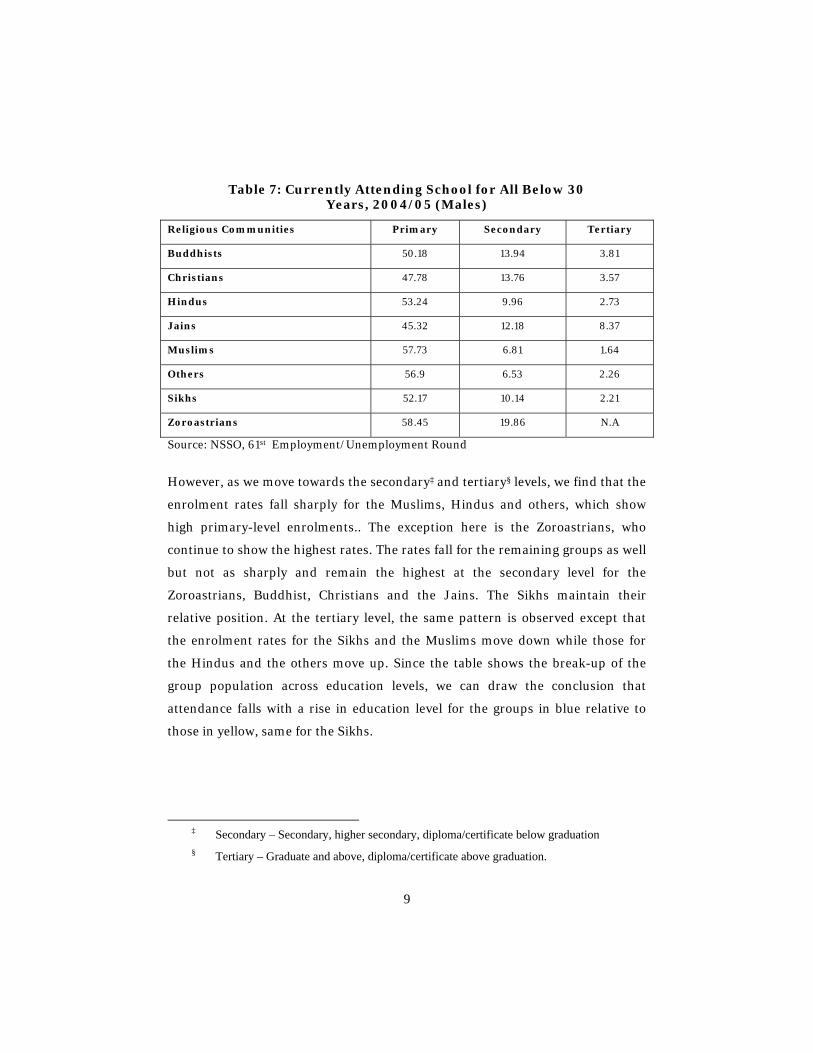
Table 7: Currently Attending School for All Below 30 Years, 2004/05 (Males)
Religious Communities Primary Secondary Tertiary
Buddhists 50.18 13.94 3.81
Christians 47.78 13.76 3.57
Hindus 53.24 9.96 2.73
Jains 45.32 12.18 8.37
Muslims 57.73 6.81 1.64
Others 56.9 6.53 2.26
Sikhs 52.17 10.14 2.21
Zoroastrians 58.45 19.86 N.A
Source: NSSO, 61st Employment/Unemployment Round
However, as we move towards the secondary‡ and tertiary§ levels, we find that the
enrolment rates fall sharply for the Muslims, Hindus and others, which show
high primary-level enrolments.. The exception here is the Zoroastrians, who
continue to show the highest rates. The rates fall for the remaining groups as well
but not as sharply and remain the highest at the secondary level for the
Zoroastrians, Buddhist, Christians and the Jains. The Sikhs maintain their
relative position. At the tertiary level, the same pattern is observed except that
the enrolment rates for the Sikhs and the Muslims move down while those for
the Hindus and the others move up. Since the table shows the break-up of the
group population across education levels, we can draw the conclusion that
attendance falls with a rise in education level for the groups in blue relative to
those in yellow, same for the Sikhs.
‡ Secondary – Secondary, higher secondary, diploma/certificate below graduation § Tertiary – Graduate and above, diploma/certificate above graduation.

10
Table 8: Currently Attending School for All Below 30 Years, 2004/05 (Females)
Religious Communities Primary Secondary Tertiary
Buddhists 15.81 11.59 3.56
Christians 17.01 11.81 4.13
Hindus 19.62 7.05 1.98
Jains 21.03 16.72 4.04
Muslims 19.88 5.46 1.09
Others 18.14 6.06 1.28
Sikhs 19.06 9.09 3.10
Zoroastrians N.A 8.27 10.24
Source: NSSO, 61st Employment/Unemployment Round
Unlike the figures for the males, the difference in the primary-level enrolment
rates for the female across the groups ranges over just 6 per cent. Enrolment
rates of female are quite similar for most groups, namely the Jains, Muslims,
Hindus, Sikhs and others. At the primary level, the enrolment rate of female is
similar to that of males except that the Jain women show high enrolment rates
even at the primary level. At secondary level, we see exactly the same pattern as
for the males except that the Jain women have displaced their Buddhist
counterparts to register highest rates and the Zoroastrians have fallen below the
Sikhs. At the tertiary level, we observe the same pattern except the Zoroastrians
who show the highest rates again and the Christians replace the Jains. On the
whole we observe the same pattern, the minority religious groups are valuing and
participating in higher education.

11
Table 9: Percentage of Adults Enrolled in Primary, Secondary, Higher Secondary, Graduation and Diploma Education (Males)
Religious Communities
Primary Middle Secondary & Higher
Secondary
Graduate & Above
Diploma/Certificate
(below graduate)
Diploma/Certificate
(above graduate)
Buddhists 0.02 2.11 15.00 6.63 1.20 1.37
Christians 0.21 1.22 13.47 7.24 4.28 1.05
Hindus 0.20 1.37 12.06 5.84 1.44 0.93
Jains NA NA 10.66 16.81 2.98 1.27
Muslims 0.37 1.60 9.80 3.82 0.77 0.65
Others 0.35 1.71 11.22 5.79 1.36 0.03
Sikhs 0.25 1.33 13.15 4.34 1.65 0.85
Zoroastrians NA NA 7.63 NA NA NA
Adult education (18 years and above) for the males, shows that nearly 70 per cent
(Jains) and as high as 92 per cent (Zoroastrians) are not enrolled for any form of
learning and can be assumed to be engaged in income generating activities.
Looking at the major religious groups, we find that the Hindus have low levels of
primary education. As the levels rise, they show an improvement of one position
up and maintain that steadily across all the levels. The Muslims do well in the
beginning, by registering the highest enrolment rate at the primary level and the
third highest at the middle. However, they then slip to the near bottom, middle
level onwards and remain there throughout. Thus formal mainstream education
seems to be a big drawback amongst the Muslims. The Buddhists have more of
their adults enrolled in secondary and higher secondary than any other group.
They constitute the second highest population in graduation and above, after the
Jains, who have more adults enrolled for graduation and above than any other
group. For the diplomas below graduation, the Christians have the highest
incidence than any other group followed by the Jains. In case of diplomas above
graduation level, the Buddhists, Jains and the Christians have the highest rates
respectively.
12
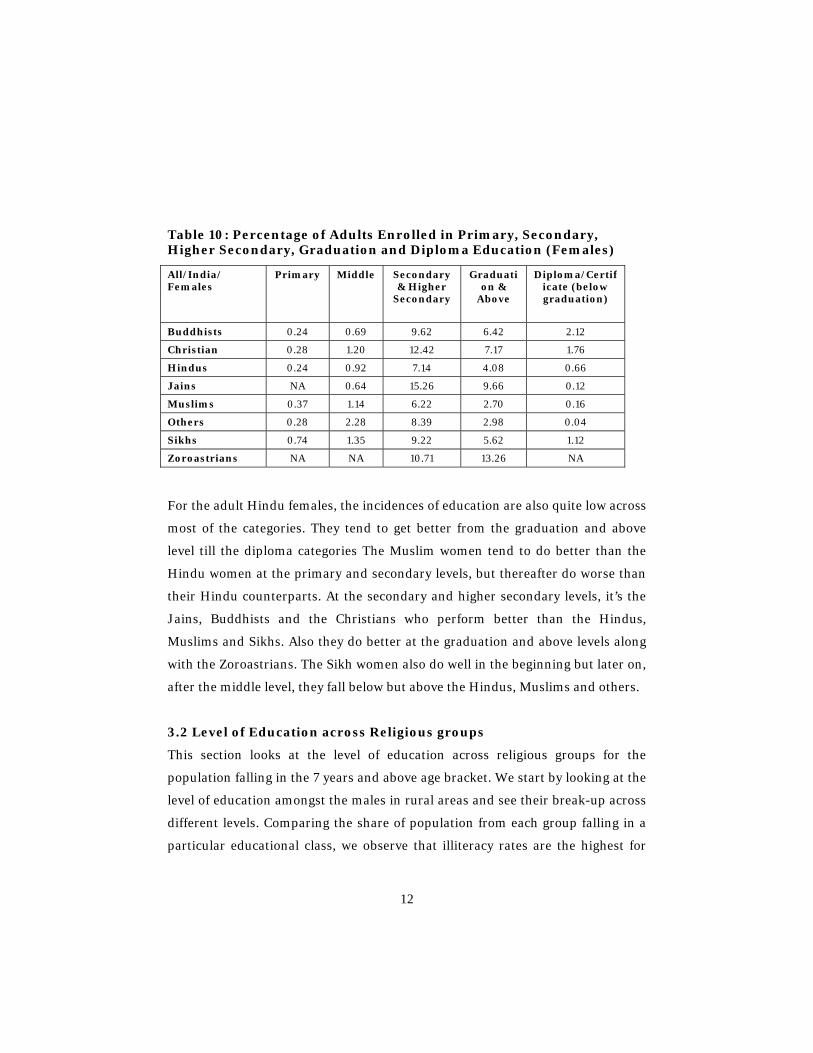
Table 10: Percentage of Adults Enrolled in Primary, Secondary, Higher Secondary, Graduation and Diploma Education (Females)
All/India/ Females
Primary Middle Secondary & Higher
Secondary
Graduation &
Above
Diploma/Certificate (below graduation)
Buddhists 0.24 0.69 9.62 6.42 2.12
Christian 0.28 1.20 12.42 7.17 1.76
Hindus 0.24 0.92 7.14 4.08 0.66
Jains NA 0.64 15.26 9.66 0.12
Muslims 0.37 1.14 6.22 2.70 0.16
Others 0.28 2.28 8.39 2.98 0.04
Sikhs 0.74 1.35 9.22 5.62 1.12
Zoroastrians NA NA 10.71 13.26 NA
For the adult Hindu females, the incidences of education are also quite low across
most of the categories. They tend to get better from the graduation and above
level till the diploma categories The Muslim women tend to do better than the
Hindu women at the primary and secondary levels, but thereafter do worse than
their Hindu counterparts. At the secondary and higher secondary levels, it’s the
Jains, Buddhists and the Christians who perform better than the Hindus,
Muslims and Sikhs. Also they do better at the graduation and above levels along
with the Zoroastrians. The Sikh women also do well in the beginning but later on,
after the middle level, they fall below but above the Hindus, Muslims and others.
3.2 Level of Education across Religious groups
This section looks at the level of education across religious groups for the
population falling in the 7 years and above age bracket. We start by looking at the
level of education amongst the males in rural areas and see their break-up across
different levels. Comparing the share of population from each group falling in a
particular educational class, we observe that illiteracy rates are the highest for

13
others (31%) and the Muslims (30%) followed closely by the Sikhs (27%) and the
Hindus (26%). In the middle range, we have the Zoroastrians, Christians and the
Buddhists within a range of 15% to 17%. The lowest illiteracy rates are seen
among the Jains (11%). As we move up the education levels, we notice that the
highest share of population across all groups, is concentrated in the literate
without formal category with a minimum of 25 per cent to a maximum of 43 per
cent. At the primary level, the highest shares are seen yet again for the
Zoroastrians (27%) and the Jains (24%), while the lowest for the Muslims and
others (both 6%). However, when we look at the share of the population with
graduate-level education and above, we find that the highest share is seen for the
Zoroastrians (27%), which is nearly three times the nearest share for the Jains
(9%). Thereafter we observe the Hindus and the Christians (both 3%), the Sikhs
and the Buddhists (both 2%) following, with the Muslims having the lowest share
(1.5%). Looking at the share of illiterates, the first very striking and obvious
observation is that the share of the women are much higher than those seen for
the men above across all religious groups.
Table 11: Education Levels across Religions, Males of 7 Years Age and Above, Rural, 2004/05
Religious Communities
Illiterate
Literate without formal
schooling
Literate but
below primary
Primary
Middle
Secondary
& above
Graduate
& above
Hindus 26.66 36.75 18.91 9.23 4.81 0.52 3.12
Muslims 30.12 43.19 16.34 6.13 2.49 0.24 1.49
Christians 15.26 36.26 25.08 11.85 5.72 2.28 3.54
Sikhs 27.10 35.43 14.48 13.54 6.19 0.74 2.51
Jains 11.63 25.72 20.58 24.07 8.53 0.34 9.13
Buddhists 16.60 38.07 24.19 11.73 6.33 0.25 2.82
Zoroastrians 17.28 27.57 0.00 27.57 0.00 0.00 27.57
Others 31.96 36.00 20.52 6.01 3.95 0.18 1.38
14
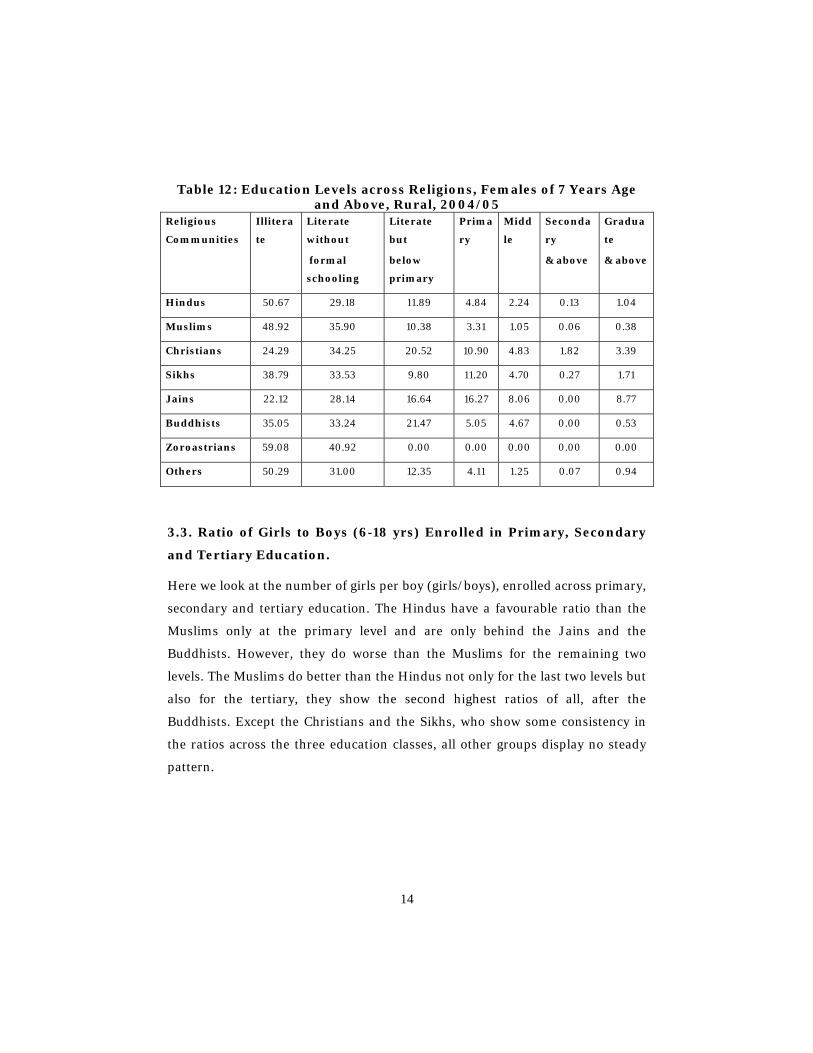
Table 12: Education Levels across Religions, Females of 7 Years Age and Above, Rural, 2004/05
Religious
Communities
Illitera
te
Literate
without
formal
schooling
Literate
but
below
primary
Prima
ry
Midd
le
Seconda
ry
& above
Gradua
te
& above
Hindus 50.67 29.18 11.89 4.84 2.24 0.13 1.04
Muslims 48.92 35.90 10.38 3.31 1.05 0.06 0.38
Christians 24.29 34.25 20.52 10.90 4.83 1.82 3.39
Sikhs 38.79 33.53 9.80 11.20 4.70 0.27 1.71
Jains 22.12 28.14 16.64 16.27 8.06 0.00 8.77
Buddhists 35.05 33.24 21.47 5.05 4.67 0.00 0.53
Zoroastrians 59.08 40.92 0.00 0.00 0.00 0.00 0.00
Others 50.29 31.00 12.35 4.11 1.25 0.07 0.94
3.3. Ratio of Girls to Boys (6-18 yrs) Enrolled in Primary, Secondary
and Tertiary Education.
Here we look at the number of girls per boy (girls/boys), enrolled across primary,
secondary and tertiary education. The Hindus have a favourable ratio than the
Muslims only at the primary level and are only behind the Jains and the
Buddhists. However, they do worse than the Muslims for the remaining two
levels. The Muslims do better than the Hindus not only for the last two levels but
also for the tertiary, they show the second highest ratios of all, after the
Buddhists. Except the Christians and the Sikhs, who show some consistency in
the ratios across the three education classes, all other groups display no steady
pattern.

15
Table 13: Ratio of Girls To Boys (6-18 yrs) Enrolled in Primary, Secondary and Tertiary Education.
Religious Communities Primary Secondary & Higher Secondary
Tertiary
Buddhists 0.91 0.85 1.83
Christians 0.84 0.88 0.86
Hindus 0.85 0.68 0.98
Jains 1.27 1.39 0.47
Muslims 0.82 0.78 1.35
Others 0.70 1.10 0.35
Sikhs 0.84 0.88 0.86
Zoroastrians NA 0.46 NA
4. Poverty Incidence across Religious Communities.
Next we examine the incidence of impoverishment across religious communities.
Here we look at rural and urban poverty separately, as these are based on two
different poverty lines as per the calculations of the Planning Commission of
India, for the year 2004/05, generated for each region. Looking at the rural
poverty first, we observe that incidences are high for some of the minority groups,
while being low for others. The highest incidences are seen for the Buddhists,
followed by the others, Zoroastrians and Muslims. The lowest levels are for the
Christians, Sikhs and Jains. The major groups, such as the Hindus and Muslims
show mid-level incidences. The urban picture shows a different pattern from the
rural one. Here the Muslims show the highest incidences followed by the
Buddhists. Interestingly, the Hindus show higher urban poverty incidence and
are placed third, unlike their fifth position in the rural areas. Urban Zoroastrians
seem to show lower incidences than their rural counterparts and show the third
lowest poverty levels. Lowest incidences are again shown by the Jains, Sikhs and
Christians. On the whole, across both the regions, we find that Jains and Sikhs,
both of which are primarily into individual enterprise (even rural Sikh farms
undertake additional income earning activities, such as rearing milch cattle, etc.,)
show lowest incidences along with the Christians who can be safely assumed to
be well.

16
Table 14: Poverty Incidence across Religious Communities Religious Communities Rural Urban
Buddhists 40.59 28.62
Christians 16.21 12.47
Hindus 28.90 23.35
Jains 2.59 2.57
Muslims 29.26 41.38
Others 36.02 22.91
Sikhs 5.00 6.08
Zoroastrians 35.42 10.74
Total 28.29 25.62
Sources: NSSO, Consumption Expenditure, 2004/05
Table 15: Share of Religious Poor in All India Poor (Rural/Urban)
Religious Communities
Share of Religious Groups in All India, Rural
Share of Religious Groups in All India, Urban
Population Poor Population Poor
Buddhists 0.77 0.89 0.66 1.07
Christians 1.14 2.81 2.14 2.86
Hindus 85.52 79.99 82.33 75.6
Jains 0.01 1.10 0.14 1.12
Muslims 11.78 12.93 11.96 17.26
Others 0.43 0.09 0.81 0.22
Sikhs 0.34 2.12 1.9 1.79
Zoroastrians 0.01 0.07 NA NA
Sources: NSSO, Consumption Expenditure, 2004/05
We can also see the break-up of the poor in the country, to see which groups
contributes how much to the poor population and in what proportion. The table
above gives the break-up of the all India poor population across religious groups.
We find that in the rural regions, the Hindus, Muslims and the Christians are the
top contributors and follow their overall proportional representation in the
country’s population. Next we see the Buddhist making up 0.77 per cent of the
poor while being only 0.66 per cent of the population, clearly indicating more
than proportional contribution to the poor population. Similarly for the other
community. The Sikhs with low level of poverty have the third lowest share,
17
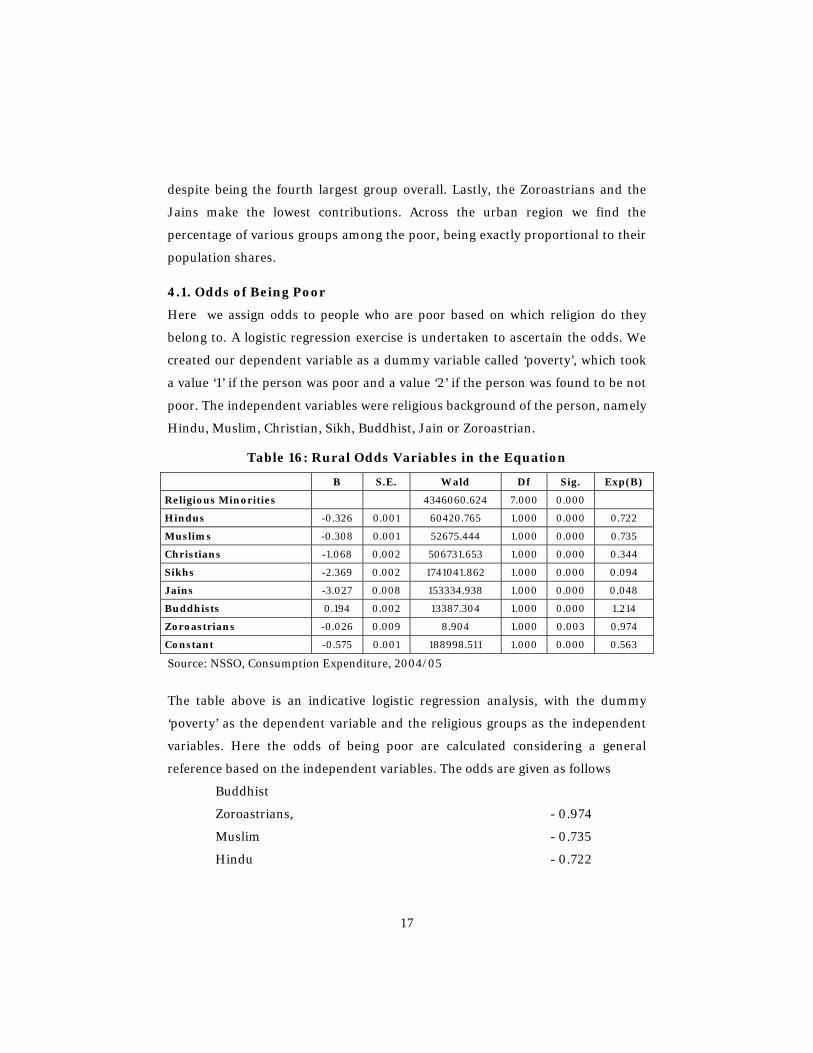
despite being the fourth largest group overall. Lastly, the Zoroastrians and the
Jains make the lowest contributions. Across the urban region we find the
percentage of various groups among the poor, being exactly proportional to their
population shares.
4.1. Odds of Being Poor
Here we assign odds to people who are poor based on which religion do they
belong to. A logistic regression exercise is undertaken to ascertain the odds. We
created our dependent variable as a dummy variable called ‘poverty’, which took
a value ‘1’ if the person was poor and a value ‘2’ if the person was found to be not
poor. The independent variables were religious background of the person, namely
Hindu, Muslim, Christian, Sikh, Buddhist, Jain or Zoroastrian.
Table 16: Rural Odds Variables in the Equation
B S.E. Wald Df Sig. Exp(B)
Religious Minorities 4346060.624 7.000 0.000
Hindus -0.326 0.001 60420.765 1.000 0.000 0.722
Muslims -0.308 0.001 52675.444 1.000 0.000 0.735
Christians -1.068 0.002 506731.653 1.000 0.000 0.344
Sikhs -2.369 0.002 1741041.862 1.000 0.000 0.094
Jains -3.027 0.008 153334.938 1.000 0.000 0.048
Buddhists 0.194 0.002 13387.304 1.000 0.000 1.214
Zoroastrians -0.026 0.009 8.904 1.000 0.003 0.974
Constant -0.575 0.001 188998.511 1.000 0.000 0.563
Source: NSSO, Consumption Expenditure, 2004/05
The table above is an indicative logistic regression analysis, with the dummy
‘poverty’ as the dependent variable and the religious groups as the independent
variables. Here the odds of being poor are calculated considering a general
reference based on the independent variables. The odds are given as follows
Buddhist
Zoroastrians, - 0.974
Muslim - 0.735
Hindu - 0.722

18
Christians - 0.344
Sikhs - 0.094
Jains - 0.048
We find the Buddhists have the highest odds followed by the Zoroastrians and the
Muslims. The Hindus come next. The lowest odds are for the Sikhs and the Jains.
Table 17: Urban Odds, Indicative - Based on Overall General Reference Variables in the Equation
Religious Communities B S.E. Wald df Sig. Exp(B)
7086040.840 7.000 0.000
Hindus 0.025 0.005 24.319 1.000 0.000 1.025
Muslims 0.865 0.005 29790.419 1.000 0.000 2.375
Christians -0.735 0.005 20316.778 1.000 0.000 0.480
Sikhs -1.523 0.005 79363.151 1.000 0.000 0.218
Jains -2.398 0.007 131573.616 1.000 0.000 0.091
Buddhist 0.300 0.005 3311.414 1.000 0.000 1.350
Zoroastrians -0.904 0.010 7993.339 1.000 0.000 0.405
Constant -1.214 0.005 58853.797 1.000 0.000 0.297
Notes: Variable(s) entered on step 1: RELIGION.
Source: The urban regression indicates that the odds are as follows
Muslim - 2.375
Buddhist - 1.350
Hindu - 1.025
Christians - 0.480
Zoroastrians - 0.405
Sikhs - 0.218
Jains - 0.091
The highest odds are for the Muslims, followed by the Buddhists and then the
Hindus. The lowest odds are for the Jains and the Sikhs. The Christians and
Zoroastrians have low but medium-level odds. Thus across both rural and urban

19
regions, the Buddhists and the Muslims show the highest odds of being poor,
while the Sikhs and the Jains the lowest.
4.2. Mean Percapita Consumption Expenditure
Mean per-capita expenditure across religious groups for both rural and urban
regions is given below. The rural expenditures indicate that only three groups,
namely the Jains, Sikhs and the Christians have above all India average
expenditure. For the Jains, their preoccupation with self-employed economic
enterprise and for the Sikhs, their relative success in farming and off farm
diversification can be largely assumed to have contributed to their position. The
bottom three groups are the Zoroastrians, others and the Buddhists. The
Zoroastrians’ unlikely poor performance could be due to a very small proportion
of them inhibiting the rural regions and probably unsuccessfully.
Table 18: Mean Per-capita Consumption Expenditure (Rural/Urban)
Religion Communities Mean MPCE/Rural Mean MPCE/Urban
Buddhists 506.26 880.59
Christians 806.27 1352.63
Hindus 547.70 1083.17
Jains 978.36 1901.36
Muslims 545.81 776.50
Others 504.09 1179.45
Sikhs 864.72 1498.81
Zoroastrians 474.07 2883.57
All India. Avg 558.81 1052.34
Unlike the rural picture, the urban situation shows the Zoroastrians doing the
best amongst all, as is usually expected of them due to high level of education and
private economic enterprise. Also all the groups show above average expenditures

20
except the Buddhists and the Muslims. After the Zoroastrians it’s the Jains,
Sikhs, Christian and others who show above average expenditures.
5. Unemployment Rates (All Ages)
Unemployment rates across all religious groups, as can be seen, are very low for
both rural and urban regions. The rates are at their highest at 3.9 per cent for the
urban Christians and 3.1 per cent for the urban Buddhists. The lowest are seen
for the rural Jains and the Zoroastrians. On the whole, urban unemployment
rates are slightly higher for all except for the Sikhs and the Jains. These rates are
based on the ‘usual principle status’ of individuals, which defines a person as
working, if he or she had been gainfully employed for a major part of the year
(usually more than 180 days) preceding the survey (time criteria).
Table 19: Rural, Urban Unemployment Rates across Religions (All Ages)
Religious Communities
Rural Unemployment Rate
Urban Unemployment Rate
Total
Hindus 0.90(0.7) 1.94 1.15
Muslims 1.04(0.8) 1.58 1.22
Christians 2.72(2.1) 3.92 3.07
Sikhs 2.23 (1.6) 1.91 2.17
Jains 0.00 1.20 1.00
Buddhist 1.07 3.17 1.77
Zoroastrians 0.00 2.19 2.14
Others 0.29 4.64 1.06
Total 0.98 1.94 1.23
Sources: Employment/Unemployment survey, 61st Round, 2004/2005 ( All Ages)
These rates would go down further, if we used the ‘usual status’ criteria, which in
addition to the ‘usual principle status’ of a person, also includes his or her ‘usual
subsidiary activity status’. Persons designated as unemployed for the major part
of the year based on the ‘usual principle status’ criteria, also do some form of
work for a shorter duration ( but more than 30 days) or on a part-time basis
21
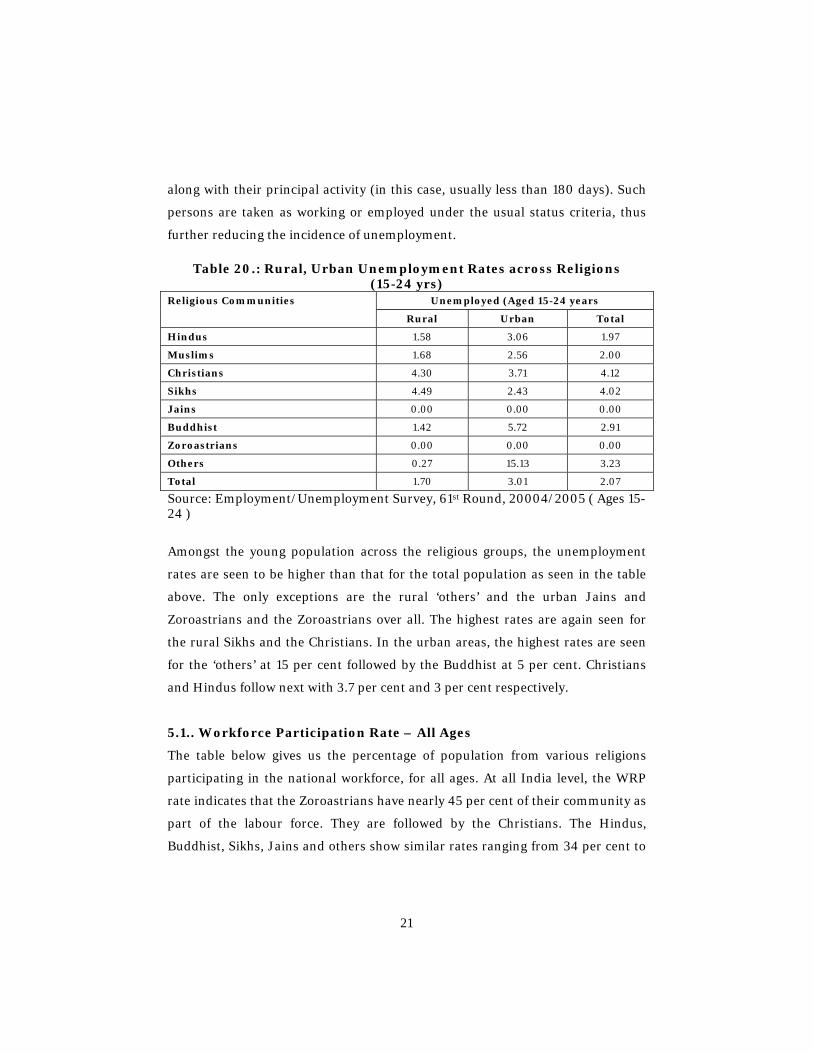
along with their principal activity (in this case, usually less than 180 days). Such
persons are taken as working or employed under the usual status criteria, thus
further reducing the incidence of unemployment.
Table 20.: Rural, Urban Unemployment Rates across Religions (15-24 yrs)
Religious Communities Unemployed (Aged 15-24 years
Rural Urban Total
Hindus 1.58 3.06 1.97
Muslims 1.68 2.56 2.00
Christians 4.30 3.71 4.12
Sikhs 4.49 2.43 4.02
Jains 0.00 0.00 0.00
Buddhist 1.42 5.72 2.91
Zoroastrians 0.00 0.00 0.00
Others 0.27 15.13 3.23
Total 1.70 3.01 2.07
Source: Employment/Unemployment Survey, 61st Round, 20004/2005 ( Ages 15-24 )
Amongst the young population across the religious groups, the unemployment
rates are seen to be higher than that for the total population as seen in the table
above. The only exceptions are the rural ‘others’ and the urban Jains and
Zoroastrians and the Zoroastrians over all. The highest rates are again seen for
the rural Sikhs and the Christians. In the urban areas, the highest rates are seen
for the ‘others’ at 15 per cent followed by the Buddhist at 5 per cent. Christians
and Hindus follow next with 3.7 per cent and 3 per cent respectively.
5.1.. Workforce Participation Rate – All Ages
The table below gives us the percentage of population from various religions
participating in the national workforce, for all ages. At all India level, the WRP
rate indicates that the Zoroastrians have nearly 45 per cent of their community as
part of the labour force. They are followed by the Christians. The Hindus,
Buddhist, Sikhs, Jains and others show similar rates ranging from 34 per cent to

22
37 per cent. The lowest rate is shown by the Muslims at 32 per cent. Between the
lowest and the highest rates, the difference is to the tune of around 12 per cent.
This overall pattern is seen to be exactly replicated across the urban region.
However, in the rural areas the pattern changes considerably. The Buddhists
show, the highest rates here, pushing the Zoroastrians down one position. The
Hindus, the Sikhs and the Christians experience a fall in their rates, whereas the
others and the Jains have improved their positions and moved up. The rural rates
are higher than the urban rates as is understandable due to the nature of the rural
occupations and the remunerations expected to be earned, forcing more people to
work in one form or the other. Muslims show the lowest WRP rate across all
three categories.
Table 21. Workforce Participation Rate – All Ages
Workforce Participation Rate (All ages)
Religious Communities Rural Urban Total
Buddhists 51.29 37.33 37.33
Christians 43.66 39.62 39.62
Hindus 41.24 37.34 37.34
Jains 45.37 34.38 34.38
Muslims 31.23 32.72 32.72
Others 47.72 34.24 34.24
Sikhs 33.43 35.16 35.16
Zoroastrians 50.00 44.42 44.42
Total 40.07 36.57 36.57
Sources: Employment/Unemployment Survey, 61st Round, 20004/2005
5.2. Workforce Participation Rate – From 15 to 24 Years.
Observing the workforce participation rates for the youth (15-24 years), we find
that at the all India level, the rates raise quite significantly for all the groups
except for the Sikh, Jains and the Muslims. However, youth participation pattern
is somewhat different from the overall pattern we observed above. At the all India
level, the Zoroastrians maintain their top position, but then on the Christians
who came next are replaced by the Buddhists and the Hindus by the others. On

23
the whole, amongst the youth, except the Buddhist, others and the Muslims, all
the other groups loose the standing they had at the overall level. The lowest rates
are now seen for the Muslims and also surprisingly for the Jain youth.
Table 22.: Workforce Participation Rate – From 15 to 24 years.
Workforce Participation Rate (15-24 yrs)
Religious Communities Rural Urban Total
Buddhists 61.22 43.01 54.89
Christians 52.29 39.85 48.40
Hindus 48.40 41.53 46.58
Jains 52.45 32.33 37.25
Muslims 37.74 38.13 37.88
Others 56.60 40.51 53.39
Sikhs 38.97 36.22 38.34
Zoroastrians 0..00 77.03 71.79
Total 47.10 40.74 45.32
The urban pattern is similar to the overall situation, except for changes in the
relative positions but not in the overall standings. The top two, namely the
Zoroastrians and the Buddhists show the same highest WRP rates. The middle
groups see a reshuffle in their positions as can be seen in the segment in blue,
with the others and Christians moving one place up and the Hindus moving two
places down. At the bottom, the Sikhs and the Muslims have swapped positions
and the Jains maintain their bottom rug. Unlike the urban relative reshuffle, the
rural standings change dramatically, with the Zoroastrians moving from the top
to the bottom. This could be due to a very small sample of rural inhabitance and
probably with no sample of persons falling in this age group. The Jains, who at
the overall and urban levels have been at the bottom, now display the third
highest rates. The Hindus are at the same position as at the overall level,
indicating the former affecting the later on an average. Sikhs maintain their
overall relative position with the Muslims again with the lowest rates.
24
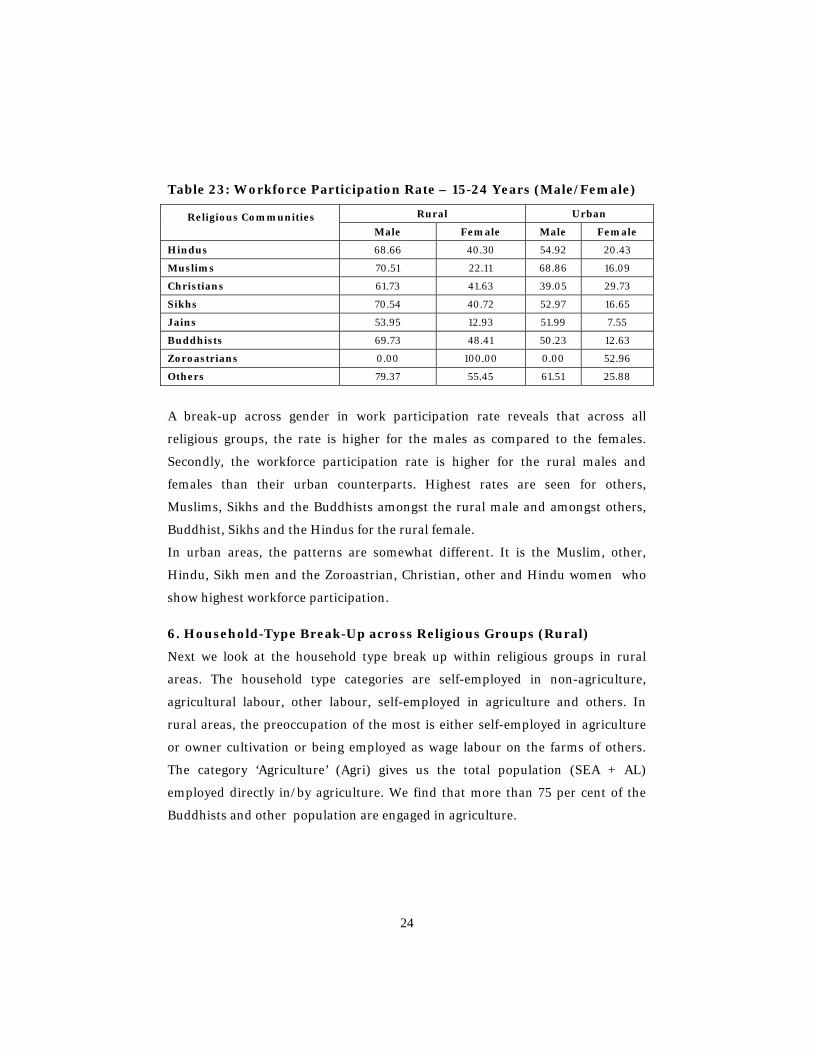
Table 23: Workforce Participation Rate – 15-24 Years (Male/Female)
Religious Communities
Rural Urban
Male Female Male Female
Hindus 68.66 40.30 54.92 20.43
Muslims 70.51 22.11 68.86 16.09
Christians 61.73 41.63 39.05 29.73
Sikhs 70.54 40.72 52.97 16.65
Jains 53.95 12.93 51.99 7.55
Buddhists 69.73 48.41 50.23 12.63
Zoroastrians 0.00 100.00 0.00 52.96
Others 79.37 55.45 61.51 25.88
A break-up across gender in work participation rate reveals that across all
religious groups, the rate is higher for the males as compared to the females.
Secondly, the workforce participation rate is higher for the rural males and
females than their urban counterparts. Highest rates are seen for others,
Muslims, Sikhs and the Buddhists amongst the rural male and amongst others,
Buddhist, Sikhs and the Hindus for the rural female.
In urban areas, the patterns are somewhat different. It is the Muslim, other,
Hindu, Sikh men and the Zoroastrian, Christian, other and Hindu women who
show highest workforce participation.
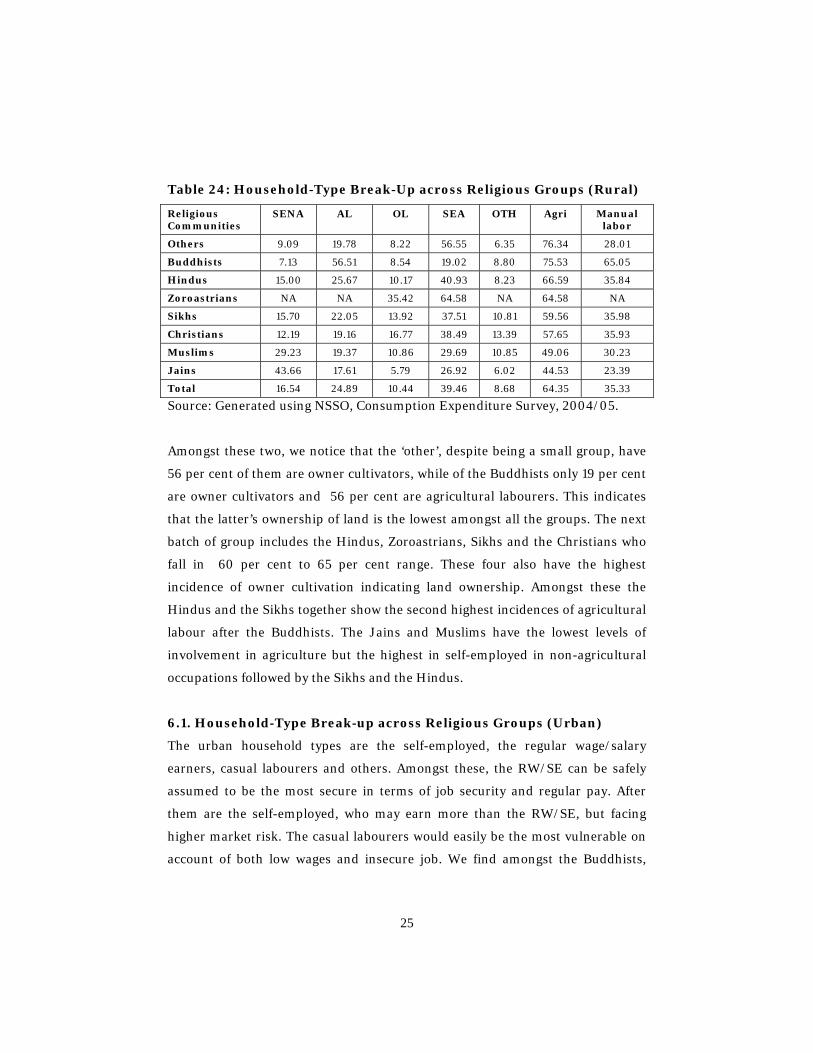
6. Household-Type Break-Up across Religious Groups (Rural)
Next we look at the household type break up within religious groups in rural
areas. The household type categories are self-employed in non-agriculture,
agricultural labour, other labour, self-employed in agriculture and others. In
rural areas, the preoccupation of the most is either self-employed in agriculture
or owner cultivation or being employed as wage labour on the farms of others.
The category ‘Agriculture’ (Agri) gives us the total population (SEA + AL)
employed directly in/by agriculture. We find that more than 75 per cent of the
Buddhists and other population are engaged in agriculture.
25
Table 24: Household-Type Break-Up across Religious Groups (Rural)
Religious Communities
SENA AL OL SEA OTH Agri Manual labor
Others 9.09 19.78 8.22 56.55 6.35 76.34 28.01
Buddhists 7.13 56.51 8.54 19.02 8.80 75.53 65.05
Hindus 15.00 25.67 10.17 40.93 8.23 66.59 35.84
Zoroastrians NA NA 35.42 64.58 NA 64.58 NA
Sikhs 15.70 22.05 13.92 37.51 10.81 59.56 35.98
Christians 12.19 19.16 16.77 38.49 13.39 57.65 35.93
Muslims 29.23 19.37 10.86 29.69 10.85 49.06 30.23
Jains 43.66 17.61 5.79 26.92 6.02 44.53 23.39
Total 16.54 24.89 10.44 39.46 8.68 64.35 35.33
Source: Generated using NSSO, Consumption Expenditure Survey, 2004/05.
Amongst these two, we notice that the ‘other’, despite being a small group, have
56 per cent of them are owner cultivators, while of the Buddhists only 19 per cent
are owner cultivators and 56 per cent are agricultural labourers. This indicates
that the latter’s ownership of land is the lowest amongst all the groups. The next
batch of group includes the Hindus, Zoroastrians, Sikhs and the Christians who
fall in 60 per cent to 65 per cent range. These four also have the highest
incidence of owner cultivation indicating land ownership. Amongst these the
Hindus and the Sikhs together show the second highest incidences of agricultural
labour after the Buddhists. The Jains and Muslims have the lowest levels of
involvement in agriculture but the highest in self-employed in non-agricultural
occupations followed by the Sikhs and the Hindus.
6.1. Household-Type Break-up across Religious Groups (Urban)
The urban household types are the self-employed, the regular wage/salary
earners, casual labourers and others. Amongst these, the RW/SE can be safely
assumed to be the most secure in terms of job security and regular pay. After
them are the self-employed, who may earn more than the RW/SE, but facing
higher market risk. The casual labourers would easily be the most vulnerable on
account of both low wages and insecure job. We find amongst the Buddhists,

26
nearly half of the urban population falls in the R/SE category. This is primarily
due to the policy of job reservations for the scheduled castes of India, most of
whom are Buddhists by religion.
Next come the Christians, who again have high level of education, followed by the
Hindus, the higher castes amongst whom are traditionally educated, and finally
the Zoroastrians who also have high education levels. The lowest incidences are
for the others, the Sikhs, Muslims and the Jains. These last four groups are rather
synonymous with being self-employed and engaged in private enterprise. Thus
we see under the SE category, the Jains, Sikhs, Muslims and the other showing
the highest incidences respectively. They are then followed by the Hindus,
Christians and Buddhists at the lowest. The highest incidence of casual labor is
seen among the Buddhists, at nearly a quarter of their urban population being
involved in this.
Table 25: Household-Type Break-up across Religious Groups (Urban)
Religious Communities SE RW/SE CL OTH
Hindus 40.12 42.64 11.48 5.75 100.00
Muslims 56.94 24.31 13.14 5.62 100.00
Christians 27.20 49.41 13.63 9.76 100.00
Sikhs 57.62 31.33 4.94 6.11 100.00
Jain 77.90 17.35 0.39 4.37 100.00
Buddhists 18.57 51.99 24.90 4.54 100.00
Zoroastrians 26.07 40.36 0.83 32.73 100.00
Others 55.67 35.64 2.79 5.90 100.00
Total 42.99 39.47 11.71 5.82 100.00
Source: Generated using NSSO, Consumption Expenditure Survey, 2004/05.
Thus we see that overall the Buddhist fair the worst in both urban and rural areas
in terms of casualization of occupational status. The Christians and the Muslims
follow next.
27
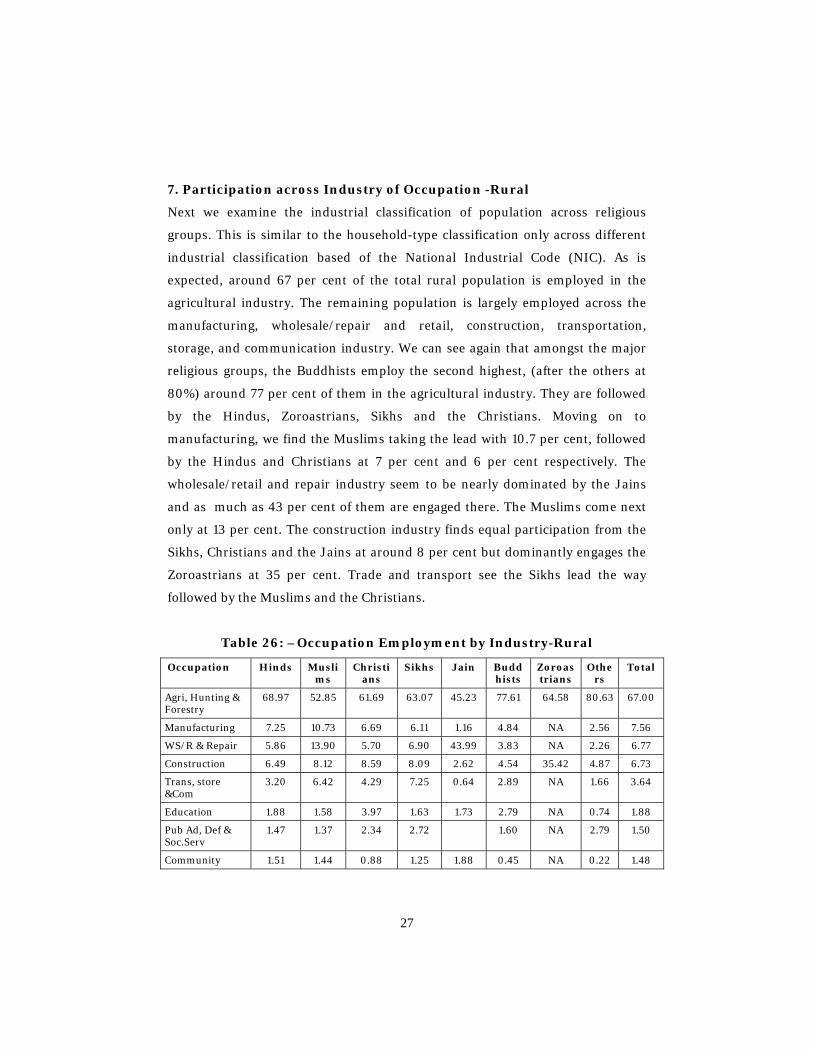
7. Participation across Industry of Occupation -Rural
Next we examine the industrial classification of population across religious
groups. This is similar to the household-type classification only across different
industrial classification based of the National Industrial Code (NIC). As is
expected, around 67 per cent of the total rural population is employed in the
agricultural industry. The remaining population is largely employed across the
manufacturing, wholesale/repair and retail, construction, transportation,
storage, and communication industry. We can see again that amongst the major
religious groups, the Buddhists employ the second highest, (after the others at
80%) around 77 per cent of them in the agricultural industry. They are followed
by the Hindus, Zoroastrians, Sikhs and the Christians. Moving on to
manufacturing, we find the Muslims taking the lead with 10.7 per cent, followed
by the Hindus and Christians at 7 per cent and 6 per cent respectively. The
wholesale/retail and repair industry seem to be nearly dominated by the Jains
and as much as 43 per cent of them are engaged there. The Muslims come next
only at 13 per cent. The construction industry finds equal participation from the
Sikhs, Christians and the Jains at around 8 per cent but dominantly engages the
Zoroastrians at 35 per cent. Trade and transport see the Sikhs lead the way
followed by the Muslims and the Christians.
Table 26: –Occupation Employment by Industry-Rural
Occupation Hinds Muslims
Christians
Sikhs Jain Buddhists
Zoroastrians
Others
Total
Agri, Hunting & Forestry
68.97 52.85 61.69 63.07 45.23 77.61 64.58 80.63 67.00
Manufacturing 7.25 10.73 6.69 6.11 1.16 4.84 NA 2.56 7.56
WS/R & Repair 5.86 13.90 5.70 6.90 43.99 3.83 NA 2.26 6.77
Construction 6.49 8.12 8.59 8.09 2.62 4.54 35.42 4.87 6.73
Trans, store &Com
3.20 6.42 4.29 7.25 0.64 2.89 NA 1.66 3.64
Education 1.88 1.58 3.97 1.63 1.73 2.79 NA 0.74 1.88
Pub Ad, Def & Soc.Serv
1.47 1.37 2.34 2.72 1.60 NA 2.79 1.50
Community 1.51 1.44 0.88 1.25 1.88 0.45 NA 0.22 1.48
28
Service
Hotel & Restaurants
0.79 1.18 0.66 0.51 0.12 NA 0.84 0.82
Mining & Quarrying
0.75 0.52 1.01 0.17 0.02 NA 2.95 0.72
Health & Social Work
0.45 0.38 0.84 0.33 1.61 0.21 NA 0.19 0.45
Fishing 0.39 0.57 1.25 NA 0.15 0.41
Real Estate, Renting & Buss
0.29 0.42 0.89 0.22 0.20 NA 0.04 0.32
Financial Intermediation
0.29 0.08 0.63 0.53 1.13 0.54 NA 0.28
Electricity, Gas & Water
0.26 0.09 0.34 1.03 0.20 NA 0.06 0.26
Household with employees
0.14 0.37 0.24 0.19 0.17 NA 0.07 0.17
Total 100.00 100.00 100.00 100.00 100.00 100.00 100.00 100.00
100.00
Source: Generated using NSSO, Consumption Expenditure Survey, 2004/05.
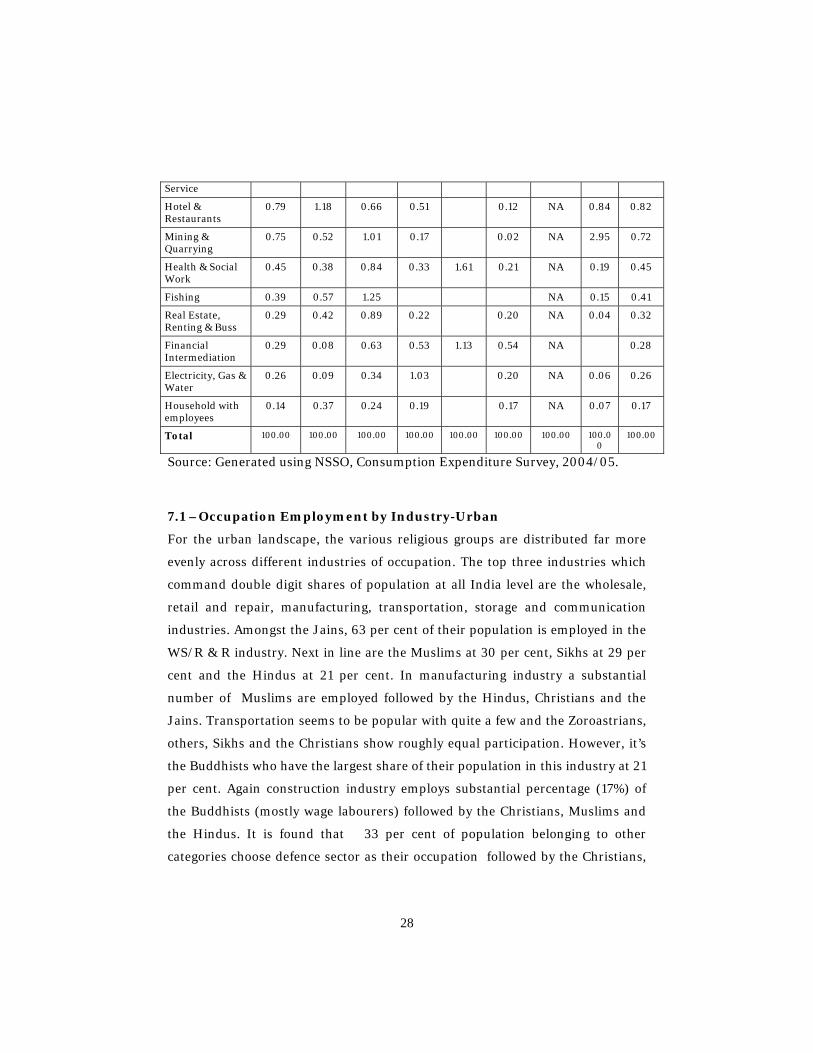
7.1 –Occupation Employment by Industry-Urban
For the urban landscape, the various religious groups are distributed far more
evenly across different industries of occupation. The top three industries which
command double digit shares of population at all India level are the wholesale,
retail and repair, manufacturing, transportation, storage and communication
industries. Amongst the Jains, 63 per cent of their population is employed in the
WS/R & R industry. Next in line are the Muslims at 30 per cent, Sikhs at 29 per
cent and the Hindus at 21 per cent. In manufacturing industry a substantial
number of Muslims are employed followed by the Hindus, Christians and the
Jains. Transportation seems to be popular with quite a few and the Zoroastrians,
others, Sikhs and the Christians show roughly equal participation. However, it’s
the Buddhists who have the largest share of their population in this industry at 21
per cent. Again construction industry employs substantial percentage (17%) of
the Buddhists (mostly wage labourers) followed by the Christians, Muslims and
the Hindus. It is found that 33 per cent of population belonging to other
categories choose defence sector as their occupation followed by the Christians,
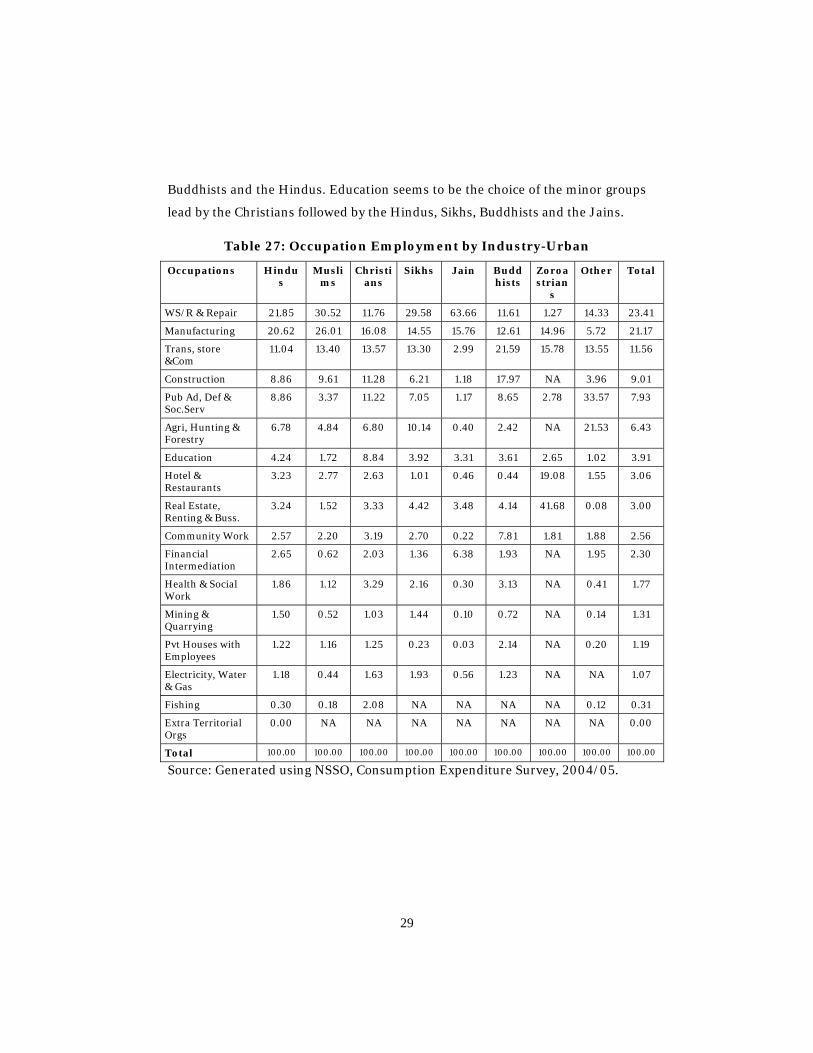
29
Buddhists and the Hindus. Education seems to be the choice of the minor groups
lead by the Christians followed by the Hindus, Sikhs, Buddhists and the Jains.
Table 27: Occupation Employment by Industry-Urban
Occupations Hindus
Muslims
Christians
Sikhs Jain Buddhists
Zoroastrian
s
Other Total
WS/R & Repair 21.85 30.52 11.76 29.58 63.66 11.61 1.27 14.33 23.41
Manufacturing 20.62 26.01 16.08 14.55 15.76 12.61 14.96 5.72 21.17
Trans, store &Com
11.04 13.40 13.57 13.30 2.99 21.59 15.78 13.55 11.56
Construction 8.86 9.61 11.28 6.21 1.18 17.97 NA 3.96 9.01
Pub Ad, Def & Soc.Serv
8.86 3.37 11.22 7.05 1.17 8.65 2.78 33.57 7.93
Agri, Hunting & Forestry
6.78 4.84 6.80 10.14 0.40 2.42 NA 21.53 6.43
Education 4.24 1.72 8.84 3.92 3.31 3.61 2.65 1.02 3.91
Hotel & Restaurants
3.23 2.77 2.63 1.01 0.46 0.44 19.08 1.55 3.06
Real Estate, Renting & Buss.
3.24 1.52 3.33 4.42 3.48 4.14 41.68 0.08 3.00
Community Work 2.57 2.20 3.19 2.70 0.22 7.81 1.81 1.88 2.56
Financial Intermediation
2.65 0.62 2.03 1.36 6.38 1.93 NA 1.95 2.30
Health & Social Work
1.86 1.12 3.29 2.16 0.30 3.13 NA 0.41 1.77
Mining & Quarrying
1.50 0.52 1.03 1.44 0.10 0.72 NA 0.14 1.31
Pvt Houses with Employees
1.22 1.16 1.25 0.23 0.03 2.14 NA 0.20 1.19
Electricity, Water & Gas
1.18 0.44 1.63 1.93 0.56 1.23 NA NA 1.07
Fishing 0.30 0.18 2.08 NA NA NA NA 0.12 0.31
Extra Territorial Orgs
0.00 NA NA NA NA NA NA NA 0.00
Total 100.00 100.00 100.00 100.00 100.00 100.00 100.00 100.00 100.00
Source: Generated using NSSO, Consumption Expenditure Survey, 2004/05.

30
8.. Average Land Ownership across Religious Groups (Rural)
Here we look at the basic asset base of the rural population across religious
groups. Beginning with the incidence of landlessness, we find that landlessness is
the highest among the Buddhists at 40 per cent. The Buddhists being dominantly
ex-untouchables and of low caste status did not have the right to own land under
the Hindu fold, and this historical fact could be reason for their high
landlessness. Next in line are the Zoroastrians, Sikhs and the Jains. The Jains
and the Zoroastrians are known to be traditionally involved in business and
private enterprise. The figures below suggest that the Zoroastrians are either
landless or large land owners. The rural Sikhs also undertake farming but
nonetheless substantiate their incomes by diversifying into off-farm activities as
well. Landlessness among the Muslims is seen to be higher than that that of the
Hindus and is lowest amongthe Christians.
Table 28: Land Holding Pattern across Religious Groups (Rural)
Religious Communities
Landless
Marginal
Small Medium
Large V. Large
Total
Hindus 16.55 32.83 20.79 14.76 9.79 5.28 100.00
Muslims 19.32 46.62 19.17 9.00 4.41 1.48 100.00
Christians 8.76 46.28 19.42 13.42 9.70 2.42 100.00
Sikhs 23.93 33.83 7.86 9.91 13.99 10.48 100.00
Jains 23.68 16.73 6.57 23.05 10.68 19.29 100.00
Buddhists 40.97 22.69 13.45 15.52 3.13 4.23 100.00
Zoroastrians 35.42 - - - - 64.58 100.00
Others 4.63 17.82 37.35 24.06 11.59 4.54 100.00
Total 16.96 34.57 20.32 14.02 9.23 4.90 100.00
Source: Generated using NSSO, Consumption Expenditure Survey, 2004/05.
Marginal and small holdings make up for the largest two categories across India.
This is clearly reflected across the populous groups of the Hindus, Muslims and
the Christians. In addition to the Zoroastrians, as mentioned above, among the
Sikhs the land holding pattern in decreasing order includes marginal, large, very
large, the medium and finally the small holders. . Among the Jains, largest landed

31
category is the medium, followed by the vary large and then the marginal,
subsequently followed by the large and then the small.
8.1.. Share of Different Religious Groups across Land Classes.
Here we look at the religious break-up of the population falling in each of the
land categories. The Hindus and the Muslims can be seen to be the top two
contributors to the first three categories of the landless, marginal and the small
land holders. The Christians and the Sikhs, who are the next to populous groups,
follow the Hindus and the Muslims for the first two land classes, albeit not in that
order necessarily. The Sikhs make up a small portion of the small category and
are replaced by others. Thereafter, the Christian have exchanged places with the
Muslims across the medium and the large categories followed by the Sikhs.
Interestingly for the very large category, the share of the Sikhs jumps to the
second just below the Hindus followed by the Christians and then the Muslims.
Mirroring their share in the overall population here the Buddhists, others, Jains
and Zoroastrians contribute negligibly to all categories.
Table 29: Share of Religious Groups across Land Holding Classes (Rural)
Religious Communities Landless Marginal Small Medium Large V.Large
Buddhists 1.36 0.91 1.28 1.47 0.72 0.74
Christians 2.05 5.64 8.71 9.63 11.12 5.62
Hindus 79.88 73.58 74.33 75.24 74.87 80.95
Jains 0.20 0.05 0.03 0.06 0.13 0.21
Muslims 11.68 16.36 12.98 9.05 6.51 4.29
Others 0.30 0.71 1.47 2.26 2.17 2.44
Sikhs 4.51 2.75 1.20 2.29 4.48 5.73
Zoroastrians 0.01 0.03
All 100.00 100.00 100.00 100.00 100.00 100.00
Source: Generated using NSSO, Consumption Expenditure Survey, 2004/05.
9.Health and Nutritional Status of Children and Women across Religious Groups
Here, we focus attention on the health and nutritional status of the most
vulnerable, namely the women and the children across religious communities in
32
India. We begin by looking at the health of pregnant women in terms of their
immunization, place of delivery, assistance during delivery, etc. Next, we look at
health of children in terms of their mortality, morbidity, immunization and
treatment. Finally, we examine the nutritional level or the lack of it across
religious groups.
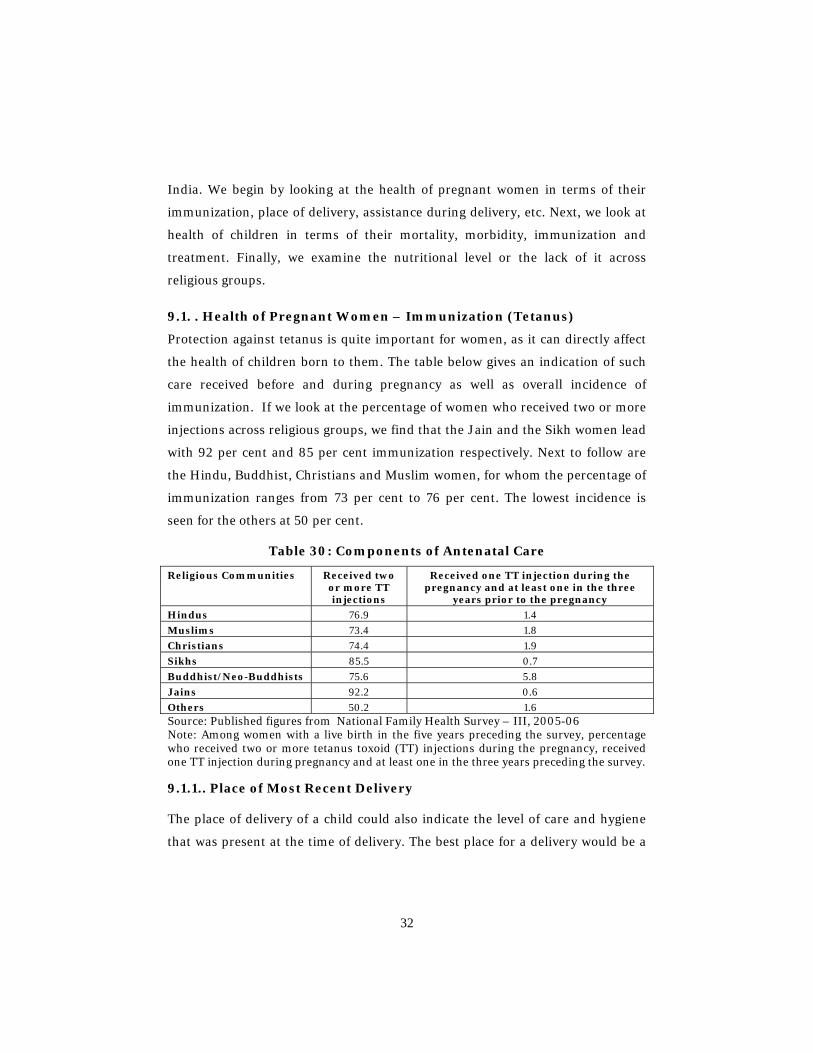
9.1. . Health of Pregnant Women – Immunization (Tetanus)
Protection against tetanus is quite important for women, as it can directly affect
the health of children born to them. The table below gives an indication of such
care received before and during pregnancy as well as overall incidence of
immunization. If we look at the percentage of women who received two or more
injections across religious groups, we find that the Jain and the Sikh women lead
with 92 per cent and 85 per cent immunization respectively. Next to follow are
the Hindu, Buddhist, Christians and Muslim women, for whom the percentage of
immunization ranges from 73 per cent to 76 per cent. The lowest incidence is
seen for the others at 50 per cent.
Table 30: Components of Antenatal Care
Religious Communities Received two or more TT injections
Received one TT injection during the pregnancy and at least one in the three
years prior to the pregnancy
Hindus 76.9 1.4
Muslims 73.4 1.8
Christians 74.4 1.9
Sikhs 85.5 0.7
Buddhist/Neo-Buddhists 75.6 5.8
Jains 92.2 0.6
Others 50.2 1.6 Source: Published figures from National Family Health Survey – III, 2005-06 Note: Among women with a live birth in the five years preceding the survey, percentage who received two or more tetanus toxoid (TT) injections during the pregnancy, received one TT injection during pregnancy and at least one in the three years preceding the survey.
9.1.1.. Place of Most Recent Delivery
The place of delivery of a child could also indicate the level of care and hygiene
that was present at the time of delivery. The best place for a delivery would be a

33
public/private health facility followed by a NGO/Trust and then one’s own home
or parent’s home followed by other home or others. Looking at the percentage of
deliveries at a heath facility we find that the Jains again lead with 93 per cent
such deliveries and only 6 per cent at homes. After the Jains, the Buddhist and
Sikhs follow next with 58 per cent such deliveries. But a major difference between
the two is that the Sikhs prefer private health facilities, while the Buddhists seem
to go for the public ones. The reason seems the obvious difference in the
economic well-being and standing of the two communities. Next are the
Christians with 53 per cent heath facility deliveries. An interesting observation
here is that, almost all the remaining deliveries occur at home. Two of the lowest
rates are seen for the Hindus at 39 per cent and the Muslims at 33 per cent. Half
of the Hindu and 56 per cent of Muslim deliveries occur at home. Accordingly,
usage of both private and public health facilities by the Hindus is higher than that
of the Muslims.
Table 31: Place of Delivery
Religious Communities
Public sector
NGO/ trust
Private
sector
Own hom
e
Parents’
home
Other home
Others
Total
Percentage
delivered in a health facility
Hindus 18.4 0.5 20.3 50.9 9.3 0.4 0.3 100 39.1
Muslims 15.4 0.3 17.3 56.7 9.6 0.5 0.2 100 33
Christians 23.6 0.9 28.9 42 3.8 0.7 0.2 100 53.4
Sikhs 15.1 1.2 42 32.3 9.2 0.1 0.1 100 58.3
Buddhist/Neo-Buddhists
37.2 0.2 21.3 23.4 17.2 0.6 0.1 100 58.8
Jains 30.9 2.6 59.6 4.1 2.8 0 0 100 93.1
Others 7.9 0.4 2.1 79.2 7.8 2 0.6 100 10.4
Source: Published figures from National Family Health Survey - III, 2005-06 Note: Percent distribution of live births in the five years preceding the survey by place of delivery, and percentage delivered in a health facility, according to background characteristics, India, 2005-06.

34
9.1.2.. Assistance during Delivery
Another indication of awareness about birth-related heath practices is the nature
of assistance sought during child delivery. Referring to the table below, we find
that in case of deliveries conducted by skilled providers, i.e. doctors,
ANM/nurse/midwife/LHV, other health personnel, again the Jains and the Sikhs
lead with 94 per cent and 75 per cent such deliveries. Next in line are the
Buddhists and the Christians at around 60 per cent. The Hindus and the Muslims
have the lowest number of skilled deliveries at 47 per cent and 38 per cent
respectively. Thus on the whole, it’s the minority religious groups who seem to
show awareness and insistence on health practices (higher enrolment and
education levels are also found). Consequently, we find that amongst the Hindus,
Muslims and Others, the incidence of deliveries by Dai (TBA) is the highest. The
others lead with as high as 67 per cent of such deliveries, followed by the Muslims
at 47 per cent and finally the Hindus at 34 per cent.
Table 32: Assistance during Delivery
Religious Communities
Doctor
ANM/ nurse
/
mid wife/
LHV
Other health
personnel
Dai (TBA)
Friends/
relatives
Other
No one
Don’t
know/
missing
Total
Percentage
delivered by
a skilled
provider
Percentage
delivered by
caesarean
section
Hindus 35.6 10.7 1.1 34.9 16.9 0.1 0.5 0.1 100 47.5 8.6
Muslims 30.2 7.3 1.2 47 13.8 0.1 0.3 0.1 100 38.8 6.4
Christians 48.1 11.5 0.5 21.6 16.7 0 1.3 0.1 100 60.2 16.5
Sikhs 50.2 23.6 1.6 24.1 0.5 0 0 0 100 75.4 17
Buddhists 52.4 12.4 0.1 16.2 18.8 0 0.1 0.1 100 64.9 5.7
Jains 89.8 4.5 0 5.5 0 0 0 0.2 100 94.3 38.9
Others 8.3 6.2 0.1 67.3 15.4 0 2.2 0.5 100 14.6 1.8
Source: Published figures from National Family Health Survey -3, 2005-06
Note: Percent distribution of live births in the five years preceding the survey by person providing assistance during delivery, and percentage delivered by caesarean section, according to background characteristics, India, 2005-06.

35
9.1.3. Child Mortality
Looking next at mortality of infants (below 1 year) and children (up to 5 years),
we find the Jains reporting no such deaths for both the categories. For infants
under one year of age, the highest mortality rates are seen among others with a
very high incidence of 84 per cent. The Hindus have the next highest rates at
nearly 60 per cent. The Muslims and the Buddhist show identical rates at 52 per
cent, followed by the Sikhs at 45 per cent. The lowest rates are for the Christians
at 41 per cent. On the whole, the rates of infant mortality are very high starting at
around 40 per cent and then climbing thereon across all the religious groups.
Looking next at child mortality, the first thing to notice is that these rates are
higher than the infant mortality rates. This implies that more deaths occur after
the first year of child birth. Again the others show the highest rates at 130 per
cent, according to the NFHS report; however, this is not possible and likely to be
a calculation or typological error. Like the infant mortality rates, here too the
Hindus show the second highest rates at 76 per cent. They are again followed by
the Muslims and the Buddhist at nearly 70 per cent. Lastly, the Sikhs and the
Christians show the lowest rates at 52 per cent each. Thus on the whole, the same
religious relative patterns are shown across both the mortality categories.
Table 33 Child Mortality across Religions.
Religious Communities Infant mortality (1q0) Under-five mortality (5q0)
Hindus 58.5 76
Muslims 52.4 70
Christians 41.7 52.8
Sikhs 45.6 52.1
Buddhists 52.8 69
Others 84.6 130.7
Note: All estimates are for the five years preceding the survey (approximately 1988-1992 for NFHS-1, 1994-1998 for NFHS-2, and 2001-2005 for NFHS-3). Totals include Jains, cases with missing information on education, religion, and caste/tribe, and cases in which the respondent does not know the caste/tribe, which are not shown separately.
Based on 250-499 underweight children surviving to the beginning of the age interval.
* Rate not shown; based on fewer than 250 underweight children surviving to the beginning of the age interval.q
Source: Published figures from National Family Health Survey - III, 2005-06

36
9.1.4.. Child Morbidity and access to Health Care – Acute Respiratory Illness (ARI)
Looking at the incidence of ARI and its treatment across religious groups, we find
that surprisingly the Jains show the highest rate for symptoms of ARI along with
the Muslims at exactly 8.6 per cent for both. Next the Sikhs show the highest
rates at 6.7 per cent followed by the Hindus at 5.2 per cent. The lowest rates are
shown by the Christians, Buddhists and others. In terms of treatment sought and
obtained, we find no such record for the Jains. For the Muslims, who also show
high incidences, 70 per cent of the affected sought treatment from a health
facility, which is an encouraging trend. However, the highest incidence of
treatment is sought by the Sikhs, who show the second highest ARI incidence, at
94 per cent, indicating high awareness and accessibility. The Hindus and the
Buddhist follow next with nearly identical rates of 68 per cent. (The Buddhist
rates, however, are based on a smaller unweighted sample). The Christians and
the others, who show the lowest ARI symptoms, also show the lowest rates for
treatment sought at around 48 per cent.
Table 34: Prevalence and Treatment of Symptoms of ARI
Religious Communities
Children under 5 years Children under 5 years with symptoms of ARI
Percentage with symptoms
of ARI
Percentage for whom treatment was sought from a health facility or provider
Percentage who received
antibiotics
Hindus 5.2 68.3 13.9
Muslims 8.6 70.6 9
Christians 3.4 48.8 12.6
Sikhs 6.7 94.5 9.8
Buddhists 3.1 (67.4) (2.9)
Jains 8.6 * *
Others 3.1 (49.6) (23.1)
Note: Among children under age five, percentage who had symptoms of acute respiratory infection (ARI) in the two weeks preceding the survey and percentage with symptoms of ARI who received specific treatments, according to background characteristics, India, 2005-06. Total includes children with missing information on mother’s education, religion, caste/tribe, mother’s current tobacco use, and cooking fuel and children living in households using ‘other’ cooking fuel, who are not shown separately. ( ) Based on 25-49 underweight cases.
* Percentage not shown; based on fewer than 25 underweight cases.
Source: Published figures from National Family Health Survey - III, 2005-06
37
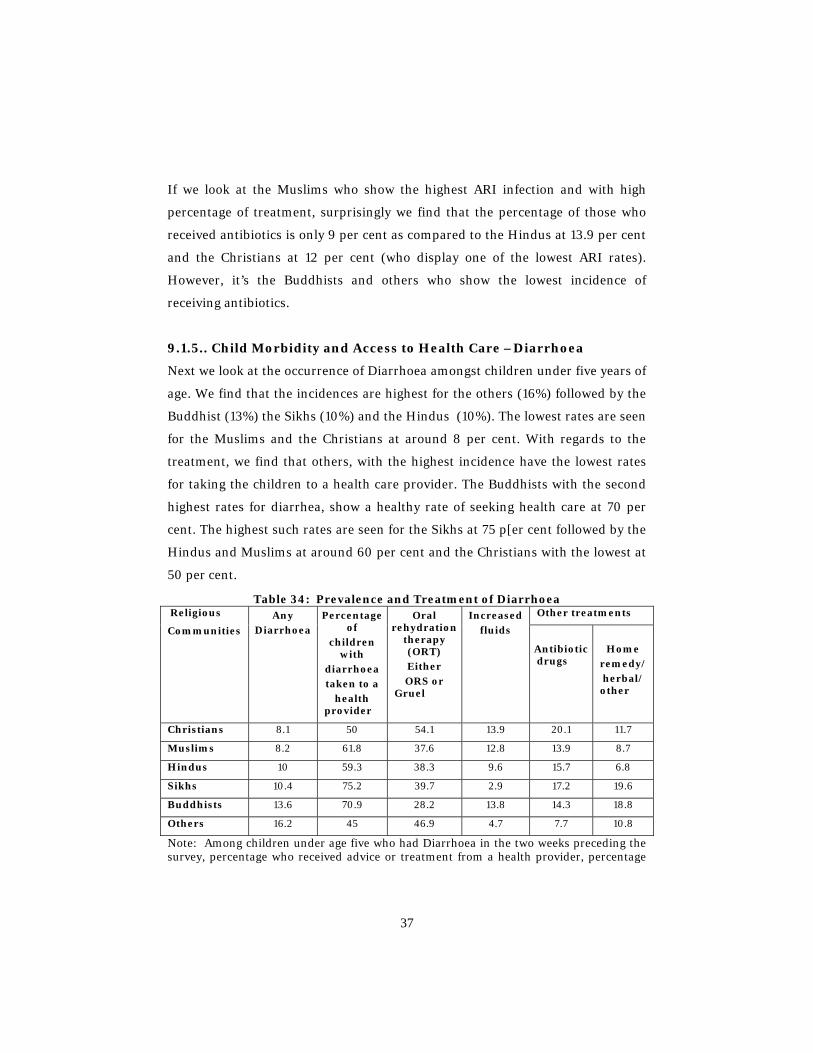
If we look at the Muslims who show the highest ARI infection and with high
percentage of treatment, surprisingly we find that the percentage of those who
received antibiotics is only 9 per cent as compared to the Hindus at 13.9 per cent
and the Christians at 12 per cent (who display one of the lowest ARI rates).
However, it’s the Buddhists and others who show the lowest incidence of
receiving antibiotics.
9.1.5.. Child Morbidity and Access to Health Care –Diarrhoea
Next we look at the occurrence of Diarrhoea amongst children under five years of
age. We find that the incidences are highest for the others (16%) followed by the
Buddhist (13%) the Sikhs (10%) and the Hindus (10%). The lowest rates are seen
for the Muslims and the Christians at around 8 per cent. With regards to the
treatment, we find that others, with the highest incidence have the lowest rates
for taking the children to a health care provider. The Buddhists with the second
highest rates for diarrhea, show a healthy rate of seeking health care at 70 per
cent. The highest such rates are seen for the Sikhs at 75 p[er cent followed by the
Hindus and Muslims at around 60 per cent and the Christians with the lowest at
50 per cent.
Table 34: Prevalence and Treatment of Diarrhoea Religious
Communities Any
Diarrhoea
Percentage of
children with
diarrhoea taken to a
health provider
Oral rehydration
therapy (ORT) Either ORS or
Gruel
Increased fluids
Other treatments
Antibiotic drugs
Home
remedy/ herbal/
other
Christians 8.1 50 54.1 13.9 20.1 11.7 Muslims 8.2 61.8 37.6 12.8 13.9 8.7
Hindus 10 59.3 38.3 9.6 15.7 6.8
Sikhs 10.4 75.2 39.7 2.9 17.2 19.6
Buddhists 13.6 70.9 28.2 13.8 14.3 18.8
Others 16.2 45 46.9 4.7 7.7 10.8
Note: Among children under age five who had Diarrhoea in the two weeks preceding the survey, percentage who received advice or treatment from a health provider, percentage
38
who received oral rehydration therapy (ORT), and percentage who were given other treatments, by background characteristics, India, 2005-06
Source: Published figures from National Family Health Survey - III, 2005-06
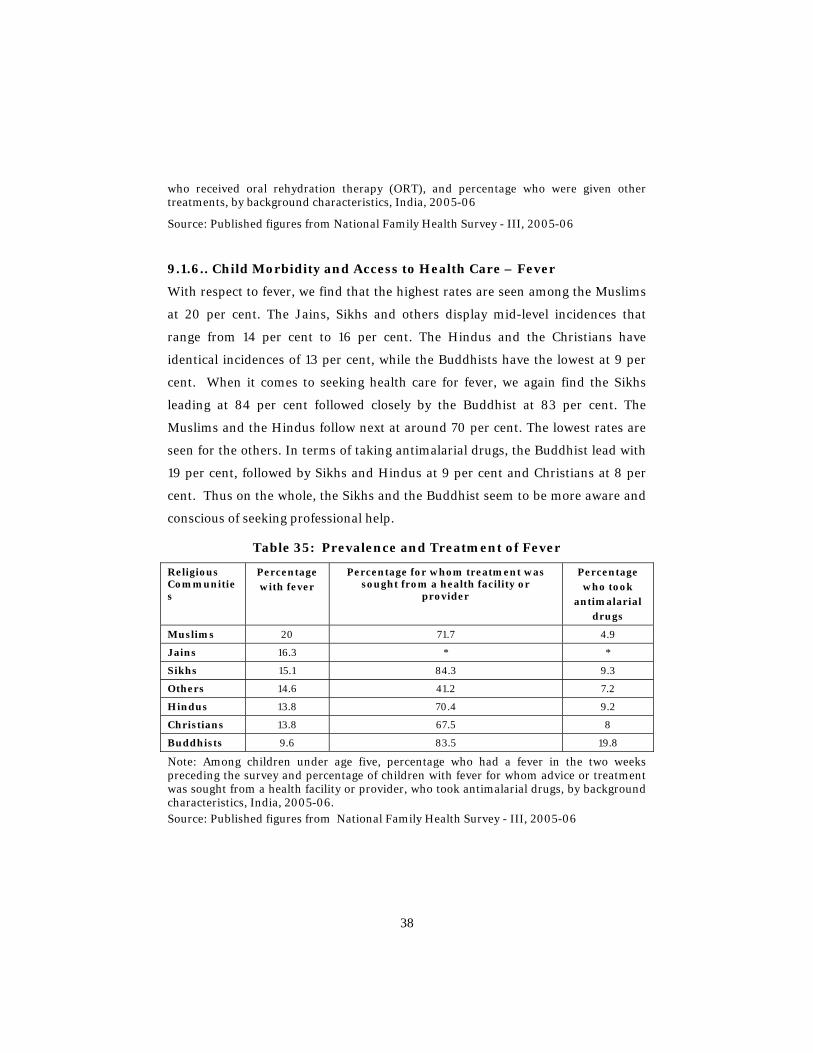
9.1.6.. Child Morbidity and Access to Health Care – Fever
With respect to fever, we find that the highest rates are seen among the Muslims
at 20 per cent. The Jains, Sikhs and others display mid-level incidences that
range from 14 per cent to 16 per cent. The Hindus and the Christians have
identical incidences of 13 per cent, while the Buddhists have the lowest at 9 per
cent. When it comes to seeking health care for fever, we again find the Sikhs
leading at 84 per cent followed closely by the Buddhist at 83 per cent. The
Muslims and the Hindus follow next at around 70 per cent. The lowest rates are
seen for the others. In terms of taking antimalarial drugs, the Buddhist lead with
19 per cent, followed by Sikhs and Hindus at 9 per cent and Christians at 8 per
cent. Thus on the whole, the Sikhs and the Buddhist seem to be more aware and
conscious of seeking professional help.
Table 35: Prevalence and Treatment of Fever
Religious Communities
Percentage with fever
Percentage for whom treatment was sought from a health facility or
provider
Percentage who took
antimalarial drugs
Muslims 20 71.7 4.9
Jains 16.3 * *
Sikhs 15.1 84.3 9.3
Others 14.6 41.2 7.2
Hindus 13.8 70.4 9.2
Christians 13.8 67.5 8
Buddhists 9.6 83.5 19.8
Note: Among children under age five, percentage who had a fever in the two weeks preceding the survey and percentage of children with fever for whom advice or treatment was sought from a health facility or provider, who took antimalarial drugs, by background characteristics, India, 2005-06. Source: Published figures from National Family Health Survey - III, 2005-06

39
Table 36: Child immunization across Religions
Religious
Communit
ies
BCG
DPT
Polio1
Measles
All basic
vaccina
tions
No
vaccin
ations
Percentage
with a
vaccination card seen
1 2 3 0 1 2 3
Hindus 79.6 77.5 67.9 56.4 48.6 93.9 89.9 78.7 60 44.4 4.4 37.4
Muslims 69.7 66.9 58.3 47.8 45 90.3 84.5 76.6 49.6 36.3 7.3 36.4
Christians 82.1 81.6 76.3 65.1 52.9 90 87.3 77.6 68 56.3 9.4 44
Sikhs 90.4 88.6 86.2 76.9 65.5 91 89.1 81.1 80.2 67.3 6.6 46
Buddhists 98.5 94.1 75.6 58 81.3 95.2 87.3 74.1 96 50.9 0.7 39.1
Others 69.3 75.3 53.8 42.3 20.7 91.9 84.3 79.5 41.4 27.2 7.9 25.8
Source: Published figures from National Family Health Survey - III, 2005-06
9.1.7. Child Immunization
Child immunization is a primary health precaution, promoted and provided by
the state. Awareness and access to this basic health care services could potentially
shed a lot of light on the inter-community differences in awareness and access
levels and hence in the level of group development. Across the religious groups,
we find BCG immunization percentage at the lowest, around 70 per cent,
beginning with the others and reaching as high as 98 per cent for the Buddhists.
The Sikhs too boast of a 90 per cent . The Christians and Hindus come at around
the 80 per cent with the Muslims at the lowest with around 70 per cent. For DPT
and polio, let’s look at the incidence of complete vaccination, i.e. providing the
child with all the required dosages. With DPT we find that the Sikhs and the
Christians leading the fray with 76 per cent and 65 per cent respectively. The
Buddhists and the Hindus follow next at 58 per cent and 56 per cent respectively.
The lowest rates are again seen for the Muslims and the other. The performance
for polio vaccination is much better across all the groups. The lowest rates are
seen for the Buddhists and the Muslims at 74 per cent and 76 per cent
respectively. The highest rates are displayed by the Sikhs and the others of 81 per
cent and 80 per cent respectively. Measles inoculation is highest amongst the
Buddhists and the Sikhs, followed by the Christians, the Hindus,the Muslims and
40
others. Overall basic vaccination trend reveals the Sikhs doing the best at 67 per
cent. Next we find the Buddhists and the Christians at around 50 per cent and 56
per cent. The Hindus and Muslims follow next with the other with the lowest
inoculation rates.
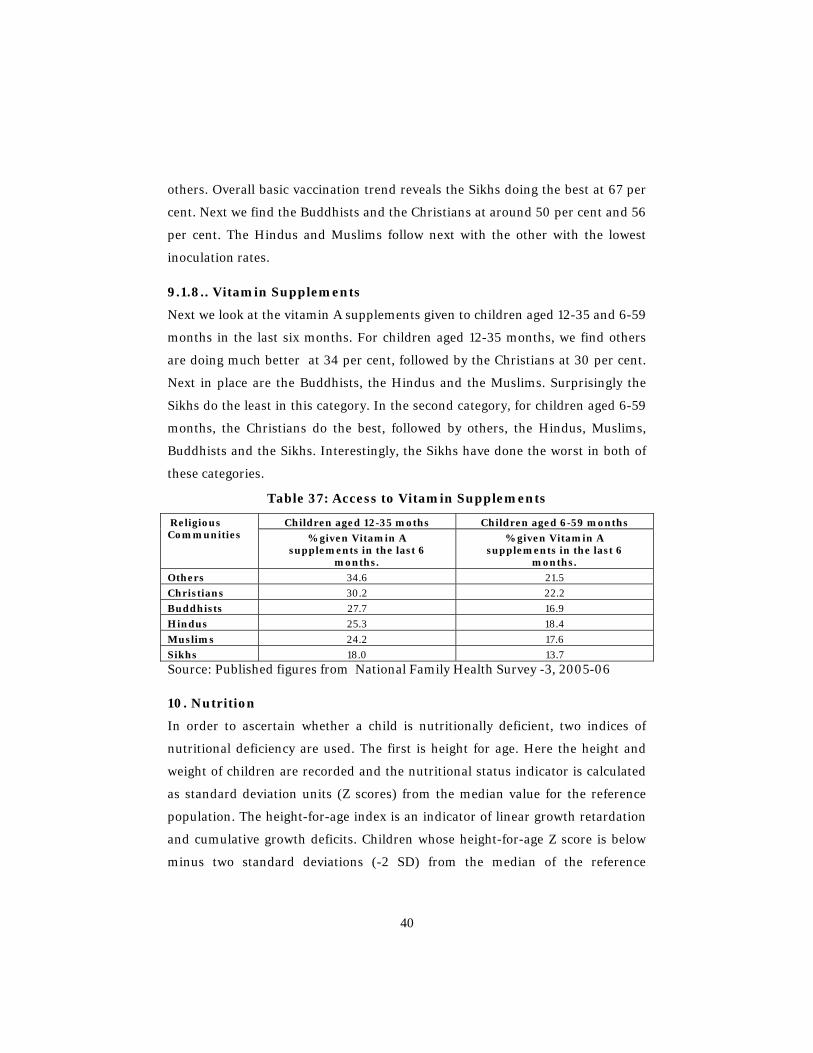
9.1.8.. Vitamin Supplements
Next we look at the vitamin A supplements given to children aged 12-35 and 6-59
months in the last six months. For children aged 12-35 months, we find others
are doing much better at 34 per cent, followed by the Christians at 30 per cent.
Next in place are the Buddhists, the Hindus and the Muslims. Surprisingly the
Sikhs do the least in this category. In the second category, for children aged 6-59
months, the Christians do the best, followed by others, the Hindus, Muslims,
Buddhists and the Sikhs. Interestingly, the Sikhs have done the worst in both of
these categories.
Table 37: Access to Vitamin Supplements
Religious Communities
Children aged 12-35 moths Children aged 6-59 months
% given Vitamin A supplements in the last 6
months.
% given Vitamin A supplements in the last 6
months.
Others 34.6 21.5
Christians 30.2 22.2
Buddhists 27.7 16.9
Hindus 25.3 18.4
Muslims 24.2 17.6
Sikhs 18.0 13.7
Source: Published figures from National Family Health Survey -3, 2005-06
10. Nutrition
In order to ascertain whether a child is nutritionally deficient, two indices of
nutritional deficiency are used. The first is height for age. Here the height and
weight of children are recorded and the nutritional status indicator is calculated
as standard deviation units (Z scores) from the median value for the reference
population. The height-for-age index is an indicator of linear growth retardation
and cumulative growth deficits. Children whose height-for-age Z score is below
minus two standard deviations (-2 SD) from the median of the reference

41
population are considered short for their age (stunted) and are chronically
malnourished. Children below minus three standard deviations (-3 SD) from the
median of the reference population are considered to be severely stunted.
Stunting reflects failure to receive adequate nutrition over a long period of time
and is also affected by recurrent and chronic illness. Height-for-age, therefore,
represents the long-term effects of malnutrition in a population and does not
vary according to recent dietary intake.
Weight-for-age index is a composite indicator of height-for-age and weight-for-
height records. It takes into account both acute and chronic malnutrition.
Children whose weight-for-age status is below minus two standard deviations
from the median of the reference population are classified as underweight.
Children whose weight-for-age status is below minus three standard deviations (-
3 SD) from the median of the reference population are considered to be severely
underweight.
Table 38: Nutrition Levels across Religions
Religious Communities
Height-for-age Status Weight-for-age Status
Percentage
below
-3 SD
Chronically malnourished
Percentage
Below
-2 SD1
Severely malnouris
hed
Mean Z-
score
(SD)
Percentage below
-3 SD
Chronically malnourished
Percentage below
-2 SD1
Severely malnouris
hed
Percentage
Above
+2 SD
Mean Z-
score
(SD)
Hindus 23.4 48 -1.9 16.1 43.2 0.3 -1.8
Muslims 26.2 50.3 -2 15.6 41.8 0.4 -1.8
Christians 17.9 39 -1.5 8.7 29.7 0.9 -1.4
Sikhs 13.4 29.8 -1.3 7.8 22 0.7 -1.1
Buddhists 23.2 56.1 -1.9 14.7 39.2 0.8 -1.7
Jains 5.9 31.2 -1.2 6.6 24 0 -1.3
Others 34 58.5 -2.2 35.4 62.7 0.1 -2.4
Note: Percentage of children under age five years classified as malnourished according to two anthropometric indices of nutritional status: height-for-age and weight-for-age, by background characteristics, India, 2005-06
Source: Published figures from National Family Health Survey - III, 2005-06
42
Now looking at the height–for-age indicator across religious groups and the
chronically malnourished, we find the incidence to be the highest amongst others
at 34 per cent. Amongst the major groups, it is highest amongst the Muslims
(26%) followed by the Hindus and the Buddhists (23%). Lower rates are seen for
the Christians, Sikhs and the lowest for the Jains at 6 per cent. Moving to sever
malnutrition, we see other category still doing the worst and the Hindus,
Buddhists and the Muslims continuing to perform as earlier, except for
Buddhists, who show higher rates than the Hindus. Again the Christians, Sikhs
and the Jains show the lowest rates.
Nutritional deficiency in terms of the weight for age index indicates that, just as
for the earlier index, the incidence of chronic malnourishment is the highest for
the others and amongst the major groups, is again higher for the Hindus,
Muslims and the Buddhist. Christians, Sikhs and Jains follow with the lower
rates just as earlier. We find the same relative pattern of positioning repeating
itself for the severely malnourished category.
On the whole therefore the Hindus, Muslims and the Buddhists perform the
worst in terms of child nutrition while the Jains, Sikhs and the Christians do the
best.
10.1.. Prevalence of Anemia among Children
Another indicator of child health is the prevalence and level of anemia among
children of various religious communities. Anemia is defined as low level of
hemoglobin in the blood. As hemoglobin carries oxygen from the lungs to the
entire body, lack of it in children can lead to impaired cognitive performance,
behavioural and motor development, coordination, language development
scholastic achievement as well as increased morbidity from infectious diseases.
The table below gives the level of anemia detected, after taking blood samples
from children across religious groups.

43
Table 39: Percentage of Children of 6-59 Months Classified as Having Aanemia, by Background Characteristics, India, 2005-06
Religious Communities
Anemia status by Hemoglobin level
Mild (10.0-10.9 g/dl)
Moderate (7.0-9.9 g/dl)
Severe (<7.0 g/dl)
Any anemia (<11.0 g/dl)
Muslims 28.4 38.5 2.8 69.7
Others 26.4 48.7 3.9 78.9
Hindus 26.1 40.7 3 69.7
Christians 25.6 32.5 1.9 60
Sikhs 22.3 35.9 5.7 63.8
Jains 20.1 36.1 0 56.2
Buddhists 15.9 49.9 0.2 66
Note: Table is based on children who stayed in the household the night before the interview. Prevalence of anemia, based on hemoglobin levels, is adjusted for altitude using formula in CDC (1998). Hemoglobin in g/dl = grams per deciliter. Table excludes Nagaland.
Source: Published figures from National Family Health Survey - III, 2005-06
If we look across the three categories, no clear patterns emerge in terms of
consistent trends. If we concentrate on mild and severe levels of anemia, we find
that others, the Hindus and the Muslims show the same levels. Across all the
groups, we find that a majority of the children suffer from moderate anemia
followed by mild and lastly severe levels. Highest incidence of severe anemia
population is seen surprisingly for the Sikhs (5.7%) then others (3.9%) and the
Muslims (2.8%). Amongst the moderate levels, the Buddhists show the highest
percentage, followed by others, the Hindus and the Muslims. Therefore, on the
whole, it’s others, the Hindus and the Muslims who have large shares
corresponding to high levels of anemia.
10.2.. Iodization of Children and Women.
Iodine is an essential micronutrient and the lack of it in the diet can lead to the
Iodine Deficiency Disorder (IDD). The IDD can cause miscarriages, still births,
brain disorders and retarded psychomotor development, speech and hearing
impairments and lower levels of energy among children. Studies suggest that
around 200 million Indians face the risk of iodine deficiency (Vir 2002,) while an
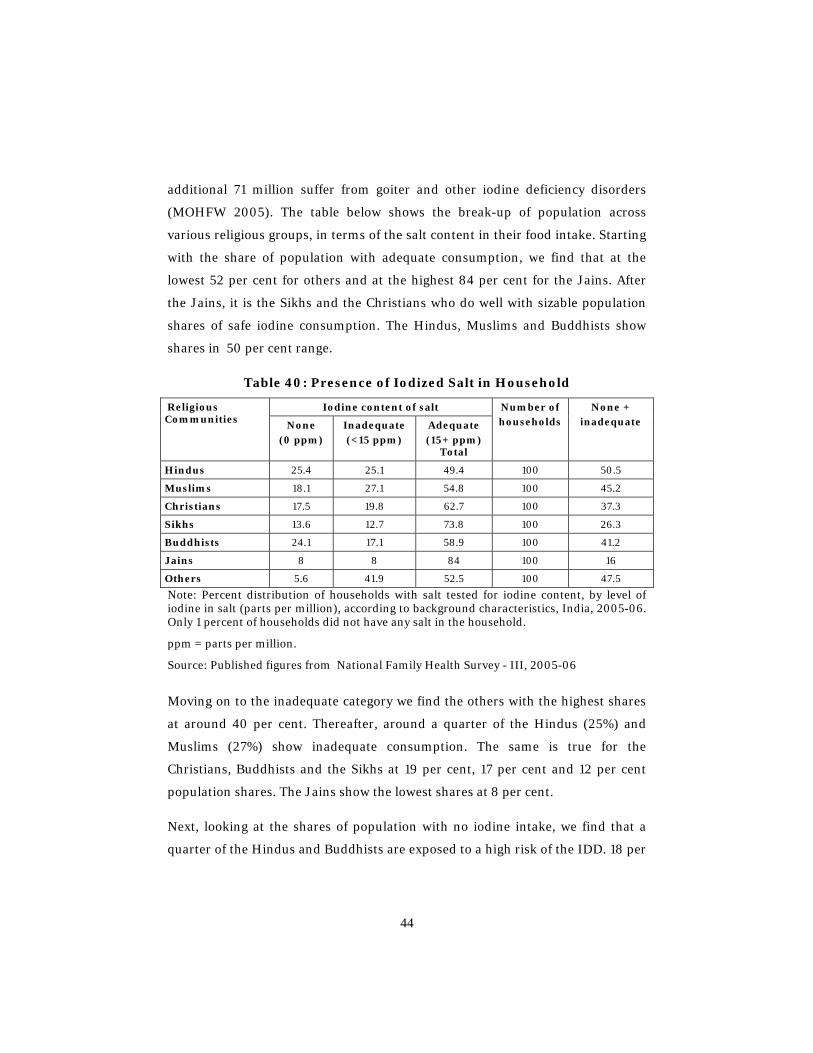
44
additional 71 million suffer from goiter and other iodine deficiency disorders
(MOHFW 2005). The table below shows the break-up of population across
various religious groups, in terms of the salt content in their food intake. Starting
with the share of population with adequate consumption, we find that at the
lowest 52 per cent for others and at the highest 84 per cent for the Jains. After
the Jains, it is the Sikhs and the Christians who do well with sizable population
shares of safe iodine consumption. The Hindus, Muslims and Buddhists show
shares in 50 per cent range.
Table 40: Presence of Iodized Salt in Household
Religious Communities
Iodine content of salt Number of households
None + inadequate None
(0 ppm) Inadequate (<15 ppm)
Adequate (15+ ppm)
Total
Hindus 25.4 25.1 49.4 100 50.5
Muslims 18.1 27.1 54.8 100 45.2
Christians 17.5 19.8 62.7 100 37.3
Sikhs 13.6 12.7 73.8 100 26.3
Buddhists 24.1 17.1 58.9 100 41.2
Jains 8 8 84 100 16
Others 5.6 41.9 52.5 100 47.5
Note: Percent distribution of households with salt tested for iodine content, by level of iodine in salt (parts per million), according to background characteristics, India, 2005-06. Only 1 percent of households did not have any salt in the household.
ppm = parts per million.
Source: Published figures from National Family Health Survey - III, 2005-06
Moving on to the inadequate category we find the others with the highest shares
at around 40 per cent. Thereafter, around a quarter of the Hindus (25%) and
Muslims (27%) show inadequate consumption. The same is true for the
Christians, Buddhists and the Sikhs at 19 per cent, 17 per cent and 12 per cent
population shares. The Jains show the lowest shares at 8 per cent.
Next, looking at the shares of population with no iodine intake, we find that a
quarter of the Hindus and Buddhists are exposed to a high risk of the IDD. 18 per

45
cent, 17 per cent and 13 per cent belonging to the Muslims, the Christians and the
Sikhs respectively do not consume iodine at all. The lowest shares are seen for
the Jains and others. Thus, on the whole, we find the Hindus, others and the
Muslims showing large shares of their population with either no or inadequate
iodine consumption. The Jains and the Sikhs show the lowest consumption of
iodine.
The detailed analysis done above considering economic, health and social
indicators of well-being of religious communities shows substantial variations
across these groups in their level and nature of development. While many of the
differences in their well-being can be explained by cultural differences and
beliefs, many arise due to the differences in group strength in terms of numbers,
level of education, group cohesiveness, economic endowment and their political
awareness and clout. The Jains are a case in point. Despite being one of the
smallest groups they are the most well educated, prosperous and also quite
politically influential in India. The Muslims, on the other hand, despite being the
second largest religious community in India lack significant education levels as
well as general socio-economic standing. If we choose eight different measures of
economic well-being and observe which groups perform the worst and which
least, we find that those falling in the others, Zoroastrians and the Muslim
categories show up across most of the eight chosen indicators. They are followed
by the Buddhist, Hindus and Sikhs. The Christians and the Jains show up the
least number of times.These relative positions of groups get further entrenched
by inter-group competition arising from differences in religious beliefs and
animosity. Thus groups who are performing well continue to do so and those
lagging behind find it difficult to change or improve their lot over time, while
jostling for religious, economic and political space. The importance of religious
beliefs on individual’s well-being, therefore, cannot be over emphasized,
especially in developing countries like India, where the old socio-cultural norms
and community-based living is constantly at loggerheads with the new liberal
melting pot of global capitalism. The way forward will be a tricky one trying to

46
balance people’s faith and exposing them to modern, liberal rationalism. A
modern common education curriculum across the country would lay the
foundations for developing a strong sense of identity, rooted in citizenship based
on equality of access, rights and opportunity. This approach would definitely be
necessary if the majority of the nation’s population, namely the youth are looking
to forge newer identities based on education and professional skills in the fast
growing global market/economic environment.

47
Appendixes:
Data Sources and Variables
The various data sets from which the socio-economic variables are chosen are
given as follows:
I. Data Set 1: Census of India, 2001: Coverage – All India, Rural
Urban, Male, Female.
Variables
Population size: The share of each religious group across rural and urban
regions and across male and female population in the country.
Gender-wise distribution across religious groups, at all India level. The
share of male and female population, from each religious group, in the
total gender distribution, determined at all India level..
Rural-urban distribution across religious groups.
Adult literacy rates will be ascertained across religious groups and by
rural, urban and male, female population at all India levels.
Average household size across religious groups and within these groups
across rural-urban divide. This will indicate fertility levels which have
implications for household poverty.
Data Set 2: National Sample Surveys Consumption Expenditure
Survey, 2004-2005.
Coverage – All India, Rural,Urban Regions

48
Variables:
• Education
o Enrollment rates (6-14 years) for boys and girls across religious
groups and across the rural-urban divide at all India level. (In
India, enrollment in Grade 1 is possible only after age of 6 years.)
Percentage of boys and girls enrolled in primary,
secondary and tertiary education.
Ratio of girls to boys, enrolled in primary, secondary and
tertiary education.
o Percentage of boys and girls across religious groups who have
never ever attended school and also those who attended but
dropped out before finishing primary level education. Percentage
of adults who have at least primary, middle, secondary, higher
secondary, graduation, technical graduation, diploma education.
• Poverty
o Poverty incidence across religious groups. The Planning
Commission sets the annual poverty line (poverty line for
2004/5; rural = Rs 211.30 or $5.28, urban = Rs 454.11 or
$11.35). Though it is calculated at the household level, it is also
applicable to individuals. These vary across states as well. The
dollar-a-day poverty line would translate into Rs 1,200 monthly
for both rural and urban areas.
o Share of the poor in religious group in the all India poor.
o Probability of being poor given religious background.
o Mean per-capita consumption.
o Ginni coefficient.
• Employment ( Age 15-64 years)
o Rate of unemployment. Emphasizing the young people, between
15 and 24 years of age.
49
o Work participation rate. Also for the age group 15-24 Years.
o Share of self-employed in agriculture, agricultural labour, and
other labour, self-employed in non-agriculture in total rural
population of religious groups.
o Share of self-employed house hold enterprise, regular
salaried/wage earners and casual workers in the total urban
population of religious groups.
o Participation percentages across industry type, such as
agriculture, fishing, manufacturing, construction, mining,
quarrying, etc., in all 17 industries based on National Industrial
Classification (1998).
• Land Ownership
o Average land owned across religious groups at household level
o Share of different religious groups across land ownership classes
Data Set 3: National Family Health Survey, 2005-2006 (Disaggregated
analysis at religious level)
This was supposed to look at the 1992/3 and 1998/9 surveys as well, to identify
trends – is there a reason this was not done, at least for a few of the most
important variables e.g. infant mortality?
Variables:
• Health of Pregnant Mother
o Immunization – Tetanus
o Place of most recent delivery.
o Assistance during delivery)
o Maternal mortality index
• Child
o Mortality of infants (<1 yrs) and children (<5 yrs)
o Morbidity
Incidence of ARI ( Acute Respiratory Illness )

50
Fever, diarrhea
Cough, fever
Asthma, tuberculosis, jaundice
Malaria
o Child immunization, includes BCG,DPT, Polio and Measles
o Vitamin A supplement
o Access to treatment in case of fever, diarrhea, ARI.
• Nutrition and Prevalence of Anemia
o Percentage of children under 5 years that are underweight ( the
indicators are weight for age and height for age)
o Anemia in children and women
o Iodization of children and women.
o Maternal and reproductive health


