Forschungsinstitut zur Zukunft der Arbeit Institute for the Study of Labor DISCUSSION PAPER SERIES Religious Riots and Electoral Politics in India IZA DP No. 9522 November 2015 Sriya Iyer Anand Shrivastava
Transcript
Forschungsinstitut zur Zukunft der ArbeitInstitute for the Study of Labor
Any opinions expressed here are those of the author(s) and not those of IZA. Research published in this series may include views on policy, but the institute itself takes no institutional policy positions. The IZA research network is committed to the IZA Guiding Principles of Research Integrity. The Institute for the Study of Labor (IZA) in Bonn is a local and virtual international research center and a place of communication between science, politics and business. IZA is an independent nonprofit organization supported by Deutsche Post Foundation. The center is associated with the University of Bonn and offers a stimulating research environment through its international network, workshops and conferences, data service, project support, research visits and doctoral program. IZA engages in (i) original and internationally competitive research in all fields of labor economics, (ii) development of policy concepts, and (iii) dissemination of research results and concepts to the interested public. IZA Discussion Papers often represent preliminary work and are circulated to encourage discussion. Citation of such a paper should account for its provisional character. A revised version may be available directly from the author.
IZA Discussion Paper No. 9522 November 2015
ABSTRACT
Religious Riots and Electoral Politics in India* The effect of ethnic violence on electoral results provides useful insights into voter behaviour in democratic societies. Religious riots have claimed more than 14,000 lives in India since 1950. We study the effect of Hindu-Muslim riots on election results in India. We combine data on riots, which have been geo-coded, with electoral data on state legislature elections and control variables on demographics and public goods provision to construct a unique panel data set for 16 large states in India over a 21 year period from 1981-2001. We suggest a new instrument that draws upon the random variation in the day of the week that important Hindu festivals fall on in each year, as set by a lunar calendar. The probability of a riot increases if a Hindu festival falls on a Friday, the holy day for Muslims. This allows us to isolate the causal effect of riots on electoral results. We also correct for under-reporting of riots and how they affect electoral outcomes in nearby districts. We find that riots occurring in the year preceding an election increases the vote share of the Bharatiya Janata Party by 5 to 7 percentage points in the election. JEL Classification: Z12, D72, D74 Keywords: religion, elections, riots, India Corresponding author: Sriya Iyer Faculty of Economics University of Cambridge Austin Robinson Building Cambridge CB3 9DD United Kingdom E-mail: [email protected]
* This work has been funded by the Spiritual Capital Research Program, sponsored by the Metanexus Institute on Religion and Science, with the generous support of the John Templeton Foundation. We would also like to acknowledge funding support from the Gates Cambridge Trust, the Centre for Research in Microeconomics and the Faculty of Economics, Cambridge. We would like to thank Steven Wilkinson for generously sharing his data on religious riots from 1950-1995 in India. We are grateful to Rachana Shanbhogue, Paul Sweeny and Shreya Nanda for excellent research assistance. For their help, comments and suggestions, we are grateful to Toke Aidt, Jean-Marie Baland, Eli Berman, Guilhem Cassan, Partha Dasgupta, Sanjeev Goyal, Timothy Guinnane, Gabriel Leon, Hamish Low, Chander Velu, seminar and conference participants at the University of Namur, Paris School of Economics, PODER summer school, ASREC 2015 Boston, and Yale University.
1 Introduction
How do voters choose to cast their vote? This question fascinates economists and has
many answers (Ansolabehere, 2008). In models of rational choice voters maximise
their expected utilities under different candidates or parties and choose their votes ac-
cordingly (Downs, 1957). In keeping with these models, the factors influencing voting
behaviour include the allocation of public goods and public services, bureaucratic effi-
ening this model of voter behaviour, we can include identity in the individual voter’s
preferences, thus making the ethnic, religious or racial identity of the candidate or the
party an important factor in elections (Glaeser, 2005; Fearon, 1999). Identity politics
and conflict based on ethnic identity is widespread across the world. Our contribution
is to assess the impact of ethno-religious riots on the results of democratic elections.
Investigating this question provides insights into the direction and magnitude of the ef-
fect of ethno-religious polarisation, or increased salience of ethno-religious identity, on
voters’ decisions.
Our work is in keeping with an emerging literature that uses economic and statisti-
cal methods to evaluate the role of religion in society (see Iyer, 2016 for an overview).
As well, a much broader literature has been examining the effect of ethnic, social and
armed conflict on economic, demographic, developmental and political outcomes (Beck
and Tolnay, 1990; DiPasquale and Glaeser, 1998; Posner, 2004; Berrebi and Klor,
2008; Eifert, Miguel and Posner, 2010; Berman, Dinecco and Onoraro, 2015; Downey
and Felter, 2015; Michalopoulos and Papaioannou, 2015; Skaperdas, 2015). Some of
this research examines issues as diverse as ethnicity and geography, race riots, gang
violence, mobs and lynching, terror incidents, warfare, and counter-insurgency pro-
grammes. Our work on religious riots and electoral politics in India is in keeping with
this much broader concern of the different effects of historical conflict, social violence
and inter-group unrest on contemporary economic welfare and political economy.
2
Hindu-Muslim riots in India have been the subject of a number of studies, most of
which have examined what causes the riots. These causes are social (Brass, 1997, 2003;
Varshney, 2002), economic (Bohlken and Sergenti, 2010; Mitra and Ray, 2014, Field
et al, 2008) and political (Wilkinson, 2004; Jha, 2014; Pathania and Tandon, 2011;
Blakeslee, 2013; Nellis, Weaver and Rosenzweig, 2015). There are very few studies in
the economics of India which examine the political implications of the occurrence of
riots.
We investigate the effect of Hindu-Muslim riots on state government elections in
16 Indian states from 1981 to 2001. The riots data is obtained from a data set con-
structed first by Varshney and Wilkinson (2004) and extended by us, using individual
news reports on Hindu-Muslim riots from The Times of India (Mumbai) newspaper.
This event-study data is supplemented with electoral data from publicly available infor-
mation on state assembly elections. The delimitation document (Election Commission,
1976) is used to map electoral constituencies onto administrative districts. The riots
and electoral data combined with data on demographics and public goods provision
from decennial Indian Censuses are used to construct our unique dataset.
We examine the effect of riots occurring in a district in the year preceding an election
on the vote share obtained by the Hindu nationalist Bharatiya Janata Party (BJP) in the
election. We find that the effect is positive and significant and remains robust to using
different control variables and using fixed effects specifications to account for district-
specific unobservables. We establish the causal effect of riots on electoral results by
using a unique instrument for riots. Our instrument is a binary variable that takes the
value 1 when an important Hindu festival in a state in a given year falls on a Friday,
which is the holy day for Muslims. Anecdotal evidence suggests that religious riots
are exacerbated by festivals which are salient for particular religious groups, mainly
because these festivals are often associated with very visible public displays of religious
faith such as religious processions and collective worship. They are also associated with
contestations over public spaces. We hypothesize that such occurrences, whose dates
3
are based completely on lunar cycles, increase the probability of riots occurring and
find that the data supports this hypothesis. Using this variable to instrument for riots we
find a positive and significant causal effect of riots on the vote share of the BJP.
We also analyse the impact of possible under-reporting of riots on both our OLS
and IV estimates. We obtain a measure of under-reporting by comparing our dataset
to other sources and use the derived expressions for the biases to correct our estimates.
We also find that riots affect election outcomes in adjoining districts and that the effect
decays with distance. After correcting for under-reporting and distance, we find that a
riot in the year preceding an election can lead to an increase in the BJP’s vote share by
5 - 7 percentage points.
Establishing exogenous causes for riots has been a major methodological challenge
for similar studies. The major contribution of our paper is that it overcomes this chal-
lenge by using a unique religious festival instrument and demonstrates the magnitude
and direction of the effect of riots on electoral results. The most important implication
of our work is that it provides a basis for the argument that the majority identity party
has a clear incentive to incite ethnic tensions or even to cause riots. Recent events in In-
dia have shown that this was used as a strategy in western Uttar Pradesh (Muralidharan
2014; Rao et al 2014).
Section 2 provides a brief historical background of inter-communal relations and
electoral politics in India and reviews the literature on identity politics and ethnic vio-
lence, both in India and more widely. Section 3 contains a description of the data used.
Section 4 explains the econometric specification and describes the instrument used to
identify the causal effect of religious riots on election results. Section 5 describes the
regressions and their results. Section 6 concludes.
4
2 Religious Riots and Indian Electoral Politics1
The history of religious riots and politics in India can be divided into 4 phases: pre-
Independence, between 1947-1980, between 1981-2001, and from 2001 to the present.
In India, there is evidence of religion-related incidents of violence as early as 1714
with a number of riots being reported in the eighteenth and nineteenth centuries.2 How-
ever, communal incidents were not a regular aspect of provincial life in the nineteenth
century (Indian Statutory Commission Report, 1930: 97-107). In the early twenti-
eth century, there were localised riots in eastern and northern India.3 In southern and
western India, there were no significant riots until 1928 when they affected Bangalore,
Nasik, Surat and Hyderabad. There were major riots in Calcutta and Bombay in 1926
and 1928 (see Iyer, 2002 for a more detailed discussion).
As the movement against colonial rule led by the Indian National Congress gathered
momentum, domestic politics began to be more communalised. The Muslim League
which claimed to represent the Muslims of the country, expressed mistrust in the secular
rhetoric of the Congress, claiming that it represented the interests of Hindus only. The
Civil Disobedience movement of 1942 yielded fresh outbursts of communal violence,
which have been attributed by some historians to imperial forces that tried to control
the struggle for independence (Sarkar, 1981). With the end of British rule imminent,
the Muslim League’s demand for the partition of India along religious lines became the
flash point. Serious communal clashes took place, at times repeatedly, in Ahmedabad,
Calcutta, Noakhali, Bhagalpur, Dacca, Patna, Bombay and Allahabad in 1946-47. The
riots leading up to and continuing through the eventual partition of India and the creation
1Our account here of the political history of post-Independent India draws heavily on the work ofGuha (2007). The history of religious riots is drawn from Iyer (2002).
2In the eighteenth century, there were communal riots in Ahmedabad in 1714; in Kashmir in 1719-20, in Delhi in 1729 and in Vidarbha in 1786. For the nineteenth century, historians report evidenceof incidents in Benaras (1809-15), Koil (1820), Moradabad and Kashipur (1833), Bareilly, Kanpur andAllahabad (1837-52) (Bayly 1983).
3East Bengal (1907), Peshawar (1910), Ayodhya (1912), Agra (1913), Shahabad (1917) and Katarpur(1918). Between 1920 and 1924 there were riots in Malegaon, Multan, Lahore, Saharanpur, Amritsar,Allahabad, Calcutta, Delhi, Gulbarga, Kohat, Lucknow and Nagpur.
5
of Pakistan remain the most devastating episode of communal violence in modern India
with estimates of the death toll ranging from 200,000 to 1 million people (Pandey,
2001).
After gaining independence in 1947, India formally became a democratic repub-
lic and adopted a written constitution in 1950, with the first general elections being
held in 1951. Although the Indian National Congress (INC), the party credited with
fighting for independence and then establishing a functioning democracy in India, had
had uninterrupted control of the central government under Prime Minister Jawaharlal
Nehru, its control was by no means unchallenged. Among the many parties opposing
the Congress was the Bharatiya Jana Sangh (BJS), a Hindu nationalist party formed in
1951 by Shyama Prasad Mukherjee, who resigned from Nehru’s cabinet, in consulta-
tion with the Rashtriya Swayamsevak Sangh (RSS), a Hindu nationalist social organi-
sation. Although there were other smaller Hindu nationalist parties such as the Hindu
Mahasabha and the Rama Rajya Parishad, the BJS was the main representative of the
Hindu nationalist view. Its vote share grew from 3% in the first national elections in
1951 to 14% in the fifth national elections in 1971.
Post-independent India from 1947 to 1949 is not part of our dataset although riots
in the aftermath of partition continued during this period. In fact 1950, the first year
in our dataset, has the highest number of reported riots, 50, till the 1980s. The period
from 1950-1976 was relatively calmer with an average of about 16 riots reported per
year. The period that we are concerned with in this paper, 1981-2001, witnessed a much
higher rate of incidents of about 47 riots reported per year from across the country. The
political events that accompanied this increase in violence are described below.
The 1970s saw division in the ranks of the INC and the Prime Minister Indira Gandhi
adopting increasingly populist rhetoric to counter it. Democracy was suspended by
Indira Gandhi with the imposition of Emergency in 1975. Leaders of opposition parties
including BJS were arrested and the press was censored. The Emergency was lifted in
1977 and elections were conducted at the centre as well as in several states. The Janata
6
Party, an agglomeration of parties ranging from the left-leaning Socialist Party to the
Hindu nationalist BJS, came to power to form the first non-Congress government at the
centre since independence. The government was short lived and collapsed in 1980. The
next round of elections saw the resurgence of the INC under Indira Gandhi at the centre
as well as in several states. The leaders of the erstwhile BJS left the Janata party to
regroup and formed the Bharatiya Janata Party (BJP) in 1980.
The INC retained control of the centre first under Indira and later under her son
Rajiv Gandhi, till 1989. The assassination of Indira Gandhi by her Sikh bodyguards in
1984 was followed by a spate of anti-Sikh riots. During this time, the BJP along with
other subsidiary associations of the RSS started a movement to build a temple at the site
of the disputed Babri Mosque or Babri Masjid in Ayodhya. The movement helped the
BJP gain popular support and it came to power in several states. In the general election
of 1989 the BJP gathered 11% of the votes and was the third largest party in parliament
after the INC and the Janata Dal, a centrist remnant of the erstwhile Janata Party. It
supported a government of the National Front, a coalition of the Janata Dal with some
regional parties, under Prime Minister V.P. Singh. This government also did not last
long, with the BJP withdrawing support primarily because of V.P. Singh’s efforts to
stop the Babri Masjid agitation being supported by the BJP. In the subsequent elections
in 1991, the BJP gathered 20% of the votes and established itself as the main opposition
party to the INC government led by P.V. Narasimha Rao. In December 1992, the Babri
Masjid movement led by the BJP culminated in the demolition of the disputed structure
by militant Hindu nationalists. A spate of riots erupted in different parts of the country
including Mumbai and Surat.
These riots were followed by a period of comparative calm till 2001. During this
time a BJP led government came to power for the first time in 1996, albeit only for a
period of 13 days. Eventually the BJP led National Democratic Alliance ruled at the
centre from 1998 to 2004. In 2002, a series of riots erupted in the state of Gujarat, where
BJP leaders were allegedly directly involved. These riots left at least a thousand people
7
dead and forced approximately 98,000 people into refugee camps (Jha 2014). This was
followed by a period of relative calm until 2013, when riots again broke out in Kishtwar
in Jammu and in Muzaffarnagar in Uttar Pradesh. The involvement of political leaders
in both these riots has been the subject of many articles (Muralidharan 2014; Rao et al
2014) and the results of the general elections overwhelmingly and in an unprecedented
manner favoured the BJP in both these regions. The question of whether this substantial
swing towards the BJP was because of the riots or was part of a nation-wide swing that
led to the party’s victory in the elections, is difficult to answer. This paper answers
exactly the same question, but for previous state elections during 1981-2001 and finds
that riots did indeed contribute substantially to increasing the BJP’s vote share in that
period.
2.1 Riots and politics
An overview of the literature examining the causes and the relationship between ethnic
politics and ethnic violence is found in Fearon (2008). He concludes that the rela-
tionship between the two has not been adequately addressed. Ethno-religious conflicts
themselves have been widely researched. Arguably starting with Horowitz (1985), the
study of the causes of ethnic conflict has generated a substantial literature. Esteban and
Ray (2008) describe how economic polarisation along ethnic lines can lead to ethnic
conflict. DiPasquale and Glaeser (1998) focus on the 1960’s urban race riots in the USA
and find that the individual costs and benefits of rioting, in terms of the probability and
size of punishment, unemployment and ownership of property, matter. Hindu-Muslim
riots in India have also been well documented: for example, Varshney (2002) describes
the role of civic institutions in preventing inter-ethnic violence. Bohlken and Sergenti
(2010) find that low economic growth increases the probability of riots occurring, while
Mitra and Ray (2014) find that growth in Muslim per-capita expenditures increases the
chances of future communal violence while the increase in Hindu per-capita expendi-
8
tures has negative or no effect. Field et al (2008) find that rent control restricted the
locational choices of workers thus preventing segregation and hence leading to riots in
Gujarat. These examples show that the causes of riots are complex, multi-faceted, and
may be social, political or economic. The findings on economic and social causes of
riots does not preclude the presence of other factors such as electoral politics. However,
since communal riots were happening in India before electoral politics existed in the
country, this cannot be their sole cause.
The relationship between electoral politics and Hindu-Muslim riots in India has
been explored in a few studies. Wilkinson (2004) shows that riots are less likely in
states with higher effective number of political parties and where the ruling party de-
pends on minority votes. At the local level, using data from 167 towns in the state of
Uttar Pradesh, he finds that higher electoral competition measured as the closeness of
state elections in towns leads to the higher likelihood of riots. Varshney and Gubler
(2012) present criticisms of both results. They suggest that the role of the state govern-
ments might have been overstated with respect to the first result and they raise certain
methodological objections about the mapping of electoral constituencies onto towns for
the second one. Wilkinson’s second result finds support from Jha (2014), whose study
focussed on the state of Gujarat finding that close elections do indeed predict a higher
likelihood of riots at the level of towns. Jha (2014) also finds significant effects of
historical inter-ethnic relationships on the duration of riots.
Apart from electoral competition, another strand of the literature focusses on the
relationship between the electoral results of the majority identity party, in this case the
Bharatiya Janata Party (BJP) and the incidence of riots. Pathania and Tandon (2011)
investigate the relationship between the BJP’s results in the 1989 and 1991 national
elections and the incidence of riots. They find that the share of close elections won by
the BJP is positively correlated with the severity of subsequent riots, as measured by
the number of people killed or injured or as the duration of the riot. They do not find
any correlation between the results of the BJP and the frequency of riots. They do find
9
a correlation between riots and the number of close elections, similar to the electoral
competition literature discussed above. Nellis, Weaver and Rosenzweig (2015) find
that a victory of the Indian National Congress in close elections for the state assembly
between 1962 and 2000 led to a reduction in Hindu-Muslim riots. Blakeslee (2013)
shows that the BJP’s campaign involving its leaders touring northern India as part of
the Babri Masjid agitation led to an increase in the party’s vote share in the subsequent
national elections in 1991, as well as an increase in the probability of riots.
Although many scholars refer to the relationship between riots and politics, more so
in the case of India, there have been few studies of the effect of ethnic violence on elec-
toral politics. Blattman (2009) finds that in northern Uganda, violence led to increased
political participation in the form of increased voting and community leadership. Aidt
and Franck (2015) show that the so-called Swing riots in England in 1830-31 increased
the votes polled by pro-electoral reform politicians. In India, although the causes of
riots and the role political competition may play in them have been studied in great
detail, there is no evidence regarding the impact of the riots themselves on electoral re-
sults. The assessment of this impact is essential to understand the incentives that ethnic
identity-based political parties have in planning their electoral strategy.
In the Indian context, Jha (2014) finds a positive correlation between the duration
of riots and an increase in BJP’s vote share but makes no attempt to establish a causal
relationship. The main focus of the paper is the effect of historical inter-ethnic rela-
tionships on present day inter-ethnic dynamics reflected in riots and elections. Brass
(2003) in his detailed study of riots and politics in Aligarh in Uttar Pradesh describes
the complex relationship between politics and ethnic relations. He writes,
“The gist of my argument on the relationship between party politics and ri-
ots were stated in one of my earlier works as follows: “there is a continuum
from political rivalry leading to communal riots to political rivalry feeding
on communal riots.” The continuum may, however start at either end, that
is, from political rivalry to riots as well as from communal riots to intensi-
10
fied political rivalry. However, the sequence in Aligarh has been primarily
in the latter direction, that is, communal riots have preceded and have led to
intensification of interparty competition. The mechanisms that lead to this
intensification arise from the tendencies that follow from riots to foster in-
creased communal solidarity and polarization, which in turn are promoted
by political parties and/or individual candidates who stand to benefit from
such solidarity and polarization. The resultant communalization and polar-
ization in turn reduce the electoral prospects of parties and candidates who
stand for secular political practices, intercommunal cooperation, and class
or caste/baradari mobilization rather than communal mobilization.”
It is this change in “electoral prospects” that we attempt to elucidate more clearly in this
paper.
3 Data
India has a quasi-federal system of government where power is shared between the cen-
tral government and the state governments. The control over law and order, and hence
the handling of riots, is within the state government’s ambit. As of 2000, India consisted
of 25 states. For this analysis we only look at large states with population greater than
10 million as at the 2001 census. There are sixteen such states that account for 96% of
India’s population. These states are Andhra Pradesh, Assam, Bihar, Gujarat, Karnataka,
Kerala, Madhya Pradesh, Maharashtra, Orissa, Rajasthan, Tamil Nadu, Uttar Pradesh
and West Bengal. This includes three states – Jharkhand, Chattisgarh and Uttarakhand
- that were created in 2000. We collected data for 21 years from 1981 to 2001. Data
for all variables is consolidated at the level of the district. These are administrative di-
visions and most public data is available at this level. Over time the districts have been
divided and merged to create new ones. We use the district as defined in the delimitation
order released by the Election Commission of India in 1976 and match the rest of the
11
data to that. This gives us a panel dataset of 339 districts over 21 years.
3.1 Elections
Electoral data for state elections was collected from statistical reports released by the
Election Commission. We have used data from state elections rather than from national
elections as there were only six national elections during the 21 year period and it
would be difficult to disassociate the effects of the elections with that of random events
happening coterminously. If we consider state elections then there were elections in at
least one of the sixteen states in 18 of the 21 years in consideration.
India has a five-year electoral cycle.4 So, we have at least four and at most five elec-
tions for every state except Jammu and Kashmir, and Punjab, which have three, in this
twenty-one year period. Only state-wide election results were considered – by-election
results were ignored. Each state has a number of electoral constituencies, ranging from
87 for Jammu and Kashmir to 425 for Uttar Pradesh that elect representatives for the
state legislative assemblies. These electoral constituencies are grouped into adminis-
trative districts each containing on average eleven constituencies. We use the district
instead of the electoral constituency as our geographical unit as all the other data is
available at district level. It is still a reasonably small unit since we have 339 districts
in the 16 states we are considering. We aggregate the election data that is available at
the constituency level to the district level using the official delimitation order (Election
Commission, 1976). We construct the vote share of a party as a fraction with the numer-
ator being the total votes polled by the party in the district and the denominator being
the total number of valid votes cast in all those constituencies in the district in which
the party fielded a candidate. The main dependent variable we use is the vote share of
the BJP in a district in an election.
We also construct a control variable BJP government, which is a binary variable that
4Sometimes early elections are called due to various reasons like no party getting a clear majority orthe state government being dismissed by the central government)
12
has a value of 1 when the BJP is part of the state government for a given district in a
given year. This is important because which party controls the state government may
play an important role in influencing both electoral results and the occurrence of riots.
3.2 Riots
Our main explanatory variable is the occurrence of riots. Data for the riots that oc-
curred between 1980 and 2000 in these 16 states was extracted from a larger dataset
that extends from 1950-2006. The initial dataset from 1950-1995 was constructed by
Varshney-Wilkinson (2004) and it was extended using individual newspaper reports on
riots from the Mumbai edition of The Times of India, held in the India Office archives
of The British Library. Most of the observations included the names of towns, villages,
and in some cases districts. Using this information, each riot happening in one of the
16 states was matched with one of the 339 districts. The data includes the number of
riots that occurred in a year, the duration of the riots and the reported cause of the riot.
Since each observation is a newspaper report of a riot, the actual intensity of the riot
that is being reported varies. As shown in Table 1, there are riots that go on for many
days. In other cases, reports of riots from the same place are reported over several days
and are hence coded as separate riots in our data. So, it is acknowledged that there is
some ambiguity over the intensity of violence that each reported incident represents.
For this reason we choose to focus on the extensive rather than on the intensive margin.
We construct the primary variable of concern as a binary variable indicating if at least
one riot occurred in a given district in a given year. Of a total of 7119 district-year
observations, 499 had at least one riot, so the unconditional probability of having at
least one riot in a year in a district is 7%.
We also geo-coded the location of each riot. Mapping this on to the location of each
district allowed us not only to assign the district in which the riot occurred but also to
measure the distance of any other district to the location of the riot.
13
Table I provides further details of our riots data. More than 70% district-years that
had riots had only one riot in that year. Most of the district-years that had riots had them
for only 1 day, but the number of observations of more than 5 days is also significant.
Figure 1 shows the variation in number of riots over years. Years 1986 and 1990 have
exceptionally high number of riots and we show later that our results are robust to
dropping these two years.
[Table I here]
[Figure 1 here]
3.3 Demographics and public goods
Demographics play an important role in electoral results and may also be a factor in
the occurrence of riots. Hence, we use religious demographic composition, urbanisa-
tion and literacy as control variables. The district-wise distribution of these across the
country was obtained from three Censuses from 1981 to 2001. A number of changes in
the organisation of districts have occurred between 1981 and 2001. A number of new
districts were created and old districts were re-named. We conducted a mapping of the
districts in each Census year compared to those in 1911. The value of these variables
in non-Census years was obtained by linearly interpolating between two consecutive
Censuses. Hence we obtain an approximate value of the variable in each year in each
district. Among these variables, one would expect the Muslim population share to play
an important role. The share of Muslims ranged from almost 0 to more than 98%. How-
ever, the distribution is highly skewed with the median at 8.7% and with three-fourths
of the districts having less than 14% of Muslims.
The provision of public goods may be a factor influencing the choice of voters.
Their effect on riots is not self-evident but there is some literature linking economic
factors to ethnic violence (Bohlken and Sergenti, 2010; Mitra and Ray, 2014) and we
use public goods provision to control for these effects. We again use Census data to
14
obtain the percentage of households that have access to tap water and the percentage of
households that have access to electricity. As before, we interpolate linearly between
Census years to obtain values for other years.
4 Econometric specification and identification strategy
We estimate the effect of riots on electoral results using this panel dataset. Our specifi-
cation is as follows. The subscripts have their usual meanings.
The coefficient βa has the same interpretation as the earlier coefficient. It implies
that the vote share of the BJP in state elections in a district will increase by βa if at least
one riot happened in the same district in the previous year. The first stage regression
with the instrument also has a simple interpretation. A Hindu festival falling on a Friday
may lead to a riot in the district or in nearby areas and the probability of it leading to a
riot decreases as the distance from the district increases.
To estimate this specification, we need to specify the function φ . We choose a
Gaussian decay function as it is simple and widely used. The selection of the standard
deviation for the distribution still poses a problem. In Table VI we tabulate the results
of regressions that include all controls, for a number of values of the standard deviation.
21
The average area of a district as of the 1981 Census was around 8000 square kilome-
tres5, which corresponds to a circle with radius of approximately 50 kms. Hence, we
start with a value of 100 kms and increase in steps of 50 kms. The coefficient is rela-
tively stable and is approximately in the range of 0.065 to 0.08 for the standard deviation
up to the value of 300 kms. The value of 200 kms provides the best fit as measured by
the smallness of the root mean squared error, Akaike’s information criterion as well as
the Bayesian information criterion. Hence the corresponding estimate of 0.066 is the
best estimate for the coefficient βa.
[Table VI here]
5.4 Under-reporting of riots
As we are using newspaper reports of riots, it is likely that not every riot gets reported.
This under-reporting may bias our estimates, as discussed earlier. In order to derive an
expression for this bias, we make three assumption regarding the nature of reporting of
riots.
1. There is no over reporting, i.e. the newspaper never reports a riot that has not
actually happened.
2. Conditional on a district having had one or more actual riots, the probability of at
least one riot from that district getting reported is independent of the instrument
variable, i.e. riots that are caused because of Hindu festivals falling on a Friday
are as likely to be reported as other riots.
3. If a district has had one or more riots in the year before elections, then the effect
of those riots on the election results is independent of whether they are reported
or not.5The surface area of India is 3.288 million square kilometres, which is divided into 412 districts to
obtain the average district size.
22
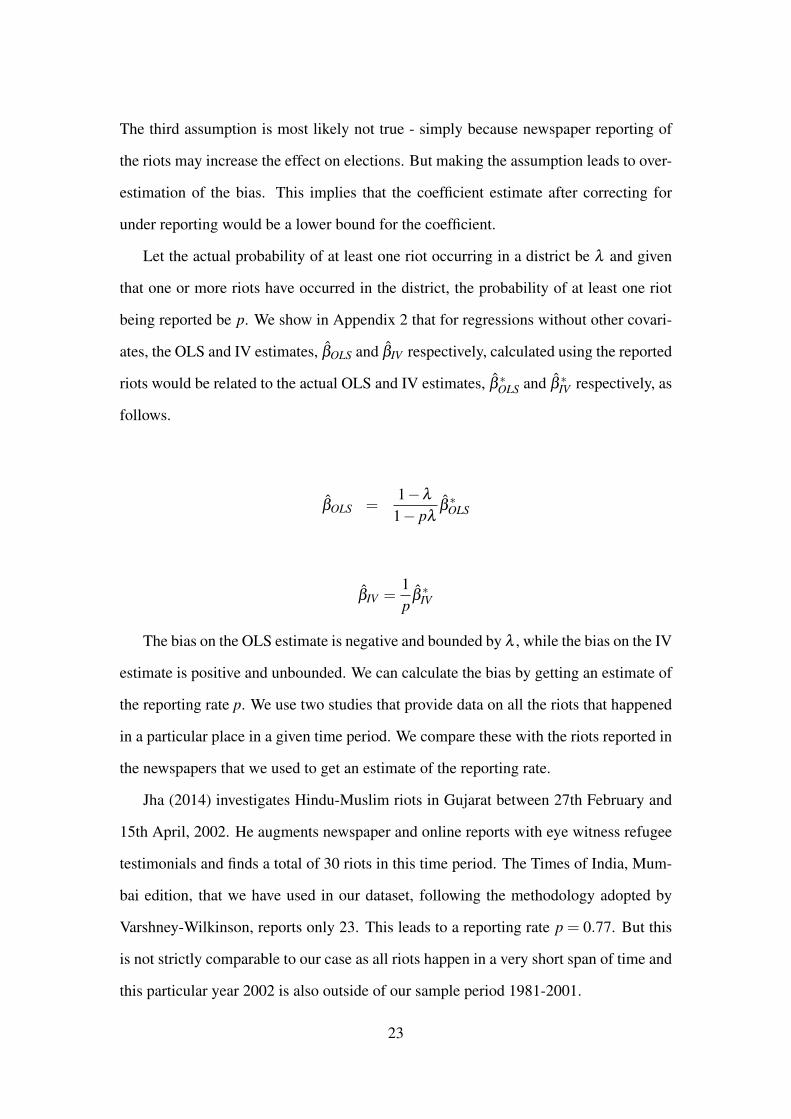
The third assumption is most likely not true - simply because newspaper reporting of
the riots may increase the effect on elections. But making the assumption leads to over-
estimation of the bias. This implies that the coefficient estimate after correcting for
under reporting would be a lower bound for the coefficient.
Let the actual probability of at least one riot occurring in a district be λ and given
that one or more riots have occurred in the district, the probability of at least one riot
being reported be p. We show in Appendix 2 that for regressions without other covari-
ates, the OLS and IV estimates, β̂OLS and β̂IV respectively, calculated using the reported
riots would be related to the actual OLS and IV estimates, β̂ ∗OLS and β̂ ∗IV respectively, as
follows.
β̂OLS =1−λ
1− pλβ̂∗OLS
β̂IV =1p
β̂∗IV
The bias on the OLS estimate is negative and bounded by λ , while the bias on the IV
estimate is positive and unbounded. We can calculate the bias by getting an estimate of
the reporting rate p. We use two studies that provide data on all the riots that happened
in a particular place in a given time period. We compare these with the riots reported in
the newspapers that we used to get an estimate of the reporting rate.
Jha (2014) investigates Hindu-Muslim riots in Gujarat between 27th February and
15th April, 2002. He augments newspaper and online reports with eye witness refugee
testimonials and finds a total of 30 riots in this time period. The Times of India, Mum-
bai edition, that we have used in our dataset, following the methodology adopted by
Varshney-Wilkinson, reports only 23. This leads to a reporting rate p = 0.77. But this
is not strictly comparable to our case as all riots happen in a very short span of time and
this particular year 2002 is also outside of our sample period 1981-2001.
23
A similar exercise using data from Brass (2003) consisting of riots in the city of
Aligarh from 1981 until 1995 is more informative. Brass provides information on riots
and “riotous periods” using various records including bureaucratic reports and data from
NGOs allowing us to check for reporting rates over a long time span. In our dataset
Aligarh has had riots in 7 out of the 15 year between 1981 and 1995. Brass provides
information about two more riotous years that are not included in our dataset. The
resulting reporting rate is p = 0.78 and is comparable to the one obtained from Jha
(2014).
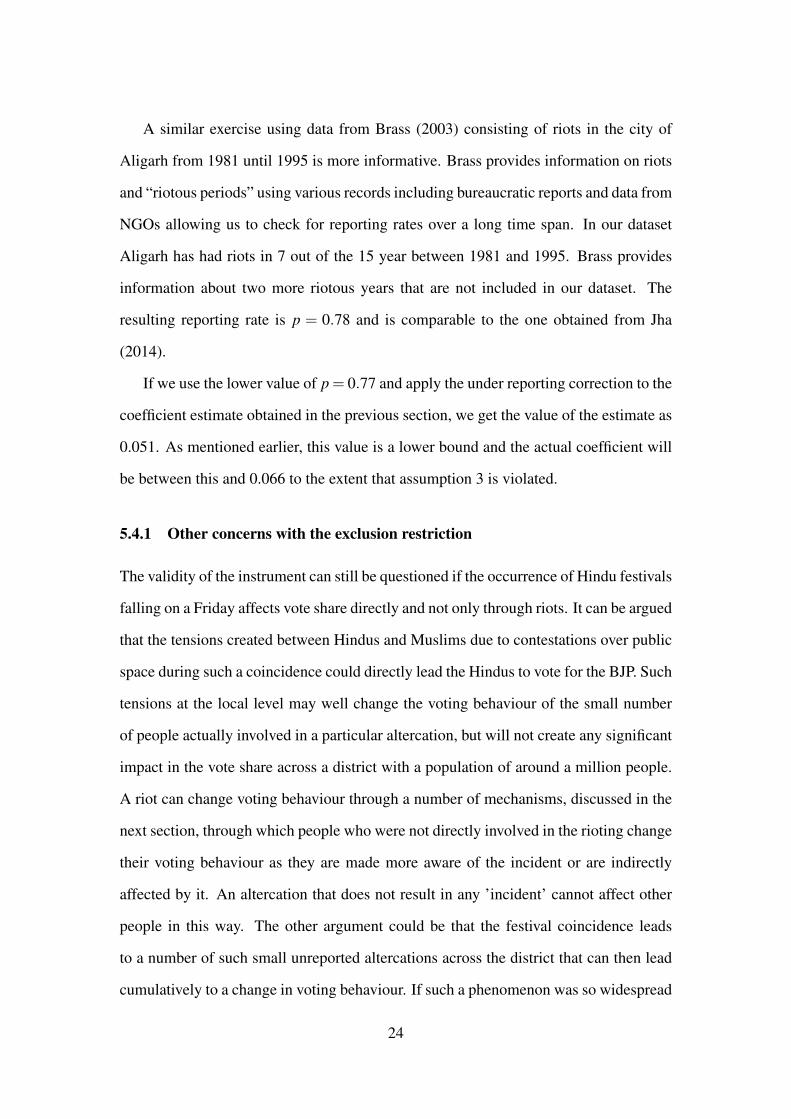
If we use the lower value of p = 0.77 and apply the under reporting correction to the
coefficient estimate obtained in the previous section, we get the value of the estimate as
0.051. As mentioned earlier, this value is a lower bound and the actual coefficient will
be between this and 0.066 to the extent that assumption 3 is violated.
5.4.1 Other concerns with the exclusion restriction
The validity of the instrument can still be questioned if the occurrence of Hindu festivals
falling on a Friday affects vote share directly and not only through riots. It can be argued
that the tensions created between Hindus and Muslims due to contestations over public
space during such a coincidence could directly lead the Hindus to vote for the BJP. Such
tensions at the local level may well change the voting behaviour of the small number
of people actually involved in a particular altercation, but will not create any significant
impact in the vote share across a district with a population of around a million people.
A riot can change voting behaviour through a number of mechanisms, discussed in the
next section, through which people who were not directly involved in the rioting change
their voting behaviour as they are made more aware of the incident or are indirectly
affected by it. An altercation that does not result in any ’incident’ cannot affect other
people in this way. The other argument could be that the festival coincidence leads
to a number of such small unreported altercations across the district that can then lead
cumulatively to a change in voting behaviour. If such a phenomenon was so widespread
24
then it would be surprising that it has escaped the attention of journalists and academics
who scrutinise Indian elections in great detail. On the other hand, the effect of festivals
on riots, and that of riots on elections, have been widely reported.
There could be any number of explanations for how the festival coincidence creates
something, as Alfred Marshall (1920) wrote albeit in a different context, “in the air”6
that leads people to change their voting behaviour, but in the absence of a quantifiable
measure of such an effect, it is difficult for us to check for or indeed to control for it.
We would argue that even if such an effect is present, it is likely to be small and local
and may not create a significant bias in our estimates.
5.5 Mechanisms
In this section we discuss the different mechanisms through which riots can impact
the voting decisions of electors. The arguments in this section are speculative, largely
because it is difficult to pin down the exact mechanism of individual behaviour using
district level aggregates. Nevertheless we think it is still important to try to interpret
some of the trends and correlations that we see in the data. There are three ways in
which religious riots could change voting behaviour.
1. Turnout: Riots could leave in their wake an atmosphere of fear and lack of secu-
rity in public spaces. This could persuade some electors to choose not to go out
and vote. It can be argued that voters from the minority religion are going to be
more at risk and they are more likely to stay at home for fear of violence. This
can result in an increase in the vote share of the party that represents the majority
religion, which is the BJP in our case. This is one possible explanation for the
results that we have observed in the previous section.
6Alfred Marshall was interested in manufacturing in Victorian Britain, specifically, why firms in thesame industry located geographically close to each other. He argued that proximity created something “inthe air” because “. . . if one man starts a new idea, it is taken up by others and combined with suggestionsof their own; and thus it becomes the source of further new ideas.” (Marshall, 1920, p.271).
25
2. Learning: It may be the case that a riot would lead to a change in a person’s
ideology and/or party affiliation. It is not very clear if this would lead to more or
fewer people voting for the party representing the majority religion, but this still
can be a feasible explanation for the results that we observe.
3. Salience of religious identity: Religious riots could lead to the religious identity
of voters becoming salient causing them to vote for political parties that represent
that identity, as suggested by Brass (2003) and many others. In this case, if we
assume that a certain fraction of the population of both communities votes accord-
ing to religion, then the gain for the party representing the majority community
would be higher, explaining the increased vote share of the BJP. This effect would
be temporary compared to point 2, which would lead to a more permanent change
in voting behaviour.
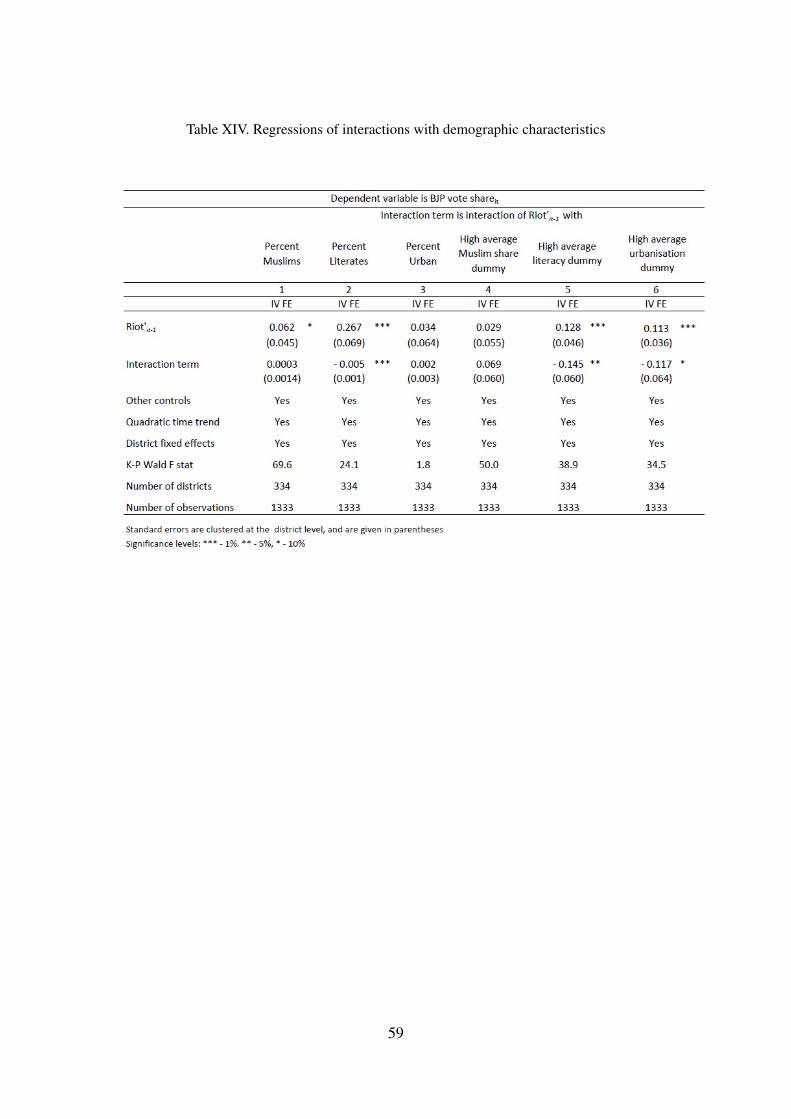
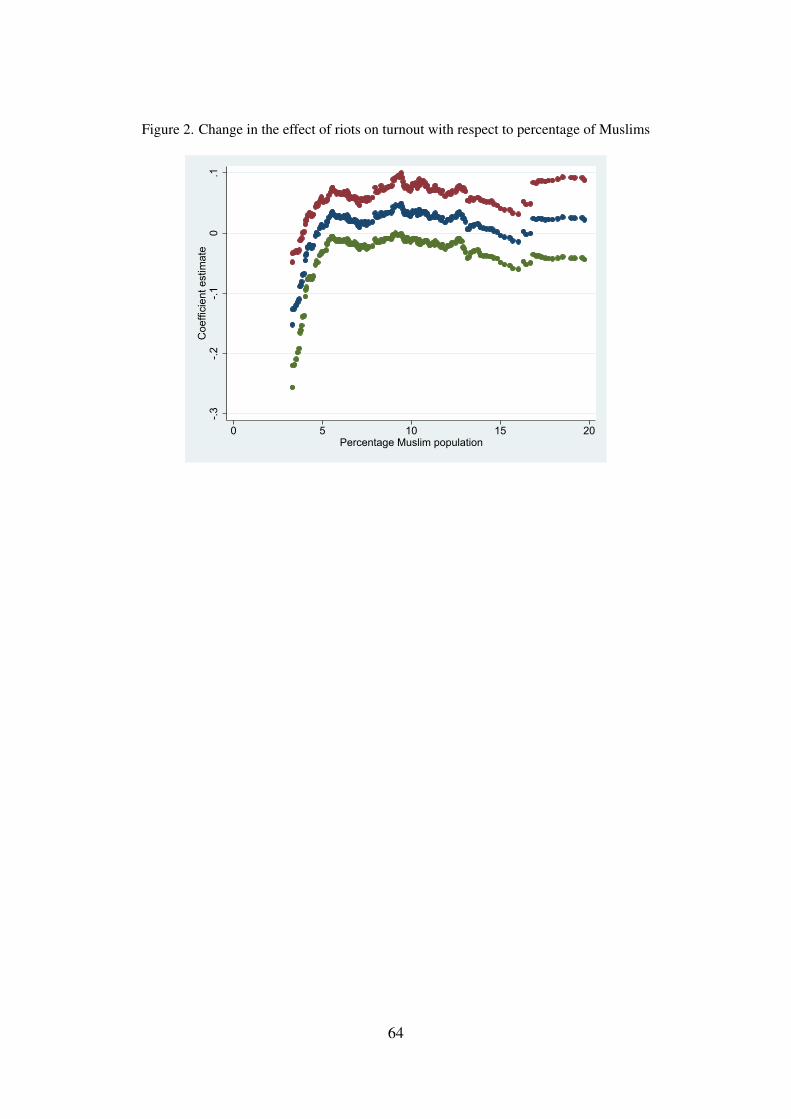
To check for the presence of the first mechanism, we look for the effect of the nearest
riot distance variable φ(dit−1) described in section 5.3, on election turnout. We find
that the impact on turnout is negative but not statistically significant. Ideally, we would
want to check if the impact is different for Hindus and Muslims, but in the absence
of individual-level data we can only conduct an approximate check using the religious
composition of the district. If the turnout of Muslims decreases more than that of Hin-
dus, then mechanically the districts with a higher proportion of Muslims should have a
larger reduction in turnout after riots. To check for this we conduct a series of regres-
sions over a rolling window of 500 observations in increasing order of the proportion of
Muslims in the population. The results are shown in Figure 2. The middle line indicates
the point estimate for the coefficient while the two other lines indicate the confidence
interval of two times the standard error. We can see that the turnout remains unaffected
in districts with more than 5% Muslim population. In districts with very few Muslims,
the turnout may be decreasing because of security threats to a very small minority or
because religious polarisation makes the election uncompetitive when one of the reli-
26
gions is very small in number. In any case, it is very unlikely that turnout reduction is
the reason for the increased BJP vote share as a result of riots.
[Figure 2 here]
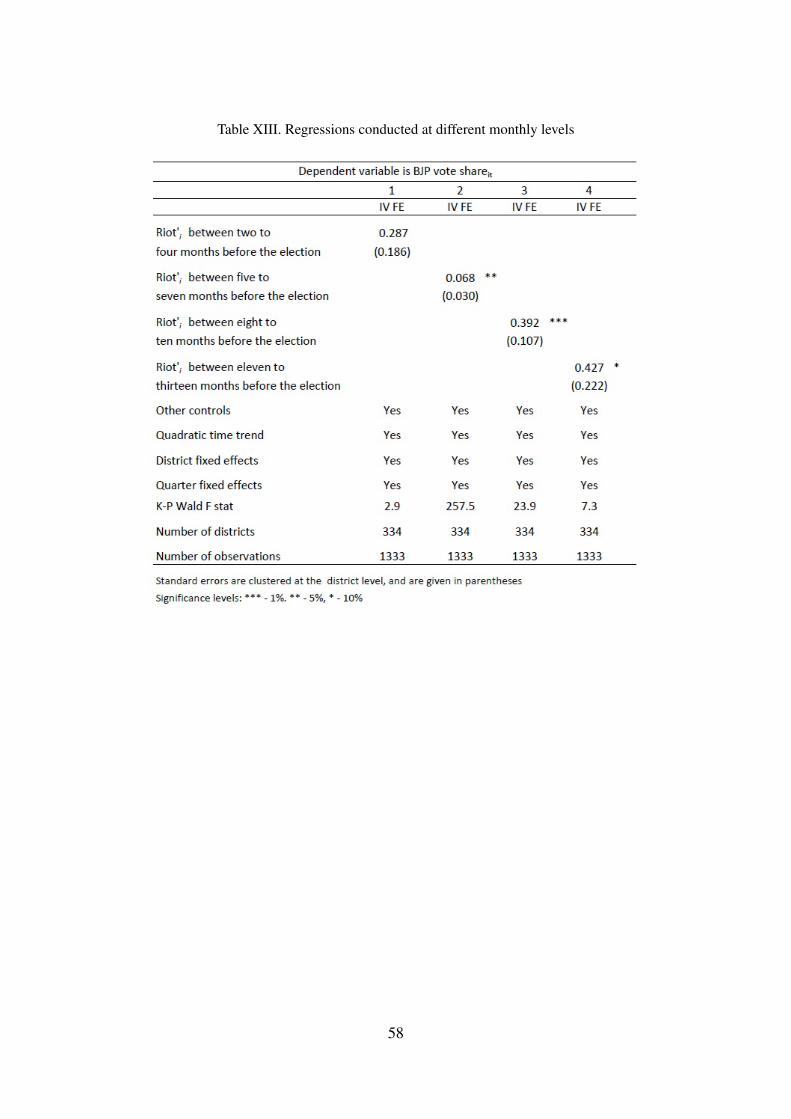
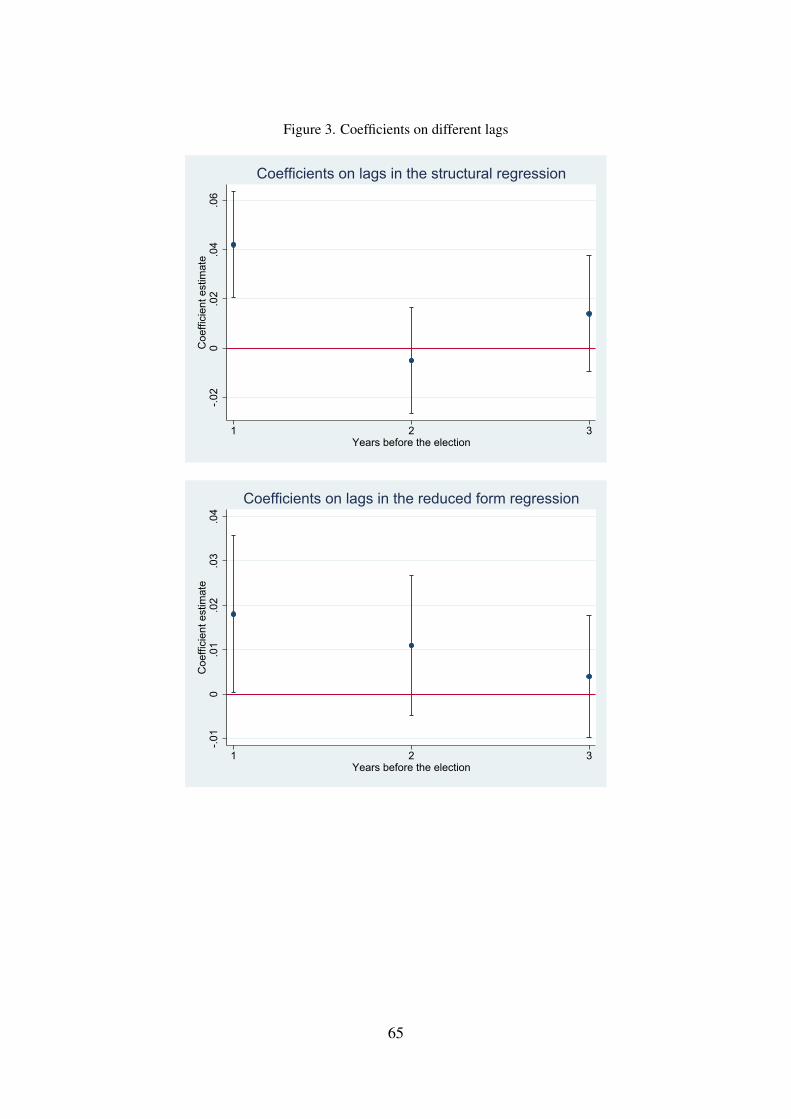
To check if riots lead to a permanent change in voting behaviour, we examine the
effect of riots at higher lags. We find that the instrument is weak at higher lags as Hindu
festivals falling on Fridays do not lead to as much of an increase in riots as they do in the
year just preceding the election.7 Hence we show the reduced form and the structural
estimates at 1, 2 and 3 year lags in Figure 38. We stop at 3 years because the average gap
between elections is 4.4 years. As shown in Figure 2, both the structural and reduced
form estimates are not significantly different from zero at higher lags, indicating that
riots alter voting behaviour only for the election happening in the immediate year after
and not beyond that. This suggests that a possible ’learning’ mechanism may not be
driving our results.
[Figure 3 here]
By excluding the other two possibilities, the third mechanism seems to be the most
likely explanation. There is a large literature in social science which argues that the
effect of communal riots on elections is explained primarily by the salience of religious
researchers refer to this phenomenon as ’communal polarisation’ or polarisation along
religious lines. More precisely, it is the salience of the religious identity of voters as
a result of riots that leads voters to vote for the party that best reflects that religious
identity. Sen (2006) argues that people have multiple identities which become salient
at different times given the environment and context in which they live. In the case
7If we take this as evidence that political parties or their supporters are using the festival coincidenceto instigate riots in the year before elections, then this would suggest that the electoral effect of riots doesdecay with time, which is why they are being orchestrated in the year before elections.
8We include data on riots from years 1978 and 1979 to prevent any observation from being excluded.
27
of India, some of these identities are religion, caste, language and gender. But the evi-
dence is not limited to India alone. Evidence from Israel suggests that political violence
results in increased religiosity among both Jews and Muslims (Zussman, 2014). While
religiosity and the salience of religious identity are not exactly the same concept, it is
quite likely that they are closely related. Brass (2003) in his extensive study of riots in
the city of Aligarh finds that riots lead to the salience of religion as the primary iden-
tity, compared to caste. Jaffrelot (2010; pp 381-82) narrates that in the spate of riots in
Gujarat in 2002, even Adivasis, the indigenous people thought to be outside the tradi-
tional Hindu caste system, joined with the upper castes like the Patidars in assuming a
Hindu identity and participating in the riots. There is also evidence of political parties
exacerbating and capitalising on this salience of religious identity. As Wilkinson (2009)
writes:
“In the Indian state of Gujarat, for instance, a rightwing Hindu politician
told an election meeting of Hindus, held in 2002 in the aftermath of riots,
that Muslims in the constituency had celebrated with firecrackers and a
procession when the news of the murder of Hindu nationalist workers was
known. The politician emphasized to voters, ’This is not a Congress versus
BJP election. It is Hindus versus Muslims’ (Sharma 2004, 1 hour 15 min).”
5.6 Robustness checks
5.6.1 Fractional response
All the regressions shown above are linear, whereas the dependent variable BJP voteshareit
is a fraction and is thus bounded. To estimate the main regression while allowing for the
fractional dependent variable, we use the method suggested by Papke and Wooldridge
(2008). The explanatory variable is φ(dit−1), which we name Riot ′it−1. This method
involves controlling for district level fixed effects by explicitly controlling for the time-
means of the dependent variables. The resulting regression is essentially a random ef-
28
fects regression which allows for specifying the estimating equation as a logit or a probit
function. The endogeneity correction using the instrumental variable is achieved using
the control function approach. The residuals from the first stage regression, also called
the control function, are used as additional regressors in the main regression. Papke
and Wooldridge suggest two methods for conducting fractional dependent variable re-
gressions controlling for fixed effects and allowing for endogeneity and we conduct
both types of regressions. The first is a Bernoulli quasi maximum likelihood estima-
tion and the second is a pooled panel generalised estimating equation approach. In
both cases we assume the link function to be probit. We present the results and the
estimated average marginal effects in Table VII. Note that we do not use demographic
and public goods controls as then the relevant coefficient loses significance in the first
stage. Also, we include five year fixed effects9 as time fixed effects are recommended
in the Papke-Wooldridge procedure - dropping these does not change the results. The
marginal effect for the pooled QMLE case is very similar to the linear estimates, while
the GEE coefficient estimate is also of the same order but not statistically significant.
This demonstrates that a linear approximation may be correct in this case.
[Table VII here]
5.6.2 Alternative explanatory variable
Our main explanatory variable is an indicator of at least one riot having taken place in
the district in the calendar year before the year in which the election occurred. But elec-
tions can take place in different months in a year. So, now we construct the explanatory
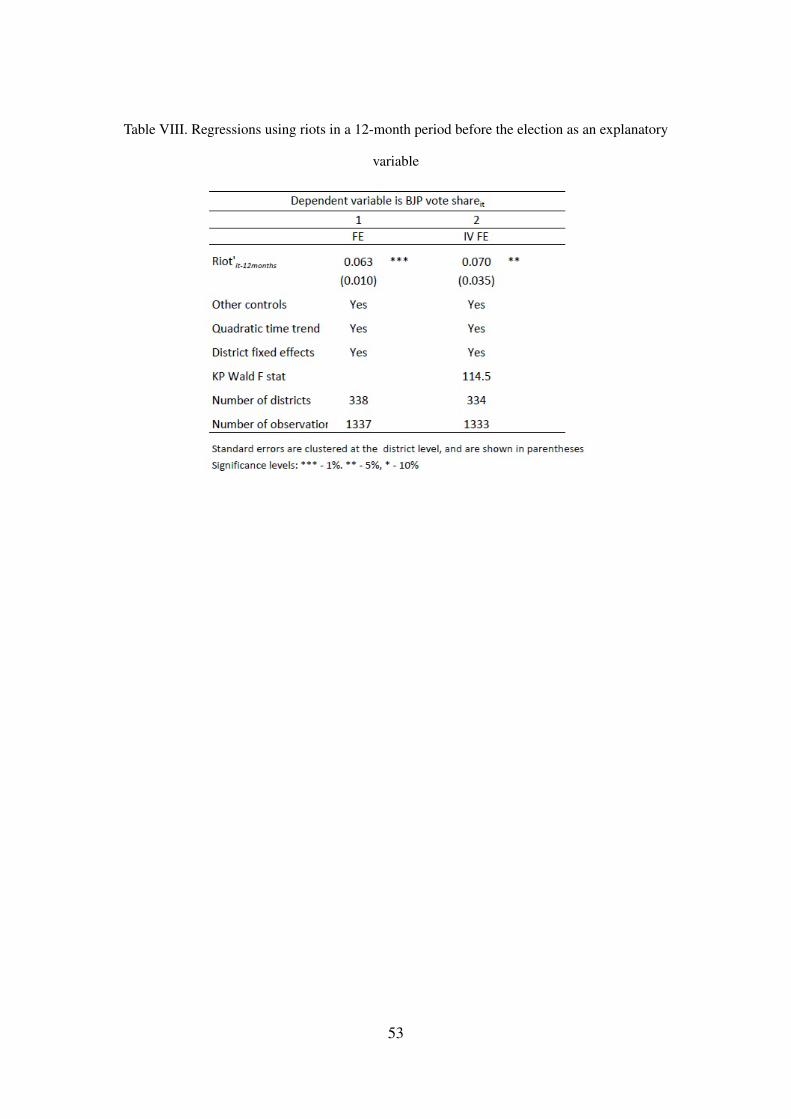
variable using riots occurring in a 12-month period preceding the election. The results
using this variable are shown in Table VIII and they are very similar to our original
regressions.
9We divide the total period of 21 years into four periods of 5-6 years viz, 1981-1985, 1986-1990,1991-1995, 1996-2001 and we use these dummies as ’five-year fixed effects’. The logic is that withineach one of these four periods, we would have elections in all states, thus capturing any country-widefixed effects.
29
[Table VIII here]
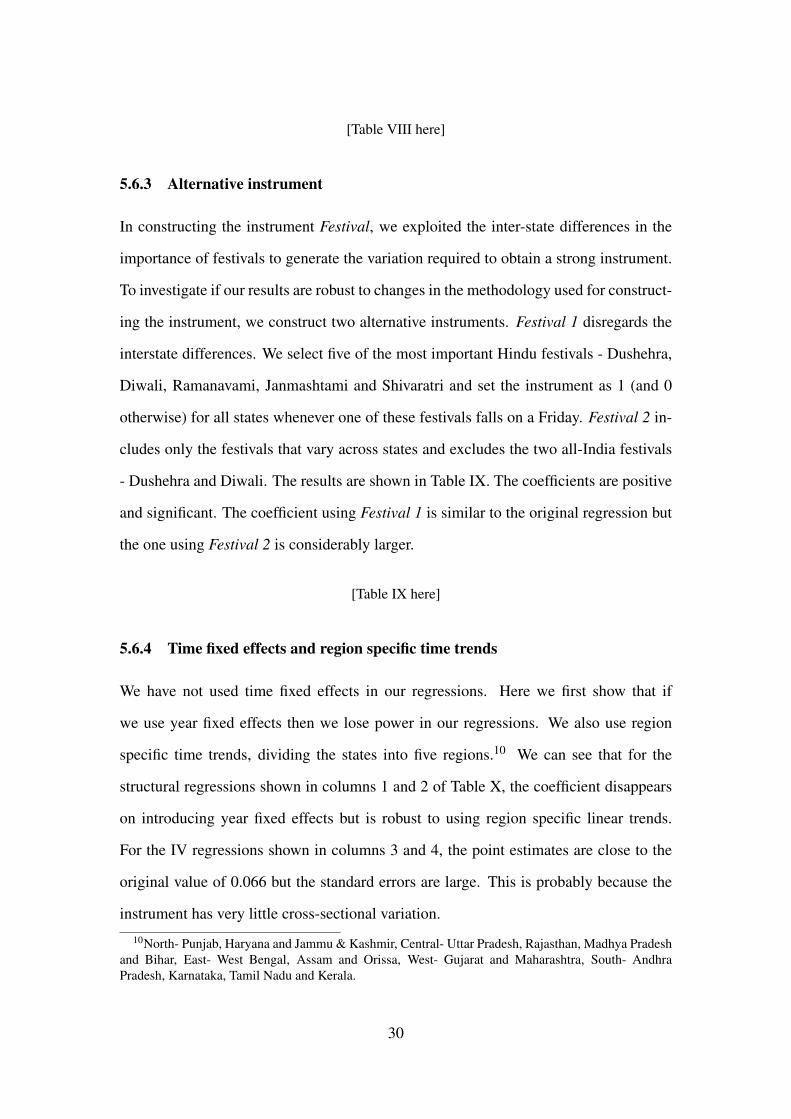
5.6.3 Alternative instrument
In constructing the instrument Festival, we exploited the inter-state differences in the
importance of festivals to generate the variation required to obtain a strong instrument.
To investigate if our results are robust to changes in the methodology used for construct-
ing the instrument, we construct two alternative instruments. Festival 1 disregards the
interstate differences. We select five of the most important Hindu festivals - Dushehra,
Diwali, Ramanavami, Janmashtami and Shivaratri and set the instrument as 1 (and 0
otherwise) for all states whenever one of these festivals falls on a Friday. Festival 2 in-
cludes only the festivals that vary across states and excludes the two all-India festivals
- Dushehra and Diwali. The results are shown in Table IX. The coefficients are positive
and significant. The coefficient using Festival 1 is similar to the original regression but
the one using Festival 2 is considerably larger.
[Table IX here]
5.6.4 Time fixed effects and region specific time trends
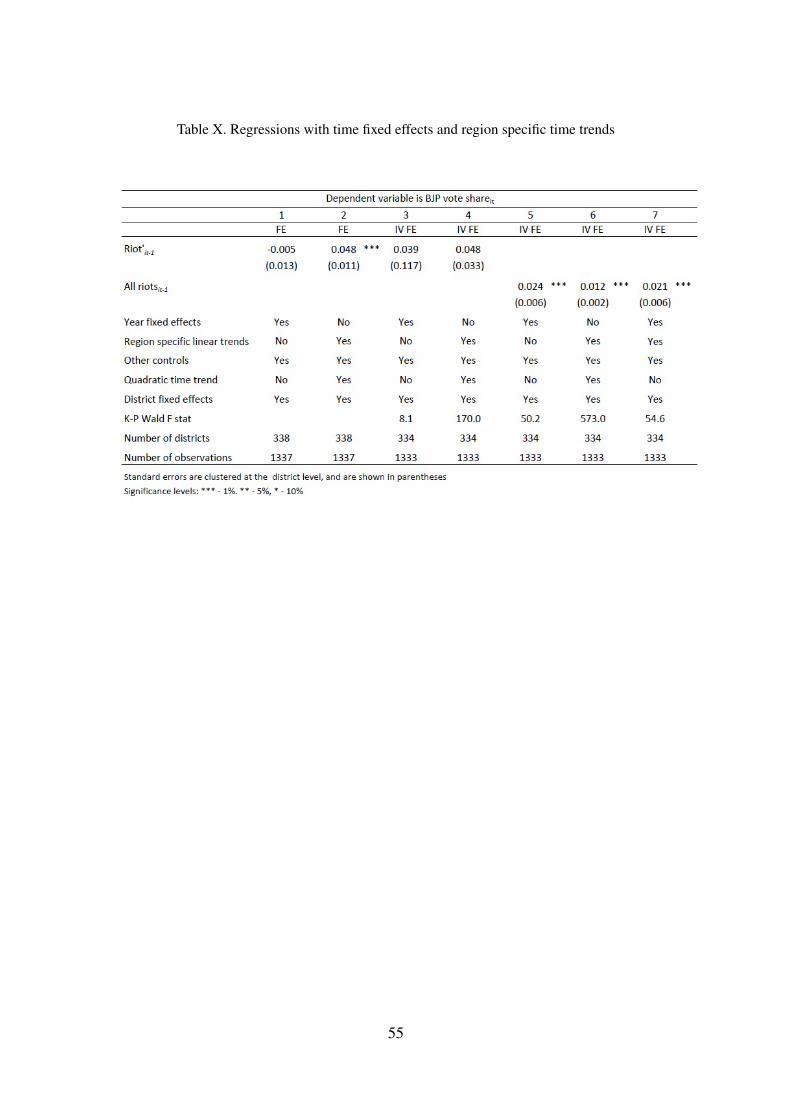
We have not used time fixed effects in our regressions. Here we first show that if
we use year fixed effects then we lose power in our regressions. We also use region
specific time trends, dividing the states into five regions.10 We can see that for the
structural regressions shown in columns 1 and 2 of Table X, the coefficient disappears
on introducing year fixed effects but is robust to using region specific linear trends.
For the IV regressions shown in columns 3 and 4, the point estimates are close to the
original value of 0.066 but the standard errors are large. This is probably because the
instrument has very little cross-sectional variation.
10North- Punjab, Haryana and Jammu & Kashmir, Central- Uttar Pradesh, Rajasthan, Madhya Pradeshand Bihar, East- West Bengal, Assam and Orissa, West- Gujarat and Maharashtra, South- AndhraPradesh, Karnataka, Tamil Nadu and Kerala.
30
[Table X here]
Time fixed effects are intended to account for unobservable time shocks that affects
both the dependent variable and the explanatory variable or the instrument. In our case,
the instrument is completely exogenous and so the purpose of time fixed effects would
be to check for the possibility that by chance in a few of the election years in which
BJP did well, a Hindu festival happened to fall on a Friday in the preceding year and
this is driving our result. While we do indirectly check this by dropping some years and
states in the next subsection, we cannot directly check for this possibility using time
fixed effects because of the lack of cross-sectional variation in the instrument.
We can introduce cross-sectional variation in the instrument by changing our spec-
ification slightly. So far we have been looking at the extensive margin of riots to avoid
making any assumptions about the nature of the cumulative effect of multiple riots. We
now assume a linear cumulative effect, which implies that we can add all the (distance
weighted) riots and check for their total effect on elections. The specification would
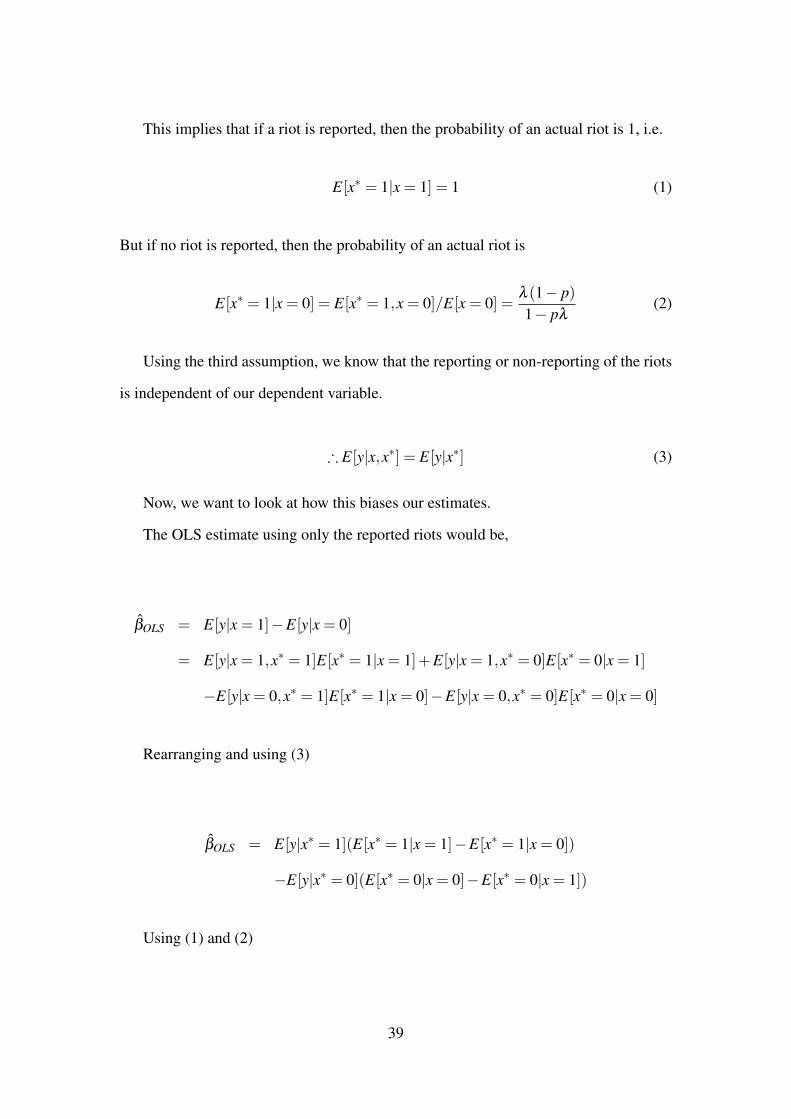
1− pλ< 1, the OLS estimate will be biased towards zero.
Now, let us look at the IV estimate. The second assumption tells us that reporting is
independent of Festival.
∴ E[x = 1|z] = pE[x∗ = 1|z] (4)
The IV estimate calculated using the reported riots x is given by
β̂IV =E[y|z = 1]−E[y|z = 0]E[x|z = 1]−E[x|z = 0]
=1p
E[y|z = 1]−E[y|z = 0]E[x∗|z = 1]−E[x∗|z = 0]
=1p
β̂∗IV
Since 0 < p < 1, the magnitude of the IV estimate will be biased upwards. we have
shown the proofs here using simple regressions but the principles apply to regressions
with other covariates.
Now let us look at the probable magnitudes of the bias in our case. We know that the
observed probability of riots as we see in the data of pλ = 0.07 and the rate of reporting
is approximately p = 0.77. Hence, the actual probability of at least one riot happening
in a district in a year λ = 0.091
The OLS is biased by 1-1−λ
1− pλ= 1− 0.91
0.93' 2.2%
The IV is biased by 1/p−1 = 1/0.77−1' 30%
Hence, the bias in the IV estimate is very large, and this may explain the estimates
that we obtain. This is because the effect of the reporting rate p on the OLS estimate
40
is moderated by the overall probability λ , whereas the IV estimate is directly impacted
by p. The lower the reporting rate the higher the bias in both cases, but the magnitude
of the bias in bounded above by λ in the OLS case, whereas in the case of IV, it is
unbounded.
41
ReferencesAidt, T. S., & Franck, R. (2015). Democratization under the Threat of Revolution:
Evidence from the Great Reform Act of 1832. Econometrica, 83(2), 505-547.Ansolabehere, S. (2008). Voters, Candidates, and Parties. In Wittman, D.A., &
Weingast, B.R., eds, The Oxford Handbook of Political Economy. Oxford UniversityPress: New York.
Beck, E. M., & Tolnay, S. E. (1990). The killing fields of the deep south: the marketfor cotton and the lynching of blacks, 1882-1930. American Sociological Review, 526-539.
Berman, E., Downey, M and Felter, J. (2015). Expanding Governance as Develop-ment: Evidence on Child Nutrition in the Philippines. Paper presented at ’The PoliticalEconomy of Social Conflict’ Conference, Department of Economics, Yale University,16-17 October 2015.
Berrebi, C. and Klor, E. F. (2008). Are Voters Sensitive to Terrorism? Direct Ev-idence from the Israeli Electorate. American Political Science Review, 102(03), 279-301.
Blakeslee, D. (2013). Propaganda and Ethno-Religious Politics in Developing Coun-tries: Evidence from India. Mimeo, Columbia.
Blattman, C. (2009). From Violence to Voting: War and Political Participation inUganda. American Political Science Review, 103(02), 231-247.
Bohlken, A. T., & Sergenti, E. J. (2010). Economic Growth and Ethnic Violence:An Empirical Investigation of Hindu—Muslim Riots in India. Journal of Peace Re-
search, 47(5), 589-600.Brass, P. R. (1997). Theft of an Idol: Text and Context in the Representation of
Collective Violence. Princeton University Press.Brass, P. R. (2003). The Production of Hindu-Muslim Violence in Contemporary
India. University of Washington Press.Census of India, 1981, 1991, 2001. Government of India.Dinecco, M & Onorato, M. G. (2015), The Economic Legacy of Warfare: Evidence
from Urban Europe. Paper presented at ’The Political Economy of Social Conflict’Conference, Department of Economics, Yale University, 16-17 October 2015.
Downs, A. (1957). An Economic Theory of Democracy. Harper and Row: NewYork.
DiPasquale, D., & Glaeser, E. L. (1998). The Los Angeles Riot and the Economicsof Urban Unrest. Journal of Urban Economics, 43(1), 52-78.
Eifert, B., Miguel, E., & Posner, D. N. (2010). Political Competition and Ethnic
42
Identification in Africa. American Journal of Political Science, 54(2), 494-510.Election Commission of India (1976). Delimitation of Parliamentary and Assembly
Constituencies Order, 1976. Election Commission, New Delhi.Esteban, J., & Ray, D. (2008). On the Salience of Ethnic Conflict. The American
Economic Review, 2185-2202.Fair, R. C. (1996). Econometrics and Presidential Elections. The Journal of Eco-
nomic Perspectives, 89-102.Fearon, J.D. (1999). Why Ethnic Politics and “Pork” Tend to go Together. Mimeo,
Stanford University.Fearon, J.D. (2008). Ethnic Mobilization and Ethnic Violence. In Wittman, D.A.,
& Weingast, B.R., eds, The Oxford Handbook of Political Economy. Oxford UniversityPress: New York
Field, E., Levinson, M., Pande, R., & Visaria, S. (2008). Segregation, Rent Con-trol, and Riots: The Economics of Religious Conflict in an Indian City. The American
Economic Review, 505-510.Gopal, S. (1993). Anatomy of a Confrontation: The Ramjanmabhoomi-Babri Masjid
Issue. Penguin: Delhi.Glaeser, E. L. (2005).The Political Economy of Hatred. Quarterly Journal of Eco-
nomics, 120 (1), 45–86.Guha, R. (2007). India After Gandhi: The History of the World’s Largest Democ-
racy. Harper Collins Publishers: New York.Horowitz, D. L. (1985). Ethnic Groups in Conflict. Univ of California Press.Indian Statutory Commission Report, 1930: 97-107Iyer, S. (2016). The New Economics of Religion. Forthcoming in the Journal of
Economic Literature.
Iyer, S. (2002). Demography and Religion in India. Delhi: Oxford University Press.Jaffrelot, C. (2010). Religion, Caste, and Politics in India. Primus Books.Jha, S. (2014). "Unfinished Business": Historic Complementarities, Political Com-
petition and Ethnic Violence in Gujarat, Journal of Economic Behavior and Organisa-
tion, Vol. 104, August, pp.18-36.Kleibergen, F. & Paap, R. (2006). Generalized Reduced Rank Tests Using the Sin-
gular Value Decomposition. Journal of Econometrics, Vol. 133, pp. 97-126.Kramer, G. H. (1971). Short-term Fluctuations in US Voting Behavior, 1896–1964.
American Political Science Review, 65(01), 131-143.Marshall, A. (1920), Principles of Economics, Book V, Great Minds Series, Prometheus
Books: New York, 1997.Michalopoulas, S. & Papaioannou, E. (2015) The Long-Run Effects of the Scramble
43
for Africa. Paper presented at ’The Political Economy of Social Conflict’ Conference,Department of Economics, Yale University, 16-17 October 2015.
Mitra, A., & Ray, D. (2014). Implications of an Economic Theory of Conflict:Hindu-Muslim Violence in India, Journal of Political Economy, 122(4), 719-765.
Muralidharan, S. (2014). Modi, Mulayam, Muzaffarnagar. Economic & Political
Weekly, 49(7), 35.Nellis, G., Weaver, M. and Rosenzweig, S (2015), Do Parties matter for Ethnic
Violence? Evidence from India. Mimeograph, Department of Political Science, YaleUniversity.
Pandey, G. (2001). Remembering Partition: Violence, Nationalism and History in
India. Cambridge University Press.Papke, L. E., & Wooldridge, J. M. (2008). Panel Data Methods for Fractional
Response Variables with an Application to test Pass Rates. Journal of Econometrics,145(1), 121-133.
Pathania, V., & Tandon, S. (2011). Divisive Politics and Violence: Evidence fromthe Success of the Bharatiya Janata Party in India. Working paper.
Posner, D. N. (2004). The Political Salience of Cultural Difference: Why Chewasand Tumbukas are Allies in Zambia and Adversaries in Malawi. American Political
Science Review, 98(4), 529-545.Rao, M., Mishra, I., Singh, P., & Bajpai, V. (2014). Fact Finding Report: Indepen-
dent inquiry into Muzaffarnagar “riots”. Economic & Political Weekly, 49(2).Sen, A. (2006). “Identity and Violence: The Illusion of Destiny”, Allen Lane, UK.Skaperdas, S. (2015), Guns, Lawyers and Markets: Economic Consequences of
Costly Conflict. Paper presented at ’The Political Economy of Social Conflict’ Confer-ence, Department of Economics, Yale University, 16-17 October 2015.
Stigler, G. J. (1973). General Economic Conditions and National Elections. The
American Economic Review, 160-167.Stock, J.H. & Yogo, M. (2005). Testing for Weak Instruments in Linear IV Re-
gression. In D.W.K. Andrews and J.H. Stock, eds. Identification and Inference for
Econometric Models: Essays in Honor of Thomas Rothenberg. Cambridge UniversityPress: Cambridge.
Varshney, A. (2002). Ethnic Conflict and Civic Life: Hindus and Muslims in India.
New Haven: Yale University Press.Varshney, A., & Gubler, J. R. (2012). Does the State promote Communal Violence
for Electoral Reasons?. India Review, 11(3), 191-199.Varshney, A. & Wilkinson, S.I. (2004) “Varshney Wilkinson Dataset on Hindu-
Muslim Violence in India, Version 2"
44
Wilkinson, S. I. (2004). Votes and Violence: Electoral Competition and Ethnic Riots
in India. Cambridge University Press.Wilkinson, S. I. (2009). Riots. Annual Review of Political Science, 12, 329-343.Zussman, A. (2014). The Effect of Political Violence on Religiosity. Journal of
Economic Behavior & Organization, 104, 64-83.
45
Tables
Table I. The reported number and duration of riots in 339 Indian districts between 1980-2000
46
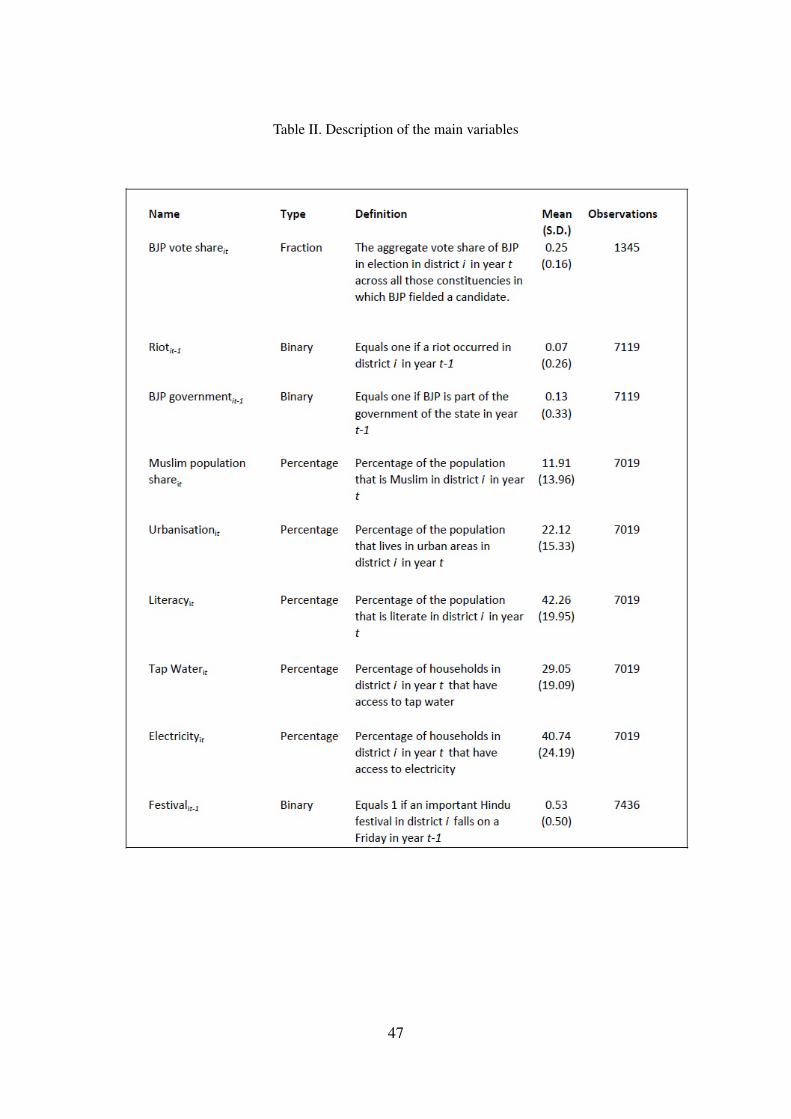
Table II. Description of the main variables
47
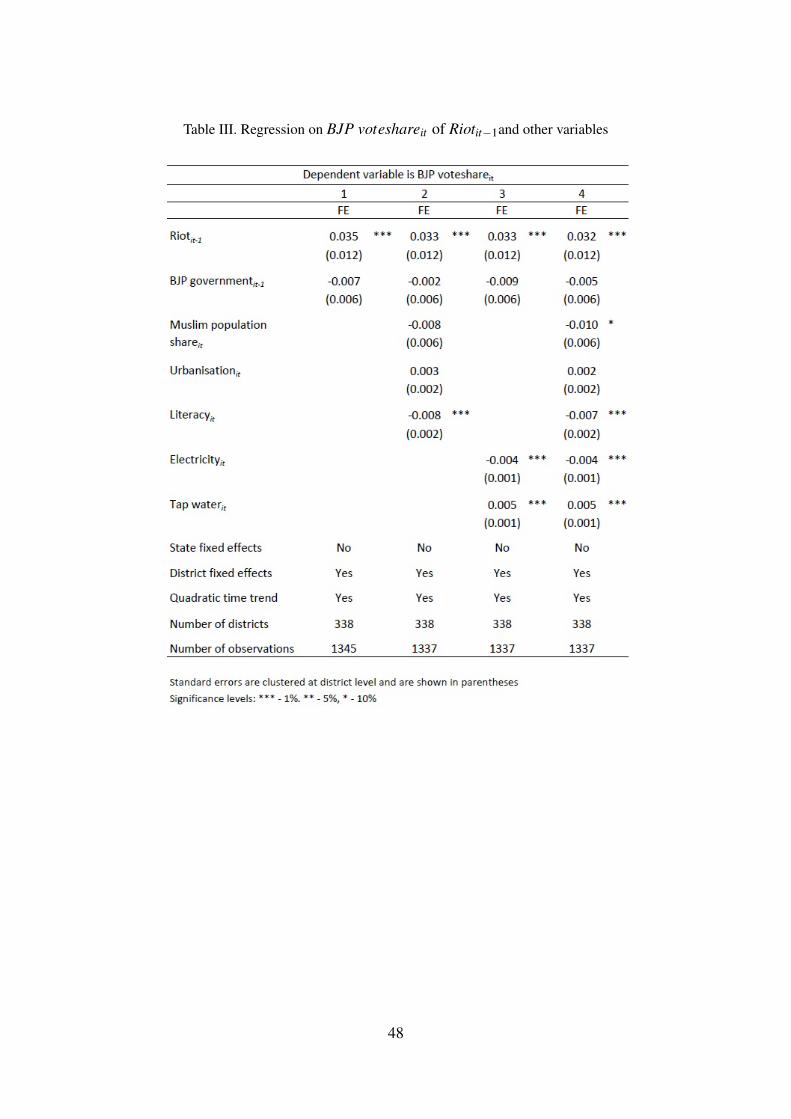
Table III. Regression on BJP voteshareit of Riotit−1and other variables
48
Table IV. First stage regression on Riotit−1 of instrument variable Festivalit−1
49
Table V. Reduced form and IV regressions using Festivalit−1 as an instrument variable for
Riotit−1
50
Table VI. Regression results for different standard deviations for φ(.)
51
Table VII. Regressions using the Papke-Wooldridge method
52
Table VIII. Regressions using riots in a 12-month period before the election as an explanatory
variable
53
Table IX. Regressions using Festival 1 and Festival 2 as instruments
54
Table X. Regressions with time fixed effects and region specific time trends
55
Table XI. Regressions without observations from certain years, Jammu and Kashmir, and
Punjab
56
Table XII. Regressions with lagged vote share
57
Table XIII. Regressions conducted at different monthly levels
58
Table XIV. Regressions of interactions with demographic characteristics
59
Table XV. Regressions including state elections held in 1980
60
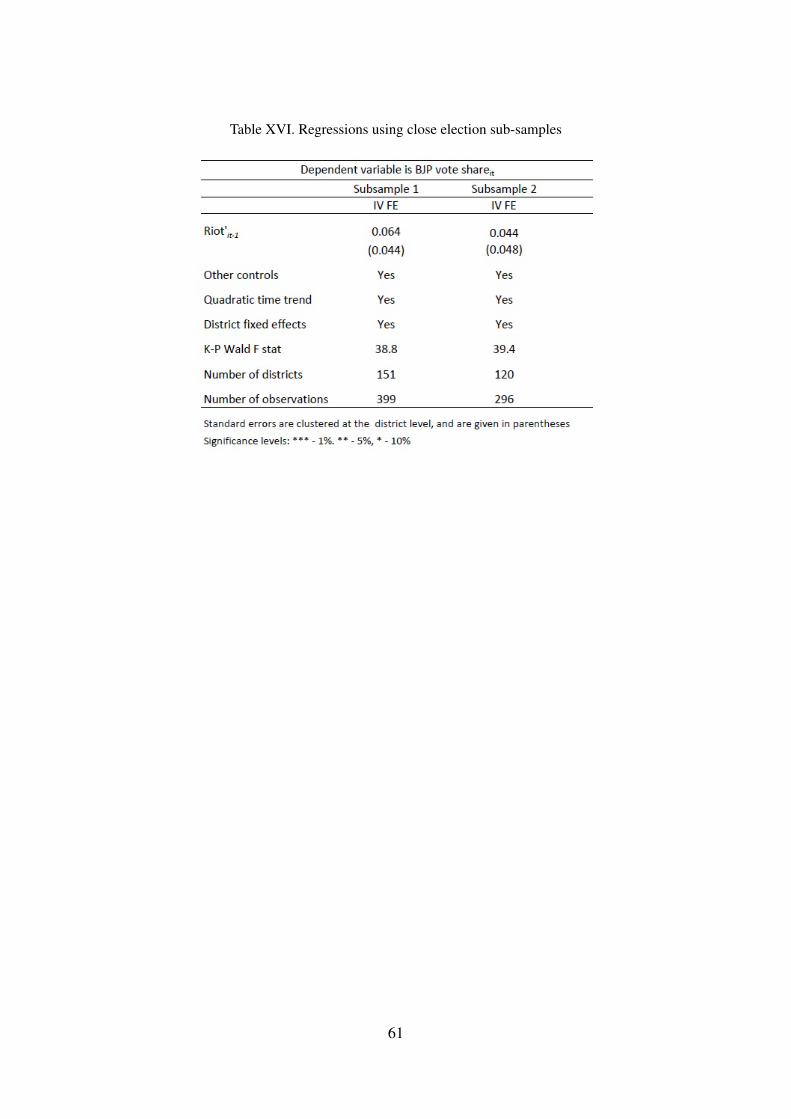
Table XVI. Regressions using close election sub-samples
61
Table XVII. Regressions for the Indian National Congress
62
Figures
Figure 1. Number of riots by year in all 339 districts
020
4060
8010
0N
umbe
r of r
iots
1980
1981
1982
1983
1984
1985
1986
1987
1988
1989
1990
1991
1992
1993
1994
1995
1996
1997
1998
1999
2000
63
Figure 2. Change in the effect of riots on turnout with respect to percentage of Muslims
-.3-.2
-.10
.1C
oeffi
cien
t est
imat
e
0 5 10 15 20Percentage Muslim population
64
Figure 3. Coefficients on different lags
-.02
0.0
2.0
4.0
6C
oeffi
cien
t est
imat
e
1 2 3Years before the election
Coefficients on lags in the structural regression
-.01
0.0
1.0
2.0
3.0
4C
oeffi
cien
t est
imat
e
1 2 3Years before the election
Coefficients on lags in the reduced form regression
65
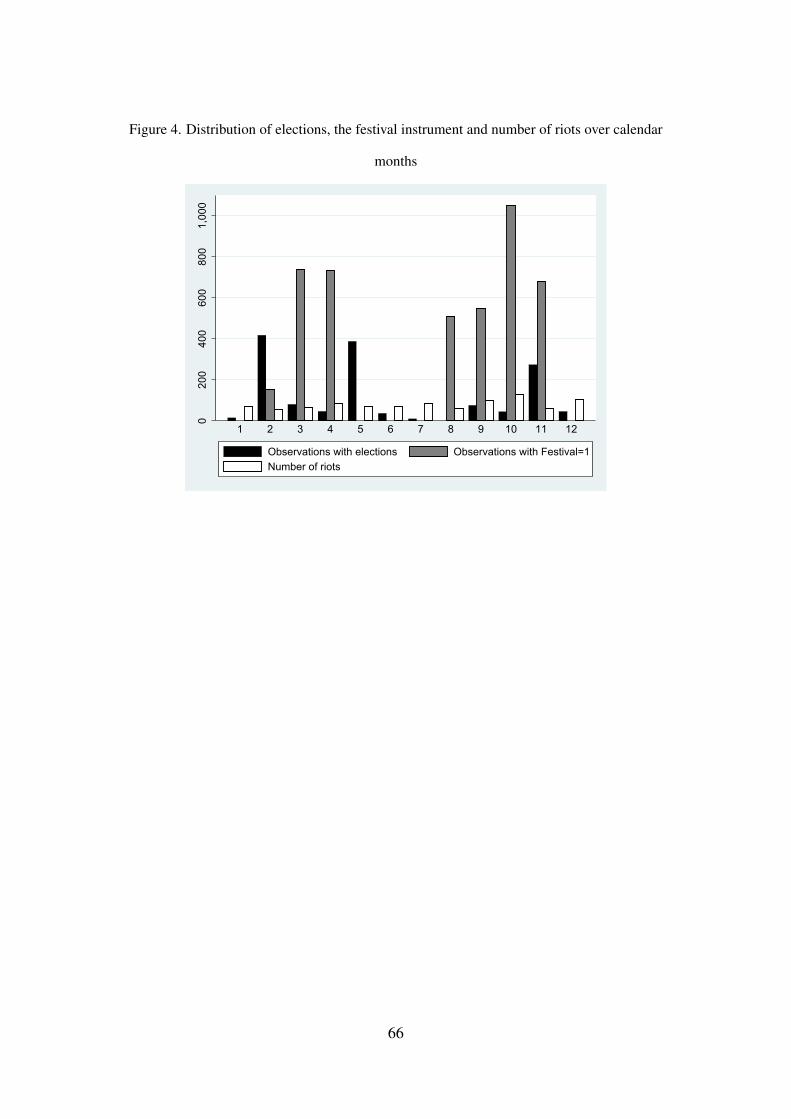
Figure 4. Distribution of elections, the festival instrument and number of riots over calendar
months
020
040
060
080
01,
000
1 2 3 4 5 6 7 8 9 10 11 12
Observations with elections Observations with Festival=1Number of riots