Page 1
REMEDIAL EXTRACTION AND CATALYTIC HYDRODEHALOGENATION
FOR TREATMENT OF SOILS CONTAMINATED BY
HALOGENATED HYDROPHOBIC ORGANIC COMPOUNDS
A Dissertation
by
HUN YOUNG WEE
Submitted to the Office of Graduate Studies of
Texas A&M University
in partial fulfillment of the requirements for the degree of
DOCTOR OF PHILOSOPHY
May 2007
Major Subject: Civil Engineering
Page 2
REMEDIAL EXTRACTION AND CATALYTIC HYDRODEHALOGENATION
FOR TREATMENT OF SOILS CONTAMINATED BY
HALOGENATED HYDROPHOBIC ORGANIC COMPOUNDS
A Dissertation
by
HUN YOUNG WEE
Submitted to the Office of Graduate Studies of
Texas A&M University
in partial fulfillment of the requirements for the degree of
DOCTOR OF PHILOSOPHY
Approved by:
Co-Chairs of Committee, Jeffrey A Cunningham
Bill Batchelor
Committee Members, Robin Autenrieth
Hongbin Zhan
Head of Department, David V. Rosowsky
May 2007
Major Subject: Civil Engineering
Page 3
iii
ABSTRACT
Remedial Extraction and Catalytic Hydrodehalogenation for
Treatment of Soils Contaminated by
Halogenated Hydrophobic Organic Compounds.
(May 2007)
Hun Young Wee, B.Eng., Chungbuk National University, Republic of Korea;
M.S., Texas A&M University
Co-Chairs of Advisory Committee: Dr. Jeffrey A. Cunningham
Dr. Bill Batchelor
The overall objective of this research was to develop and assess a new method, named
remedial extraction and catalytic hydrodehalogenation (REACH), for removing and
destroying soil contaminants. In particular, I considered hydrophobic halogenated
organic compounds (HHOCs). In this research, I developed a closed-loop treatment
process that catalytically destroys the contaminants of concern, and does not generate a
secondary waste stream. Mixtures of water and ethanol appear to be good candidates for
the extraction of 1,2,4,5-tetrachlorobenzne (TeCB) or pentachlorophenol (PCP) from
contaminated soil. Palladium-catalyzed hydrodehalogenation (HDH) was applied for
destroying TeCB or PCP in mixtures of water and ethanol in a batch mode.
The experimental results are all consistent with a Langmuir-Hinshelwood model
for heterogeneous catalysis. Major findings that can be interpreted within the Langmuir-
Hinshelwood framework are as follows: the rate of HDH depends strongly on the solvent
composition, increasing as the water fraction of the solvent increases; the kinetics of the
Page 4
iv
HDH reaction are apparently first-order with respect to the concentration of TeCB in the
solvent; and the HDH rate increases as the catalyst concentration in the reactor
increases. Also, TeCB is converted rapidly and quantitatively to benzene, with only
trace concentrations of 1,2,4-trichlorobenzene appearing as a reactive intermediate. PCP
is transformed to phenol by sequential reductive dehalogenation to tetrachlorophenols,
then to trichlorophenols, then to phenol. The degradation of PCP does not follow first-
order kinetics, probably because of competitive reactions of intermediate products that
are generated during PCP degradation. Following the batch studies, the REACH
technology was applied in continuous mode under baseline conditions for a span of 7
weeks to treat soils that had been synthetically contaminated by HHOCs in the
laboratory. Extraction of TeCB and PCP from soils was almost completed within two
days by a 50:50 mixture of water and ethanol. Higher reaction rates were observed for
TeCB than for PCP. The activity of the catalyst was slowly lost as contaminant mass
was removed from the soil. The deactivated catalyst was successfully regenerated with a
dilute sodium hypochlorite solution. The results of this research suggest that REACH
could be a viable technology for some contaminated soils.
Page 5
v
ACKNOWLEDGMENTS
I would like to express sincere thanks to my advisor, Dr. Jeffrey A. Cunningham, for his
direction, encouragement, and support throughout my doctoral program. I dare to say
that I learned how to approach and conduct advanced research in the environmental
engineering field from this doctoral training under Dr. Cunningham’s supervision.
I would also like to thank my co-advisor, Dr. Bill Batchelor, for his valuable
advice on my research and important administrative support of my Ph.D. program. I also
thank members of my committee, Dr. Robin Autenrieth and Dr. Honbin Zhan, for their
advice and assistance with my Ph.D. program and dissertation.
I would like to present special thanks to Dr. Kwangyul Kim and Dr. Hang-Bae
Jun, at Chungbuk National University in Republic of Korea for their encouragement and
for giving me momentum to pursue master’s and doctoral degrees in the United States.
This research was partially supported by the Texas Hazardous Waste Research
Center (THWRC) through grant 034TAM0905. Any opinions, findings, conclusions, or
recommendations are those of the author and do not necessarily reflect the views of
THWRC.
I would like to thank my parents for their encouragement, patience, and support
throughout my life. I have to thank to my lovely wife, Jung-Min Lee, for her love and
endless support for my graduate study. I am also grateful to my daughter, In-Seo for her
graceful smiles.
Page 6
vi
TABLE OF CONTENTS
Page
ABSTRACT .....................................................................................................................iii
ACKNOWLEDGMENTS................................................................................................. v
TABLE OF CONTENTS ................................................................................................. vi
LIST OF FIGURES........................................................................................................... x
LIST OF TABLES ..........................................................................................................xii
CHAPTER
I INTRODUCTION................................................................................................. 1
1.1. Problem statement .......................................................................................... 1
1.2. Background on Pd-catalyzed hydrodehalogenation ....................................... 4
1.3. Research objectives ........................................................................................ 7
1.4. Dissertation overview..................................................................................... 8
II EXTRACTION OF HALOGENATED HYDROPHOBIC ORGANIC
COMPOUNDS FROM CONTAMINATED SOILS USING WATER-
ETHANOL MIXTURES IN BATCH MODE .................................................... 10
2.1. Introduction .................................................................................................. 10
2.2. Materials and methods ................................................................................. 11
2.2.1. Chemicals ............................................................................................ 11
2.2.2. Soil ...................................................................................................... 11
2.2.3. Determination of concentrations in contaminated soil........................ 14
2.2.4. Extraction in batch mode..................................................................... 16
2.2.5. Analysis ............................................................................................... 17
2.3. Results and discussion.................................................................................. 18
2.3.1. Effect of solvent composition ............................................................. 18
2.3.2. Effect of extraction time...................................................................... 18
2.3.3. Effect of solvent volume ..................................................................... 20
2.4. Conclusions .................................................................................................. 22
Page 7
vii
CHAPTER Page
III PALLADIUM-CATALYZED HYDRODEHALOGENATION OF
1,2,4,5-TETRACHLOROBENZENE IN WATER-ETHANOL
MIXTURES ........................................................................................................ 24
3.1. Introduction .................................................................................................. 24
3.2. Materials and methods ................................................................................. 25
3.2.1. Chemicals and catalyst ........................................................................ 25
3.2.2. Pd-catalyzed HDH reaction studies..................................................... 25
3.2.3. Sampling and analysis ......................................................................... 29
3.2.4. Control experiments ............................................................................ 29
3.3. Theoretical and mathematical model ........................................................... 30
3.4. Results and discussion.................................................................................. 34
3.4.1. Effect of solvent composition on the Pd-catalyzed HDH rate ............ 34
3.4.2. Effect of catalyst concentration on the Pd-catalyzed HDH rate.......... 38
3.4.3. Effect of initial concentration of TeCB on the Pd-catalyzed
HDH rate ............................................................................................. 40
3.4.4. Transformation of TeCB by the Pd-catalyzed HDH........................... 42
3.4.5. Discussion of significance................................................................... 43
3.5. Conclusions .................................................................................................. 45
IV PALLADIUM-CATALYZED HYDRODEHALOGENATION OF
PENTACHLOROPHENOL IN WATER-ETHANOL MIXTURES.................. 49
4.1. Introduction .................................................................................................. 49
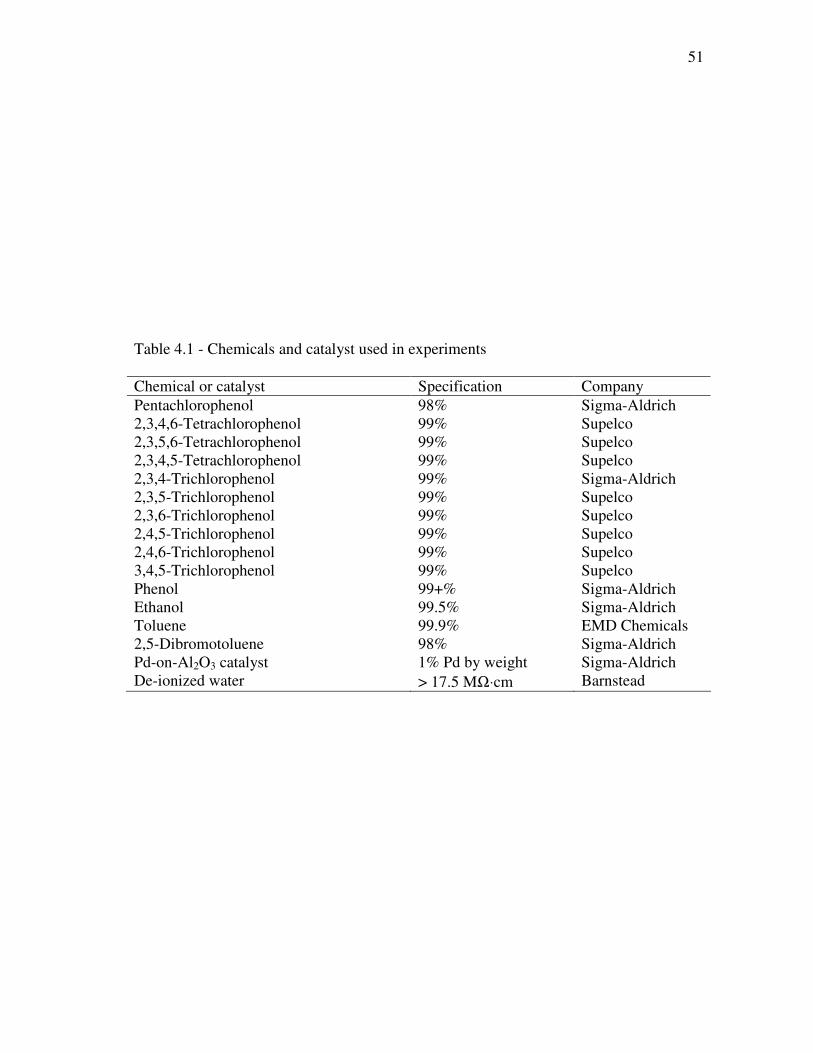
4.2. Materials and methods ................................................................................. 49
4.2.1. Chemicals and catalyst ........................................................................ 49
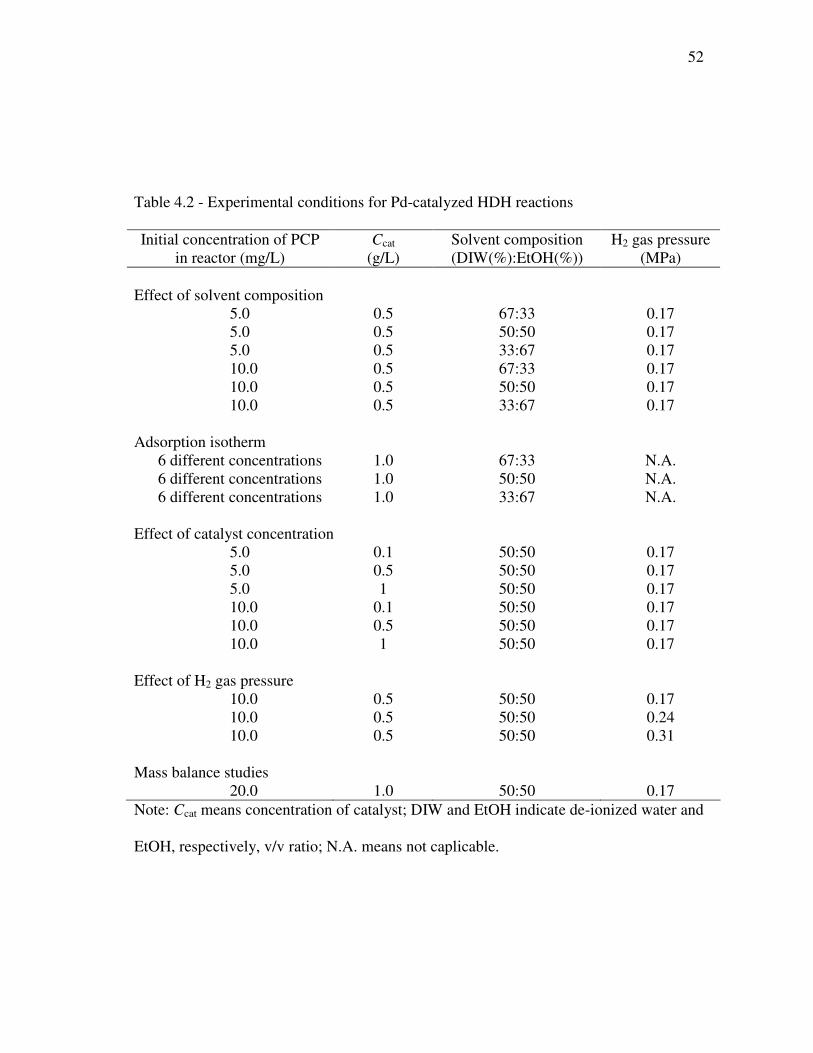
4.2.2. Pd-catalyzed HDH kinetics studies ..................................................... 50
4.2.3. Adsorption isotherm studies................................................................ 53
4.2.4. Mass balance studies ........................................................................... 54
4.2.5. Control experiments ............................................................................ 54
4.3. Results and discussion.................................................................................. 55
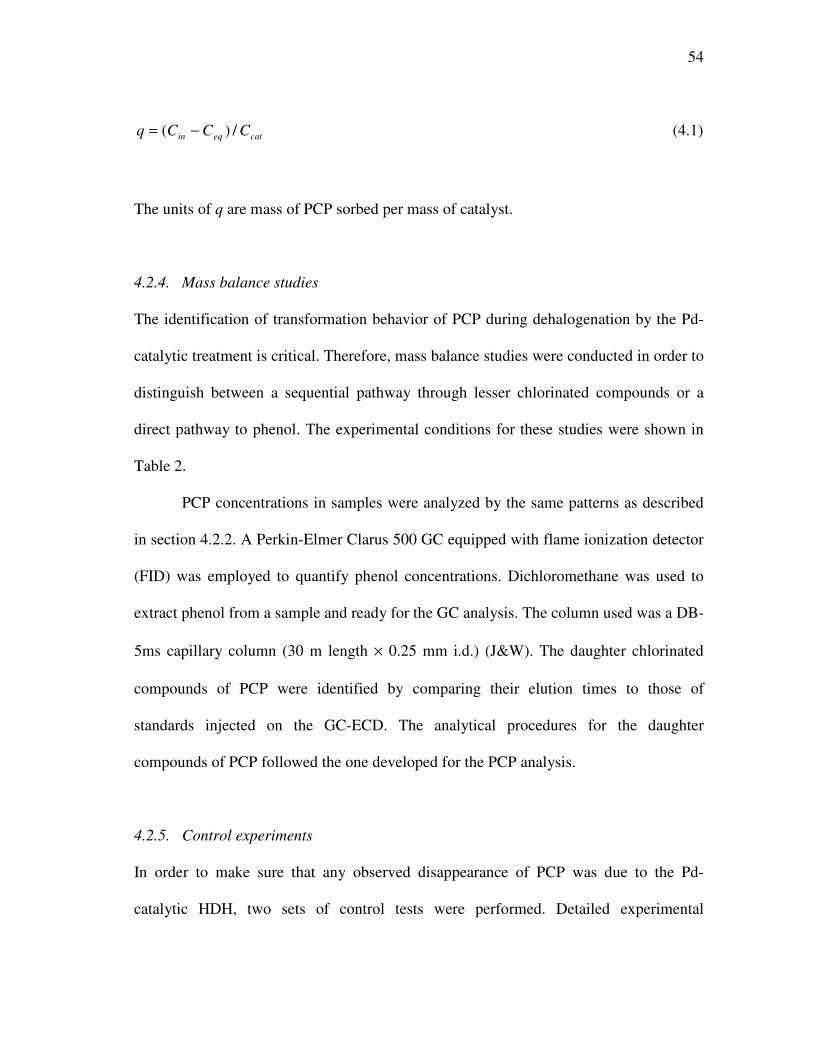
4.3.1. Effect of solvent composition on the Pd-catalyzed HDH rate ............ 55
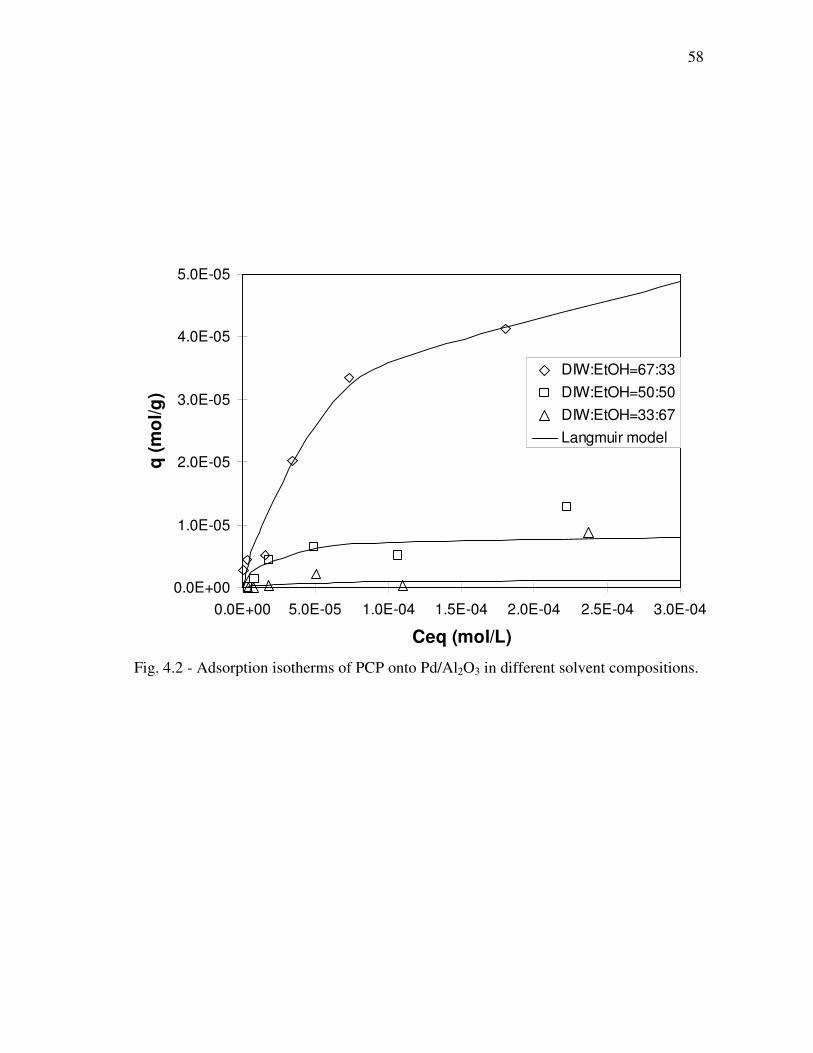
4.3.2. Adsorption isotherms .......................................................................... 57
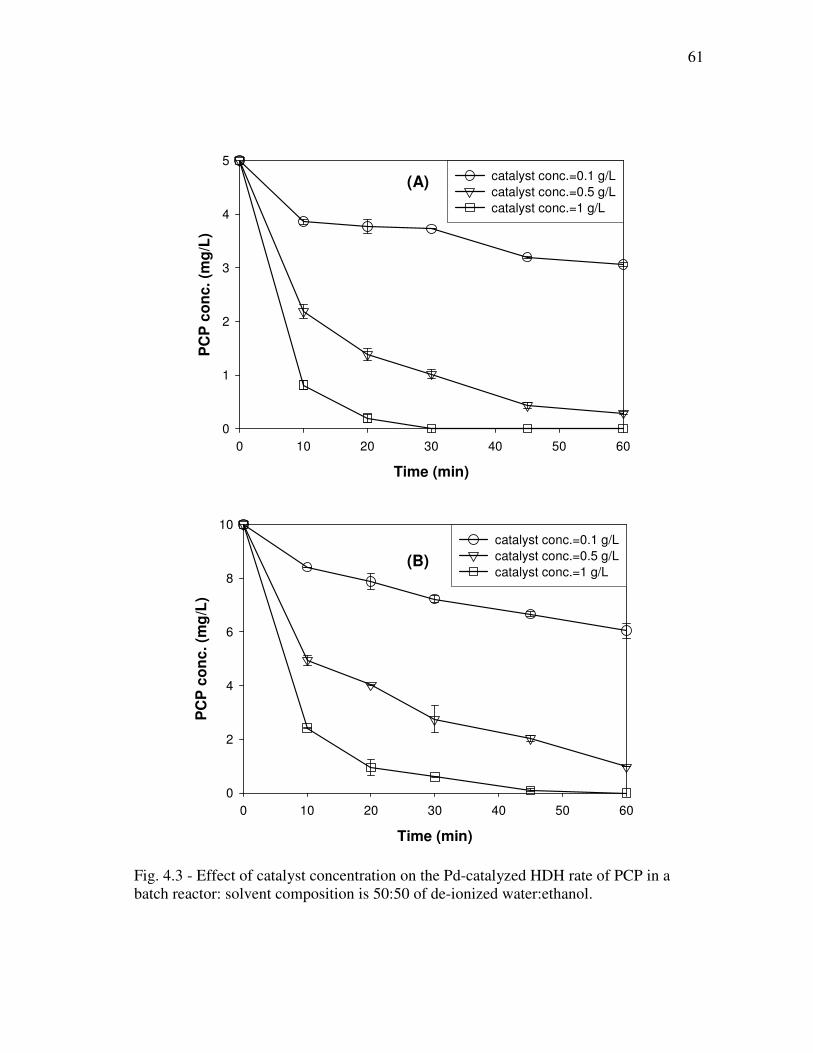
4.3.3. Effect of catalyst concentration on the Pd-catalyzed HDH rate.......... 60
4.3.4. Effect of H2 pressure on the Pd-catalyzed HDH rate .......................... 62
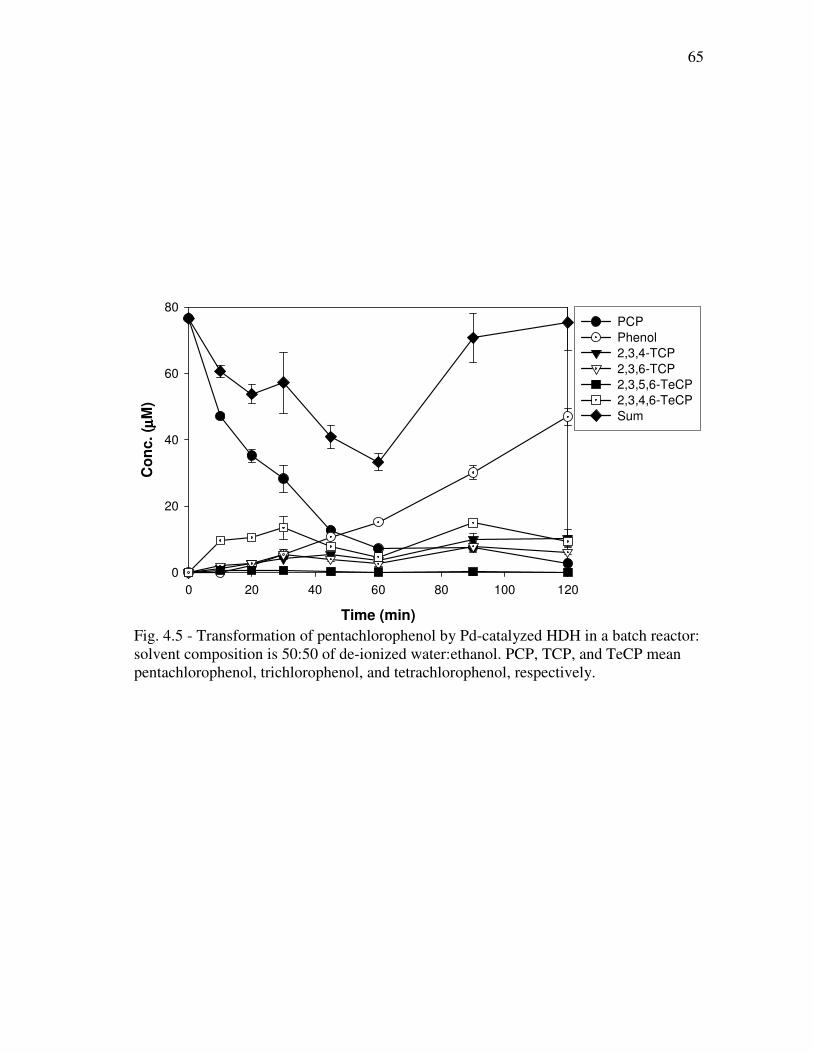
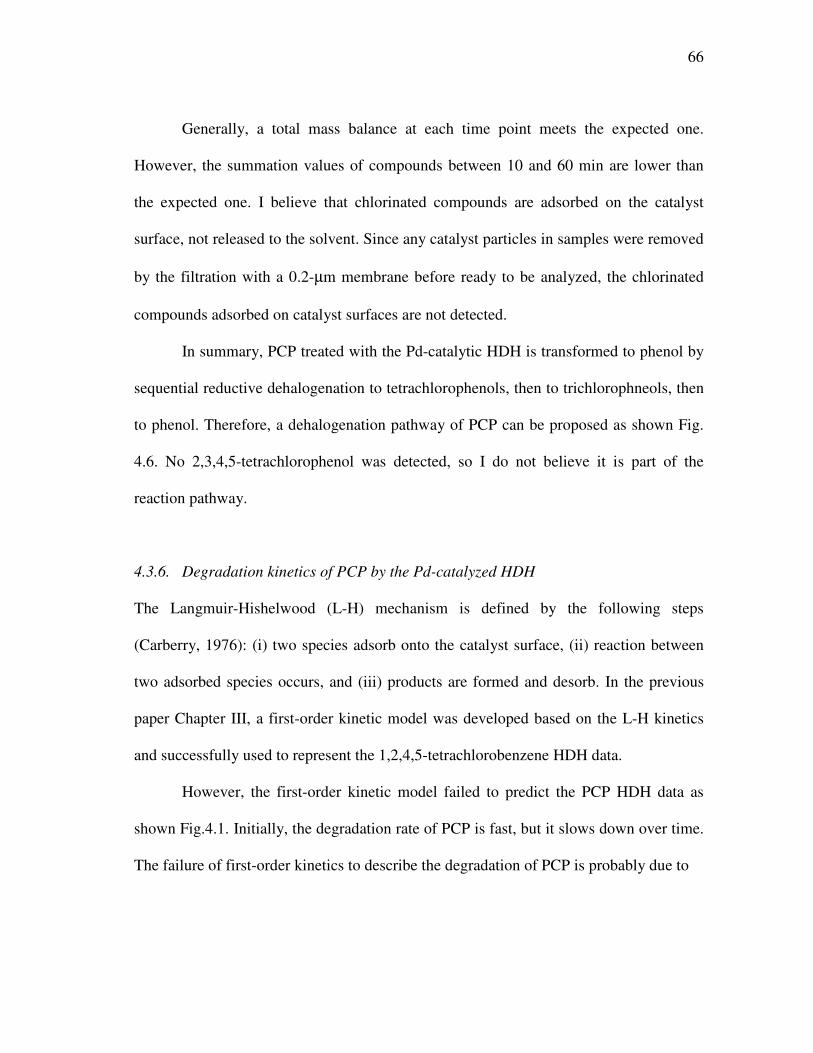
4.3.5. Transformation of PCP by the Pd-catalyzed HDH ............................. 64
4.3.6. Degradation kinetics of PCP by the Pd-catalyzed HDH ..................... 66
4.4. Conclusions .................................................................................................. 68
Page 8
viii
CHAPTER Page
V STUDIES OF THE REACH TECHNOLOGY IN CONTINUOUS
MODE: SYNTHETICALLY CONTAMINATED SOILS IN THE
LABORATORY.................................................................................................. 70
5.1. Introduction .................................................................................................. 70
5.2. Materials and methods ................................................................................. 70
5.2.1. Chemicals ............................................................................................ 70
5.2.2. Lab contaminated soils........................................................................ 71
5.2.3. Closed-loop treatment system ............................................................. 72
5.2.4. System operation ................................................................................. 76
5.2.5. Evaluation of system performance ...................................................... 77
5.2.6. Control experiments ............................................................................ 80
5.3. Results and discussion.................................................................................. 80
5.3.1. Contaminant extraction rate ................................................................ 80
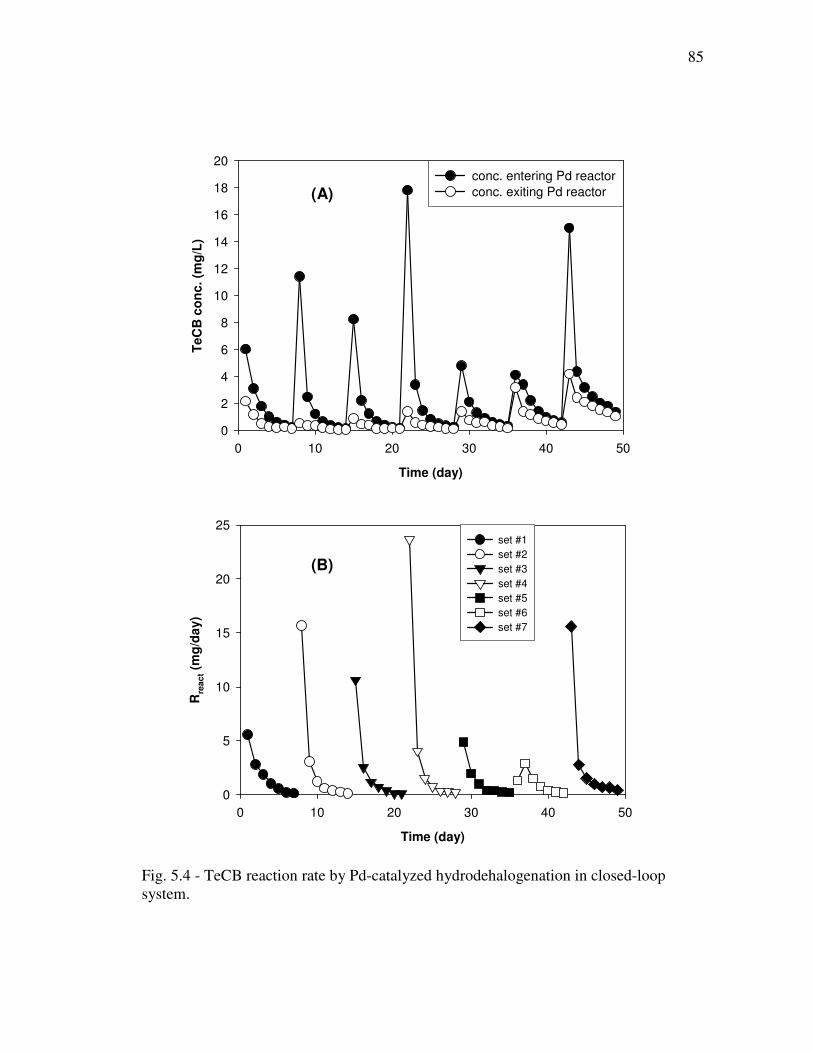
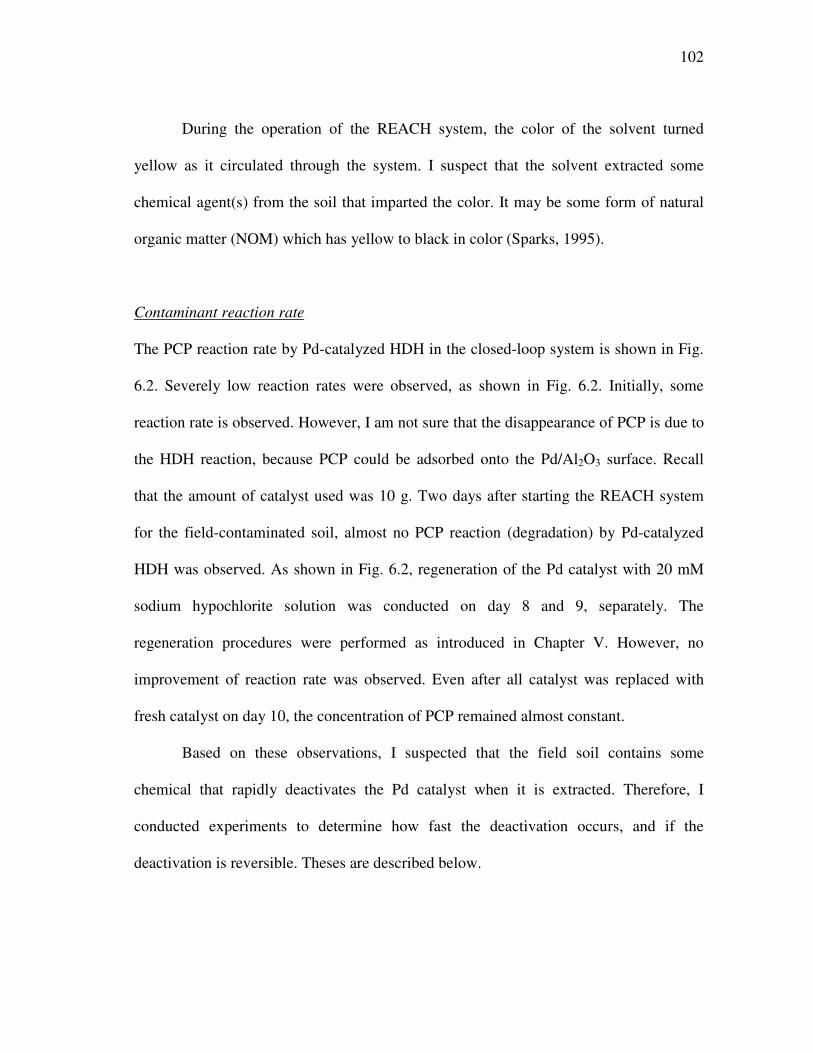
5.3.2. Contaminant reaction rate ................................................................... 84
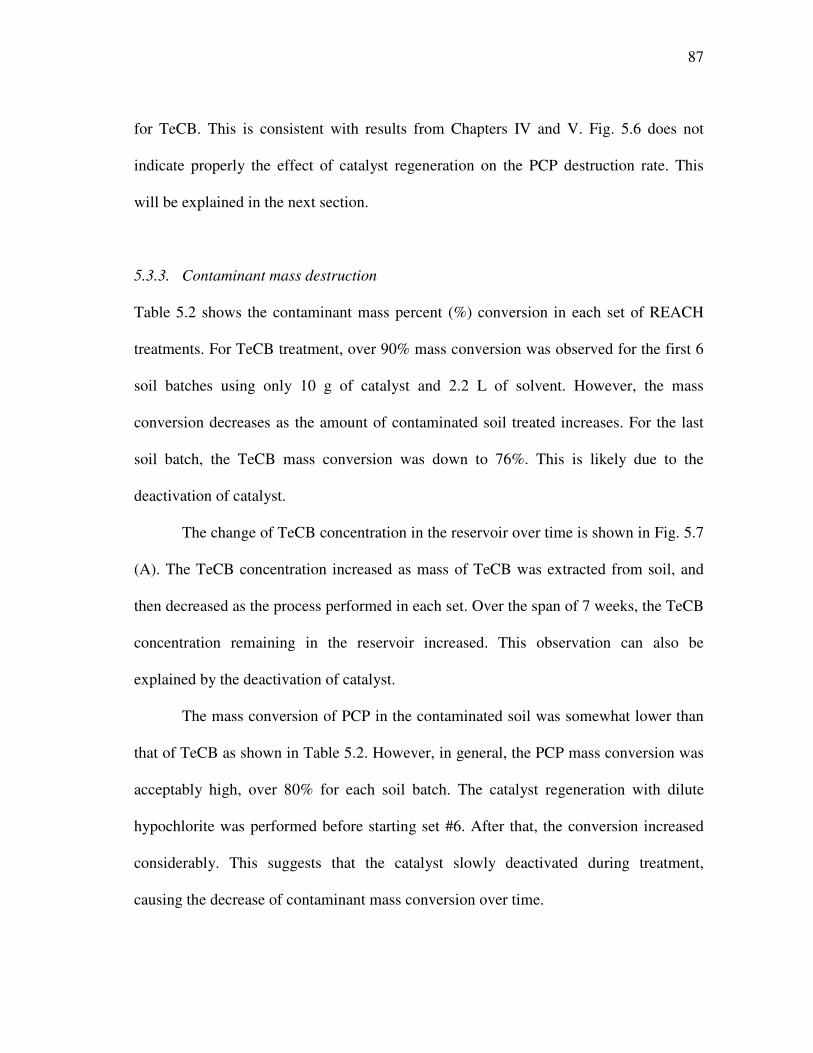
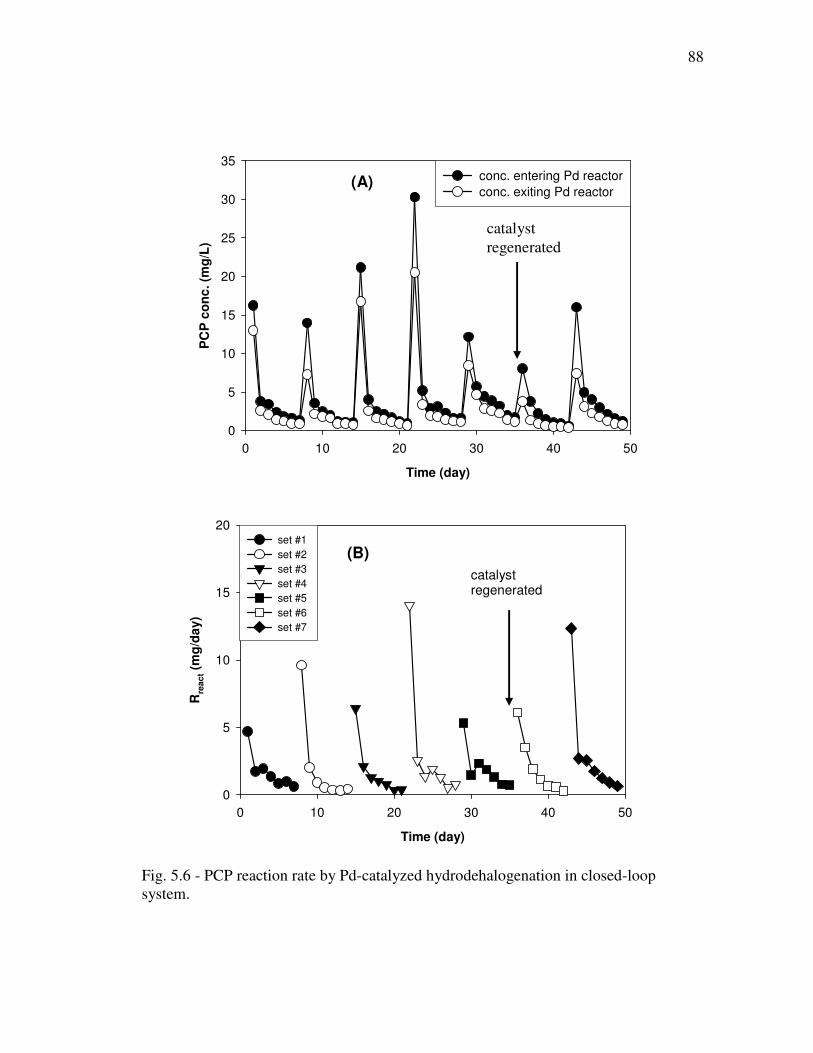
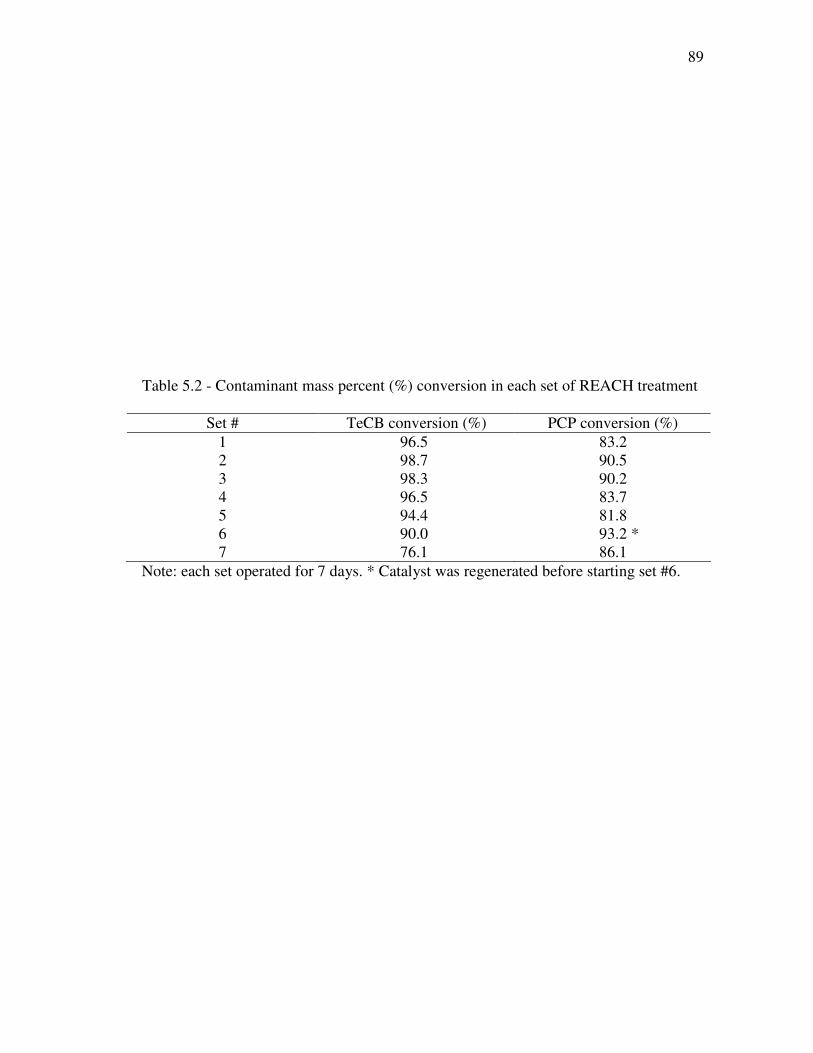
5.3.3. Contaminant mass destruction ............................................................ 87
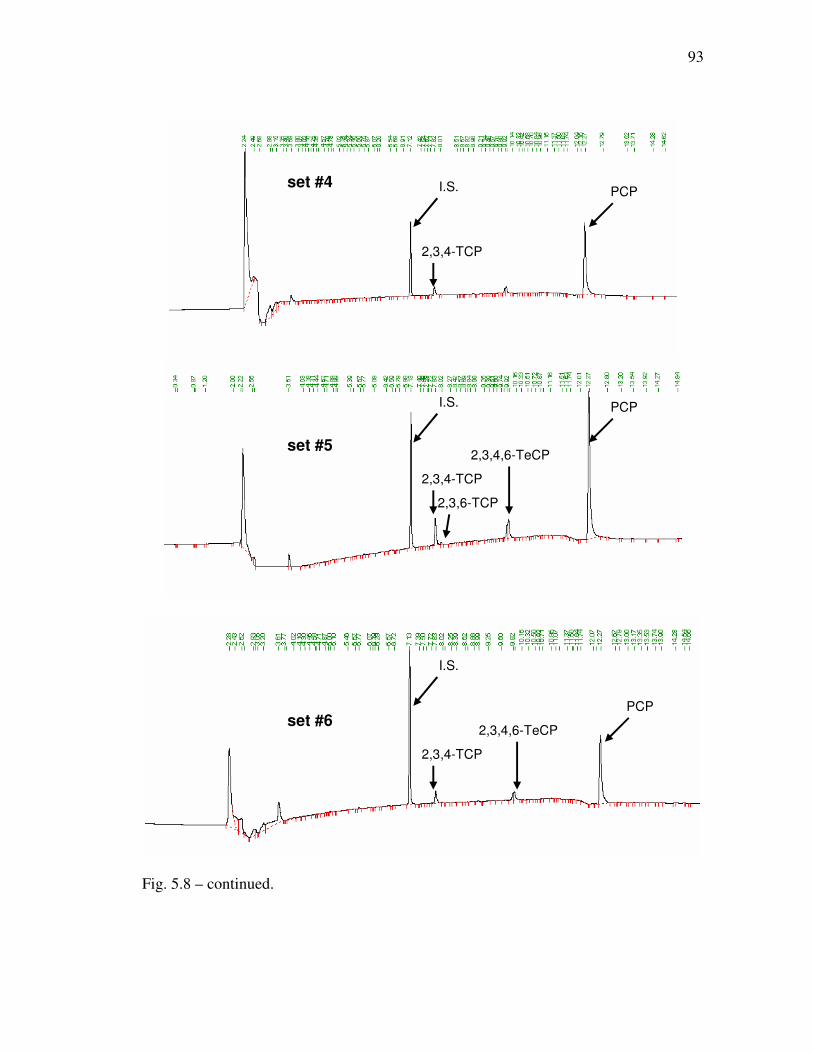
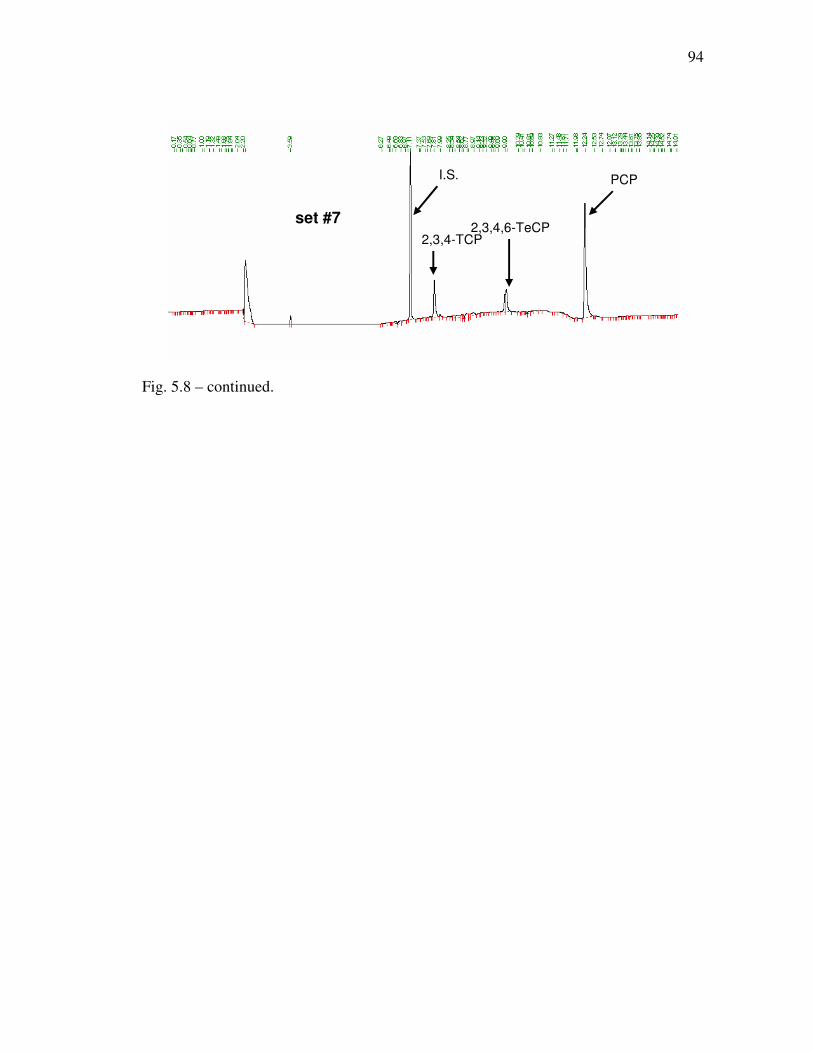
5.3.4. Intermediate products of PCP ............................................................. 91
5.4. Conclusions .................................................................................................. 95
VI STUDIES OF THE REACH TECHNOLOGY IN CONTINUOUS
MODE: A FIELD SOIL CONTAMINATED BY
PENTACHLOROPHENOL................................................................................ 97
6.1. Introduction .................................................................................................. 97
6.2. Contaminated soil......................................................................................... 98
6.2.1. Site description and history ................................................................. 98
6.2.2. Field soil handling and analysis .......................................................... 99
6.3. REACH operation with field-contaminated soil .......................................... 99
6.3.1. Experimental method .......................................................................... 99
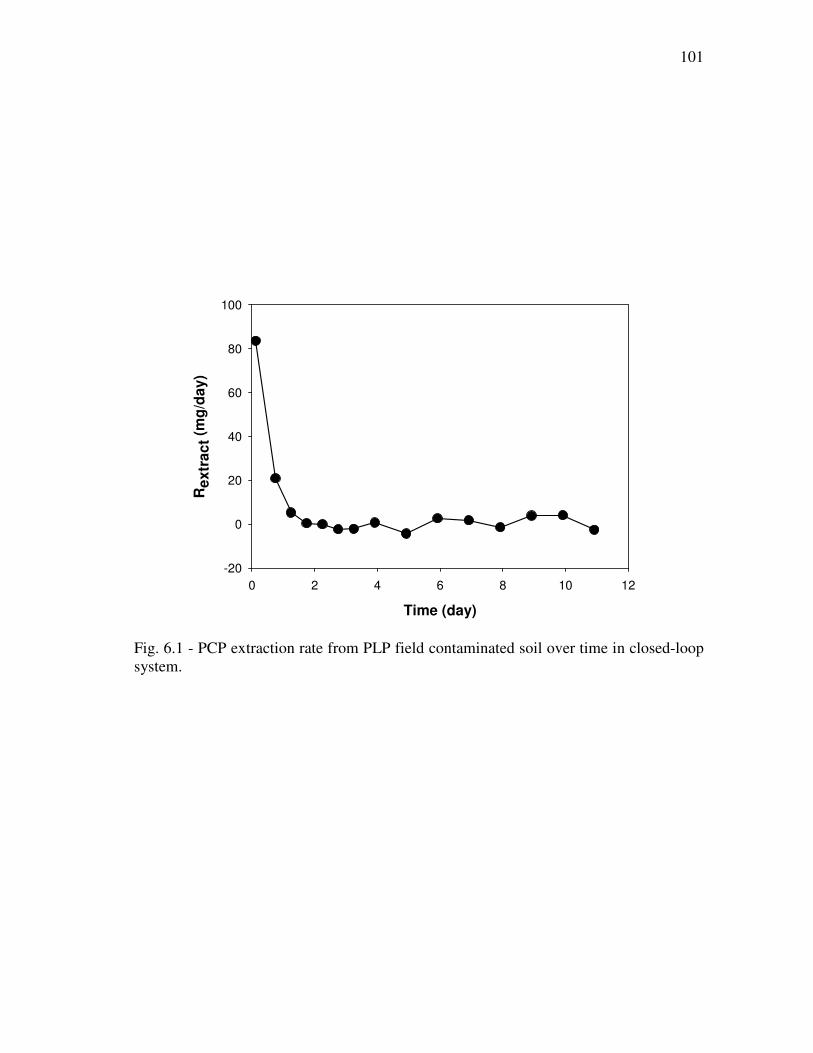
6.3.2. Results and discussion....................................................................... 100
6.4. Catalyst deactivation experiment ............................................................... 104
6.4.1. Experimental method ........................................................................ 104
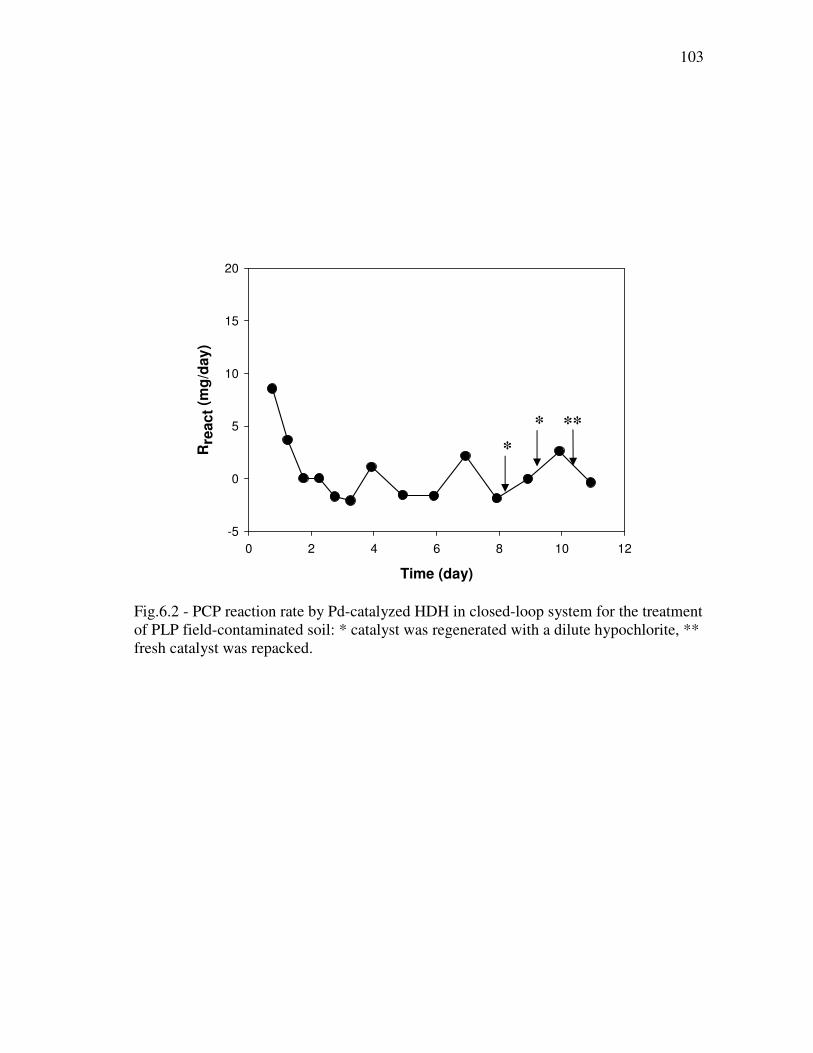
6.4.2. Results and discussion....................................................................... 104
6.5. Catalyst regeneration experiment............................................................... 106
6.5.1. Experimental method ........................................................................ 106
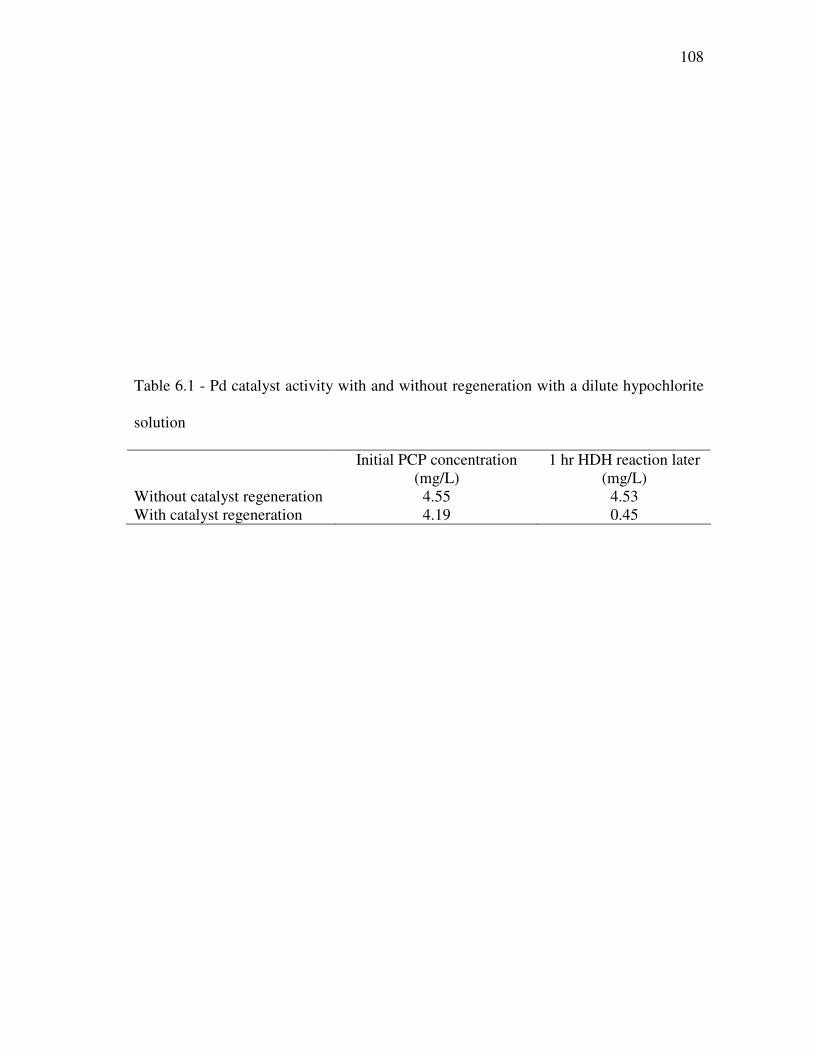
6.5.2. Results and discussion....................................................................... 107
6.6. Hypothesis for catalyst deactivation........................................................... 107
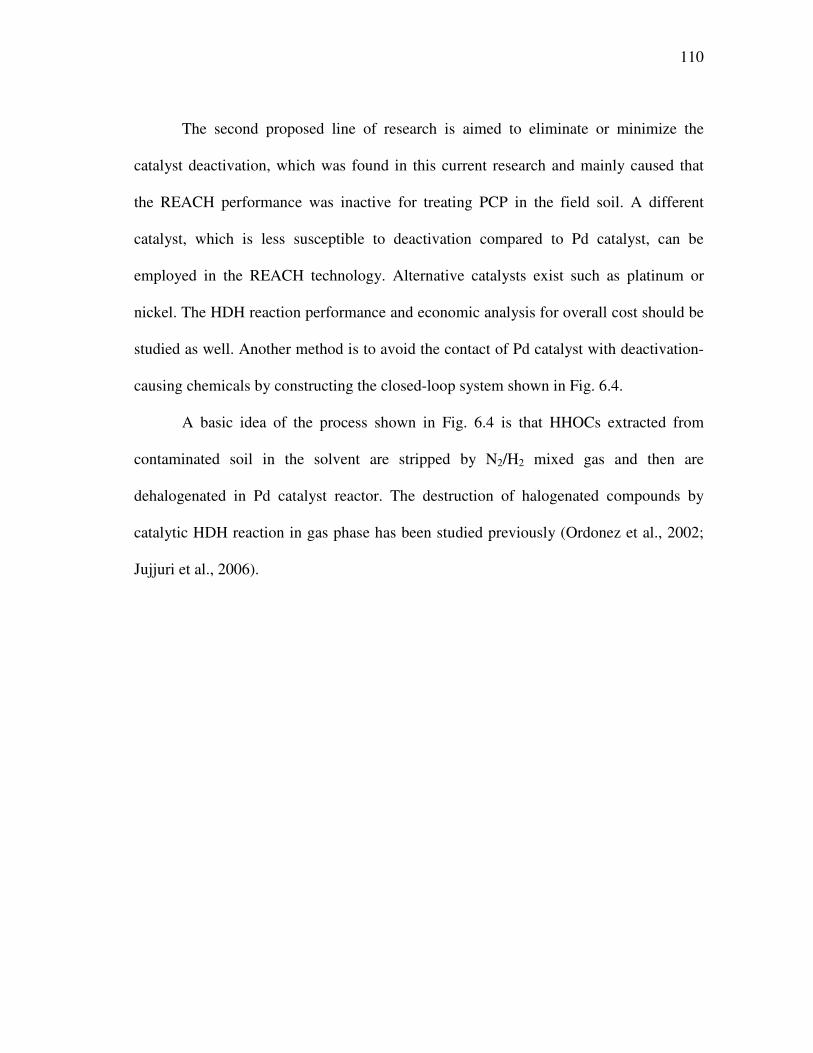
6.7. Summary and proposed research for the future ......................................... 109
Page 9
ix
CHAPTER Page
VII CONCLUSIONS AND RECOMMENDATIONS............................................ 112
7.1. Conclusions ................................................................................................ 112
7.1.1. Dependence on the key parameters for the extraction of selected
HHOCs from soil .............................................................................. 113
7.1.2. Dependence on the key parameters for the Pd-catalyzed HDH
of selected HHOCs............................................................................ 113
7.1.3. Demonstration of the REACH technology for a long period of
time in a closed-loop system ............................................................. 115
7.2. Recommendations for future research ....................................................... 116
REFERENCES.............................................................................................................. 118
VITA ........................................................................................................................... 123
Page 10
x
LIST OF FIGURES
Page
Fig. 1.1 Schematic diagram for typical operation of solvent extraction for
treating contaminated soil……………………………………….….
3
Fig. 1.2
Schematic diagram for the Remedial Extraction and Catalytic
Hydrodehalogenation (REACH) technology ………………...…….
5
Fig. 2.1 Effect of solvent composition and extraction time on the extraction
of TeCB and PCP from contaminated soil ……...…………………
19
Fig. 2.2 Effect of solvent volume on the extraction of TeCB and PCP from
contaminated soil ………………………………………...………
21
Fig. 3.1 Effect of solvent composition on the Pd-catalyzed HDH rate of
TeCB in a batch reactor…………………………...………………
36
Fig. 3.2 Effect of catalyst concentration on the Pd-catalyzed HDH rate of
TeCB in a batch reactor ……………………………...……………
39
Fig. 3.3 Effect of initial concentration of TeCB on the Pd-catalyzed HDH
rate in a batch reactor………………………………………...……
41
Fig. 3.4 Transformation of 1,2,4,5-tetrachlorobenzene in a batch reactor…
44
Fig. 4.1 Effect of solvent composition on the Pd-catalyzed HDH rate of
PCP in a batch reactor………………………………………...……
56
Fig. 4.2
Adsorption isotherms of PCP onto Pd/Al2O3 in different solvent
compositions…………………………………..…………………… 58
Fig. 4.3
Effect of catalyst concentration on the Pd-catalyzed HDH rate of
PCP in a batch reactor………………………………………...…… 61
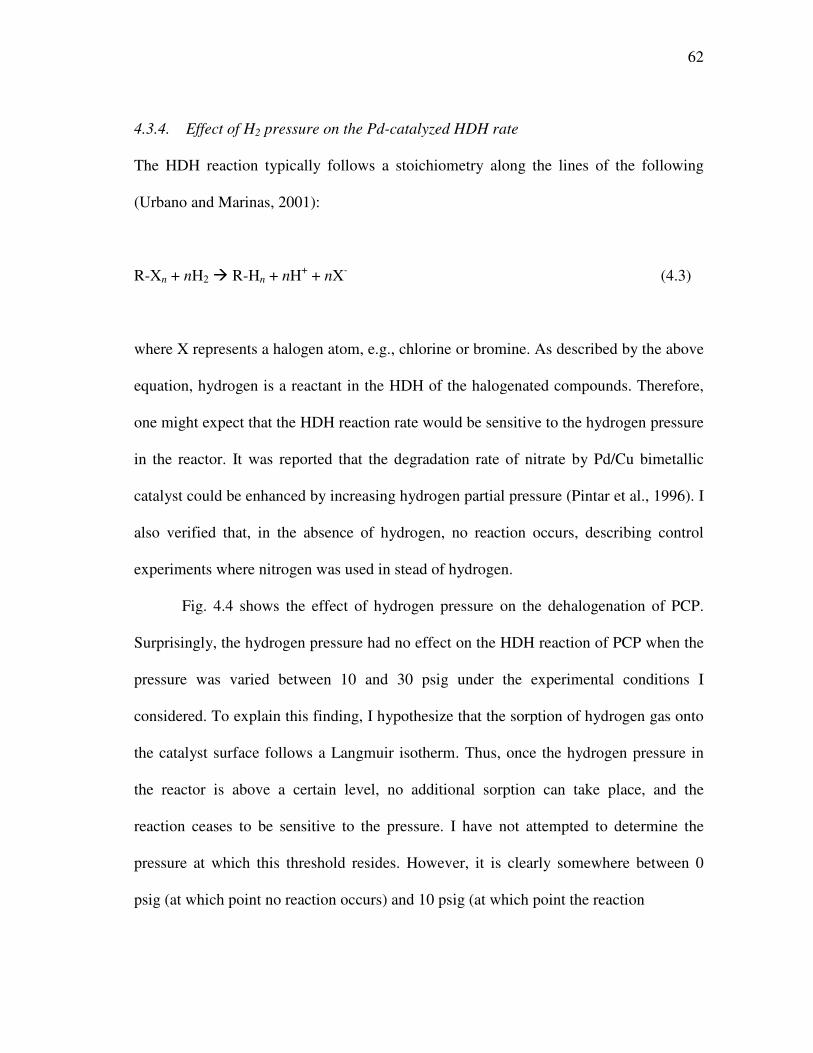
Fig. 4.4
Effect of H2 gas pressure on the Pd-catalyzed HDH rate of PCP in
a batch reactor………………………………………...…………… 63
Fig. 4.5
Transformation of pentachlorophenol by Pd-catalyzed HDH in a
batch reactor………………………………………...………………
65
Page 11
xi
Page
Fig. 4.6
Proposed transformation pathway of PCP by Pd-catalyzed HDH in
a water/ethanol mixture………………………………………...… 67
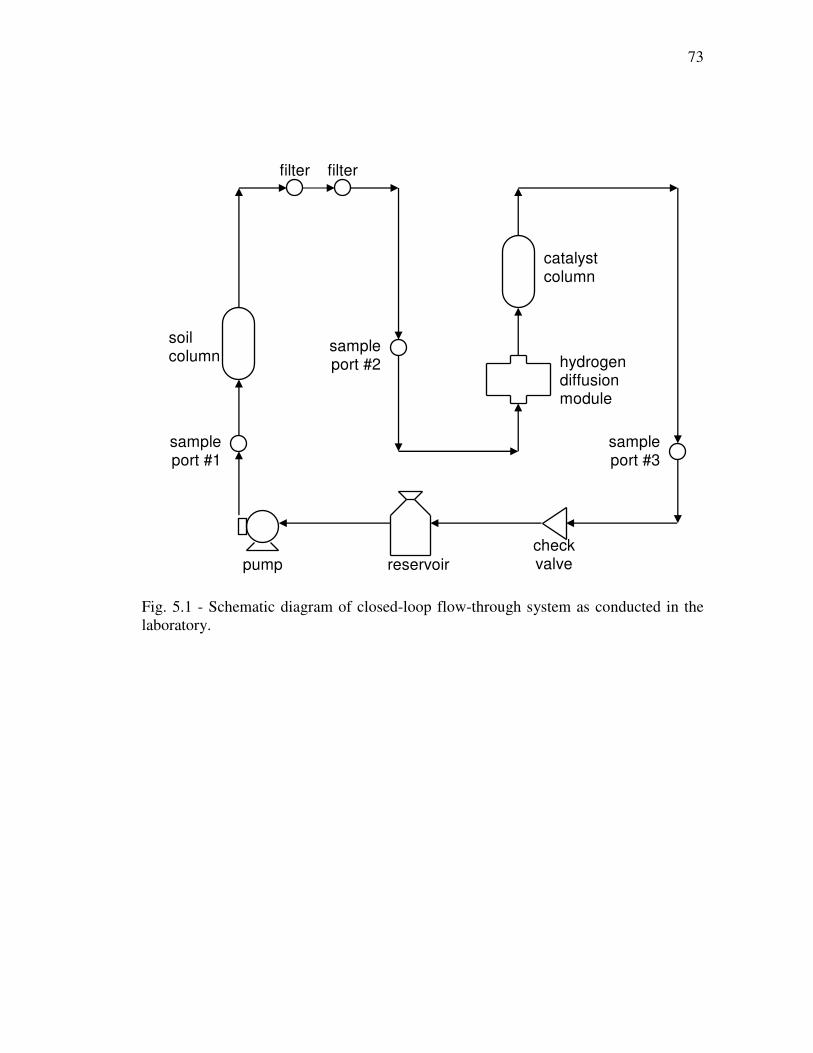
Fig. 5.1 Schematic diagram of closed-loop flow-through system as
conducted in the laboratory………………………………………...
73
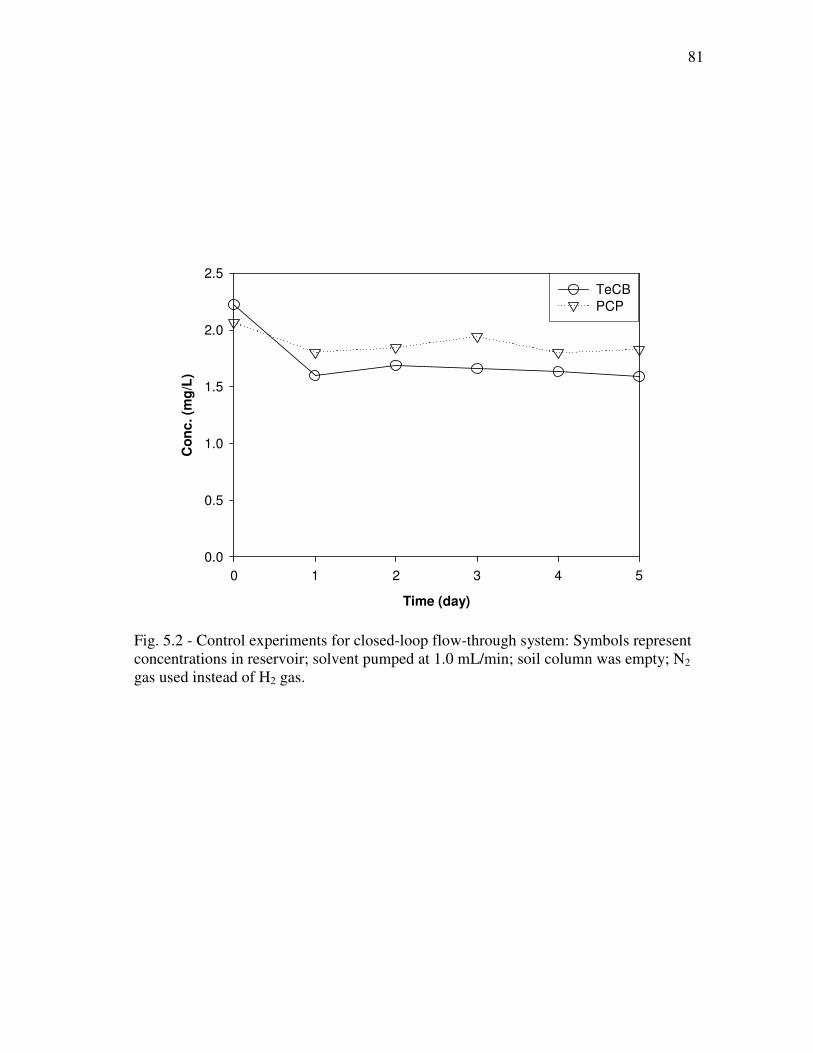
Fig. 5.2 Control experiments for closed-loop flow-through system………
81
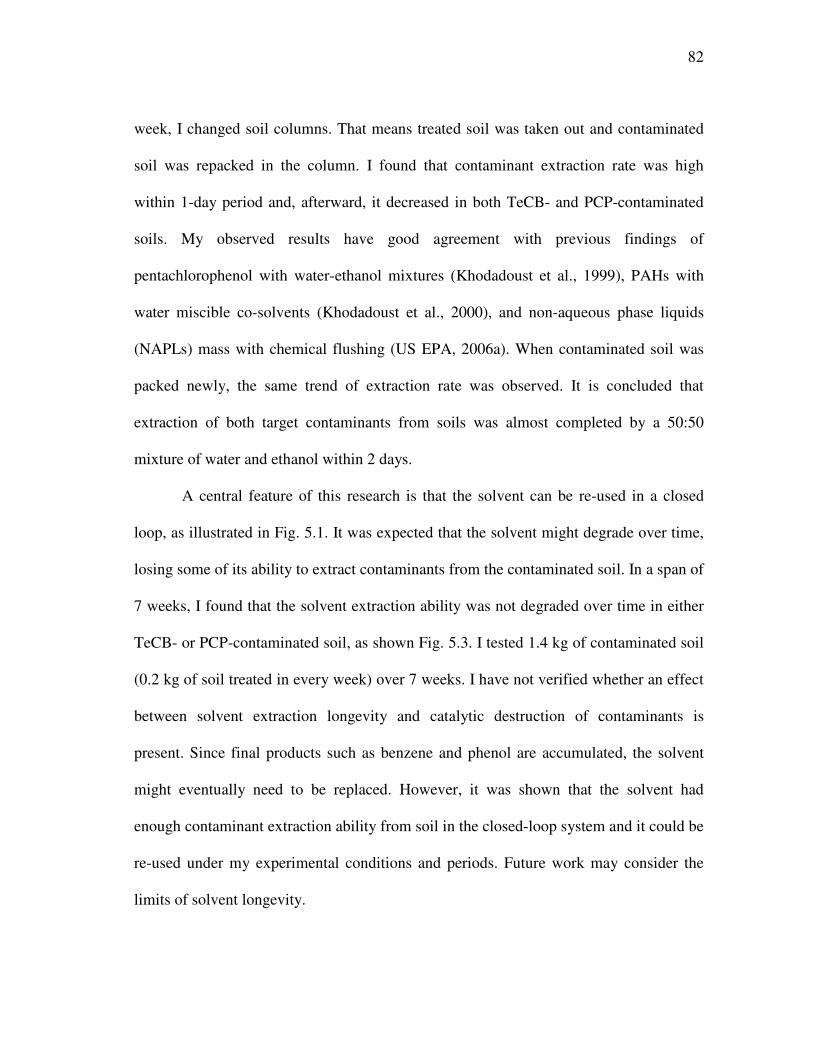
Fig. 5.3 Contaminant extraction rate over time……………………………
83
Fig. 5.4 TeCB reaction rate by Pd-catalyzed hydrodehalogenation in
closed-loop system………………………………………...………
85
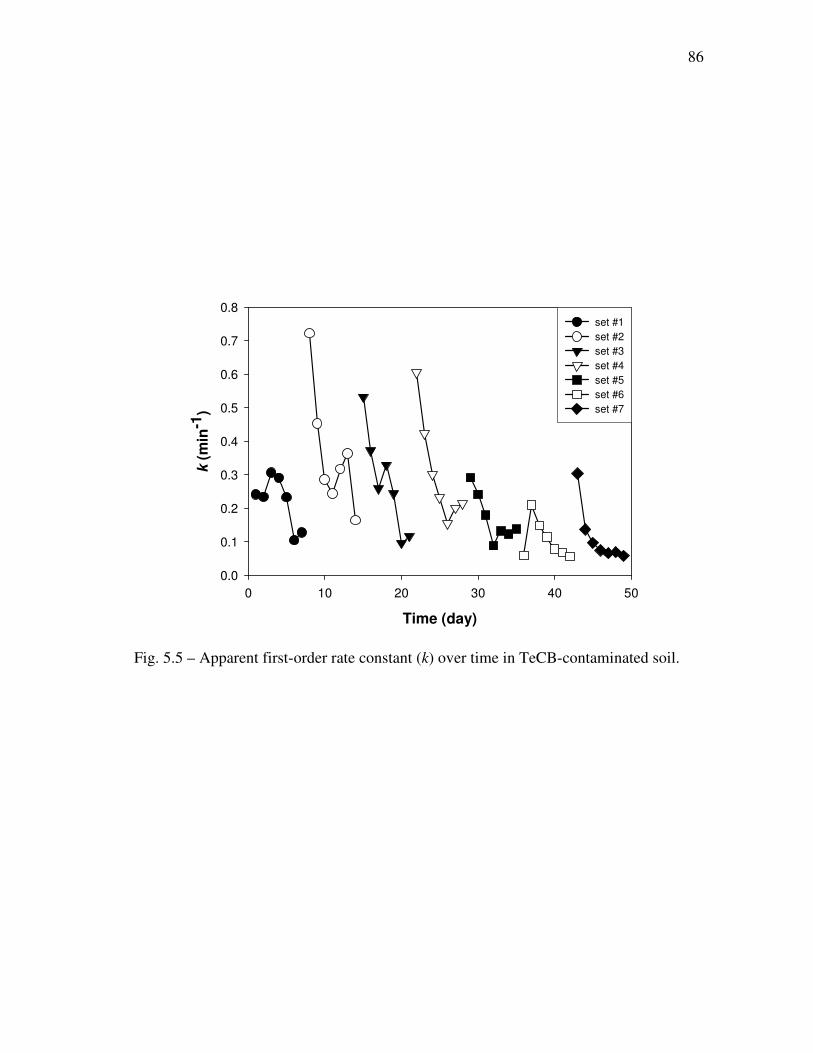
Fig. 5.5 Apparent first-order rate constant (k) over time in TeCB-
contaminated soil………………………………………...…………
86
Fig. 5.6
PCP reaction rate by Pd-catalyzed hydrodehalogenation in closed-
loop system………………………………………...………………
88
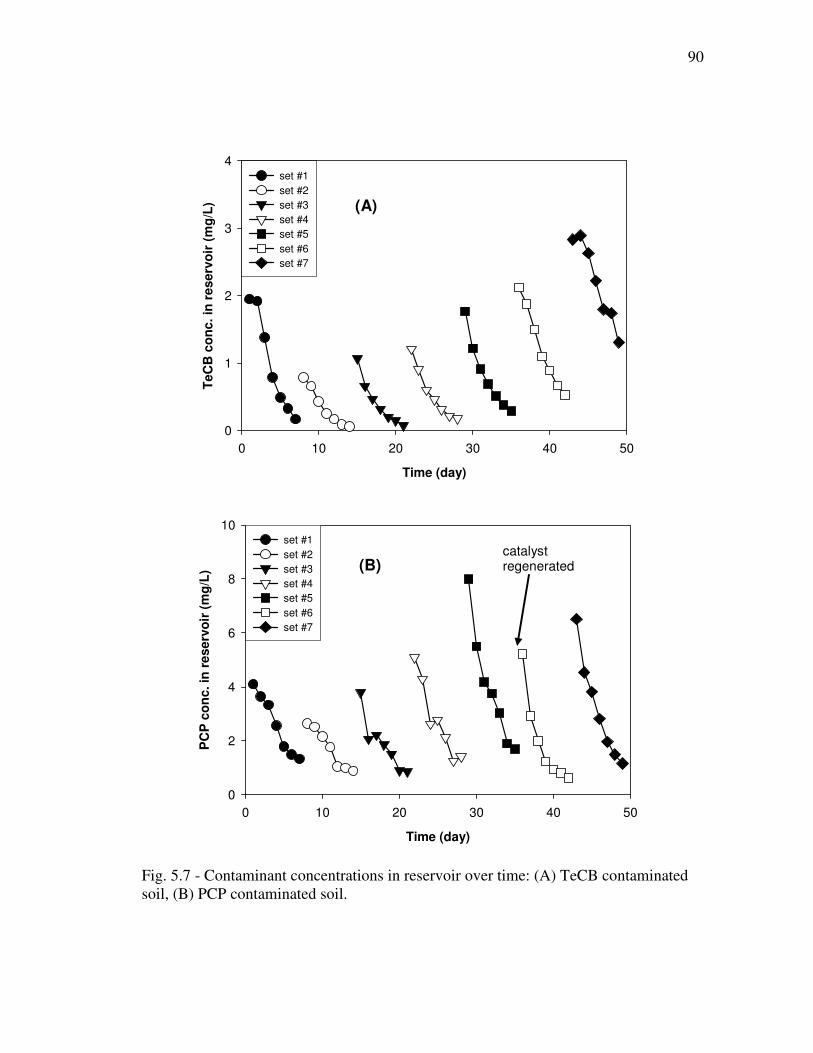
Fig. 5.7 Contaminant concentrations in reservoir over time……………… 90
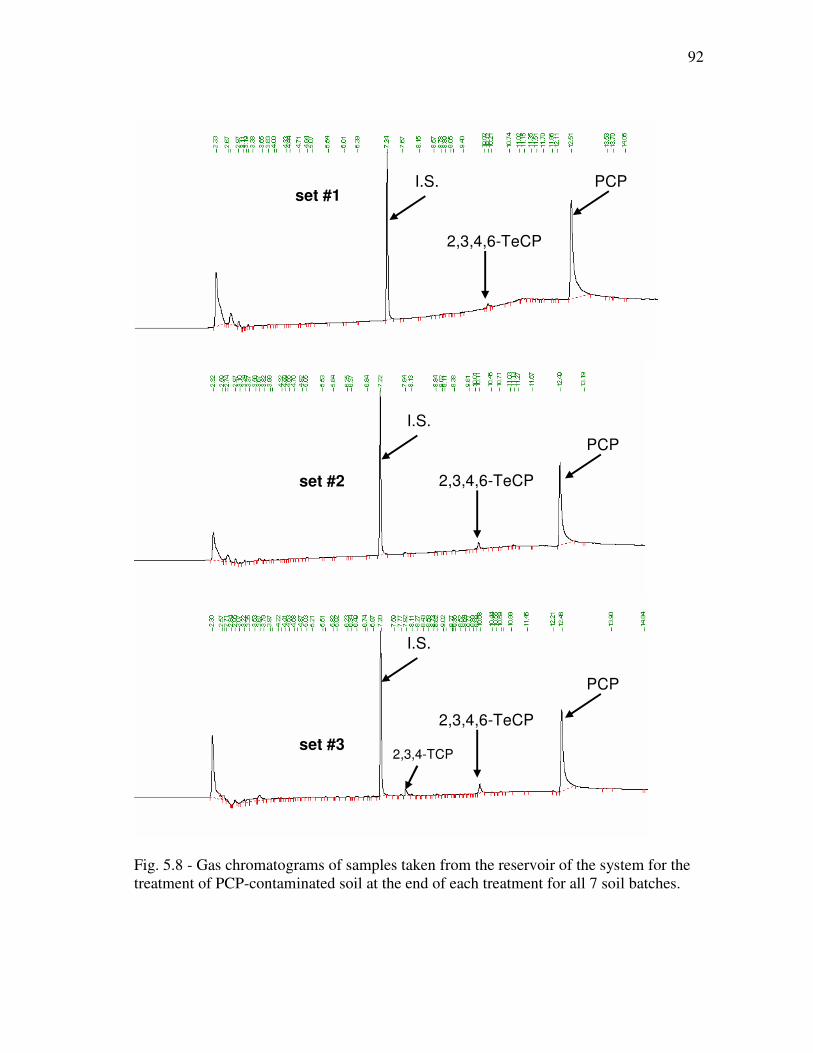
Fig. 5.8 Gas chromatograms of samples taken from the reservoir of the
system for the treatment of PCP-contaminated soil at the end of
each treatment for all 7 soil batches………………………………..
92
Fig. 6.1 PCP extraction rate from PLP field contaminated soil over time in
closed-loop system………………………………………...………
101
Fig. 6.2 PCP reaction rate by Pd-catalyzed HDH in closed-loop system for
the treatment of PLP field-contaminated soil………………………
103
Fig. 6.3 Pd catalyst deactivation rate with solvent used for extraction of
contaminated soil at PLP site……………………………………….
105
Fig. 6.4 Schematic diagram for the REACH technology with avoiding
contact of solvent with Pd catalyst…………………………………
111
Page 12
xii
LIST OF TABLES
Page
Table 2.1 Physical and chemical properties of TeCB and PCP……………... 13
Table 2.2 Experimental conditions for accelerated solvent extraction …....... 15
Table 3.1 Chemicals and catalyst used in experiments……………………… 26
Table 3.2 Experimental conditions for Pd-catalyzed HDH reactions……….. 28
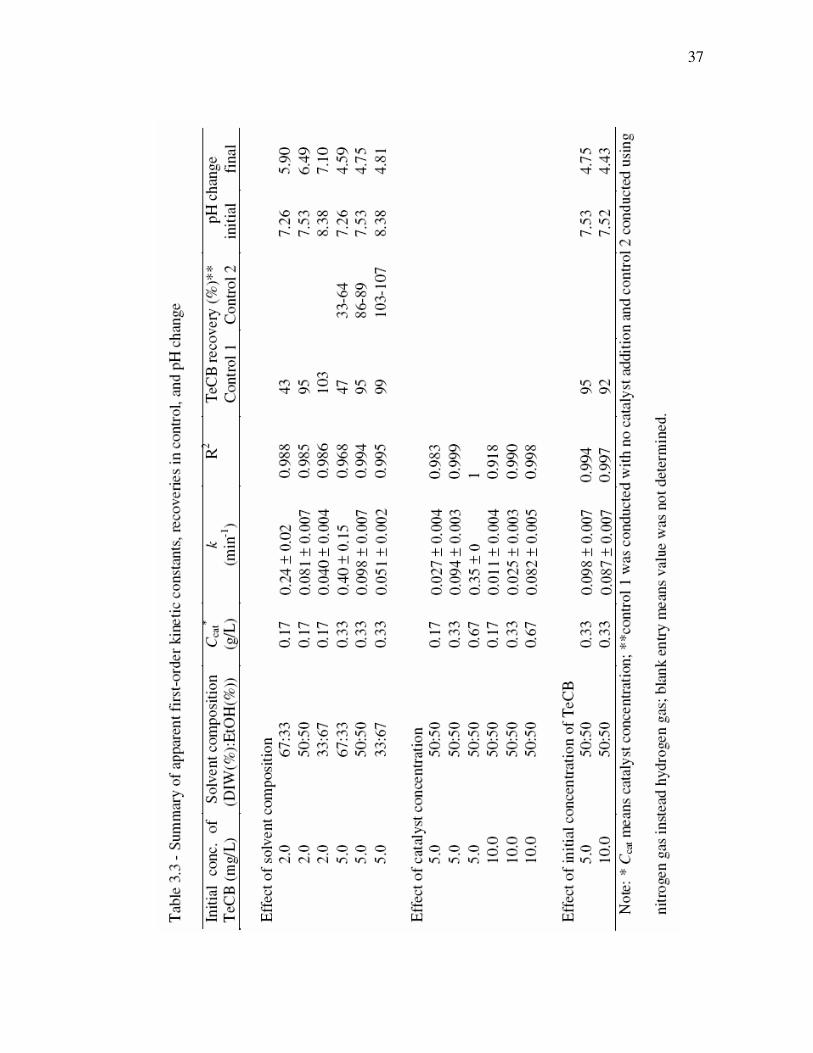
Table 3.3
Summary of apparent first-order kinetic constants, recoveries in
control, and pH change…………………………………………….
37
Table 4.1 Chemicals and catalyst used in experiments……………………… 51
Table 4.2 Experimental conditions for Pd-catalyzed HDH reactions……….. 52
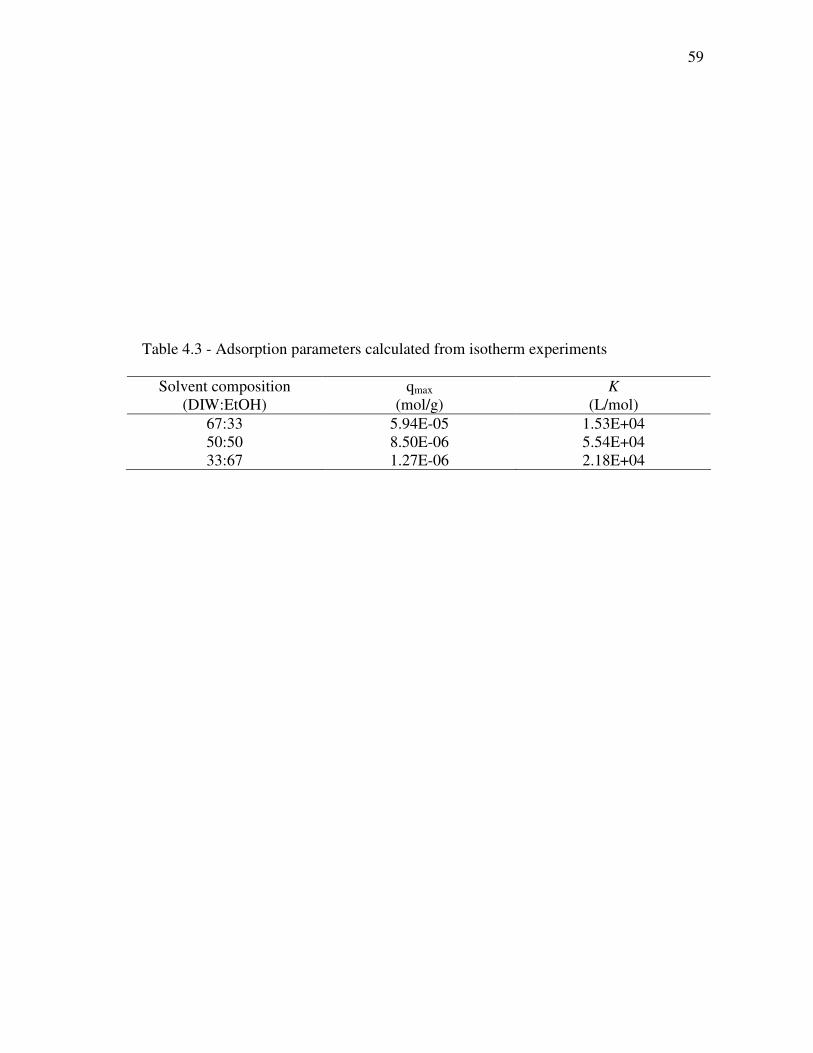
Table 4.3 Adsorption parameters calculated from isotherm experiments…… 59
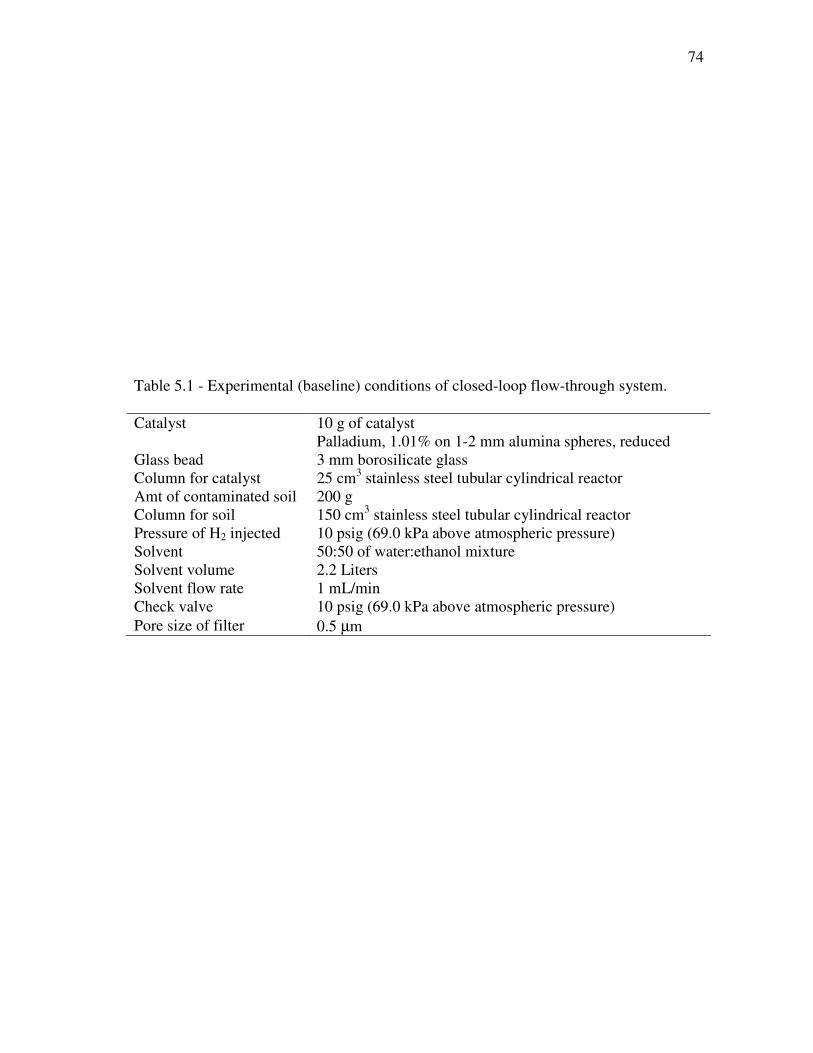
Table 5.1 Experimental (baseline) conditions of closed-loop flow-through
system……………………………………………………………..
74
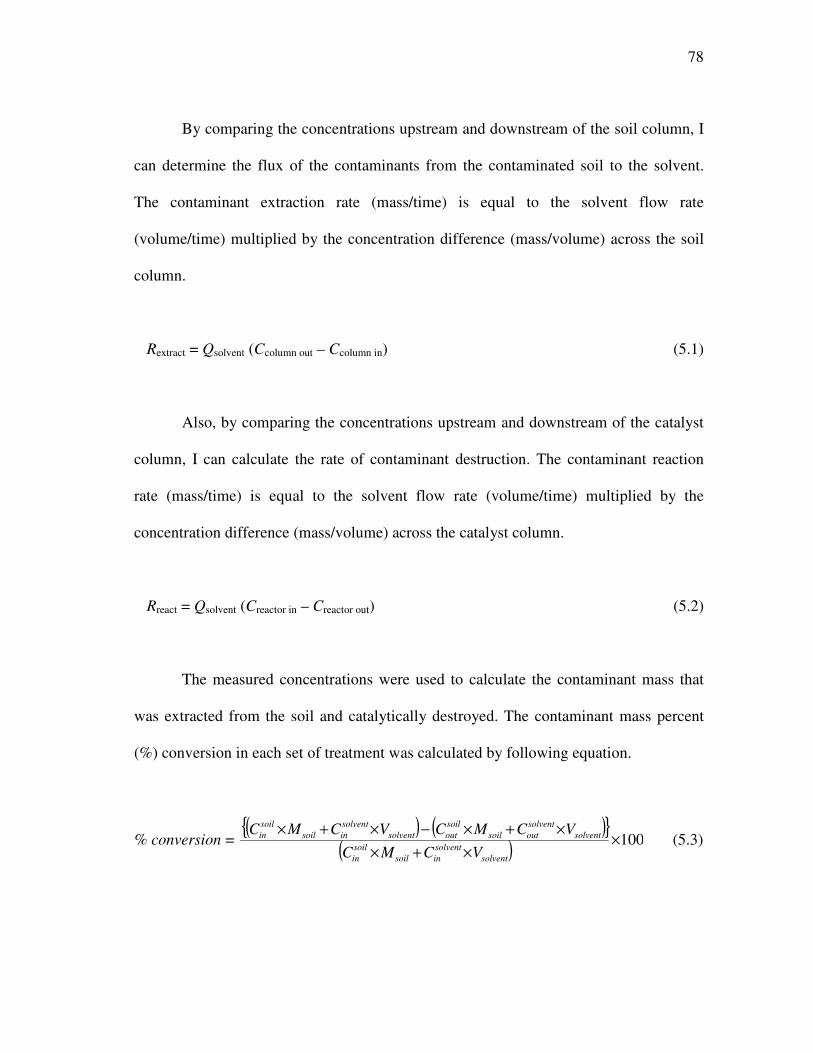
Table 5.2 Contaminant mass percent (%) conversion in each set of REACH
treatment ………………………………………………………….
89
Table 6.1
Pd catalyst activity with and without regeneration with a dilute
hypochlorite solution……………………………………………...
108
Page 13
1
CHAPTER I
INTRODUCTION
1.1. Problem statement
According to the U.S. Environmental Protection Agency (EPA), halogenated
hydrophobic organic compounds (HHOCs) are among the most commonly found
contaminants at sites on the National Priorities List (US EPA, 2006b). Polychlorinated
biphenyls (PCBs), pentachlorophenol (PCP), chlorinated benzenes, chlorinated aliphatic
hydrocarbons and their breakdown products (e.g., tetrachloroethene, trichloroethene, and
dichloroethene), and some pesticides (e.g., DDT, chlordane) belong to the category of
HHOCs. In general, the HHOCs are persistent in the environment and have harmful
effects to the public. Therefore, a need exists to clean up these contaminants within a
short time period and with low cost.
The purpose of this research was to develop and assess a new method for
removing and destroying soil contaminants, in particular HHOCs. Many of the HHOCs
tend to reside preferentially in soil as opposed to air or water, because of their
hydrophobic chemistry and their relatively low volatility.
Unfortunately, the biodegradation rates of HHOCs in soil are often very slow,
______________________________
This dissertation follows the style and format of Water Research.
Page 14
2
requiring months or years for adequate remediation (Speitel and Closmannn, 1991).
Incineration of those compounds is feasible, but high energy consumption is required to
reach the necessary temperatures, and incineration by-products such as polychlorinated
dibenzo-p-dioxins (PCDDs) and polychlorinated dibenzofurans (PCDFs) can be
generated (Liljelind et al., 2003). Numerous innovative treatment technologies already
exist for treating soils contaminated by HHOCs, each method with its own advantages
and disadvantages (US EPA, 1996a), but the method to be developed in this research is a
significant improvement over existing techniques, as explained below.
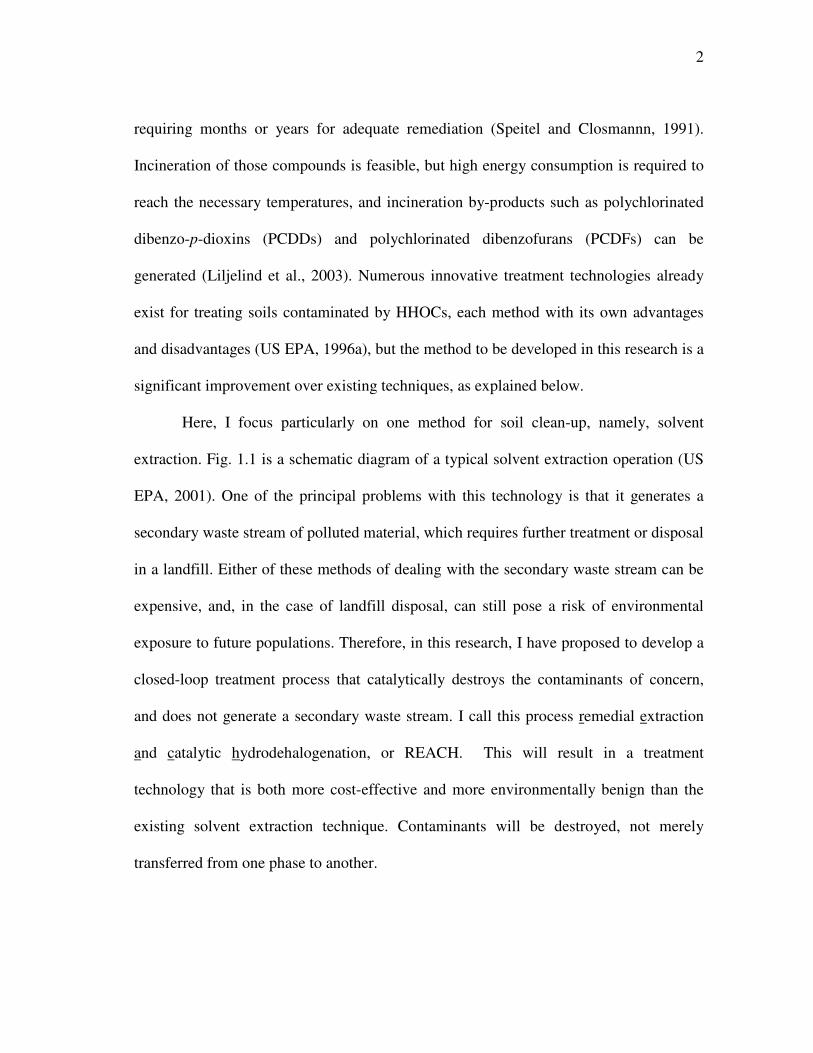
Here, I focus particularly on one method for soil clean-up, namely, solvent
extraction. Fig. 1.1 is a schematic diagram of a typical solvent extraction operation (US
EPA, 2001). One of the principal problems with this technology is that it generates a
secondary waste stream of polluted material, which requires further treatment or disposal
in a landfill. Either of these methods of dealing with the secondary waste stream can be
expensive, and, in the case of landfill disposal, can still pose a risk of environmental
exposure to future populations. Therefore, in this research, I have proposed to develop a
closed-loop treatment process that catalytically destroys the contaminants of concern,
and does not generate a secondary waste stream. I call this process remedial extraction
and catalytic hydrodehalogenation, or REACH. This will result in a treatment
technology that is both more cost-effective and more environmentally benign than the
existing solvent extraction technique. Contaminants will be destroyed, not merely
transferred from one phase to another.
Page 15
3
Fig. 1.1 - Schematic diagram for typical operation of solvent extraction for treating
contaminated soil (US EPA, 2001).
Page 16
4
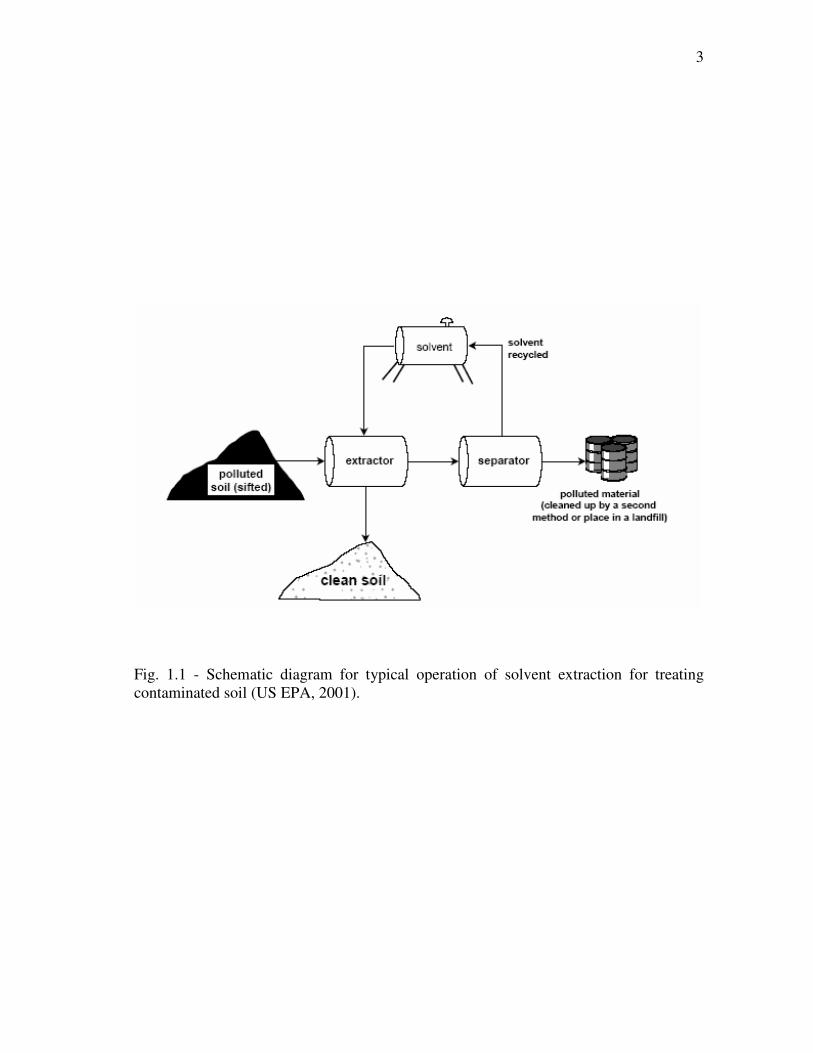
Fig. 1.2 is a schematic diagram of the REACH technology that I proposed to
develop in this research. It is conceptually similar to that shown in Fig. 1.1, but with an
important difference. Instead of a separator, from which issues a secondary waste
stream, I have proposed to use catalytic treatment to destroy the contaminants of
concern.
The research proposed here is innovative because it combines contaminant
extraction and contaminant destruction in a closed-loop system, to avoid the generation
of a secondary waste stream. Most of the target contaminants are suspected or known to
be amenable to destruction via palladium-catalyzed hydrodehalogenation (Hoke et al.,
1992; Schuth and Reinhard, 1998; Lowry and Reinhard, 1999; Liu et al., 2001; Morales
et al., 2002).
1.2. Background on Pd-catalyzed hydrodehalogenation
In recent years, catalysts have received significant attention as a potential means of
treating contaminated groundwater and/or wastewater. In particular, catalysts can be
used to accelerate hydrodehalogenation (HDH) reactions, in which the halogen atoms
(usually chlorine or bromine) of a contaminant are replaced by hydrogen atoms,
resulting in a benign (or, at least, less toxic) product. This typically requires that
hydrogen gas, or an alternative reductant, is supplied to the solution in which the HDH
reactions occur. Many contaminants or groups of contaminants have been studied for
their potential for catalytic treatment, including the following:
Page 17
5
polluted
soil (sifted)
clean soil
extractor
solvent
(adjust pH
if needed)
catalytic
treatment
solvent
recycled
closed
solvent
loop
hydrogen supply
for catalytic treatment
Fig. 1.2 - Schematic diagram for the Remedial Extraction and Catalytic
Hydrodehalogenation (REACH) technology. The result is a closed-loop system with no
secondary waste stream.
Page 18
6
• chlorinated alkanes (Kovenklioglu et al., 1992; McNab and Ruiz, 1998; Lowry
and Reinhard, 1999; McNab et al., 2000; Kopinke et al., 2003);
• chlorinated ethenes (Kovenklioglu et al., 1992; Schreier and Reinhard, 1995;
McNab and Ruiz, 1998; Perrone et al., 1998; Lowry and Reinhard, 1999; Lowry
and Reinhard, 2000; McNab et al., 2000; Lowry and Reinhard, 2001; Korte et al.,
2002);
• chlorinated benzene (Coq et al., 1986; Kovenklioglu et al., 1992; Schuth et al.,
2000; Fritsch et al., 2002; Murena and Gioia, 2002);
• chlorinated phenols (Hoke et al., 1992; Felis et al., 1999; Yuan and Keane,
2003) ;
• 1,2-dibromo-3-chloropropane (Siantar et al., 1996; Lowry and Reinhard, 1999);
and
• polychlorinated biphenyls (PCBs) (Cellier et al., 2003; Ukisu and Miyadera,
2004; Yang et al., 2006).
The HDH reaction typically follows a stoichiometry along the lines of the following
(Urbano and Marinas, 2001):
R-Xn + nH2 R-Hn + nH+ + nX
- (1.1)
where X represents a halogen atom, e.g., chlorine or bromine. Note that the products of
the reaction include a dehalogenated hydrocarbon (R-H) and an acid (HX); the acid will
Page 19
7
typically be dissociated in aqueous solution, meaning that a halide ion (X-) is liberated
by the reaction.
Different catalysts are commercially available, but supported palladium (Pd)
catalyst was used in this research. Nearly all previous research has confirmed that Pd
catalysts exhibit high activity and selectivity for the HDH reaction. Pd catalyst is
commercially available as 1%, 2% or 5% Pd by weight, dispersed on a support of porous
alumina (Al2O3) or activated carbon.
The fundamental idea of this research is to combine solvent extraction, which
removes the target contaminants from contaminated soil, with palladium-catalyzed
HDH, which destroys the target contaminants. Through this procedure, I eliminate the
secondary waste stream of conventional solvent extraction.
1.3. Research objectives
The overall objective of this research is to develop and assess the remedial extraction
and catalytic hydrodehalogenation (REACH) technology for cleaning soils contaminated
by halogenated hydrophobic organic compounds (HHOCs). The central hypothesis is
that most HHOCs can be extracted from soils with a solvent and destroyed catalytically
in the closed-loop system of REACH. The motivation of this research is that the
development of a new remedial method for destroying soil contaminants with no
generation of a secondary waste stream will allow soils to be cleaned more effectively
and inexpensively.
Page 20
8
The overall objective was to be achieved through the following three specific
objectives. (1) Quantify the dependence on the key parameters for the extraction of
selected HHOCs from soils. (2) Quantify the dependence on the key parameters for the
Pd-catalyzed hydrodehalogenation of selected HHOCs. (3) Demonstrate that remedial
extraction and catalytic hydrodehalogenation is sustainable for a long period of time in a
closed-loop system.
1.4. Dissertation overview
This dissertation is presented in seven Chapters. Chapter I provides the introduction to
the dissertation. Chapters II, III, IV, V, and VI comprise the main body of the
dissertation and are described in more detail below. Chapter VII presents a summary of
the major findings of this research, including recommendations for future work.
Chapter II investigates the extraction of HHOCs from contaminated soils using
water-ethanol mixtures in batch mode. Specifically, the effects of solvent composition,
extraction time, and solvent volume on the extraction of selected HHOCs are described.
Chapter III presents data on the Pd-catalyzed HDH of 1,2,4,5-tetrachlorobenzene
(TeCB) in water-ethanol mixtures. The effects of solvent composition, catalyst
concentration, and initial concentration of TeCB are described. In addition, a
mathematical model was developed based on the Langmuir-Hishelwood model to
express the TeCB degradation kinetics by Pd-catalyzed HDH. I also propose a
transformation pathway of TeCB by the Pd-catalyzed hydrodehalogenation.
Page 21
9
Chapter IV investigates the Pd-catalyzed HDH of pentachlorophenol (PCP) in
water-ethanol mixtures. The effects of solvent composition, catalyst concentration, and
H2 pressure on the Pd-catalyzed HDH reaction rate of PCP were determined. The results
of adsorption isotherms are shown to explain the effect of solvent composition on the
HDH rate more clearly. A transformation pathway of PCP to phenol is proposed in this
Chapter. Also, I propose a hypothesis for why the degradation kinetics of PCP are
apparently not first order.
Chapter V provides the data on the performance of REACH for the treatment of
soils contaminated by TeCB and PCP. Soils contaminated in a laboratory were subjected
to clean-up by REACH. All experiments were conducted for seven weeks in a closed-
loop system built in the laboratory. The contaminant extraction rate, contaminant
reaction rate, contaminant mass destruction, regeneration of catalyst, and intermediate
products are described.
Chapter VI provides the data on the performance of REACH for the treatment of
field soils contaminated by PCP. Deactivation of the Pd catalyst is observed and
explained. A future area of research is proposed to overcome the problems associated
with the application of REACH to the field contaminated soils.
Page 22
10
CHAPTER II
EXTRACTION OF HALOGENATED HYDROPHOBIC ORGANIC
COMPOUNDS FROM CONTAMINATED SOILS USING WATER-ETHANOL
MIXTURES IN BATCH MODE
2.1. Introduction
The purpose of this Chapter is to investigate how well the target HHOCs can be
extracted from contaminated soil under different operating conditions when the
application of REACH is considered. The operating parameters studied here were
solvent composition, ratio of solvent volume to contaminated soil mass, and extraction
time. The results obtained here will be useful to construct a bench-scale closed-loop
treatment system of the REACH technology, as described in subsequent Chapters of this
dissertation.
Although many organic solvents are present for the extraction, water-ethanol
mixtures have been successfully applied to remove polycyclic aromatic hydrocarbons
(PAHs) (Kilbane, 1998; Khodadoust et al., 2000), pentachlorophenol (PCP)
(Khodadoust et al., 1999), and nonaqueous phase liquids (NAPLs) (Imhoff et al., 1995;
Rao et al., 1997; Lowe et al., 1999) from contaminated soils. In addition, ethanol is
inexpensive and is not environmentally harmful. Mravik et al. (2003) and Ramakrishnan
et al. (2005) reported that the ethanol remaining after extraction in soil matrices provided
Page 23
11
electron donor, eventually enhancing biological reductive degradation when extraction
with alcohol was used in situ.
2.2. Materials and methods
2.2.1. Chemicals
Ethanol (99.5%, ACS grade, Aldrich), acetone (≥99%, ReagentPlus grade, Aldrich),
hexane (98.5%, HPLC grade, EMD chemicals), toluene (99.9%, HPLC grade, Aldrich),
1,2,4,5-tetrachlorobenzene (98%, Sigma-Aldrich), pentachlorophenol (98%, Sigma-
Adrich), and 2,5,-dibromotoluene (98%, Sigma-Aldrich) were employed with no further
purification. Mixtures of water and ethanol were prepared using deionized water and
200 proof (99.5%) ethanol.
2.2.2. Soil
Uncontaminated soil was obtained below 10 cm from the top of a field site in College
Station, TX. The characteristics of the soil were analyzed by the Soil, Water, and Forage
Testing Laboratory at Texas A&M University. The textural class of the soil was a sandy
loam with 78% sand, 6% silt, and 16% clay. The fraction of organic matter and pH were
0.30% and 5.1, respectively. These parameters do not appear unusual, so the soil was
deemed acceptable for purposes of this study.
The uncontaminated soil was air-dried over night and sieved using a 2.0 mm
mesh before subject to contamination with TeCB and PCP. For use throughout the rest
Page 24
12
of this research, half of the soil was contaminated with TeCB, and half was
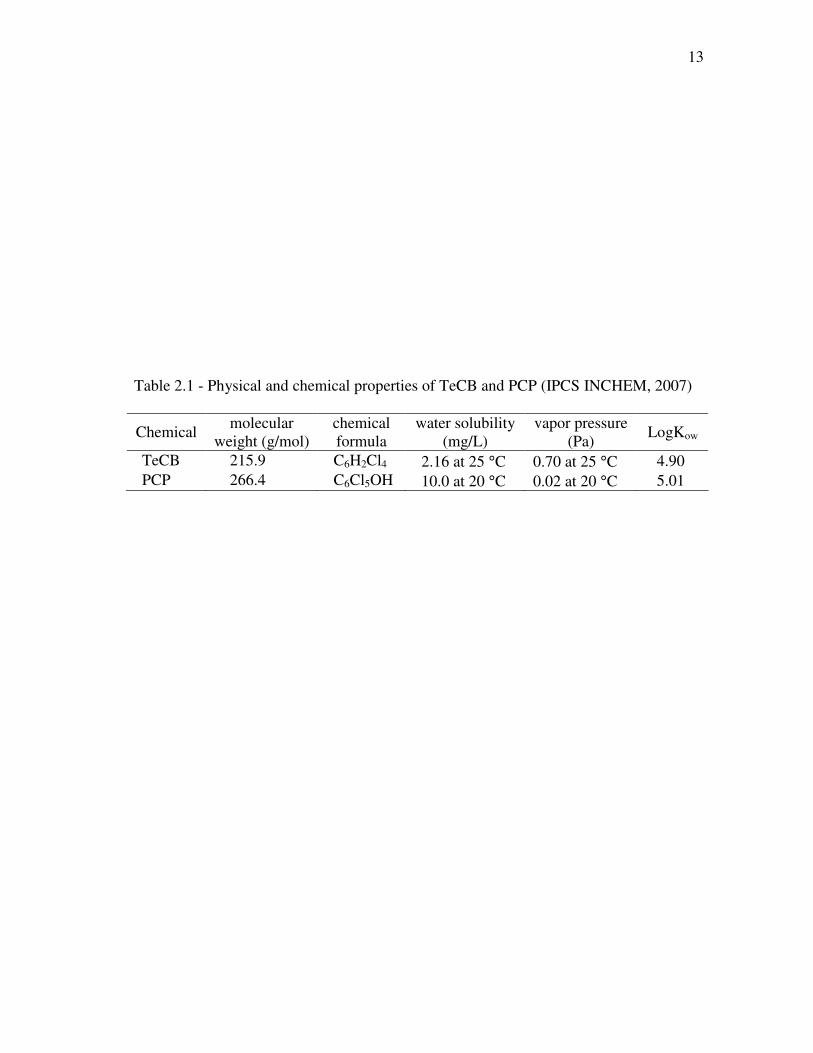
contaminated with PCP. TeCB and PCP were selected as the two target contaminants
for this research. They are common soil contaminants with physical and chemical
properties that are representative of HHOCs, as shown in Table 2.1. The target
concentrations for the contaminated soil were 100 mg TeCB per kg air-dried soil and
100 mg PCP per kg air-dried soil. These concentrations would not be unusual at a
contaminated-soil site.
Soil contamination was performed as follows. First, a stock solution of TeCB
was made by dissolving 0.05 g of TeCB into 100 mL of acetone. Then, 500 g of dried
soil was placed in a 500-mL amber-glass bottle. The 100 mL of stock solution was
added, and the bottle was sealed. The bottle was placed in a tumbler and was mixed for
two weeks. Then, the bottle was taken from the tumbler and mixed with hand utensils
for 10 minutes. The contaminated soil was then placed on a clean plate and dried in the
hood for 24 hours, to allow acetone to volatilize. The contaminated soil was then mixed
thoroughly and placed in a clean amber-glass bottle. The entire procedure was repeated
for PCP. Based on the addition of 0.05 g of contaminant to 500 g of soil, I anticipated a
contaminant concentration of approximately 100 mg/kg if no loss of contaminant
occurred.
Following contamination, the soil was aged (stored) in the amber-glass bottles at
room temperature for at least 3 months prior to use in further experiments.
Page 25
13
Table 2.1 - Physical and chemical properties of TeCB and PCP (IPCS INCHEM, 2007)
Chemical molecular
weight (g/mol)
chemical
formula
water solubility
(mg/L)
vapor pressure
(Pa) LogKow
TeCB 215.9 C6H2Cl4 2.16 at 25 °C 0.70 at 25 °C 4.90
PCP 266.4 C6Cl5OH 10.0 at 20 °C 0.02 at 20 °C 5.01
Page 26
14
2.2.3. Determination of concentrations in contaminated soil
In order to determine how the contaminant extraction was affected by solvent
composition or by other operating parameters, I first had to know the concentration of
TeCB or PCP in the contaminated soil. The target concentration during the
contamination step was 100 mg/kg, as described above. However, it is possible that
some losses occurred during the contamination, particularly while the soil was dried in
the hood, so the actual contaminant concentration in the soil might be less than the target
of 100 mg/kg.
Accelerated solvent extraction (ASE) was used for the determination of the
contaminant concentration in soil. I used EPA method 3545, pressurized fluid extraction
(US EPA, 1996b), employing a Dionex ASE 200 accelerated solvent extraction system.
Experimental conditions are given in Table 2.2.
Three samples of the TeCB-contaminated soil were analyzed, as were three
samples of the PCP-contaminated soil. The TeCB concentration was determined to be
63±1 mg/kg. The PCP concentration was determined to be 73±10 mg/kg. These values
were in reasonable agreement with the target concentration of 100 mg/kg.
The ASE results were validated with a “shaker” method (Wall and Stratton,
1991), which was performed as follows. I placed 10 g of TeCB in a 50-mL centrifuge
tube. Then, 10 mL of solvent was added to the tube. The solvent was a mixture of
hexane and acetone (hexane:acetone ratio was 4:1, vol:vol, before mixing) for TeCB-
contaminated soil or a mixture of toluene and acetone (toluene:acetone ratio was 4:1,
Page 27
15
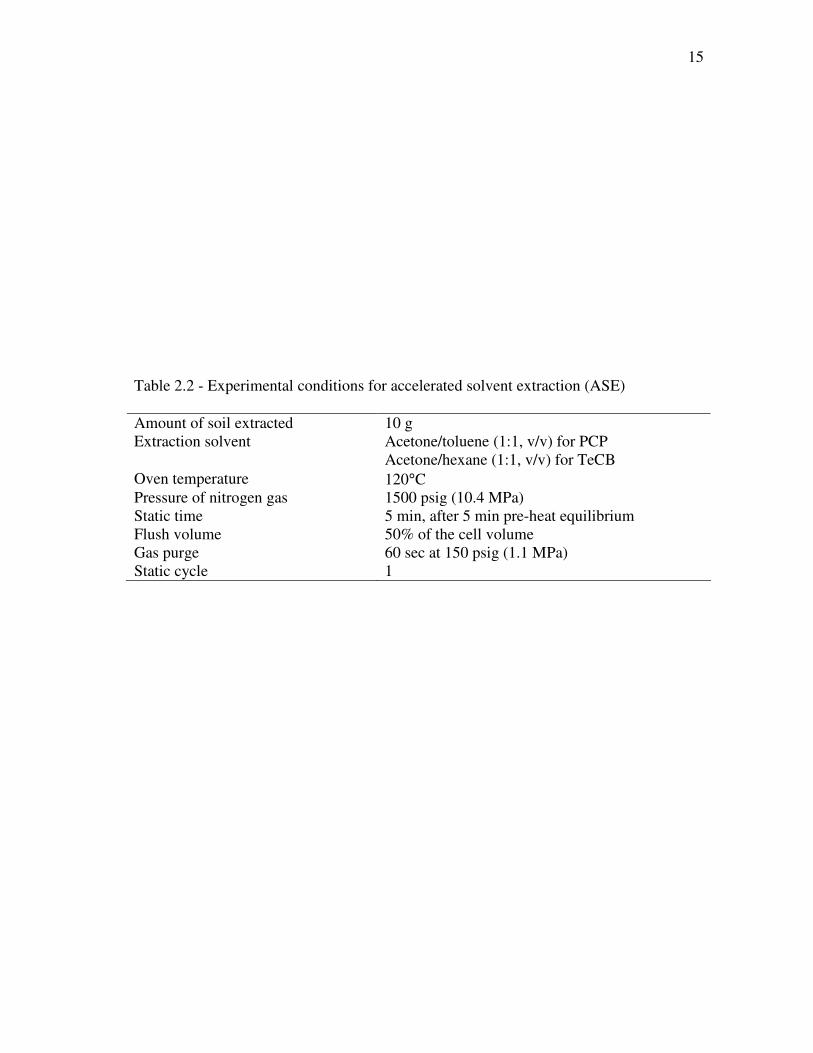
Table 2.2 - Experimental conditions for accelerated solvent extraction (ASE)
Amount of soil extracted 10 g
Extraction solvent Acetone/toluene (1:1, v/v) for PCP
Acetone/hexane (1:1, v/v) for TeCB
Oven temperature 120°C
Pressure of nitrogen gas 1500 psig (10.4 MPa)
Static time 5 min, after 5 min pre-heat equilibrium
Flush volume 50% of the cell volume
Gas purge 60 sec at 150 psig (1.1 MPa)
Static cycle 1
Page 28
16
before mixing) for PCP-contaminated soil. The tube was shaken for 1 hr on a mechanical
shaker at 200 rpm. Then the tube was centrifuged for 10 min at 10,000×g. The
supernatant was poured into a 50-mL volumetric flask. The entire procedure was
repeated twice more with the supernatants collected together. The concentration in the
solvent was then determined and used to calculate the initial concentration of
contaminant in the soil. Three samples of the TeCB-contaminated soil were analyzed
with this method, as were three samples of the PCP-contaminated soil. The TeCB
concentration was determined to be 64±3 mg/kg, in excellent agreement with the ASE
results. The PCP concentration was determined to be 81±7 mg/kg, somewhat higher than
predicted by the ASE method. Overall, the two methods agreed well. I conclude that the
TeCB concentration in the TeCB-contaminated soil was approximately 64 mg/kg, and
the PCP concentration in the PCP-contaminated soil was approximately 80 mg/kg.
Once the concentrations of TeCB and PCP had been determined, I was able to
test the efficacy of the water-ethanol mixtures for extraction. I determined the effect of
three parameters: solvent composition, volume of solvent used per mass of soil, and
extraction time.
2.2.4. Extraction in batch mode
All extraction experiments were conducted in batch mode. Four water-ethanol mixtures,
with water:ethanol composition of 100:0, 67:33, 50:50, and 33:67 (vol:vol, before
mixing) were used for the extraction of both TeCB- and PCP-contaminated soils. The
extraction experiments of TeCB and PCP from the contaminated soils were carried out
Page 29
17
separately. A desired amount of soil and volume of extractant (water-ethanol mixture)
were placed in an amber glass bottle. The glass bottle was shaken on a mechanical
shaker at 20 rpm for a desired time interval. At the end of the time interval, an aliquot of
solvent was collected. Any soil particles were separated from the solvent using a 0.2-µm
membrane filter. The concentration of TeCB or PCP in the solvent was determined by
analysis on a gas chromatograph (GC) with electron capture detector (ECD) as described
below. Finally, the solution concentration was converted to an equivalent soil
concentration that was extracted, i.e., mass of contaminant extracted per mass of soil. All
experiments were performed in duplicate.
2.2.5. Analysis
For TeCB analysis, one milliliter of hexane was mixed with an appropriate volume of
the filtered water/ethanol solvent in an amber glass vial to be ready for GC analysis. For
PCP sample analysis, toluene was used instead of hexane. PCP samples were acidified
down to pH 2 with 6 N HCl. Both hexane and toluene contained a known concentration
of 2,5-dibromotoluene as an internal standard prior to the liquid-liquid extraction for a
GC analysis. Target analytes were extracted into hexane or toluene by shaking the amber
glass vials for at least 1 hour. The instrument used for analysis was a Perkin Elmer
Clarus 500 GC equipped with ECD. The column used was a DB-5ms capillary column
(30 m length × 0.25 mm i.d.) (J&W).
Page 30
18
2.3. Results and discussion
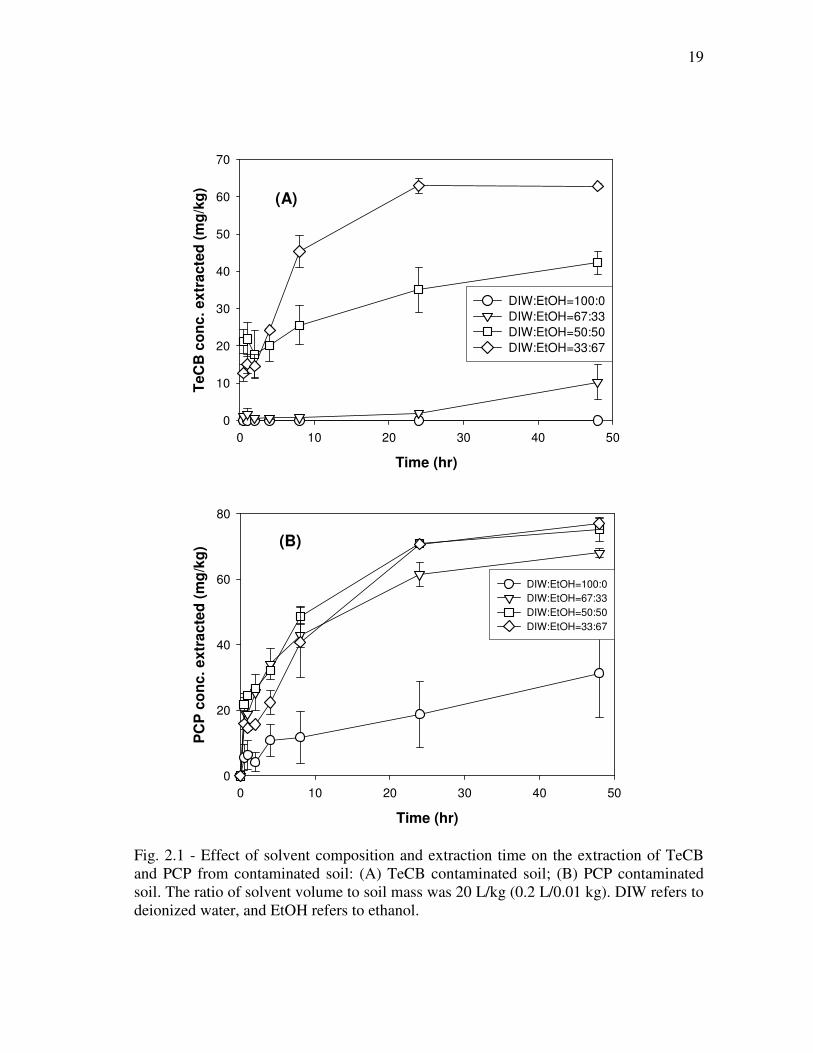
2.3.1. Effect of solvent composition
In order to investigate the effect of solvent composition, I placed 10 g of contaminated
soil in a 250-mL amber-glass bottle with 200 mL of solvent. The water:ethanol
compositions I tested were 100:0, 67;33, 50:50, and 33:67 (vol:vol, before mixing).
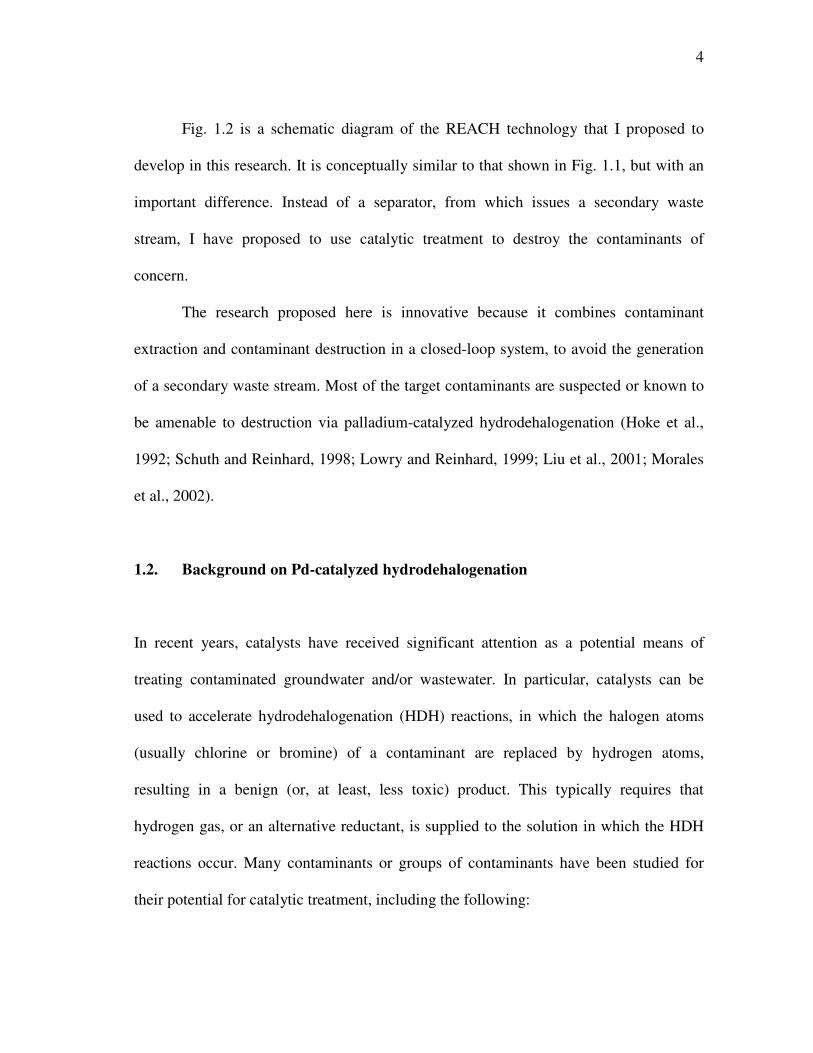
Fig. 2.1 (A) and (B) show the results for TeCB and PCP, respectively. I found
that TeCB could not be effectively extracted by 100% water or by a 67% water solution,
even with a contact time of 48 hours. In contrast to TeCB, the PCP could be effectively
extracted by a mixture with as little as 33% ethanol. This could be explained by a
hydroxyl (-OH) group of PCP. Hydrogen bonding can occur between a solvent
(water/ethanol mixture) and PCP (Bettelheim et al., 2001). Consequently, the solubility
of PCP in polar solvents can be enhanced.
In general, for the extraction of HHOCs, I would expect the extraction efficiency
to increase as the ethanol fraction increases in the solvent. This expected trend was
strong for TeCB but only moderate for PCP, probably because PCP is more polar than
TeCB and contains the hydroxyl moiety for hydrogen bonding.
2.3.2. Effect of extraction time
Fig. 2.1 (A) and (B) indicate the effect of extraction time as well as the effect of solvent
composition. As expected, the contaminant mass extracted in solvent increases with
Page 31
19
Time (hr)
0 10 20 30 40 50
TeC
B c
on
c. ex
tra
cte
d (
mg
/kg
)
0
10
20
30
40
50
60
70
DIW:EtOH=100:0
DIW:EtOH=67:33
DIW:EtOH=50:50
DIW:EtOH=33:67
Time (hr)
0 10 20 30 40 50
PC
P c
on
c. e
xtr
ac
ted
(m
g/k
g)
0
20
40
60
80
DIW:EtOH=100:0
DIW:EtOH=67:33
DIW:EtOH=50:50
DIW:EtOH=33:67
Fig. 2.1 - Effect of solvent composition and extraction time on the extraction of TeCB
and PCP from contaminated soil: (A) TeCB contaminated soil; (B) PCP contaminated
soil. The ratio of solvent volume to soil mass was 20 L/kg (0.2 L/0.01 kg). DIW refers to
deionized water, and EtOH refers to ethanol.
(A)
(B)
Page 32
20
time. Also as expected, for short extraction times, the mass extracted is very sensitive to
extraction time. For instance, a contact time of 8 hr provides a significant improvement
over a contact time of 1 hr. However, for long extraction times, the system approaches
equilibrium, and therefore is not as sensitive to extraction time. Therefore, a contact time
of 48 hr provides only slight improvement over a contact time of 24 hr.
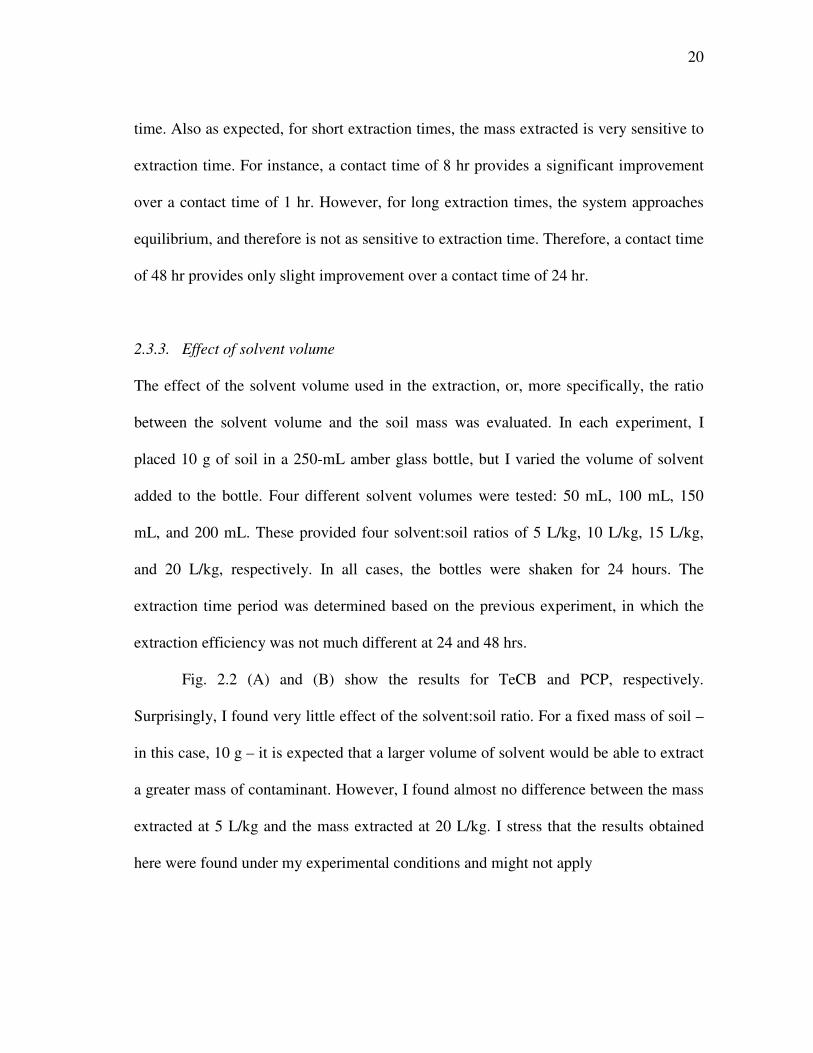
2.3.3. Effect of solvent volume
The effect of the solvent volume used in the extraction, or, more specifically, the ratio
between the solvent volume and the soil mass was evaluated. In each experiment, I
placed 10 g of soil in a 250-mL amber glass bottle, but I varied the volume of solvent
added to the bottle. Four different solvent volumes were tested: 50 mL, 100 mL, 150
mL, and 200 mL. These provided four solvent:soil ratios of 5 L/kg, 10 L/kg, 15 L/kg,
and 20 L/kg, respectively. In all cases, the bottles were shaken for 24 hours. The
extraction time period was determined based on the previous experiment, in which the
extraction efficiency was not much different at 24 and 48 hrs.
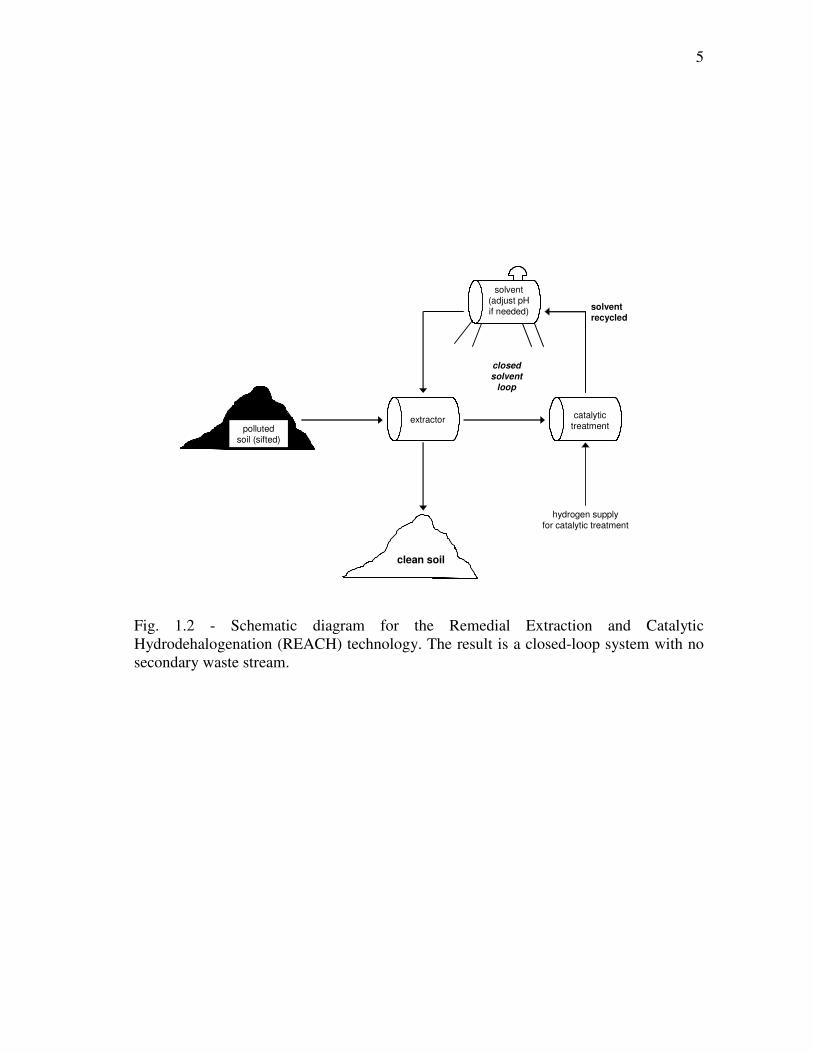
Fig. 2.2 (A) and (B) show the results for TeCB and PCP, respectively.
Surprisingly, I found very little effect of the solvent:soil ratio. For a fixed mass of soil –
in this case, 10 g – it is expected that a larger volume of solvent would be able to extract
a greater mass of contaminant. However, I found almost no difference between the mass
extracted at 5 L/kg and the mass extracted at 20 L/kg. I stress that the results obtained
here were found under my experimental conditions and might not apply
Page 33
21
Ratio of solvent to soil (L:kg)
5 10 15 20
Te
CB
co
nc
. e
xtr
ac
ted
(m
g/k
g)
0
20
40
60
80DIW:EtOH=33:67
DIW:EtOH=50:50
DIW:EtOH=67:33
Ratio of solvent to soil (L:kg)
5 10 15 20
PC
P c
on
c. e
xtr
ac
ted
(m
g/k
g)
0
20
40
60
80
100DIW:EtOH=33:67
DIW:EtOH=50:50
DIW:EtOH=67:33
DIW:EtOH=100:0
Fig. 2.2 - Effect of solvent volume on the extraction of TeCB and PCP from
contaminated soil: (A) TeCB contaminated soil; (B) PCP contaminated soil. Extraction
time was 24 hrs for all samples. In the legend, DIW refers to deionized water and EtOH
refers to ethanol.
(A)
(B)
Page 34
22
generally. If a higher mass of contaminant were present, the results might be different
since each solvent has a certain limitation of solubility for a compound.
As before, I did see an effect of the solvent composition on the extraction
efficiency. In fact, the trends were very similar to those described in section 2.3.1.,
above. For TeCB, the extraction efficiency is low at 67% water but improves with
increasing ethanol concentration in the solvent. For PCP, the extraction efficiency is
poor for 100% water, but is nearly the same for any ethanol concentration equal to 33%
or higher. Thus, Fig. 2.2 (A) and (B) corroborate the trends shown in Fig. 2.1 (A) and
(B).
2.4. Conclusions
Extraction of TeCB and PCP from contaminated soil was tested using water-ethanol
mixtures in batch mode. It was observed that mixtures of water and ethanol are good
candidates to remove TeCB and PCP from contaminated soil by extraction. A
composition of at least 50% ethanol (by volume, before mixing) appears necessary to
effectively remove TeCB from contaminated soil. PCP could be effectively extracted by
mixtures with as little as 33% ethanol. It was observed that the ratio of solvent volume to
soil mass has very little effect on the extraction efficiency of both TeCB and PCP under
our experimental conditions. For short extraction times, the mass of TeCB or PCP
extracted is very sensitive to extraction time. However, for long extraction times, the
Page 35
23
removal efficiency is not sensitive to extraction time, suggesting an approach to
equilibrium.
Page 36
24
CHAPTER III
PALLADIUM-CATALYZED HYDRODEHALOGENATION OF 1,2,4,5-
TETRACHLOROBENZENE IN WATER-ETHANOL MIXTURES
3.1. Introduction
The long-term goal of this research is to develop the REACH process for full-scale
application at contaminated sites. One critical step is to develop a sufficient
understanding of the HDH reaction in water/ethanol mixtures. Therefore, the main goals
of this Chapter are to demonstrate the feasibility of the technology, to determine the
effect of the solvent composition (i.e., the water:ethanol ratio), and to develop a model
for the kinetics of the dehalogenation process. These goals have been accomplished
through a series of batch kinetic experiments, in which TeCB was spiked into mixtures
of water and ethanol, then destroyed via Pd-catalyzed hydrodehalogention (HDH) in a
batch reactor. Results of the experiments are interpreted with a Langmuir-Hinshelwood
conceptual model for heterogeneous catalysis.
Page 37
25
3.2. Materials and methods
3.2.1. Chemicals and catalyst
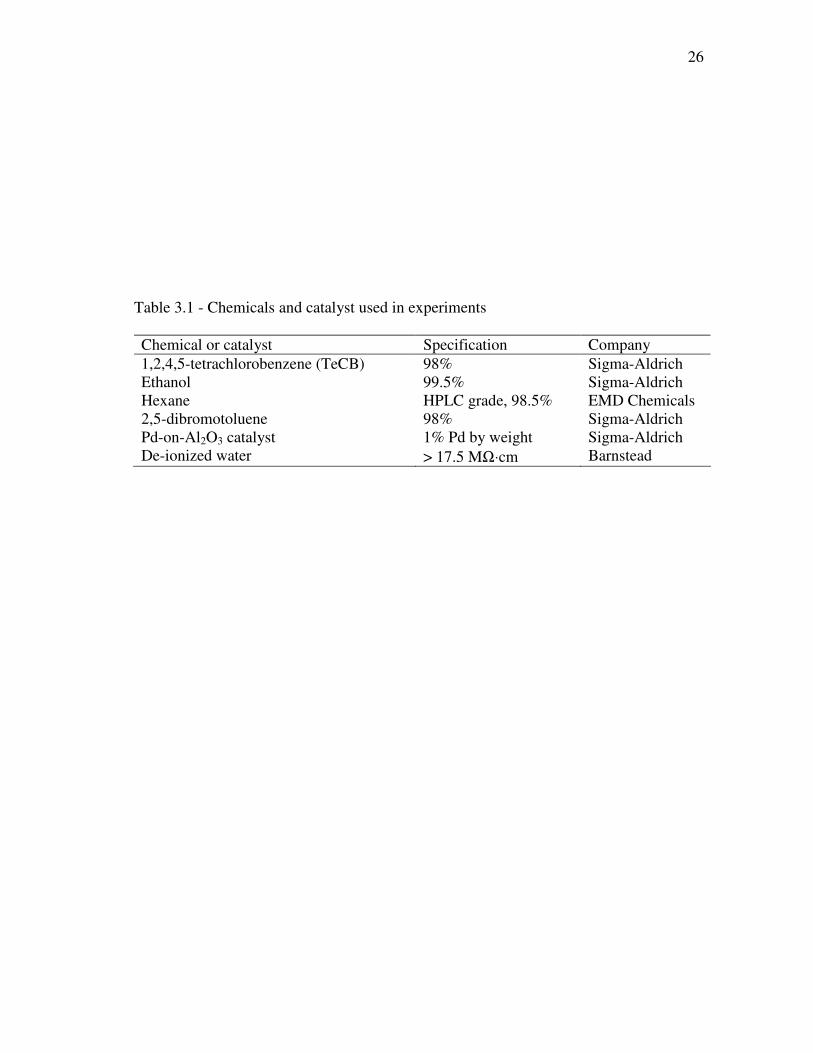
The chemicals employed in this research are summarized in Table 3.1. Mixtures of
water and ethanol were prepared using de-ionized water and 200 proof (99.5%) ethanol.
Commerically-available 1% (wt.) Pd-on-Al2O3 catalyst was employed, and the
palladium content of the catalyst specified by the manufacturer is assumed to be
accurate. Detailed physical properties of the catalyst can be found elsewhere (Lowry
and Reinhard, 1999). The catalyst was used in the HDH reactions without further
treatment. No special effort was given to prevent the catalyst from contacting air. A
stock solution of 1,2,4,5-tetrachlorobenzene with concentration 5000 mg/L was prepared
by dissolving 0.1 g of TeCB into 20 mL ethanol in a 20-mL clear borosilicate glass vial.
The vial containing the stock solution was closed using a PTFE-lined septum and kept in
a freezer to minimize volatilization.
3.2.2. Pd-catalyzed HDH reaction studies
In this research, all Pd-catalyzed hydrodehalogenation (HDH) reactions were carried out
in a Parr 3911 hydrogenation apparatus (Parr Instrument Company, Moline, IL, USA).
The experiments were conducted as follows.
Page 38
26
Table 3.1 - Chemicals and catalyst used in experiments
Chemical or catalyst Specification Company
1,2,4,5-tetrachlorobenzene (TeCB) 98% Sigma-Aldrich
Ethanol 99.5% Sigma-Aldrich
Hexane HPLC grade, 98.5% EMD Chemicals
2,5-dibromotoluene 98% Sigma-Aldrich
Pd-on-Al2O3 catalyst 1% Pd by weight Sigma-Aldrich
De-ionized water > 17.5 MΩ⋅cm Barnstead
Page 39
27
A desired mixture of deionized water (DIW) and ethanol (EtOH) was pre-mixed
in a glass beaker and then transferred to a 500-mL reaction bottle. The total volume of
solvent (DIW/EtOH mixture) in the reaction bottle was 300 mL for all experiments; for
instance, a 50/50 mixture consisted of 150 mL water and 150 mL ethanol mixed and
then added to the reaction bottle. After adding the solvent, the desired amount of
catalyst and the desired amount of TeCB stock solution were also added to the reaction
bottle. The bottle was then placed in the hydrogenation reactor, and air in the headspace
was removed by filling the bottle with hydrogen gas up to 0.31 MPa and venting it.
Pressurizing and venting were repeated three times. After venting, the reactor headspace
was filled with hydrogen gas to 0.21 MPa, and shaking of the reaction bottle was started.
The hydrogenation reactor is designed to shake at 200 rpm to ensure complete mixing.
After shaking for the desired amount of time, the reactor was stopped, and a sample was
collected for analysis.
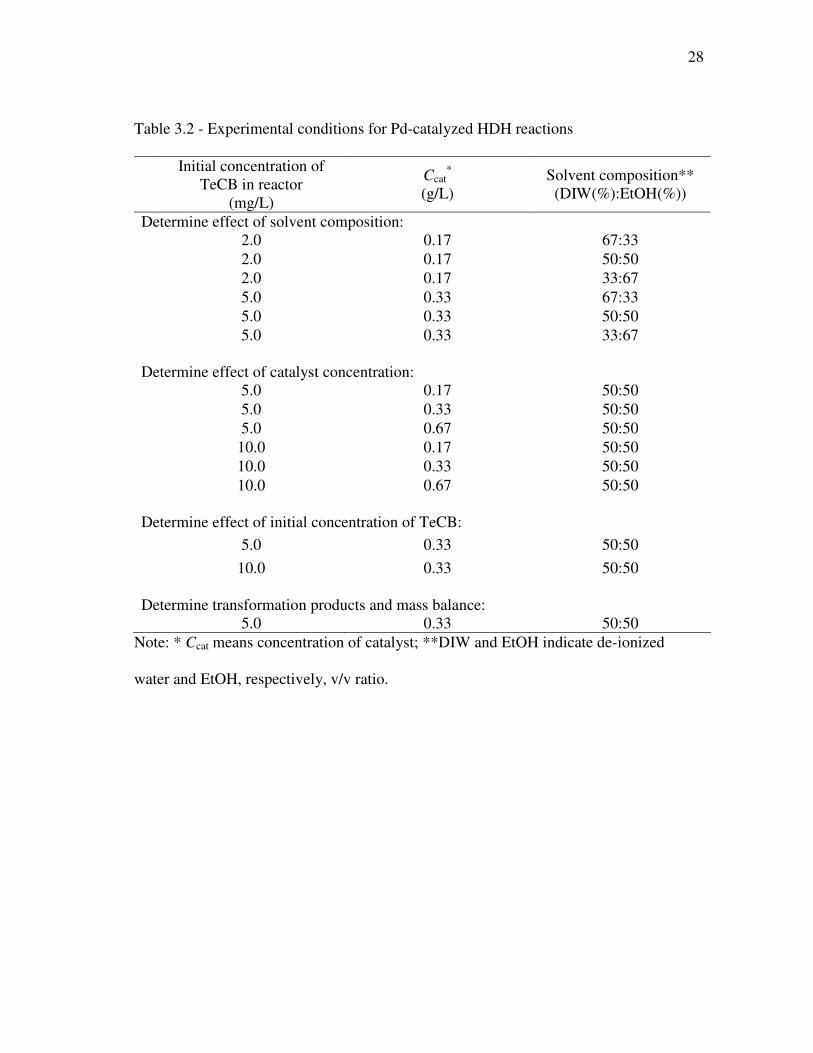
Four sets of experiments were conducted. Each set of experiments required that
different experimental conditions be tested, as summarized in Table 3.2. For each set of
conditions, the experimental process was repeated 6 or 7 times to yield kinetic data for 6
or 7 different reaction times.
During the HDH reactions, hydrogen gas was supplied at 0.21 MPa and the
reactions were conducted at room temperature (20±3 °C). Each experiment was
conducted in duplicate.
Page 40
28
Table 3.2 - Experimental conditions for Pd-catalyzed HDH reactions
Initial concentration of
TeCB in reactor
(mg/L)
Ccat*
(g/L)
Solvent composition**
(DIW(%):EtOH(%))
Determine effect of solvent composition:
2.0 0.17 67:33
2.0 0.17 50:50
2.0 0.17 33:67
5.0 0.33 67:33
5.0 0.33 50:50
5.0 0.33 33:67
Determine effect of catalyst concentration:
5.0 0.17 50:50
5.0 0.33 50:50
5.0 0.67 50:50
10.0 0.17 50:50
10.0 0.33 50:50
10.0 0.67 50:50
Determine effect of initial concentration of TeCB:
5.0 0.33 50:50
10.0 0.33 50:50
Determine transformation products and mass balance:
5.0 0.33 50:50
Note: * Ccat means concentration of catalyst; **DIW and EtOH indicate de-ionized
water and EtOH, respectively, v/v ratio.
Page 41
29
3.2.3. Sampling and analysis
At the end of each HDH run, the shaker was stopped and an appropriate amount of
sample was collected using a syringe. Any fine catalyst was separated from the sample
using a 0.2-µm membrane filter. An appropriate amount of the filtered sample was
placed in an extraction vial with hexane, and the vial was vigorously shaken for 1 hour
to transfer TeCB (and any reaction products) to the hexane. Duplicate samples were
collected from the reactor and extracted into hexane. The hexane contained a known
concentration of 2,5-dibromotoluene as an internal standard. TeCB concentrations in the
hexane were determined using gas chromatography (GC) with electron capture detection
(ECD). Prior to analysis, the GC was calibrated using standard solutions of TeCB in
hexane, prepared by dilutions of the TeCB stock solution. Blank samples were analyzed
between each standard to verify that TeCB was eluting properly from the GC and not
bleeding from one analysis to the next.
For a set of mass balance studies (described in more detail subsequently), the
samples were analyzed by Advanced Technologies & Testing Laboratories (Gainesville,
Florida) through the EPA purge-and-trap method 8260 (US EPA, 1996b).
3.2.4. Control experiments
For each set of experimental conditions, two kinds of control tests were conducted to
verify that any observed disappearance of TeCB was due to catalytic HDH, not any other
mechanism (e.g., volatilization or sorption). The first type of control experiments were
conducted in exactly the same fashion as described above, with the exception that no
Page 42
30
catalyst was added to the reaction bottles. This determines the loss of TeCB due to
volatilization. The second type of control experiments was performed using nitrogen gas
instead of hydrogen gas, with all other experimental conditions the same as described
above. This determines the loss of TeCB due to sorption onto the catalyst surface.
For a solvent composition of 67% water, significant volatilization of TeCB was
observed: I recovered only 43–47% of the TeCB after venting and 30 minutes of shaking
(without catalyst present). For other solvent compositions, no significant loss was
observed due to volatilization, with TeCB recoveries from 92 to 103%.
In the sorption control experiments, recoveries of TeCB were 32–64% when a
solvent composition of 67% water was used. This is consistent with the results of the
volatilization controls, and it is believed that the main mechanism of TeCB loss was due
to volatilization, not sorption. In solvent compositions of 50:50 and 33:67 of
DIW/EtOH, recoveries of TeCB for sorption controls were in the range 86-89% and
103-107%, respectively. This indicates that sorption onto the catalyst support is only a
minor loss mechanism. Therefore, with the exception of TeCB in 67% water, I trust that
any observed removal of TeCB is due to catalytic HDH.
3.3. Theoretical and mathematical model
To interpret the results of the Pd-catalyzed HDH experiments, I adopt a Langmuir-
Hinshelwood model for the catalytic reaction. According to this framework, the HDH of
TeCB occurs via the following steps (Fogler, 1999): (1) mass transfer of the reactants
Page 43
31
(i.e., TeCB and hydrogen) from the water/ethanol solvent to the catalyst surface;
(2) adsorption of the reactants to the catalyst surface; (3) reaction on the surface of the
catalyst; (4) desorption of the reaction products from the surface; and (5) mass transfer
of the reaction products back into the bulk water/ethanol solvent. This framework
enables me to develop a mathematical model to interpret the experimental data, as
follows.
First, I assume that the HDH reaction on the catalyst surface follows a simple
kinetic expression:
r = k2 CTeCB
cat CH2
cat (3.1)
where r is the rate of disappearance of the TeCB (mass of TeCB reacted per mass of
catalyst per time). CTeCB
cat and cat
H2C represent the concentration of TeCB sorbed on the
catalyst surface and the concentration of H2 sorbed on the catalyst surface, respectively.
Next, I assume that sorption and desorption of the TeCB and the hydrogen onto
the catalyst surface are rapid processes since the reaction bottle is shaken vigorously. In
other words, the rate-limiting step for the HDH reaction is surface reaction (step 3 in the
list above), not mass transfer or sorption/desorption. Thus, the sorbed concentrations are
in equilibrium with the dissolved concentration in the solvent. I further assume that
these equilibrium sorption relationships are described by Langmuir isotherms. The
hydrogen concentration is in the high region of the Langmuir isotherm, such that cat
H2C is
a constant. (I have verified with experiments that the HDH reaction is not sensitive to
Page 44
32
the H2 pressure in the reaction vessel as long as the pressure is at least 0.17 MPa; this
finding supports the assumption that cat
H2C is constant.) Therefore, I may define
cat
H221 Ckk = (3.2)
where k1 is an apparent first-order rate constant for the reaction on the catalyst surface.
However, I assume that the TeCB concentration in the water/ethanol solvent is in
the low (linear) region of the Langmuir isotherm:
CTeCB
cat ≅ Kd CTeCB
solvent (3.3)
where Kd is a partitioning coefficient describing the sorption equilibrium. Thus,
equation (3.1) can be expressed as follows.
r = k1 Kd CTeCB
solvent (3.4)
Next, I apply a mass balance for TeCB in the entire reaction vessel:
M cat dCTeCB
cat
dt + V solvent
dCTeCB
solvent
dt = − M cat r (3.5)
Page 45
33
where Mcat
and Vsolvent
are the mass of catalyst and the volume of solvent, respectively.
Combining equations (3.3), (3.4), and (3.5) yields the following.
V solvent + M catKd( ) dCTeCB
solvent
dt = − M cat k1 Kd CTeCB
solvent (3.6)
Finally, for my experimental conditions, the mass of catalyst is small compared
to the volume of solvent: Vsolvent
» Mcat
Kd. This enables me to arrive at the final result as
follows.
solvent
TeCB
solvent
TeCB1
solvent
TeCB CkCV
MKk
dt
dCsolvent
cat
d −=−≅ (3.7)
Equation 3.7 shows that the rate of disappearance of TeCB in the water/ethanol solvent
should exhibit first-order kinetics if the assumptions made above are valid. The apparent
first-order rate constant k is given by
k = k1 Kd M
cat
V solvent. (3.8)
According to this conceptual and mathematical model, the apparent first-order
rate constant k should depend upon the concentration of catalyst in the reactor
(Mcat
/Vsolvent
) and upon the partitoning coefficient Kd that describes the sorption of the
Page 46
34
contaminant onto the catalyst surface. The partitioning coefficient Kd is expected to
depend upon the solvent composition: higher ethanol concentrations are expected to
favor the TeCB remaining in liquid solution, as opposed to sorbing onto the catalyst
surface. Therefore, the apparent rate constant k is expected to depend upon the solvent
composition.
As shown in Table 3.2, I designed different sets of experiments to test the
validity of this conceptual model. Results are reported below.
3.4. Results and discussion
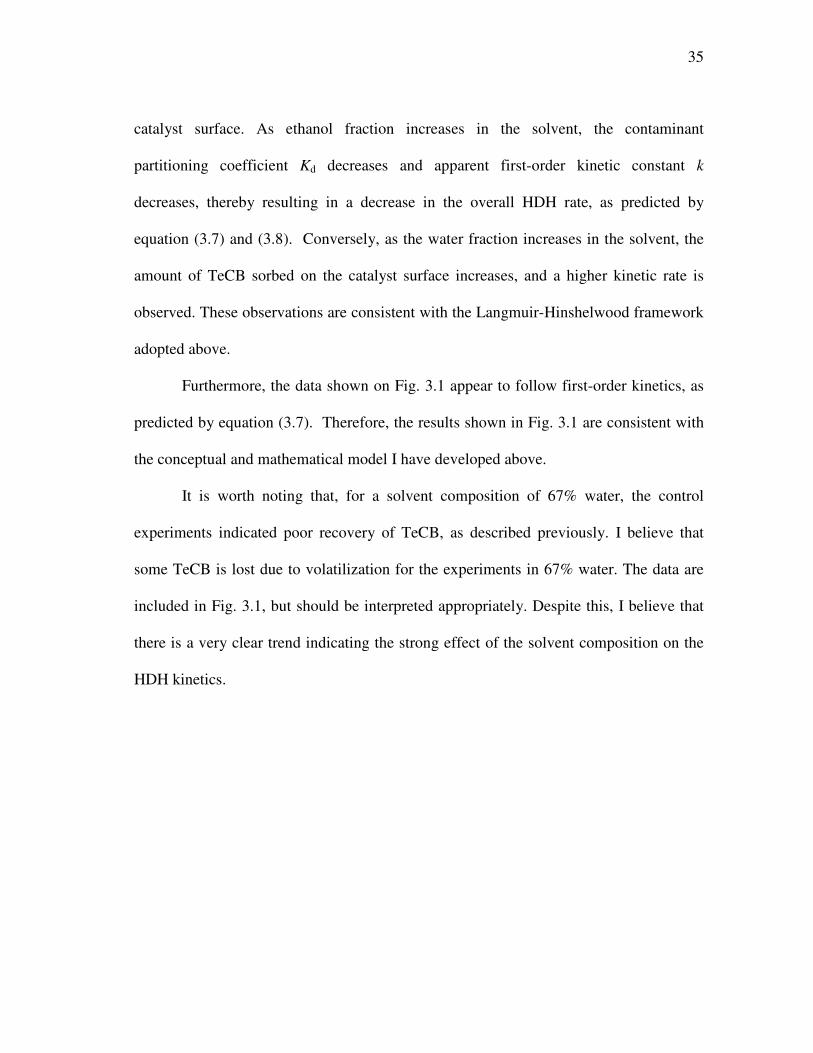
3.4.1. Effect of solvent composition on the Pd-catalyzed HDH rate
The effect of solvent composition on the Pd-catalyzed hydrodehalogenation (HDH)
kinetic rate of 1,2,4,5-tetrachlorobenzene (TeCB) over time in a batch reactor is
presented in Fig. 3.1. The results show clearly that the Pd-catalyzed HDH rate increases
as the fraction of water increases in the solvent. This was observed for both sets of
experimental conditions (2 mg/L initial concentration of TeCB with 0.17 g/L catalyst,
and 5 mg/L initial concentration of TeCB with 0.33 g/L catalyst). The apparent first-
order rate constants k for each solvent composition are shown in Fig. 3.1 and are
summarized in Table 3.3. Similar effects of solvent composition have been reported for
the dehalogenation rate of polychlorinated biphenyls treated by bimetallic Pd/Fe (Korte
et al., 2002), and for perchloroethylene treated by zero-valent iron (Clark et al., 2003). I
attribute this to the effect of the solvent composition on the sorption of TeCB to the
Page 47
35
catalyst surface. As ethanol fraction increases in the solvent, the contaminant
partitioning coefficient Kd decreases and apparent first-order kinetic constant k
decreases, thereby resulting in a decrease in the overall HDH rate, as predicted by
equation (3.7) and (3.8). Conversely, as the water fraction increases in the solvent, the
amount of TeCB sorbed on the catalyst surface increases, and a higher kinetic rate is
observed. These observations are consistent with the Langmuir-Hinshelwood framework
adopted above.
Furthermore, the data shown on Fig. 3.1 appear to follow first-order kinetics, as
predicted by equation (3.7). Therefore, the results shown in Fig. 3.1 are consistent with
the conceptual and mathematical model I have developed above.
It is worth noting that, for a solvent composition of 67% water, the control
experiments indicated poor recovery of TeCB, as described previously. I believe that
some TeCB is lost due to volatilization for the experiments in 67% water. The data are
included in Fig. 3.1, but should be interpreted appropriately. Despite this, I believe that
there is a very clear trend indicating the strong effect of the solvent composition on the
HDH kinetics.
Page 48
36
Time (min)
0 10 20 30 40 50 60
TeC
B c
on
c.
(mg
/L)
0.0
0.5
1.0
1.5
2.0DIW:EtOH=67:33
DIW:EtOH=50:50
DIW:EtOH=33:67
k=0.24 min-1
k=0.081 min-1
k=0.040 min-1
Time (min)
0 10 20 30 40 50 60
TeC
B c
on
c.
(mg
/L)
0.0
1.0
2.0
3.0
4.0
5.0DIW:EtOH=67:33
DIW:EtOH=50:50
DIW:EtOH=33:67
k=0.40 min-1
k=0.098 min-1
k=0.051 min-1
Fig. 3.1 - Effect of solvent composition on the Pd-catalyzed HDH rate of TeCB in a
batch reactor: (A) catalyst conc. = 0.17 g/L and initial TeCB conc. = 2 mg/L; (B)
catalyst conc. = 0.33 g/L and initial TeCB conc. = 5 mg/L. DIW and EtOH mean de-
ionized water and ethanol, respectively. Symbols represent experimental data and lines
represent first-order kinetic degradation model.
(A)
(B)
Page 50
38
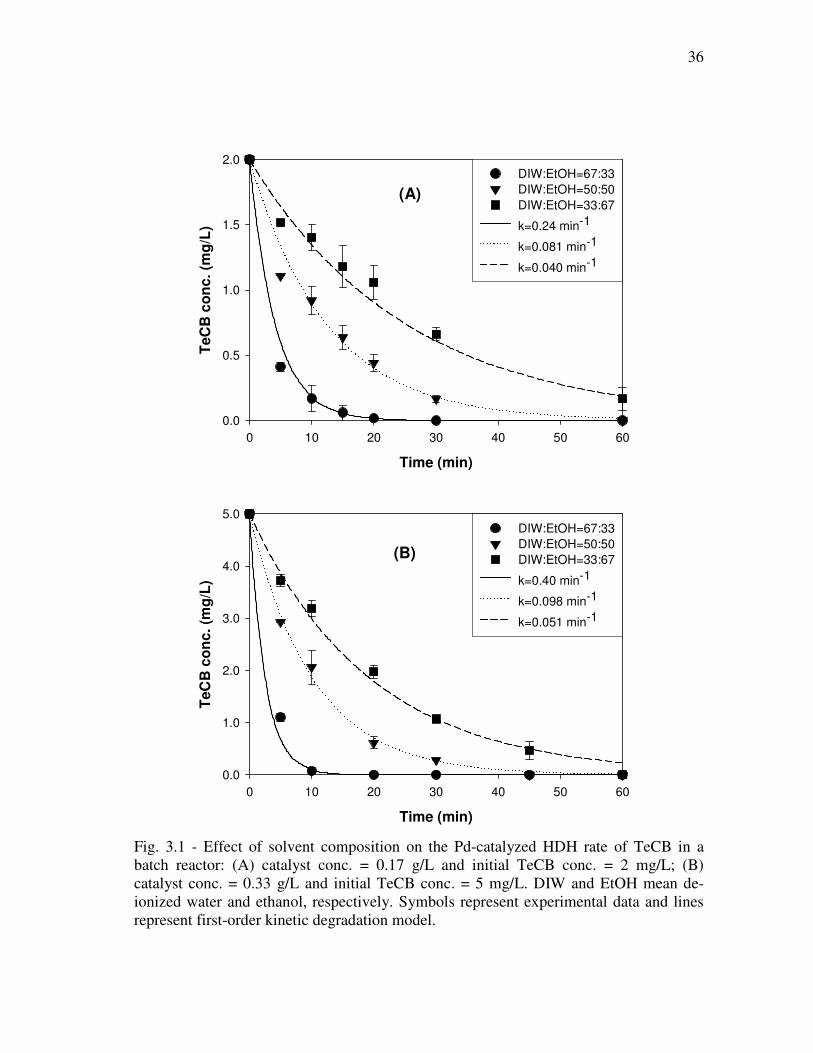
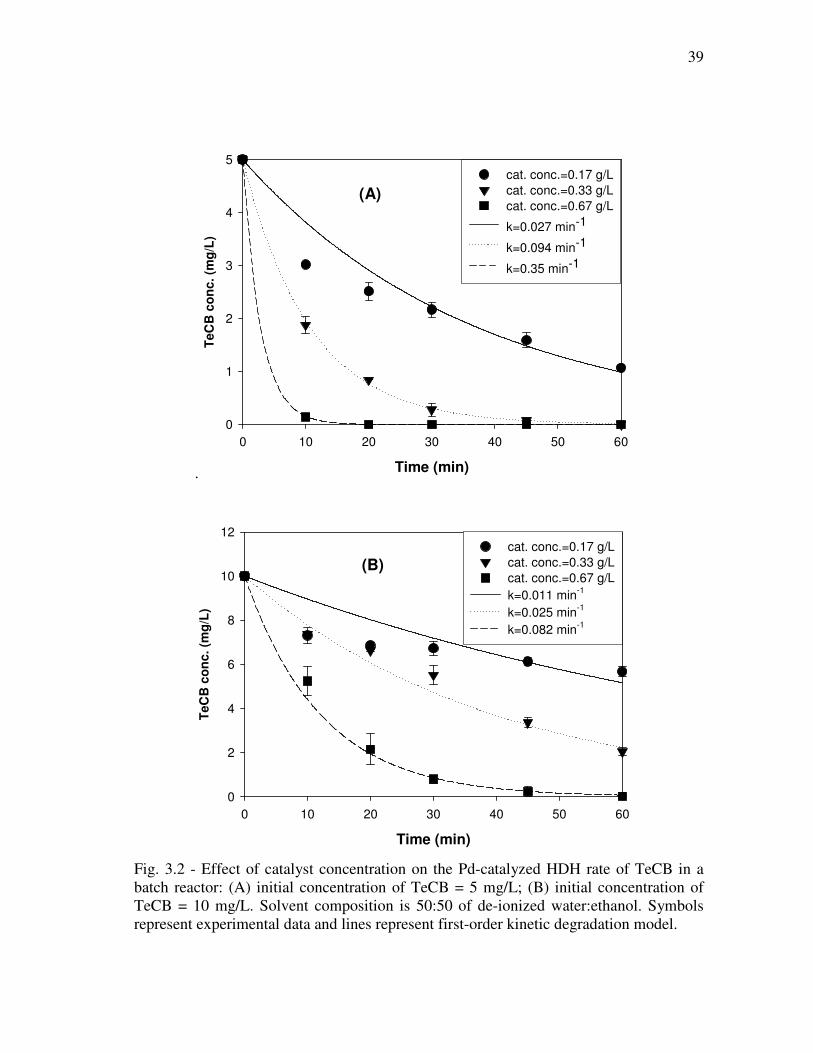
3.4.2. Effect of catalyst concentration on the Pd-catalyzed HDH rate
The effect of catalyst concentration (Mcat
/Vsolvent
) on the Pd-catalyzed HDH rate is shown
Fig. 3.2. All experiments in Fig. 3.2 were conducted in a 50:50 solvent composition.
Fig. 3.2 shows clearly that an increase in catalyst concentration increases the HDH rate.
This behavior is predicted by equations (3.7) and (3.8), and it indicates that the
availability of Pd surface sites is a rate-limiting factor under the experimental conditions
I tested.
According to equations (3.7) and (3.8), the apparent first-order rate constant k
should increase linearly with the catalyst concentration. Instead, I observed that a four-
fold increase in the catalyst concentration (from 0.17 g/L to 0.67 g/L) resulted in roughly
a ten-fold increase in k. Therefore, k depends upon catalyst concentration more strongly
than predicted by my mathematical model. My proposed explanation for this
observation is that, at low concentrations of catalyst, it is not valid to assume that the
TeCB is in the linear range of the Langmuir isotherm, because not enough sorption sites
are available. Hence, the sorbed concentration cat
TeCBC is lower than would be predicted
by equation (3.3), and the overall reaction rate is lower than its predicted value. This
results in a non-linear dependence of k on the catalyst concentration. I believe that the
observed data are consistent with this hypothesis.
Despite the non-linear dependence of k on the catalyst concentration, the results
shown in Fig. 3.2 are in qualitative agreement with the Langmuir-Hinshelwood model
for the HDH kinetics.
Page 51
39
. Time (min)
0 10 20 30 40 50 60
Te
CB
co
nc
. (m
g/L
)
0
1
2
3
4
5cat. conc.=0.17 g/L
cat. conc.=0.33 g/L
cat. conc.=0.67 g/L
k=0.027 min-1
k=0.094 min-1
k=0.35 min-1
Time (min)
0 10 20 30 40 50 60
Te
CB
co
nc
. (m
g/L
)
0
2
4
6
8
10
12cat. conc.=0.17 g/L
cat. conc.=0.33 g/L
cat. conc.=0.67 g/L
k=0.011 min-1
k=0.025 min-1
k=0.082 min-1
Fig. 3.2 - Effect of catalyst concentration on the Pd-catalyzed HDH rate of TeCB in a
batch reactor: (A) initial concentration of TeCB = 5 mg/L; (B) initial concentration of
TeCB = 10 mg/L. Solvent composition is 50:50 of de-ionized water:ethanol. Symbols
represent experimental data and lines represent first-order kinetic degradation model.
(A)
(B)
Page 52
40
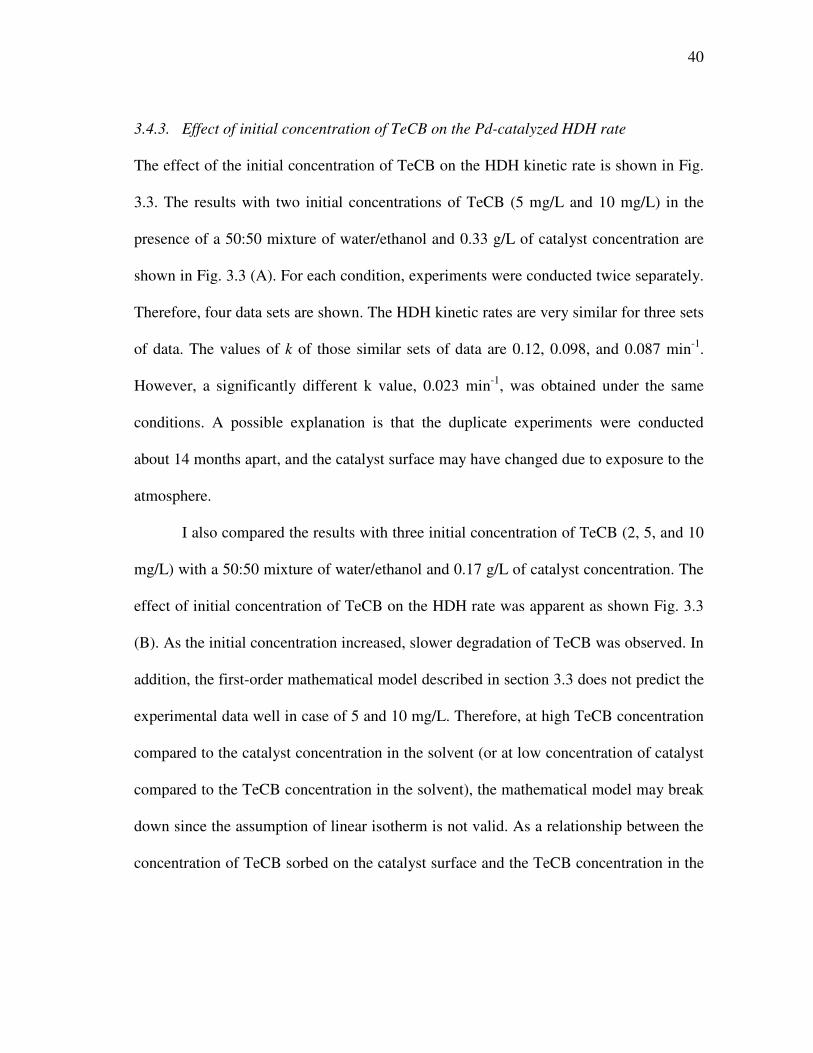
3.4.3. Effect of initial concentration of TeCB on the Pd-catalyzed HDH rate
The effect of the initial concentration of TeCB on the HDH kinetic rate is shown in Fig.
3.3. The results with two initial concentrations of TeCB (5 mg/L and 10 mg/L) in the
presence of a 50:50 mixture of water/ethanol and 0.33 g/L of catalyst concentration are
shown in Fig. 3.3 (A). For each condition, experiments were conducted twice separately.
Therefore, four data sets are shown. The HDH kinetic rates are very similar for three sets
of data. The values of k of those similar sets of data are 0.12, 0.098, and 0.087 min-1
.
However, a significantly different k value, 0.023 min-1
, was obtained under the same
conditions. A possible explanation is that the duplicate experiments were conducted
about 14 months apart, and the catalyst surface may have changed due to exposure to the
atmosphere.
I also compared the results with three initial concentration of TeCB (2, 5, and 10
mg/L) with a 50:50 mixture of water/ethanol and 0.17 g/L of catalyst concentration. The
effect of initial concentration of TeCB on the HDH rate was apparent as shown Fig. 3.3
(B). As the initial concentration increased, slower degradation of TeCB was observed. In
addition, the first-order mathematical model described in section 3.3 does not predict the
experimental data well in case of 5 and 10 mg/L. Therefore, at high TeCB concentration
compared to the catalyst concentration in the solvent (or at low concentration of catalyst
compared to the TeCB concentration in the solvent), the mathematical model may break
down since the assumption of linear isotherm is not valid. As a relationship between the
concentration of TeCB sorbed on the catalyst surface and the TeCB concentration in the
Page 53
41
Time (min)
0 10 20 30 40 50 60
C/C
0
0.0
0.2
0.4
0.6
0.8
1.0Initial conc. = 5 mg/L
Initial conc. = 5 mg/L
Initial conc. = 10 mg/L
Initial conc. = 10 mg/L
k=0.094 min-1
k=0.098 min-1
k=0.025 min-1
k=0.087 min-1
Time (min)
0 10 20 30 40 50 60
C/C
0
0.0
0.2
0.4
0.6
0.8
1.0
1.2Initial conc.=2 mg/L
Initial conc.=5 mg/L
Initial conc.=10 mg/L
k=0.081 min-1
k=0.027 min-1
k=0.011 min-1
Fig. 3.3 - Effect of initial concentration of TeCB on the Pd-catalyzed HDH rate in a
batch reactor: (A) catalyst conc. = 0.33 g/L; (B) catalyst conc. = 0.17 g/L. Solvent
composition of both (A) and (B) is 50:50 of de-ionized water:ethanol. Symbols represent
experimental data and lines represent first-order kinetic degradation model.
(A)
(B)
Page 54
42
solvent is shown in equation (3.3), the use of a linear partitioning coefficient Kd indicates
that the concentration is in the low (linear) region of the Langmuir isotherm. Therefore,
the model may require revision to describe cases of high TeCB concentrations with low
catalyst concentrations.
In summary, the effect of initial concentration of TeCB on the HDH kinetic rate
may or may not be significant depending on the catalyst concentration in the reactor.
3.4.4. Transformation of TeCB by the Pd-catalyzed HDH
The experimental data presented in Figures 3.1–3.3 show clearly that the concentration
of TeCB in the water/ethanol solvent decreases over time. However, one might still
question whether the observed disappearance of TeCB is due to Pd-catalyzed HDH, or
due to some other process (e.g., slow volatilization into the reactor head space, slow
sorption onto the catalyst surface). A mass balance is required to ascertain that the
observed disappearance of TeCB is due to conversion to a reaction product.
Furthermore, for development of the full-scale REACH process, it is important to know
the chemical products of the HDH reaction. For instance, do chlorinated by-products
accumulate in the system? To answer these questions, and to determine a proposed
reaction pathway, a mass-balance study was performed.
Experiments were conducted as described above, but samples were analyzed by
purge-and-trap gas chromatography with mass spectrometry in order to quantify the
concentrations of all reaction products.
Page 55
43
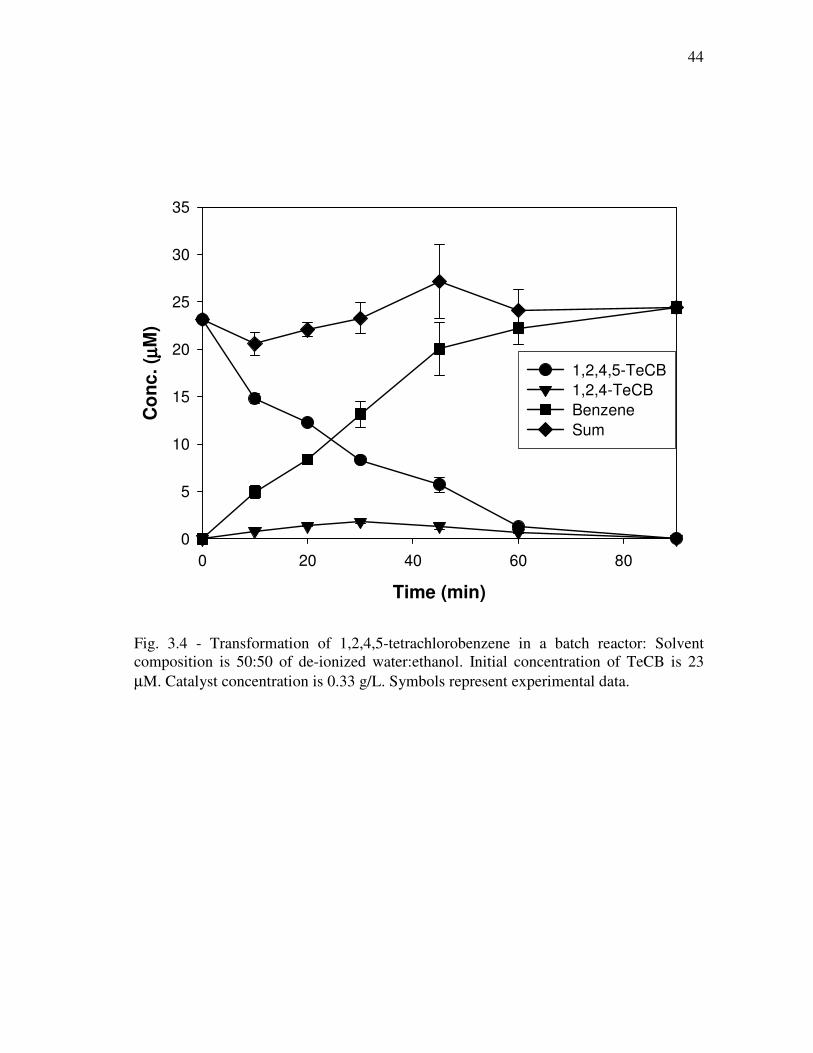
Experimental results are presented in Fig. 3.4. Minor amounts of 1,2,4-trichloro-
benzene (TCB) as an intermediate chlorinated by-product were formed, but the TCB did
not persist or accumulate. The concentration of benzene, which is the end product of the
HDH reaction, increased as the TeCB was removed. This finding is consistent with that
of previous research (Alonso et al., 2002; Balko et al., 1993; Urbano and Marinas,
2001). Fig. 3.4 shows excellent closure of the mass balance, meaning that all TeCB
originally present in the system is accounted for by conversion to TCB or to benzene.
This verifies that any observed loss of TeCB is due to hydrodehalogenation, not due to
any other loss process. Analyses were performed by Advanced Technologies and
Testing Laboratories, Inc., in Gainesville, Florida.
A possible reaction pathway for the transformation of TeCB to benzene by the
Pd-catalyzed HDH method is:
benzeneTCB-1,2,4TeCB-1,2,4,5 *** →→ kk (3.9)
where k* and k
** are kinetic constants and k
** is much larger than k
*. Accordingly, an
intermediate product is formed, but it reacts very quickly, so effectively it appears that
1,2,4,5-TeCB is converted to benzene via a direct transformation.
3.4.5. Discussion of significance
The formation of benzene as an end product would not necessarily represent a significant
environmental clean-up, because benzene is a regulated contaminant. In certain
Page 56
44
Time (min)
0 20 40 60 80
Co
nc
. ( µµ µµ
M)
0
5
10
15
20
25
30
35
1,2,4,5-TeCB
1,2,4-TeCB
Benzene
Sum
Fig. 3.4 - Transformation of 1,2,4,5-tetrachlorobenzene in a batch reactor: Solvent
composition is 50:50 of de-ionized water:ethanol. Initial concentration of TeCB is 23
µM. Catalyst concentration is 0.33 g/L. Symbols represent experimental data.
Page 57
45
circumstances, conversion of TeCB to benzene might be considered a significant
improvement, but that may not be the case generally. Future investigations might
employ both palladium catalyst and rhodium (Rh) catalyst, because Rh is known to
catalyze hydrogenation of the aromatic ring (Coq et al., 1986). Hence, I expect that
TeCB could be converted to cyclohexane, which would likely represent an acceptable
environmental endpoint.
Despite the fact that benzene is formed as an end product in this investigation,
the results of this study are significant because they have allowed me to determine the
effect of solvent composition on the HDH reaction, and have allowed me to formulate a
conceptual and mathematical model for the HDH process. Finally, I note that the
information gained in this study will be helpful for the treatment not only of TeCB, but
also other candidate contaminants such as PCBs, chlorinated phenols, pesticides, etc.
Thus, overall I believe the results of this investigation are essential to the development of
the full-scale REACH process, despite the fact that benzene is formed as an end product
in this investigation.
3.5. Conclusions
In this Chapter, I have investigated the Pd-catalyzed HDH of a selected target
contaminant, 1,2,4,5-tetrachlorobenzene (TeCB), in mixtures of water and ethanol. The
goals of this Chapter were (1) to demonstrate the feasibility of the REACH technology,
(2) to determine the effect of the solvent composition (i.e., the water:ethanol ratio) on the
Page 58
46
HDH process, and (3) to develop a model for the kinetics of the dehalogenation process.
These goals were accomplished through a series of experiments conducted in a batch
reactor.
I found that TeCB can be completely dehalogenated at room temperature under
mild hydrogen pressure (0.21 MPa). Therefore, I believe that the proposed REACH
technology is feasible for treatment of soils contaminated by HHOCs. Other significant
findings of this Chapter are:
• the Pd-catalyzed HDH rate decreases as the fraction of ethanol increases in the
solvent;
• the Pd-catalyzed HDH rate increases as the concentration of catalyst increases in the
reaction vessel;
• the initial concentration of TeCB might or might not affect the apparent HDH rate
constant depending on the concentration of catalyst in the solvent; and
• the kinetics of the TeCB disappearance are apparently first-order.
All of these findings can be interpreted within the framework of a Langmuir-
Hinshelwood model for heterogeneous catalysis. This framework has enabled me to
formulate a mathematical model in which the TeCB disappearance follows first-order
kinetics:
solvent
TeCB
solvent
TeCB Ckdt
dC−=
Page 59
47
with the apparent first-order rate constant, k, given by the following:
k = k1 Kd M
cat
V solvent
where Kd is a distribution coefficient describing TeCB sorption onto the catalyst surface,
Mcat
is the mass of catalyst in the reaction vessel, and Vsolvent
is the volume of solvent in
the reaction vessel.
Thus, with regard to the effect of the solvent composition, I suggest that as the
ethanol concentration increases, the TeCB resides preferentially in the liquid solvent,
rather than sorbing to the surface of the catalyst. The decreased concentration of TeCB
on the catalyst surface results in a decreased overall reaction rate. Other experimental
findings (e.g., the dependence of k on the catalyst concentration) are also interpreted
within the Langmuir-Hinshelwood framework.
TeCB was converted stoichiometrically to benzene by the Pd-catalyzed HDH
reaction. I observed low concentrations of a transient intermediate, 1,2,4-
trichlorobenzene (TCB). The disappearance of TCB was rapid enough that one could
consider TeCB is converted directly to benzene. Future work could involve the use of
both Pd catalysts and Rh catalysts to convert the benzene to cyclohexane, which is less
toxic than benzene.
Overall, the findings of this study are important towards the full development of
the proposed REACH process as described in subsequent Chapters. These findings may
Page 60
48
also be useful to the treatment of other liquid waste streams containing TeCB or other
halogenated hydrophobic organic contaminants.
Page 61
49
CHAPTER IV
PALLADIUM-CATALYZED HYDRODEHALOGENATION OF
PENTACHLOROPHENOL IN WATER-ETHANOL MIXTURES
4.1. Introduction
Since the degradation kinetics observed for PCP studies are different from those for
TeCB in water/ethanol mixtures which were described in the previous Chapter III, this
separate Chapter is prepared for the comparison purposes.
In this Chapter, the effects of solvent composition, catalyst concentration, and
hydrogen pressure in the reactor are discussed with respect to their effect on PCP
degradation. The Langmuir-Hinshelwood model is again employed to interpret the three
effects. A sequential reductive dehalogenation of PCP by Pd-catalyzed HDH was also
studied. A hypothesis why the catalytic degradation of PCP does not follow first-order
kinetics is offered.
4.2. Materials and methods
4.2.1. Chemicals and catalyst
Table 4.1 shows the chemicals and catalyst used in this research. More detailed physical
properties of the catalyst can be found elsewhere (Lowry and Reinhard, 1999). Stock
Page 62
50
solution of pentachlorophenol (PCP) at 1000 mg/L was prepared by dissolving 0.02 g of
chemical into 20 mL ethanol in a 20-mL clear borosilicate glass vial. The vial was sealed
using a PTFE-lined septum and stored in a freezer to minimize any loss due to the
volatilization.
4.2.2. Pd-catalyzed HDH kinetics studies
General experimental procedures for the studies of the effects of solvent composition,
catalyst concentration, and H2 gas pressure on the Pd-catalyzed hydrodehalogenation
(HDH) reactions can be found in the previous Chapter. Except where noted
subsequently, the total volume of solvent used in each experiment was 100 mL and the
reaction bottle used was a 250-mL Pyrex glass bottle. Table 4.2 shows the detailed sets
of experimental conditions for the Pd-catalyzed HDH reaction studies.
The analytical method is a modified version of the method described in a
published paper (Khodadoust et al., 1999). A sample is acidified with 6N hydrochloric
acid. This acidification is conducted to ensure that the hydroxyl group of the PCP is fully
protonated, to allow PCP to be extracted by a non-polar solvent. An appropriate amount
of acidified sample is mixed with 1 mL toluene in a 2-mL screw thread glass vial. Then,
the vial is placed on a mechanical shaker and is shaken for 1 hour. For the analysis, 0.5
mL of the toluene is transferred to a 2-mL vial and loaded on the auto-sampler of a gas
chromatograph (GC). The instrument employed is a Perkin-Elmer Clarus 500 GC
equipped with an electron capture detector (ECD) and a 30 m × 0.32 mm i.d. DB-5ms
Page 63
51
Table 4.1 - Chemicals and catalyst used in experiments
Chemical or catalyst Specification Company
Pentachlorophenol 98% Sigma-Aldrich
2,3,4,6-Tetrachlorophenol 99% Supelco
2,3,5,6-Tetrachlorophenol 99% Supelco
2,3,4,5-Tetrachlorophenol 99% Supelco
2,3,4-Trichlorophenol 99% Sigma-Aldrich
2,3,5-Trichlorophenol 99% Supelco
2,3,6-Trichlorophenol 99% Supelco
2,4,5-Trichlorophenol 99% Supelco
2,4,6-Trichlorophenol 99% Supelco
3,4,5-Trichlorophenol 99% Supelco
Phenol 99+% Sigma-Aldrich
Ethanol 99.5% Sigma-Aldrich
Toluene 99.9% EMD Chemicals
2,5-Dibromotoluene 98% Sigma-Aldrich
Pd-on-Al2O3 catalyst 1% Pd by weight Sigma-Aldrich
De-ionized water > 17.5 MΩ⋅cm Barnstead
Page 64
52
Table 4.2 - Experimental conditions for Pd-catalyzed HDH reactions
Initial concentration of PCP
in reactor (mg/L)
Ccat
(g/L)
Solvent composition
(DIW(%):EtOH(%))
H2 gas pressure
(MPa)
Effect of solvent composition
5.0 0.5 67:33 0.17
5.0 0.5 50:50 0.17
5.0 0.5 33:67 0.17
10.0 0.5 67:33 0.17
10.0 0.5 50:50 0.17
10.0 0.5 33:67 0.17
Adsorption isotherm
6 different concentrations 1.0 67:33 N.A.
6 different concentrations 1.0 50:50 N.A.
6 different concentrations 1.0 33:67 N.A.
Effect of catalyst concentration
5.0 0.1 50:50 0.17
5.0 0.5 50:50 0.17
5.0 1 50:50 0.17
10.0 0.1 50:50 0.17
10.0 0.5 50:50 0.17
10.0 1 50:50 0.17
Effect of H2 gas pressure
10.0 0.5 50:50 0.17
10.0 0.5 50:50 0.24
10.0 0.5 50:50 0.31
Mass balance studies
20.0 1.0 50:50 0.17
Note: Ccat means concentration of catalyst; DIW and EtOH indicate de-ionized water and
EtOH, respectively, v/v ratio; N.A. means not caplicable.
Page 65
53
capillary column (J&W). Injector and detector temperatures are 250 and 300°C,
respectively. The oven of the GC is operated at 100°C for 1 minute, then the temperature
is increased to 200°C at a rate of 10°C/min, then the temperature is held for a period of 4
minutes. The toluene extractant contains 2,5-dibromotoluene as an internal standard for
quality control.
4.2.3. Adsorption isotherm studies
All adsorption isotherm experiments were performed in a batch type mode in the pH
range of 6.0 to 6.5. Twenty mL of a desired solvent, which is a pre-mixed water/ethanol
mixture, was added into a 20-mL EPA glass vial. A desired volume of 1000 mg/L PCP
stock solution was spiked to the vial to make a targeted initial concentration. The PCP
spiked vials were shaken vigorously for 30 minutes. A sample (0.2 mL) was taken from
each vial for measuring the initial concentration of PCP, Cin. Twenty mg of 1% (wt) Pd
on Al2O3 powder was added into the vials. Then, the vials were securely tightened with a
Teflon-line cap and shaken at 300 rpm using a mechanical shaker for 24 hours for the
adsorption. After that, the caps were unscrewed and a sample was taken from each vial.
The sample was filtered using a 0.2-µm membrane to remove any particles. In order to
quantify the equilibrium concentration of PCP, Ceq, the filtered sample was then
extracted with toluene for GC analysis as described in previous section. The
concentration of PCP adsorbed onto the catalyst surfaces was determined by the
following equation.
Page 66
54
cateqin CCCq /)( −= (4.1)
The units of q are mass of PCP sorbed per mass of catalyst.
4.2.4. Mass balance studies
The identification of transformation behavior of PCP during dehalogenation by the Pd-
catalytic treatment is critical. Therefore, mass balance studies were conducted in order to
distinguish between a sequential pathway through lesser chlorinated compounds or a
direct pathway to phenol. The experimental conditions for these studies were shown in
Table 2.
PCP concentrations in samples were analyzed by the same patterns as described
in section 4.2.2. A Perkin-Elmer Clarus 500 GC equipped with flame ionization detector
(FID) was employed to quantify phenol concentrations. Dichloromethane was used to
extract phenol from a sample and ready for the GC analysis. The column used was a DB-
5ms capillary column (30 m length × 0.25 mm i.d.) (J&W). The daughter chlorinated
compounds of PCP were identified by comparing their elution times to those of
standards injected on the GC-ECD. The analytical procedures for the daughter
compounds of PCP followed the one developed for the PCP analysis.
4.2.5. Control experiments
In order to make sure that any observed disappearance of PCP was due to the Pd-
catalytic HDH, two sets of control tests were performed. Detailed experimental
Page 67
55
procedures can be found in the previous Chapter. No significant loss occurred due to
volatilization, with recoveries greater than 98% for all conditions tested. In the sorption
controls, recoveries of PCP were in the range 86-110%. Therefore, I trust that any
observed removal of PCP is due to catalytic HDH.
4.3. Results and discussion
4.3.1. Effect of solvent composition on the Pd-catalyzed HDH rate
The primary object of this part of the study is to determine the effect(s) of solvent
composition on the Pd-catalyzed destruction of the target contaminant. I measured the
catalytic hydrodehalogenation (HDH) of PCP in three different water/ethanol mixtures.
The water:ethanol ratios were 67:33, 50:50, and 33:67 (vol:vol, before mixing).
As shown in Fig. 4.1, at both 5 and 10 mg/L of PCP initial concentration, the rate
of PCP degradation by Pd-catalyzed HDH increases as the fraction of water increases in
the solvent composition. It is clearly shown that the solvent composition has a strong
effect on the HDH rates. The same trend of the solvent effect on the HDH rate was
observed in previous studies for 1,2,4,5-tetrachlorobenzene (TeCB) with Pd/Al2O3 in
Chapter III, and for polychlorinated biphenyls (PCBs) with Pd/Fe (Korte et al., 2002).
For the dehalogenation experiments of 2,4,4’-trichloro-2’-hydroxydiphenylether (TCPE)
with Pd/Carbon (Xia et al., 2003), the rate was promoted by the addition of water but the
volume ratios of water to ethanol insignificantly affected the turnover frequency (TOF)
of the dehalogenation.
Page 68
56
Time (min)
0 10 20 30 40 50 60
PC
P c
on
c.
(mg
/L)
0
1
2
3
4
5DIW:EtOH=67:33
DIW:EtOH=50:50
DIW:EtOH=33:67
k=0.16 min-1
k=0.075 min-1
k=0.032 min-1
Time (min)
0 10 20 30 40 50 60
PC
P c
on
c.
(mg
/L)
0
2
4
6
8
10DIW:EtOH=67:33
DIW:EtOH=50:50
DIW:EtOH=33:67
k=0.12 min-1
k=0.052 min-1
k=0.026 min-1
Fig. 4.1 - Effect of solvent composition on the Pd-catalyzed HDH rate of PCP in a batch
reactor: catalyst conc. and hydrogen gas pressure were 0.5 g/L and 0.17 MPa,
respectively, in both sets of experiment. DIW and EtOH mean de-ionized water and
ethanol, respectively. Symbols represent experimental data and lines represent first-order
degradation model.
(A)
(B)
Page 69
57
In the previous Chapter, it was observed that the HDH reactions of TeCB follow
first-order reaction kinetics. However, based on visual inspection, the catalytic HDH of
PCP does not follow first-order kinetics in this study as shown Fig. 4.1. The feasible
explanations for this will be described in section 4.3.6., below.
I believe that the observed effect of solvent composition on the rate of the HDH
is due to the equilibrium partitioning of the target contaminant between the liquid
solvent and the solid catalyst surfaces. When the solvent is mostly water, the
hydrophobic contaminant, PCP, partitions more strongly to the catalyst surface,
increasing the catalytic reaction rate. As the ethanol fraction increases, PCP is more
“comfortable” in the solvent, and partitions less strongly to the solid catalyst surface,
thereby slowing the rate.
4.3.2. Adsorption isotherms
The study of the adsorption isotherm was performed to confirm further the effect of
solvent composition on the HDH rate. Fig. 4.2 shows the adsorption isotherms of PCP
onto Pd/Al2O3 in three different solvent compositions. In order to calculate the isotherm
parameters, the following Langmuir isotherm model was employed:
)1/()( max eqeq KCKCqq += (4.2)
where, q (mol/g) is the concentration of PCP adsorbed onto catalyst surface, Ceq (mol/L)
is the equilibrium concentration of PCP in the liquid solvent, qmax (mol/g) is the
Page 70
58
0.0E+00
1.0E-05
2.0E-05
3.0E-05
4.0E-05
5.0E-05
0.0E+00 5.0E-05 1.0E-04 1.5E-04 2.0E-04 2.5E-04 3.0E-04
Ceq (mol/L)
q (
mo
l/g
)
DIW:EtOH=67:33
DIW:EtOH=50:50
DIW:EtOH=33:67
Langmuir model
Fig. 4.2 - Adsorption isotherms of PCP onto Pd/Al2O3 in different solvent compositions.
Page 71
59
Table 4.3 - Adsorption parameters calculated from isotherm experiments
Solvent composition
(DIW:EtOH)
qmax
(mol/g)
K
(L/mol)
67:33 5.94E-05 1.53E+04
50:50 8.50E-06 5.54E+04
33:67 1.27E-06 2.18E+04
Page 72
60
maximum concentration of PCP that can be adsorbed onto the catalyst surface, and K
(L/mol) is the adsorption equilibrium constant. The adsorption parameters calculated by
the Langmuir model, equation (4.2), are summarized in Table 4.3.
Larger amounts of PCP adsorbed onto the catalyst surfaces are allowed as the
water fraction increases in the solvent, clearly illustrated in Fig. 4.2. The adsorption
behaviors of PCP onto Pd/Al2O3 are successfully predicted by the Langmuir model. I
expected that since same adsorbent, Pd/Al2O3, and adsorbate, PCP, were used, the
adsorption capacity, qmax, should be similar for all solvent compositions. The adsorption
equilibrium constant, K, could be different in the three different solvent compositions.
However, higher qmax was observed at higher fraction of water in the solvent, and similar
values of K were shown in all three solvent compositions, confirmed in Table 4.3. I do
not have a scientific explanation for this disagreement. It is demonstrated from this
isotherm experiment that the water fraction in the solvent is a very important operational
parameter for Remedial Extraction and Catalytic Hydrodehalogenation (REACH).
4.3.3. Effect of catalyst concentration on the Pd-catalyzed HDH rate
Fig. 4.3 shows the effect of catalyst concentration on the HDH reaction rate of PCP. The
HDH rate increases with increasing catalyst concentration. Since the degradation of PCP
by the Pd-catalyzed HDH does not appear to follow first-order kinetics, the degradation
rate constant cannot be calculated, and I cannot explain mathematically if the effect is
linear.
Page 73
61
Time (min)
0 10 20 30 40 50 60
PC
P c
on
c.
(mg
/L)
0
1
2
3
4
5catalyst conc.=0.1 g/L
catalyst conc.=0.5 g/L
catalyst conc.=1 g/L
Time (min)
0 10 20 30 40 50 60
PC
P c
on
c. (m
g/L
)
0
2
4
6
8
10catalyst conc.=0.1 g/L
catalyst conc.=0.5 g/L
catalyst conc.=1 g/L
Fig. 4.3 - Effect of catalyst concentration on the Pd-catalyzed HDH rate of PCP in a
batch reactor: solvent composition is 50:50 of de-ionized water:ethanol.
(B)
(A)
Page 74
62
4.3.4. Effect of H2 pressure on the Pd-catalyzed HDH rate
The HDH reaction typically follows a stoichiometry along the lines of the following
(Urbano and Marinas, 2001):
R-Xn + nH2 R-Hn + nH+ + nX
- (4.3)
where X represents a halogen atom, e.g., chlorine or bromine. As described by the above
equation, hydrogen is a reactant in the HDH of the halogenated compounds. Therefore,
one might expect that the HDH reaction rate would be sensitive to the hydrogen pressure
in the reactor. It was reported that the degradation rate of nitrate by Pd/Cu bimetallic
catalyst could be enhanced by increasing hydrogen partial pressure (Pintar et al., 1996). I
also verified that, in the absence of hydrogen, no reaction occurs, describing control
experiments where nitrogen was used in stead of hydrogen.
Fig. 4.4 shows the effect of hydrogen pressure on the dehalogenation of PCP.
Surprisingly, the hydrogen pressure had no effect on the HDH reaction of PCP when the
pressure was varied between 10 and 30 psig under the experimental conditions I
considered. To explain this finding, I hypothesize that the sorption of hydrogen gas onto
the catalyst surface follows a Langmuir isotherm. Thus, once the hydrogen pressure in
the reactor is above a certain level, no additional sorption can take place, and the
reaction ceases to be sensitive to the pressure. I have not attempted to determine the
pressure at which this threshold resides. However, it is clearly somewhere between 0
psig (at which point no reaction occurs) and 10 psig (at which point the reaction
Page 75
63
Time (min)
0 10 20 30 40 50 60
PC
P c
on
c. (m
g/L
)
0
2
4
6
8
10H
2 pressure=10 psig
H2 pressure=20 psig
H2 pressure=30 psig
Fig. 4.4 - Effect of H2 gas pressure on the Pd-catalyzed HDH rate of PCP in a batch
reactor: solvent composition is 50:50 of de-ionized water:ethanol; catalyst concentration
is 0.5 g/L.
Page 76
64
proceeds at its maximum rate).
From this experiment, it is inferred that dissolved molecular hydrogen, [H2(aq)],
does not compete for adsorption sites on the catalyst surfaces with PCP, and the H2
concentration on the catalyst is constant during the reaction when above 10 psig of
hydrogen gas is delivered.
4.3.5. Transformation of PCP by the Pd-catalyzed HDH
A mass balance study was performed to examine if PCP is transformed sequentially or
directly by the Pd-catalyzed HDH, to identify intermediate and final products, and
finally to propose a possible transformation pathway. As shown in Fig. 4.5, substantial
amounts of daughter chlorinated compounds of PCP as intermediates are generated. As
PCP concentration decreases, the phenol concentration increases continuously over time.
Therefore, it is likely that phenol is the final product of PCP HDH reaction. The
concentration of 2,3,4,6-tetrachlorophenol (TeCP) increases up to 60 min, and then
decreases. A negligible concentration of 2,3,5,6-TeCP was formed. The concentrations
of 2,3,4- and 2,3,6-trichlorophenol (TCPs) initially increase and stay at a certain level
within 2 hours under the experimental conditions. The complete dehalogenation of 2,4,5-
TCP with Pd/Al2O3 (Hoke et al., 1992) and 2,4,6-TCP with Pd/Mg (Morales et al., 2002)
were reported previously. Therefore, 2,3,4- and 2,3,6-TCP are probably not stable
products and they should be further dechlorinated if longer reaction periods are given or
if more fresh catalyst is added. The dichlorophenols and chlorophenols were not
detected.
Page 77
65
Time (min)
0 20 40 60 80 100 120
Co
nc.
( µµ µµM
)
0
20
40
60
80PCP
Phenol
2,3,4-TCP
2,3,6-TCP
2,3,5,6-TeCP
2,3,4,6-TeCP
Sum
Fig. 4.5 - Transformation of pentachlorophenol by Pd-catalyzed HDH in a batch reactor:
solvent composition is 50:50 of de-ionized water:ethanol. PCP, TCP, and TeCP mean
pentachlorophenol, trichlorophenol, and tetrachlorophenol, respectively.
Page 78
66
Generally, a total mass balance at each time point meets the expected one.
However, the summation values of compounds between 10 and 60 min are lower than
the expected one. I believe that chlorinated compounds are adsorbed on the catalyst
surface, not released to the solvent. Since any catalyst particles in samples were removed
by the filtration with a 0.2-µm membrane before ready to be analyzed, the chlorinated
compounds adsorbed on catalyst surfaces are not detected.
In summary, PCP treated with the Pd-catalytic HDH is transformed to phenol by
sequential reductive dehalogenation to tetrachlorophenols, then to trichlorophneols, then
to phenol. Therefore, a dehalogenation pathway of PCP can be proposed as shown Fig.
4.6. No 2,3,4,5-tetrachlorophenol was detected, so I do not believe it is part of the
reaction pathway.
4.3.6. Degradation kinetics of PCP by the Pd-catalyzed HDH
The Langmuir-Hishelwood (L-H) mechanism is defined by the following steps
(Carberry, 1976): (i) two species adsorb onto the catalyst surface, (ii) reaction between
two adsorbed species occurs, and (iii) products are formed and desorb. In the previous
paper Chapter III, a first-order kinetic model was developed based on the L-H kinetics
and successfully used to represent the 1,2,4,5-tetrachlorobenzene HDH data.
However, the first-order kinetic model failed to predict the PCP HDH data as
shown Fig.4.1. Initially, the degradation rate of PCP is fast, but it slows down over time.
The failure of first-order kinetics to describe the degradation of PCP is probably due to
Page 79
67
Fig. 4.6 - Proposed transformation pathway of PCP by Pd-catalyzed HDH in a
water/ethanol mixture.
Page 80
68
the competitive reactions with intermediate products which are generated during PCP
degradation. As explained in section 4.3.5., substantial mass of intermediate products are
generated during PCP degradation. The concentration of the intermediates adsorbed onto
the catalyst cannot be ignored compared to that of PCP. In other words, PCP probably
must compete with intermediates for sorption sites on the catalyst. Since intermediate
products are accumulated over time, the kinetic rate of PCP decreases as reaction time
proceeds.
Because of this competition, I have not developed a mathematical model based
on the L-H kinetics to successfully describe the degradation profiles of PCP HDH.
However, I believe that the degradation of PCP by Pd-catalyzed HDH reaction follows
the L-H mechanism, as confirmed by adsorption isotherms, effect of catalyst
concentration, effect of hydrogen pressure, and mass balance experiments.
4.4. Conclusions
PCP can be reductively dehalogenated through Pd-catalyzed HDH. The rate of the HDH
reaction is a strong function of the solvent composition and the concentration of catalyst
in the reactor. The hydrogen pressure is not important as long as it is above some critical
level. The transformation of PCP using Pd on Al2O3 powered catalyst in water/ethanol
mixtures occurs sequentially by dehalogenation to tetrachlorophenols, then to
trichlorophenols, then to phenol. The degradation rate of PCP does not follow first-order
kinetics, probably because competition for reactive sites occurs between PCP and
Page 81
69
intermediate products which are generated during PCP degradation. The experimental
results obtained here are useful when the Pd-catalytic HDH technology is practically
applied to the remediation of contaminated sites.
Page 82
70
CHAPTER V
STUDIES OF THE REACH TECHNOLOGY IN CONTINUOUS MODE:
SYNTHETICALLY CONTAMINATED SOILS IN THE LABORATORY
5.1. Introduction
In Chapter II, the extraction of 1,2,4,5-tetrachlorobenzene (TeCB) and
pentachlorophenol (PCP) from contaminated soils in batch mode was discussed. In
Chapters III and IV, Pd-catalyzed hydrodehalogenation (HDH) reactions of TeCB and
PCP in batch mode were described. Now, I am going to discuss the studies of the
remedial extraction and catalytic hydrodehalogenation (REACH) in continuous mode to
treat soils synthetically contaminated by HHOCs in the laboratory. In other words, I
combined contaminant extraction and contaminant destruction in a closed-loop system
as suggested in Chapter I.
5.2. Materials and methods
5.2.1. Chemicals
Ethanol (99.5%, ACS grade, Aldrich), acetone (≥99%, ReagentPlus grade, Aldrich),
hexane (98.5%, HPLC grade, EMD chemicals), toluene (99.9%, HPLC grade, Aldrich),
1,2,4,5-tetrachlorobenzene (98%, Sigma-Aldrich), pentachlorophenol (98%, Sigma-
Page 83
71
Adrich), 2,5,-dibromotoluene (98%, Sigma-Aldrich), ammonium hydroxide (TraceMetal
grade, Fisher), and sodium hypochlorite (Purified grade, 4-6% NaOCl, Fisher) were used
without further purification. The solvent selected for the closed-loop treatment system
was a 50:50 mixture of water and ethanol (vol:vol, before mixing) and it was prepared
using deionized water and 200 proof (99.5%) ethanol. In this project, 1,2,4,5-
tetrachlorobenzene (TeCB) and pentachlorophenol (PCP) were selected as the two target
contaminants. TeCB and PCP stock solutions of 1000 mg/L were prepared by dissolving
0.02 g of TecB and PCP powdered chemical, respectively, into 20 mL ethanol in a glass
via and closed with a PTFE-lined septum.
A commercially available supported palladium (Pd) was used in this research. It
is Pd, 1.01% (wt) on 1-2 mm alumina spheres, manufactured by Alfa Aesar and the
catalyst was prereduced when supplied. The information regarding to the catalyst was
trusted as the manufacturer provided. The catalyst was employed for my experiments as
it was supplied. No attempt was given to protect the catalyst from air contact which may
result in oxidation of Pd and decrease in performance.
5.2.2. Lab contaminated soils
Uncontaminated soil was obtained from College Station, TX. The soil was classified as a
sandy loam with 78% sand, 6% silt, and 16% clay which was determined by the Soil,
Water, and Forage Testing Laboratory at Texas A&M University. The fraction of soil
organic matter was 0.30%.
Page 84
72
I contaminated the soil with TeCB and PCP separately for this continuous
experiment. The contamination procedures of the soil with TeCB and PCP were
described in Chapter II. To determine how the contaminant mass was extracted from soil
and removed by Pd-catalyzed treatment, I first had to know the concentration of TeCB
or PCP in the contaminated soil. I determined the soil concentration by a “shaker”
method, which was also described in Chapter II. The TeCB and PCP concentrations
were determined to be 55.5±2.5 and 86.9±3.7 mg/kg, respectively. The contaminated
soil was aged nearly three months before being subjected to the continuous mode
experiment.
5.2.3. Closed-loop treatment system
The closed-loop treatment system was constructed and operated under “baseline”
conditions to demonstrate that REACH is suitable for the soils contaminated by HHOCs
for long periods. Fig. 5.1 shows the schematic diagram of the closed-loop flow-through
system as it has been constructed in the laboratory. Two identical systems were
constructed in order to be able to run two experiments side-by-side. Table 5.1 shows the
experimental (baseline) conditions of the system operation.
Important specifications of the equipment used in the flow-through system are as
follows.
• The reservoir is a 2.3-L glass bottle, sealed with a three hole cap (manufactured
from PTFE with a TFE/propylene o-ring and a polypropylene screw collar,
Page 85
73
Fig. 5.1 - Schematic diagram of closed-loop flow-through system as conducted in the
laboratory.
filter filter
pump reservoir
sample port #2
sample port #3
check valve
catalyst column
hydrogen diffusion module
sample port #1
soil column
Page 86
74
Table 5.1 - Experimental (baseline) conditions of closed-loop flow-through system.
Catalyst 10 g of catalyst
Palladium, 1.01% on 1-2 mm alumina spheres, reduced
Glass bead 3 mm borosilicate glass
Column for catalyst 25 cm3 stainless steel tubular cylindrical reactor
Amt of contaminated soil 200 g
Column for soil 150 cm3 stainless steel tubular cylindrical reactor
Pressure of H2 injected 10 psig (69.0 kPa above atmospheric pressure)
Solvent 50:50 of water:ethanol mixture
Solvent volume 2.2 Liters
Solvent flow rate 1 mL/min
Check valve 10 psig (69.0 kPa above atmospheric pressure)
Pore size of filter 0.5 µm
Page 87
75
Kimble) to minimize volatilization of the solvent or of the target contaminants
from the solvent. One of the holes is for the inlet line, another for the outlet line,
and the other for a base addition which was sealed with a plug under normal
conditions.
• The pump is an Eldex Optos metering pump, model 2SM (Eldex Laboratories,
Napa, CA). Typical flow rate is 1 mL/min. The Optos series of pumps is
designed to provide high accuracy at that flow rate.
• The catalyst column is Swagelok miniature sample cylinder. The approximate
internal volume is 25 cm3. The column is constructed of corrosion-resistant 316
stainless steel.
• The soil column is Swagelok sample cylinder. The internal volume of the
cylinder is 150 cm3. The column is manufactured with 304L stainless steel,
which resists intergranular corrosion.
• The filters are 0.5-µm Swagelok tee-type filters, TF series, with sintered filter
media.
• The sample ports are Swagelok three-way valves. For normal flow conditions,
the valves are oriented as shown in Fig. 5.1. When a sample is desired, the valve
is switched, and the flow is directed into a Hamilton gas-tight syringe. The
syringes are attached to the three-way valves by securing a 16-gauge syringe
needle into a 1/16” Swagelok fitting.
Page 88
76
• The hydrogen diffusion module is a SuperPhobic mini-module from Membrana
(Charlotte, NC). Hydrogen is supplied to the model through gas-impermeable
flexible plastic tubing.
• The catalyst reactor is filled approximately one-third with glass beads on the
bottom, then one-third with 1% Pd-on-Al2O3 catalyst in the middle, then one-
third with glass beads on the top as shown in a previous paper (Lowry and
Reinhard, 2000).
• The check valve is a 10-psig check valve from Swagelok.
• All tubing is 1/8” stainless steel, except for the tubing between the reservoir and
the pump. That tubing is 1/16” flexible plastic, provided by Eldex to be used with
the pump.
• All fittings are stainless-steel Swagelok compression-type fittings.
• The solvent used is a 50/50 mixture of water and ethanol (vol/vol, pre-mixing).
5.2.4. System operation
The systems were run for 7 weeks. One system had TeCB-contaminated soil and the
other had PCP-contaminated soil. Every week, I removed the treated soil from the
column, and re-packed the column with “fresh” contaminated soil. Note that soil did not
actually move through the treatment system. Rather, soil was treated batch-wise, one
column at a time.
Samples were collected once per day from three sample locations, which are
shown in Fig. 5.1. These samples were extracted with hexane for TeCB samples and
Page 89
77
with toluene for PCP samples, and analyzed with a Perkin-Elmer Clarus 500 GC
equipped with an electron capture detector (ECD) and a 30 m × 0.32 mm i.d. DB-5ms
capillary column (J&W).
After 5 weeks of running the treatment system for PCP-contaminated soil, the Pd
catalyst had partially deactivated and was regenerated with dilute sodium hypochlorite
solution (Lowry and Reinhard, 2000). Regeneration was performed as described in the
following. The spent catalyst was taken out from the catalyst column and placed in a 50-
mL plastic centrifuge tube. 20 mL of 20 mM NaOCl was poured into the tube. The tube
was slowly shaken for 30 min. Then, I put the washed catalyst back in the column.
Because protons are released during the hydrodehalogenation (HDH) reaction
(Urbano and Marinas, 2001), it is possible that the pH of the solvent would drop over
time, and this could potentially affect the solvent’s interactions with the catalyst
(Alonso et al., 2002). Therefore, I spiked 0.2 mL of ammonium hydroxide into the
reservoir each time I changed the soil, i.e., every 7 days. Then, I monitored the pH of
the solvent in the reservoir. At the starting time, the pH was around 10.2 and at the end
of each run, it was around 7.20.
5.2.5. Evaluation of system performance
The contaminant extraction rate, contaminant reaction rate, contaminant mass percent
conversion, and apparent first-order rate constant, k, were calculated to evaluate the
closed-loop system for TeCB-contaminated soil and for PCP-contaminated soil.
Page 90
78
By comparing the concentrations upstream and downstream of the soil column, I
can determine the flux of the contaminants from the contaminated soil to the solvent.
The contaminant extraction rate (mass/time) is equal to the solvent flow rate
(volume/time) multiplied by the concentration difference (mass/volume) across the soil
column.
Rextract = Qsolvent (Ccolumn out – Ccolumn in) (5.1)
Also, by comparing the concentrations upstream and downstream of the catalyst
column, I can calculate the rate of contaminant destruction. The contaminant reaction
rate (mass/time) is equal to the solvent flow rate (volume/time) multiplied by the
concentration difference (mass/volume) across the catalyst column.
Rreact = Qsolvent (Creactor in – Creactor out) (5.2)
The measured concentrations were used to calculate the contaminant mass that
was extracted from the soil and catalytically destroyed. The contaminant mass percent
(%) conversion in each set of treatment was calculated by following equation.
% conversion = ( ) ( )
( )100×
×+×
×+×−×+×
solvent
solvent
insoil
soil
in
solvent
solvent
outsoil
soil
outsolvent
solvent
insoil
soil
in
VCMC
VCMCVCMC (5.3)
Page 91
79
where, soil
inC (mg/kg) is an initial contaminant concentration in soil, soilM (kg) is mass of
soil, solvent
inC (mg/L) is an initial contaminant concentration in solvent at the beginning of
each set, and solventV (L) is volume of solvent.
Apparent first-order rate constant, k, was calculated with the assumption of ideal
plug flow reactor using equation (5.4),
( )−
=
t
CCk EI /ln
(5.4)
where, k is apparent first-order rate constant, CI (mg/L) is a concentration entering the
Pd reactor, CE (mg/L) is a concentration exiting Pd reactor, and −
t (min) is the solvent
residence time. The solvent residence time can be calculated by equation (5.5)
Q
nVft =
−
(5.5)
where, f is fraction occupied by catalyst, n is the column porosity, V is the volume of
catalyst reactor, and Q is the flow rate. f was about 0.33 and n was 0.42. Therefore,
calculated −
t was 3.5 min.
Page 92
80
5.2.6. Control experiment
Control experiments of the closed-loop system for the treatment of TeCB and PCP were
conducted to confirm that no loss of contaminants occur due to volatilization. A desired
concentration of TeCB or PCP was amended in the reservoir. The soil column was
empty, but 10 g of the Pd catalyst was packed in the catalyst column. Nitrogen gas was
used instead of hydrogen gas and its pressure was 10 psig. The other operating
conditions were the same as shown in Table 5.1. A sample was taken from the reservoir
daily and the control experiments were run for 5 days.
The results of control experiments for TeCB and PCP are shown in Fig. 5.2. For
the TeCB control, around 0.6 mg/L of TeCB disappeared within 1 day, but then very
similar concentrations of TeCB were observed for the remaining time. For the PCP
control, a similar trend was observed as shown in TeCB control. Around 0.2 mg/L of
PCP decreased within 1 day, and then PCP concentrations remained similarly.
Therefore, it is suspected that the mass of TeCB or PCP dropped within 1 day was
adsorbed onto the catalyst surfaces. Overall, the mass balance suggests that the system
was properly constructed to verify the performance of REACH technology.
5.3. Results and discussion
5.3.1. Contaminant extraction rate
Fig. 5.3 (A) and (B) show the results for the contaminant extraction rate over time of
TeCB-contaminated soil and PCP-contaminated soil, respectively. Note that, every
Page 93
81
Time (day)
0 1 2 3 4 5
Co
nc
. (m
g/L
)
0.0
0.5
1.0
1.5
2.0
2.5TeCB
PCP
Fig. 5.2 - Control experiments for closed-loop flow-through system: Symbols represent
concentrations in reservoir; solvent pumped at 1.0 mL/min; soil column was empty; N2
gas used instead of H2 gas.
Page 94
82
week, I changed soil columns. That means treated soil was taken out and contaminated
soil was repacked in the column. I found that contaminant extraction rate was high
within 1-day period and, afterward, it decreased in both TeCB- and PCP-contaminated
soils. My observed results have good agreement with previous findings of
pentachlorophenol with water-ethanol mixtures (Khodadoust et al., 1999), PAHs with
water miscible co-solvents (Khodadoust et al., 2000), and non-aqueous phase liquids
(NAPLs) mass with chemical flushing (US EPA, 2006a). When contaminated soil was
packed newly, the same trend of extraction rate was observed. It is concluded that
extraction of both target contaminants from soils was almost completed by a 50:50
mixture of water and ethanol within 2 days.
A central feature of this research is that the solvent can be re-used in a closed
loop, as illustrated in Fig. 5.1. It was expected that the solvent might degrade over time,
losing some of its ability to extract contaminants from the contaminated soil. In a span of
7 weeks, I found that the solvent extraction ability was not degraded over time in either
TeCB- or PCP-contaminated soil, as shown Fig. 5.3. I tested 1.4 kg of contaminated soil
(0.2 kg of soil treated in every week) over 7 weeks. I have not verified whether an effect
between solvent extraction longevity and catalytic destruction of contaminants is
present. Since final products such as benzene and phenol are accumulated, the solvent
might eventually need to be replaced. However, it was shown that the solvent had
enough contaminant extraction ability from soil in the closed-loop system and it could be
re-used under my experimental conditions and periods. Future work may consider the
limits of solvent longevity.
Page 95
83
Time (day)
0 10 20 30 40 50
Rex
tra
ct (m
g/d
ay)
0
20
40
60
80
100
120
140set #1
set #2
set #3
set #4
set #5
set #6
set #7
Time (day)
0 10 20 30 40 50
Re
xtr
ac
t (m
g/d
ay)
0
20
40
60
80
100
120
140
160set #1
set #2
set #3
set #4
set #5
set #6
set #7
Fig. 5.3 - Contaminant extraction rate over time: (A) TeCB-contaminated soil, (B) PCP-
contaminated soil.
(B)
(A)
Page 96
84
5.3.2. Contaminant reaction rate
Fig. 5.4 shows the TeCB reaction rate by Pd-catalyzed HDH in the closed-loop system.
TeCB concentrations at sample port #2, which are entering the Pd reactor, and at sample
port #3, which are exiting Pd reactor, are shown in Fig. 5.4 (A). Based on these TeCB
concentrations, TeCB reaction rates are calculated using the equation (2), and shown in
Fig. 5.4 (B). Note that each set was run for 1 week and fresh contaminated soil was
repacked. Higher reaction rates, which are degradation of TeCB mass per time, were
observed in early stages of each set and the rates decreased over time. This observation
can be explained as follows. Higher concentrations of TeCB in the solvent were present
in early stages when the mass of TeCB extracted from soil was high. As TeCB was
destroyed by the Pd-catalytic HDH reaction, the available mass of TeCB in the solvent
was depleted. Therefore, less mass of TeCB is adsorbed and reacted on the catalyst
surface, even though almost the same active sites of the catalyst are present, assuming
that deactivation rate of catalyst can be ignored in span of 1 week. This explanation is
also supported by the apparent first-order rate constant, k, over time as shown Fig. 5.5.
In each set, a higher value of k is detected in early stages and the value decreased
afterward.
The results of the PCP reaction rate by Pd-catalyzed HDH in the closed-loop
system are shown in Fig. 5.6 (A) and (B), which indicate PCP concentrations in samples
and calculated reaction rate, respectively. A similar trend of reaction rate for PCP was
observed as shown for TeCB. However, lower reaction rates were observed for PCP than
Page 97
85
Time (day)
0 10 20 30 40 50
Te
CB
co
nc
. (m
g/L
)
0
2
4
6
8
10
12
14
16
18
20conc. entering Pd reactor
conc. exiting Pd reactor
Time (day)
0 10 20 30 40 50
Rre
ac
t (m
g/d
ay)
0
5
10
15
20
25set #1
set #2
set #3
set #4
set #5
set #6
set #7
Fig. 5.4 - TeCB reaction rate by Pd-catalyzed hydrodehalogenation in closed-loop
system.
(B)
(A)
Page 98
86
Time (day)
0 10 20 30 40 50
k (
min
-1)
0.0
0.1
0.2
0.3
0.4
0.5
0.6
0.7
0.8set #1
set #2
set #3
set #4
set #5
set #6
set #7
Fig. 5.5 – Apparent first-order rate constant (k) over time in TeCB-contaminated soil.
Page 99
87
for TeCB. This is consistent with results from Chapters IV and V. Fig. 5.6 does not
indicate properly the effect of catalyst regeneration on the PCP destruction rate. This
will be explained in the next section.
5.3.3. Contaminant mass destruction
Table 5.2 shows the contaminant mass percent (%) conversion in each set of REACH
treatments. For TeCB treatment, over 90% mass conversion was observed for the first 6
soil batches using only 10 g of catalyst and 2.2 L of solvent. However, the mass
conversion decreases as the amount of contaminated soil treated increases. For the last
soil batch, the TeCB mass conversion was down to 76%. This is likely due to the
deactivation of catalyst.
The change of TeCB concentration in the reservoir over time is shown in Fig. 5.7
(A). The TeCB concentration increased as mass of TeCB was extracted from soil, and
then decreased as the process performed in each set. Over the span of 7 weeks, the TeCB
concentration remaining in the reservoir increased. This observation can also be
explained by the deactivation of catalyst.
The mass conversion of PCP in the contaminated soil was somewhat lower than
that of TeCB as shown in Table 5.2. However, in general, the PCP mass conversion was
acceptably high, over 80% for each soil batch. The catalyst regeneration with dilute
hypochlorite was performed before starting set #6. After that, the conversion increased
considerably. This suggests that the catalyst slowly deactivated during treatment,
causing the decrease of contaminant mass conversion over time.
Page 100
88
Time (day)
0 10 20 30 40 50
PC
P c
on
c. (m
g/L
)
0
5
10
15
20
25
30
35conc. entering Pd reactor
conc. exiting Pd reactor
Time (day)
0 10 20 30 40 50
Rre
ac
t (m
g/d
ay)
0
5
10
15
20set #1
set #2
set #3
set #4
set #5
set #6
set #7
Fig. 5.6 - PCP reaction rate by Pd-catalyzed hydrodehalogenation in closed-loop
system.
catalyst
regenerated
catalyst regenerated
(B)
(A)
Page 101
89
Table 5.2 - Contaminant mass percent (%) conversion in each set of REACH treatment
Set # TeCB conversion (%) PCP conversion (%)
1 96.5 83.2
2 98.7 90.5
3 98.3 90.2
4 96.5 83.7
5 94.4 81.8
6 90.0 93.2 *
7 76.1 86.1
Note: each set operated for 7 days. * Catalyst was regenerated before starting set #6.
Page 102
90
Time (day)
0 10 20 30 40 50
Te
CB
co
nc
. in
re
se
rvo
ir (
mg
/L)
0
1
2
3
4set #1
set #2
set #3
set #4
set #5
set #6
set #7
Time (day)
0 10 20 30 40 50
PC
P c
on
c. in
re
se
rvo
ir (
mg
/L)
0
2
4
6
8
10set #1
set #2
set #3
set #4
set #5
set #6
set #7
Fig. 5.7 - Contaminant concentrations in reservoir over time: (A) TeCB contaminated
soil, (B) PCP contaminated soil.
(A)
catalyst regenerated (B)
Page 103
91
For each soil batch treated, a higher concentration of PCP in the reservoir was
observed in the early stage and then the concentration decreased as the HDH process
performed, as shown in Fig. 5.7 (B). This trend was also shown for TeCB-contaminated
soil. The effect of catalyst regeneration on the PCP mass destruction is also confirmed in
Fig. 5.7 (B). The concentrations in the reservoir dropped after catalyst regeneration.
5.3.4. Intermediate products of PCP
Fig. 5.8 shows the gas chromatograms of samples taken from reservoir at the end of each
treatment for all 7 soil batches. In Chapter IV, I proposed the sequential reductive
transformation of PCP, converting to tetrachlorophenols (TeCPs), to trichlorophenol
(TCPs), and finally to phenol. The peaks for TeCPs and TCPs are located between peaks
for internal standard and PCP. It is confirmed that the final product of PCP degradation
by Pd-catalyzed HDH in the solvent is phenol, not any other chlorinated phenols, since
TeCPs and TCPs were not significantly accumulated in the solvent stream.
I did see some accumulation of TeCP and TCP over the span of 7 weeks. The
peak areas of TeCP and TCP increased up to the first 5 batches. However, after catalyst
regeneration , those areas decreased at the end of set #6 and increased again at the end of
set #7. However, the amount of TeCP and TCP appears very small compared to the
amount of PCP treated. Therefore it appears the conversion of PCP was almost
completely to phenol, with only small accumulation of TeCP or TCP.
Page 104
92
Fig. 5.8 - Gas chromatograms of samples taken from the reservoir of the system for the
treatment of PCP-contaminated soil at the end of each treatment for all 7 soil batches.
set #1
set #2
set #3
I.S. PCP
I.S.
PCP
I.S.
PCP
2,3,4,6-TeCP
2,3,4,6-TeCP
2,3,4,6-TeCP
2,3,4-TCP
Page 105
93
Fig. 5.8 – continued.
set #4
set #5
I.S. PCP
2,3,4,6-TeCP
2,3,4,6-TeCP
2,3,4-TCP
PCP I.S.
2,3,4-TCP
2,3,6-TCP
I.S.
2,3,4-TCP
PCP set #6
Page 106
94
Fig. 5.8 – continued.
I.S.
2,3,4-TCP 2,3,4,6-TeCP
PCP
set #7
Page 107
95
5.4. Conclusions
The REACH system was built in a lab-scale and tested on soils contaminated by 1,2,4,5-
tetrachlorobenzene (TeCB) and by pentachlorophenol (PCP). In my lab system, I pump
1 mL/min solvent (a 50:50 mixture of water and ethanol) through a packed bed of
contaminated soil for the extraction step, and then through a packed bed of catalyst for
the hydrodehalogenation step. In a span of 7 weeks, I treated 1.4 kg of contaminated
soil: 7 columns of contaminated soil, each with 0.2 kg soil, each treated for 1 week. This
was accomplished with just 10 g of catalyst and 2.2 L of solvent. Extraction of both
TeCB and PCP mass from soils was almost completed within 2 days using the solvent.
Higher reaction rate, which is mass removed per time, was observed for TeCB than for
PCP. The efficiency of the REACH process slowly decreased as the amount of
contaminated soil subjected to treat increased. This is either because by-products build
up in the solvent stream or because the catalyst slowly deactivates. Regeneration of the
catalyst by treatment with dilute hypochlorite appears to restore the overall efficiency of
the process.
In a period of 7 weeks, it appeared that the solvent maintained its ability to
extract contaminants from soil under our experimental conditions in this research.
However, it is possible that the solvent might degrade over time, losing some of its
ability to extract contaminants from the contaminated soil. If this occurs, the solvent
would need to be replaced. This represents a periodic operating cost that would need to
be factored into the overall cost for this technology. Therefore, the longevity of the
Page 108
96
solvent’s ability to extract contaminants from the soil should be investigated in the
future.
Page 109
97
CHAPTER VI
STUDIES OF THE REACH TECHNOLOGY IN CONTINUOUS MODE:
A FIELD SOIL CONTAMINATED BY PENTACHLOROPHENOL
6.1. Introduction
Pentachlorophenol (PCP) is an important contaminant that was widely used as a
fungicide and insecticide in commercial wood treatment (Cirelli, 1978). The soil
contaminated by PCP in an actual field site, in which operations of pressure-treating
posts and other lumber ceased in the mid-1980’s, was supplied by an environmental
consulting company in Orlando, FL. The contaminated site is named the Post & Lumber
Preserving Co. (PLP) site, after the company that operated there.
I tested the applicability and performance of the remedial extraction and catalytic
hydrodehalogenation (REACH) technology for the treatment of the PCP-contaminated
field soil. In particular, I have done three different types of experiments: (1) REACH
system with field-contaminated soil for 11 days, (2) REACH system with no soil, used
solvent, and fresh catalyst for 24 hours to test how rapidly the catalyst deactivates, and
(3) Regeneration experiments to determine if the catalyst activity can be regained after
deactivation.
A rapid extraction of PCP from the soil by a 50:50 mixture of water and ethanol
was observed although the contaminant had aged over 20 years. However, fast catalyst
Page 110
98
deactivation was shown, resulting in no hydrodehalogenation (HDH) reaction for
destroying PCP. I have not yet identified the chemical causing the catalyst deactivation
in the extractant solvent. The deactivated catalyst was successfully regenerated with
dilute hypochlorite solution. However, the catalyst deactivation rate was so fast as to
prevent successful dechlorination of PCP. Therefore, the application of REACH
technology to treat the PCP-contaminated soil was ceased. In this Chapter, proposed
research is discussed to make up for REACH’s failing to treat the contaminated field
soil.
6.2. Contaminated soil
6.2.1. Site description and history
The Post & Lumber Preserving Co. site (PLP) is on the northeast corner of State Road
12 and Post Plant Road, approximately 3.5 miles east of Quincy, Florida, near
Tallahassee. PLP is an 18-acre facility in an area that is predominantly rural residential,
pasture and undeveloped land (Florida Department of Environmental Protection, 2006).
Beginning in 1948, this 18-acre site was used for pressure-treating posts and
other lumber using both wolmanizing salts (copper, chromium, and arsenic) and
pentachlorophenol (PCP). The PCP wood preservative was made of a 5 to 7 percent
solution of PCP with diesel fuel and/or water. Pressure treating operations ceased in the
mid-1980’s. Currently the site is used only as a distribution center for pressure-treated
posts and lumber (Florida Department of Environmental Protection, 2006).
Page 111
99
6.2.2. Field soil handling and analysis
The soil contaminated by PCP at the PLP site was supplied by an environmental
company in Orlando, FL. The field soil was collected from 15 to 30 cm below land
surface and stored in an amber glass bottle. When the soil arrived in our laboratory, I
air-dried the soil over night under room temperature. The air-dried field soil was mixed
thoroughly to get homogeneous conditions and kept in the amber glass bottle until
subjected to experiments.
A part of the field soil was shipped to the Soil, Water, and Forage Testing
Laboratory at Texas A&M University for characterization. The textural class of the soil
was a sandy clay loam with 58% sand, 22% silt, and 20% clay. The fraction of organic
matter and pH were 2.11% and 6.5, respectively. The concentration of sulfur was 23
mg/kg but the species of sulfur were not reported.
In order to know the initial concentration of PCP in the field soil, a shaker
extraction method was conducted. Detailed procedures of the method were described in
Chapter II. The PCP concentration was determined to be 416±11 mg/kg. From the
values, I know that the soil was severely contaminated by PCP.
6.3. REACH operation with field-contaminated soil
6.3.1. Experimental method
The treatment of field soil at the PLP site using the closed-loop system was conducted.
Detailed specifications for the system and operating conditions for the closed-loop
Page 112
100
treatment can be found in Chapter V. The only exception here is that the flow rate of
solvent was 0.5 mL/min, not 1 mL/min. My intention was to give more residence time in
particular for the extraction step since the soil had aged more than 20 years, so that much
longer time is expected to extract PCP from the soil.
6.3.2. Results and discussion
Contaminant extraction rate
It has been widely reported that the extractability of contaminants, such as PAHs, from
soil changes with the age of the contamination (Northcott and Jones, 2001). Since the
PCP had aged over 20 years at the PLP site, I expected that extraction would be done at
a slow rate, resulting in a limiting step for the overall performance of REACH.
The PCP extraction rate from the field-contaminated soil with a 50:50 mixture of
water and ethanol is shown in Fig. 6.1. The highest extraction rate was observed within
the first 2 days, consistent with the laboratory-contaminated soil in Chapter V. Three
days after starting the operation, no or negligible extraction was observed. This
observation could be either because equilibrium between soil and solvent is reached or
because equilibrium is not reached, but the rate is very slow. An average concentration
of PCP in the reservoir between 3 days and 11 days is 31.1±3.1 mg/L, which
corresponds to about 85% of PCP mass in the field soil. It is suspected that the last 15%
of PCP mass was still sorbed on the soil because the experimental system was
constructed well to prevent any loss of mass due to volatilization or sorption.
Page 113
101
Time (day)
0 2 4 6 8 10 12
Re
xtr
ac
t (m
g/d
ay)
-20
0
20
40
60
80
100
Fig. 6.1 - PCP extraction rate from PLP field contaminated soil over time in closed-loop
system.
Page 114
102
During the operation of the REACH system, the color of the solvent turned
yellow as it circulated through the system. I suspect that the solvent extracted some
chemical agent(s) from the soil that imparted the color. It may be some form of natural
organic matter (NOM) which has yellow to black in color (Sparks, 1995).
Contaminant reaction rate
The PCP reaction rate by Pd-catalyzed HDH in the closed-loop system is shown in Fig.
6.2. Severely low reaction rates were observed, as shown in Fig. 6.2. Initially, some
reaction rate is observed. However, I am not sure that the disappearance of PCP is due to
the HDH reaction, because PCP could be adsorbed onto the Pd/Al2O3 surface. Recall
that the amount of catalyst used was 10 g. Two days after starting the REACH system
for the field-contaminated soil, almost no PCP reaction (degradation) by Pd-catalyzed
HDH was observed. As shown in Fig. 6.2, regeneration of the Pd catalyst with 20 mM
sodium hypochlorite solution was conducted on day 8 and 9, separately. The
regeneration procedures were performed as introduced in Chapter V. However, no
improvement of reaction rate was observed. Even after all catalyst was replaced with
fresh catalyst on day 10, the concentration of PCP remained almost constant.
Based on these observations, I suspected that the field soil contains some
chemical that rapidly deactivates the Pd catalyst when it is extracted. Therefore, I
conducted experiments to determine how fast the deactivation occurs, and if the
deactivation is reversible. Theses are described below.
Page 115
103
Time (day)
0 2 4 6 8 10 12
Rre
ac
t (m
g/d
ay
)
-5
0
5
10
15
20
Fig.6.2 - PCP reaction rate by Pd-catalyzed HDH in closed-loop system for the treatment
of PLP field-contaminated soil: * catalyst was regenerated with a dilute hypochlorite, **
fresh catalyst was repacked.
*
* **
Page 116
104
6.4. Catalyst deactivation experiment
6.4.1. Experimental method
Following attempted treatment by REACH, a deactivation experiment was conducted to
know how fast the Pd catalyst deactivates over time. I assumed that the chemicals
responsible for deactivation are present in the solvent in the reservoir after the operation
of closed-loop system for the field soil for 11 days, since disappearance of PCP was
negligible during the period. The soil column was taken out from the system and “fresh”
Pd catalyst was packed in the catalyst column. The solvent that had been used for
extraction of the field soil was still in the reservoir and was employed for this
deactivation experiment. The system was turned on and samples were collected both at
the sample port entering the catalyst column and at the sample port exiting the catalyst
column at desired time intervals. Since two 0.5 µm filters were installed in the system,
collected samples were not filtered further for gas chromatography (GC) analysis.
Detailed analytical method is described in Chapter IV.
6.4.2. Results and discussion
As seen in Fig. 6.3, no HDH reaction was observed, indicating that the deactivation of
Pd catalyst occurred very fast. Therefore, the REACH technology is not technically
applicable to remediate the contaminated soil from the PLP site since the catalyst loses
its activity quickly within 1 hr and the catalyst regeneration process may not be done
frequently enough to maintain activity.
Page 117
105
Time (hr)
0 5 10 15 20 25
Rre
ac
t (m
g/d
ay)
-5
0
5
10
15
20
Fig. 6.3 - Pd catalyst deactivation rate with solvent used for extraction of contaminated
soil at PLP site.
Page 118
106
As seen in Fig. 6.3, there was essentially no HDH activity even after just 1 hr of
operation. It was not clear if the catalyst deactivated in that time, or if perhaps some
chemical agent was hindering the HDH reaction through a different mechanism (e.g.,
competition for surface sites). To determine this and to determine if the catalyst could be
regenerated, I conducted a regeneration experiment as described below.
6.5. Catalyst regeneration experiment
6.5.1. Experimental method
Two different batch-mode experiments were conducted with and without catalyst
regeneration with a dilute sodium hypochlorite solution.
I took out from the REACH reactor the deactivated catalyst which had been used
for 1 day since all catalyst was replaced with fresh catalyst on day 10, from the closed-
loop system. The mass of the deactivated catalyst was measured and found to be more
than 10 g. Half of it was regenerated with 20 mM sodium hypochlorite solution
following the procedures described in Chapter V. The other half was not regenerated.
A 50:50 mixture of water and ethanol was prepared freshly. 100 mL of the 50:50
mixture of water and ethanol was added into a 250-mL batch-type reaction bottle and a
desired volume of 1000 mg/L stock solution of PCP was spiked into the bottle. Then, the
solution in the bottle was stirred using a magnetic stirrer for 2 min and 1 mL of sample
was taken to quantify an initial concentration of PCP. After that, I added the half of
catalyst not regenerated into the reaction bottle and placed it in the hydrogenation
Page 119
107
reactor. A batch type HDH reaction was performed as described in Chapter IV. Then, for
the half of catalyst that was regenerated, a batch type HDH reaction was carried out
following the method described above.
6.5.2. Results and discussion
The results of HDH reaction with and without catalyst regeneration are shown in Table
6.1 indicating that the Pd catalyst could recover its activity by regeneration with 20 mM
hypochlorite solution.
The results also indicate that the catalyst had, in fact, been deactivated by
exposure to the used solvent. The catalyst that had no regeneration exhibited no activity,
suggesting that it was completely deactivated by 1 day of operation in the REACH
system. Therefore, the lack of activity seen in Fig. 6.3 is probably due to rapid
deactivation, not due to any other reasons.
6.6. Hypothesis for catalyst deactivation
I hypothesize that Pd catalyst active surface sites were coated with chemicals that were
extracted from the field-contaminated soil, resulting that no HDH reaction of PCP was
observed in the closed-loop system. The deactivated catalyst could be regenerated with a
dilute hypochlorite solution. However, regeneration did not lead to removal of PCP in
the REACH system, because the chemicals causing the deactivation were still present
Page 120
108
Table 6.1 - Pd catalyst activity with and without regeneration with a dilute hypochlorite
solution
Initial PCP concentration
(mg/L)
1 hr HDH reaction later
(mg/L)
Without catalyst regeneration 4.55 4.53
With catalyst regeneration 4.19 0.45
Page 121
109
and rapidly deactivated the catalyst again. Hypotheses regarding the catalyst deactivation
are discussed below.
6.7. Summary and proposed research for the future
The REACH process was applied for treating the highly PCP contaminated field soil
from the PLP site. PCP in the soil was extracted rapidly with a 50:50 mixture of water
and ethanol. However, no HDH reaction was observed because Pd catalyst lost its
activity quickly, probably caused by chemicals extracted simultaneously from the field
soil with PCP. The deactivated catalyst can be regenerated with a dilute hypochlorite
solution. The experimental result of Pd catalyst deactivation rate indicated that the
deactivation was done within an hour. Therefore, The REACH technology is not
applicable to treat the field-contaminated soil unless the fast deactivation of catalyst is
resolved.
Here, I propose two category of research in the future to improve the REACH
technology. First, we need to identify which chemical(s) in the solvent cause the
deactivation of Pd catalyst. The suspected chemicals for Pd catalyst deactivation are
sulfide species and NOM. It was reported that Pd catalyst lost its performance by coating
with sulfide species in groundwater (Lowry and Reinhard, 2000). It was also presented
that NOM can affect adversely photocatalytic reactions (Doll and Frimmel, 2005) and
zero-valent iron performance (Klausen et al., 2003).
Page 122
110
The second proposed line of research is aimed to eliminate or minimize the
catalyst deactivation, which was found in this current research and mainly caused that
the REACH performance was inactive for treating PCP in the field soil. A different
catalyst, which is less susceptible to deactivation compared to Pd catalyst, can be
employed in the REACH technology. Alternative catalysts exist such as platinum or
nickel. The HDH reaction performance and economic analysis for overall cost should be
studied as well. Another method is to avoid the contact of Pd catalyst with deactivation-
causing chemicals by constructing the closed-loop system shown in Fig. 6.4.
A basic idea of the process shown in Fig. 6.4 is that HHOCs extracted from
contaminated soil in the solvent are stripped by N2/H2 mixed gas and then are
dehalogenated in Pd catalyst reactor. The destruction of halogenated compounds by
catalytic HDH reaction in gas phase has been studied previously (Ordonez et al., 2002;
Jujjuri et al., 2006).
Page 123
111
Fig. 6.4 - Schematic diagram for the REACH technology with avoiding contact of
solvent with Pd catalyst.
N2/H2 gas
Pd catalyst
Soil Stripper/
reservoir
Release
Page 124
112
CHAPTER VII
CONCLUSIONS AND RECOMMENDATIONS
7.1. Conclusions
The results shown in this research demonstrate that the remedial extraction and catalytic
hydrodehalogenation (REACH) technology has the potential to be a significant
improvement over existing techniques, such as solvent extraction, to remediate the soil
contaminated by halogenated hydrophobic organic compounds (HHOCs). In the
REACH system proposed here, HHOCs are catalytically dehalogenated and transformed
to less or non-toxic forms. The findings of this research provide basic knowledge about
the extraction of HHOCs from contaminated soils, Pd-catalyzed hydrodehalogenation
(HDH) reaction in different water-ethanol mixtures, and operating parameters of HDH
reaction. In addition, a model closed-loop system of the REACH technology was built at
the laboratory scale, and that system can provide field engineers with a schematic system
design idea when this technology is applied to treat HHOCs in soil and other waste
streams in practice. The specific findings of this research are as follows:
Page 125
113
7.1.1. Dependence on the key parameters for the extraction of selected HHOCs from
soil
• Mixtures of water and ethanol are shown to be good candidates to extract
TeCB and PCP from contaminated soil.
• Solvent composition strongly affects the contaminant extraction efficiency.
At least 50% ethanol (by volume, before mixing) in the solvent is required to
effectively remove TeCB from contaminated soil. PCP could be effectively
extracted by mixtures with as little as 33% ethanol.
• The ratio of solvent volume to soil mass has very little effect on the
extraction efficiency of both TeCB and PCP under my experimental
conditions.
• For short extraction times, the mass of TeCB or PCP extracted is very
sensitive to extraction time. However, for long extraction times, the removal
efficiency is not sensitive to extraction time, suggesting an approach to
equilibrium.
• During continuous closed-loop operation, contaminants could be removed
from 200 g of soil within about 2 days at a solvent flow rate of 1-5 mL/min.
7.1.2. Dependence on the key parameters for the Pd-catalyzed HDH of selected
HHOCs
• TeCB and PCP can be completely and reductively dehalogenated at room
temperature under mild hydrogen pressure (0.21 MPa) in batch mode.
Page 126
114
• For both TeCB and PCP treatment, the rate of the Pd-catalyzed HDH reaction
is a strong function of the solvent composition and the concentration of
catalyst in the reactor. The Pd-catalyzed HDH rate decreases as the fraction
of ethanol increases in the solvent. The Pd-catalyzed HDH rate increases as
the concentration of catalyst increases in the reaction vessel.
• The effect of solvent composition appears to be caused by its effect on the
partitioning of the target contaminants between the liquid and solid phases.
• The initial concentration of TeCB might or might not affect the apparent
HDH rate constant under my experimental conditions.
• The hydrogen pressure supplied into the reaction bottle did not affect the
degradation rate of PCP as long as the pressure was above some critical level.
• The kinetics of the TeCB disappearance are apparently first-order.
• A mathematical model was developed based on a Langmuir-Hinshelwood
model to describe first-order kinetics of TeCB under various operational
conditions.
• TeCB was converted stoichiometrically to benzene by the Pd-catalyzed HDH
reaction. Low concentrations of a transient intermediate, 1,2,4-
trichlorobenzene (TCB), were observed. The disappearance of 1,2,4-TCB
was rapid enough that I may consider TeCB is converted directly to benzene.
• The degradation rate of PCP does not follow first-order kinetics, probably
because competition for surface active sites occurs between PCP and
intermediate products which are generated during PCP degradation.
Page 127
115
• The transformation of PCP by Pd-catalyzed HDH reaction in water/ethanol
mixtures occurs sequentially by dehalogenation to tetrachlorophenols, then to
trichlorophenols, then to phenol. .
7.1.3. Demonstration of the REACH technology for a long period of time in a closed-
loop system
The REACH system was built in a lab-scale and tested on soils synthetically
contaminated by TeCB and by PCP in our laboratory. In a span of 7 weeks, 1.4 kg of
contaminated soil was treated: 7 columns of contaminated soil, each with 0.2 kg soil
each treated for 1 week. This work was accomplished with just 10 g of catalyst and 2.2.L
of solvent, which is a 50:50 mixture of water and ethanol.
• Extraction of both TeCB and PCP mass from soils was almost completed
within 2 days using the solvent at a solvent flow rate of 1-5 mL/min.
• Higher reaction rate, which is mass removed per time, was observed for
TeCB than for PCP.
• The efficiency of the REACH process slowly decreased as the amount of
contaminated soil subjected to treat increased. This is either because by-
products build up in the solvent stream or because the catalyst slowly
deactivates.
• Regeneration of the catalyst by treatment with a dilute hypochlorite solution
appears to recover the overall efficiency of the process.
Page 128
116
The REACH process was applied for treating field soil, which was highly
contaminated by PCP and aged over 20 years.
• At least 85% of the PCP in the soil was extracted rapidly with a 50:50
mixture of water and ethanol.
• No HDH reaction was observed because Pd catalyst lost its activity quickly,
apparently because of chemicals extracted simultaneously from the field soil
with PCP.
• The deactivated catalyst could be regenerated with a dilute hypochlorite
solution.
• Pd catalyst was deactivated completely but reversibly within an hour when it
was tested with the solvent that had been used for extraction of the field soil.
7.2. Recommendations for future research
A number of opportunities for future research are recommended here.
• The longevity of the solvent’s ability to extract contaminants from the soil
should be quantified since replacement and disposal of solvent are related to
the overall cost for this technology. It is possible that the solvent might
degrade over time, losing some of its ability to extract contaminants from the
contaminated soil.
• The longevity of catalyst should be tested since it is also associated with the
overall cost of the technology. As shown in this research, the deactivated Pd
Page 129
117
catalyst can be regenerated with a dilute hypochlorite solution. However, the
overall activity of catalyst might slowly decrease as the amount of treated soil
increases.
• Pd catalyst was quickly deactivated for the treatment of the field
contaminated soil. Therefore, it is worthwhile identifying which chemical(s)
in the solvent used for extraction of the field soil cause the deactivation of Pd
catalyst.
• In order to eliminate or minimize the catalyst deactivation in the REACH
system, two topics of research are proposed. The first one is to use a different
catalyst, which is less easily deactivated compared to Pd catalyst. The Second
one is to build a system to avoid the contact of Pd catalyst with the chemicals
that cause deactivation in the solvent stream as shown Fig. 6.4.
Page 130
118
REFERENCES
Alonso, F., Beletskaya, I.P., Yus, M., 2002. Metal-mediated reductive
hydrodehalogenation of organic halides. Chem. Rev. 102, 4009-4091.
Balko, E.N., Przybylski, E., Trentini, F.V., 1993. Exhaustive liquid-phase catalytic
hydrodehalogenation of chlorobenzenes. Appl. Catal. B 2, 1-8.
Bettelheim, F.A., Brown, W.H., March, J., 2001. Introduction to Organic &
Biochemistry. fourth ed. Harcourt, Orlando, FL.
Carberry, J.J., 1976. Chemical and Catalytic Reaction Engineering. McGraw-Hill, New
York, NY.
Cellier, P.P., Spindler, J.F., Taillefer, M., Cristau, H.J., 2003. Pd/C-catalyzed room-
temperature hydrodehalogenation of aryl halides with hydrazine hydrochloride,
Tetrahedron Lett. 44, 7191-7195.
Cirelli, D., 1978. Patterns of pentachlorophenol usage in the United States of America –
an overview. In: Rao K.R. (Ed.), Pentachlorophenol. Plenum Press, New York, pp.
13-18.
Clark, C.J., Rao, P.S.C., Annable, M.D., 2003. Degradation of perchloroethylene in
cosolvent solutions by zero-valent iron. J. Hazard. Mater. 96, 65-78.
Coq, B., Ferrat, G., Figueras, F., 1986. Conversion of chlorobenzene over palladium and
rhodium catalysts of widely varying dispersion. J. Catal. 101 (2), 434-445.
Doll, T.E., Frimmel, F.H., 2005. Removal of selected persistent organic pollutants by
heterogeneous photocatalysis in water. Catal. Today 101, 195-202.
Felis, V., Fouilloux, P., De Bellefon, C., Schweich, D., 1999. Three-step catalytic
detoxification process of wastewater containing chlorinated aromatic compounds:
Experimental results and modeling issues. Ind. Eng. Chem. Res. 38, 4213-4219.
Florida Department of Environmental Protection, 2006. Post & Lumber Preserving
Company. <http://www.dep.state.fl.us/waste/quick_topics/publications/wc/sites
/summary/107.pdf>.
Fogler, H.S., 1999. Elements of Chemical Reaction Engineering, third ed. Prentice-Hall
Inc., Upper Saddle River, NJ.
Page 131
119
Fritsch, D., Kuhr, K., Mackenzie, K., Kopinke, F.D., 2002. Hydrodechlorination of
chloroorganic compounds in ground water by palladium catalysts – Part 1.
Development of polymer-based catalyst and membrane reactor tests. Catal. Today
82, 105-118.
Hoke, J.B., Gramiccioi, G.A., Balko, E.N., 1992. Catalytic hydrodechlorination of
chlorophenols. Appl. Catal. B 1, 285-296.
Imhoff, P.T., Gleyzer, S.N., McBride, J.F., Vancho, L.A., Okuda, I., Miller, C.T., 1995.
Cosolvent-enhanced remediation of residual dense nonaqueous phase liquids:
experiment investigations. Environ. Sci. Technol. 29, 1966-1976.
IPCS INCHEM, 2007. Chemical Safety Information from Intergovernmental
Organizations. <http://www.inchem.org/>.
Jujjuri, S., Ding, E., Hommel, E.L., Shore, S.G., Keane, M.A., 2006. Synthesis and
characterization of novel silica-supported Pd/Yb bimetallic catalysts: Application in
gas-phase hydrodechlorination and hydrogenation. J. Catal. 239, 486-500.
Khodadoust, A.P., Bagchi, R., Suidan, M.T., Brenner, R.C., Sellers, N.G., 2000.
Removal of PAHs from highly contaminated soils found at prior manufactured gas
operations. J. Hazard. Mater. 80, 159-174.
Khodadoust, A.P., Suidan, M.T., Acheson, C.M., Brenner, R.C., 1999. Solvent
extraction of pentachlorophenol from contaminated soils using water-ethanol
mixtures. Chemosphere 38, 2681-2693.
Kilbane, J.J., 1998. Extractability and subsequent biodegradation of PAHs from
contaminated soil. Water, Air, Soil Poll. 104, 285-304.
Klausen, J., Vikesland, P.J., Kohn, T., Burris, D.R., Ball, W.P., Roberts, A.L., 2003.
Longevity of granular iron in groundwater treatment processes: Solution
composition effects on reduction of organohalides and nitroaromatic compounds.
Environ. Sci. Technol. 37, 1208-1218.
Kopinke, F.D., Mackenzie, K., Kohler, R., 2003. Catalytic hydrodechlorination of
groundwater contaminants in water and in the gas phase using Pd/γ-Al2O3. Appl.
Catal. B 44, 15-24.
Korte, N.E., West, O.R., Liang, L., Gu, B., Zutman, J.L., Fernando, Q., 2002. Effect of
solvent concentration on the use of palladized iron for the step-wise dechlorination
of polychlorinated biphenyls in soil extracts. Waste Manag. 22, 343-349.
Page 132
120
Kovenklioglu, S., Cao, Z., Shah, D., Farrauto, R.J., Balko, E.N., 1992. Direct catalytic
hydrodechlorination of toxic organics in wastewater. AIChE J. 38, 1003-1012.
Liljelind, P., Soderstrom, G., Hedman, B., Karlsson, S., Lundin, L., Marklund, S., 2003.
Method for multiresidue determination of halogenated aromatics and PAHs in
combustion-related samples. Environ. Sci. Technol. 37, 3680-3686.
Liu, Y., Yang, F., Yue, P.L., Chen, G., 2001. Catalytic dechlorination of chlorophenols
in water by palladium/iron. Water Res. 35, 1887-1890.
Lowe, D.F., Oubre, C.L., Ward, C.H., 1999. Surfactants and Cosolvents for NAPL
Remediation: A Technology Practices Manual. CRC Press, Boca Raton, FL.
Lowry, G.V., Reinhard, M., 1999. Hydrodehalogenation of 1- to 3-carbon halogenated
organic compounds in water using a palladium catalyst and hydrogen gas. Environ.
Sci. Technol. 33, 1905-1910.
Lowry, G.V., Reinhard, M., 2000. Pd-catalyzed TCE dechlorination in groundwater:
Solute effects, biological control, and oxidative catalyst regeneration. Environ. Sci.
Technol. 34, 3217-3223.
Lowry, G.V., Reinhard, M., 2001. Pd-catalyzed TCE dechlorination in water: Effect of
[H2](aq) and H2-utilizing competitive solutes on the TCE dechlorination rate and
product distribution. Environ. Sci. Technol. 35, 696-702.
McNab, W.W., Ruiz, R., 1998. Palladium-catalyzed reductive dehalogenation of
dissolved chlorinated aliphatics using electrolytically-generated hydrogen.
Chemosphere 37, 925-936.
McNab, W.W., Ruiz, R., Reinhard, M., 2000. In-situ destruction of chlorinated
hydrocarbons in groundwater using catalytic reductive dehalogenation in a reactive
well: Testing and operational experiences. Environ. Sci. Technol. 34, 149-153.
Morales, J., Hutcheson, R., Cheng, I.F., 2002. Dechlorination of chlorinated phenols by
catalyzed and uncatalyzed Fe(0) and Mg (0) particles. J. Hazard. Mater. 90, 97-108.
Mravik, S.C., Sillan, R.K., Wood, A.L., Sewell, G.W., 2003. Field evaluation of the
solvent extraction residual biotreatment technology. Environ. Sci. Technol. 37,
5040-5049.
Murena, F., Gioia, F., 2002. Catalytic hydrotreatment of water contaminated by
chlorinated aromatics. Catal. Today 75, 57-61.
Page 133
121
Northcott, G.L., Jones, K.C., 2001. Partitioning extractability and formation of
nonextractable PAH residues in soil. Compound differences in aging and
sequestration. Environ. Sci. Technol. 35, 1103-1110.
Ordonez, S., Diez, F.V., Sastre, H., 2002. Catalytic hydrodechlorination of chlorinated
olefins over a Pd/Al2O3 catalyst: Kinetics and inhibition phenomena. Ind. Eng.
Chem. Res. 41, 505-511.
Perrone, L., Prati, L., Rossi, M., 1998. Removal of chlorinated organic compounds from
water by catalytic dehydrohalogenation. Appl. Catal. B 15, 241-246.
Pintar, A., Batista, J., Levec, J., Kajiuchi, T., 1996. Kinetics of the catalytic liquid-phase
hydrogenation of aqueous nitrate solutions. Appl. Catal. B 11, 81-98.
Ramakrishnan, V., Ogram, A.V., Lindner, A.S., 2005. Impacts of co-solvent flushing on
microbial populations capable of degrading trichloroethylene. Environ. Health
Persp. 113, 55-61.
Rao, P.S.C., Annable, M.D., Sillan, R.K., Dai, D.P., Hatfield, K., Graham, W.D., Wood,
A.L., Enfield, C.G., 1997. Field-scale evaluation of in situ cosolvent flushing for
enhanced aquifer remediation. Water Resour. Res. 33, 2673-2686.
Schreier, C.G., Reinhard, M., 1995. Catalytic hydrodehalogenation of chlorinated
ethylenes using palladium and hydrogen for the treatment of contaminated water.
Chemosphere 31, 3475-3487.
Schuth, C., Disser, S., Schuth, F., Reinhard, M., 2000. Tailoring catalyst for
hydrodechlorinating hydrocarbon contaminants in groundwater. Appl. Catal. B 28,
147-152.
Schuth, C., Reinhard, M., 1998. Hydrodechlorination and hydrogenation of aromatic
compounds over palladium-on-alumina in hydrogen-saturated water. Appl. Catal. B
18, 215-221.
Siantar, D.P., Schreier, C.G., Chou, C.S., Reinhard, M., 1996. Treatment of 1,2-
dibromo-3-chloropropane and nitrate-contaminated water with zero-valent iron or
hydrogen/palladium catalyst. Water Res. 30, 2315-2322.
Sparks, D.L., 1995. Environmental Soil Chemistry. Academic Press, San Diego, CA.
Speitel, G.E., Closmann, F.B., 1991. Chlorinated solvent biodegradation by
methanotrophs in unsaturated soils. J. Environ. Eng. - ASCE117, 541-548.
Page 134
122
Ukisu, Y., Miyadera, T., 2004. Dechlorination of dioxins with supported palladium
catalysts in 2-propanol solution. Appl. Catal. A 271, 165-170.
Urbano, F.J., Marinas, J.M., 2001. Hydrogenolysis of organohalogen compounds over
palladium supported catalyst. J. Mol. Catal. A 173, 329-345.
US EPA, 1996a. A Citizen’s Guide to Innovative Treatment Technologies for
Contaminated Soils, Sludges, Sediments, and Debris. Publication EPA-542-F-96-
001.
US EPA, 1996b. Test Methods for Evaluating Solid Waste, Physical/Chemical Methods
- SW846, third ed. U.S. Government Printing Office, Washington, DC.
US EPA, 2001. A Citizen’s Guide to Solvent Extraction. Publication EPA-542-F-01-
009.
US EPA, 2006a. Ground Water and Ecosystems Restoration Research: Research on
NAPL Source Zones. <http://www.epa.gov/ada/topics/napl.html>.
US EPA, 2006b. Common Chemicals Found at Superfund Sites. <http://www.epa.gov/
superfund/resources/chemicals.htm>.
Wall, A.J., Stratton, G.W., 1991. Comparison of methods for the extraction of
pentachlorophenol from aqueous and soil systems. Chemosphere 22, 99-106.
Xia, C.H., Xu, J., Wu, W.Z., Luo, Q., Chen, J.P., Zhang, Q., Liang, X.M., 2003.
Catalytic hydrodechlorination of 2,4,4 '-trichloro-2 '-hydroxydiphenylether under
mild conditions. Appl. Catal. B 45, 281-292.
Yang, Z.J., Zia, C.H., Zhang, Q., Chen, J.P., Wu, W.Z., Liang, X.M., Kettrup, A., 2006.
Treatment of PCCDD/Fs and PCBs in fly ash extracts under mild conditions.
Fresen. Environ. Bulletin 15, 86-94.
Yuan, G., Keane, M.A., 2003. Catalyst deactivation during the liquid-phase
hydrodechlorination of 2,4-dichlorophenol over supported Pd: Influence of support.
Catal. Today 88, 27-36.
Page 135
123
VITA
Hun Young Wee was born in Cheongwon, Chungbuk, Republic of Korea. He received a
Bachelor of Engineering degree in environmental engineering from Chungbuk National
University in 1999. He attended Texas A&M University from August 2000 and received
a Master of Science degree and a Ph.D. degree in civil engineering from Texas A&M in
August 2003 and in May 2007, respectively.
Permanent address: 1136-Bongmyung-dong
Hungduk-Gu, Cheongju-City, Chungbuk
Republic of Korea
361-818