Louisiana State University LSU Digital Commons LSU Historical Dissertations and eses Graduate School 1995 Remediation of Contaminated Soils Using a Plant Based Surfactant. Raghava Rao Kommalapati Louisiana State University and Agricultural & Mechanical College Follow this and additional works at: hps://digitalcommons.lsu.edu/gradschool_disstheses is Dissertation is brought to you for free and open access by the Graduate School at LSU Digital Commons. It has been accepted for inclusion in LSU Historical Dissertations and eses by an authorized administrator of LSU Digital Commons. For more information, please contact [email protected]. Recommended Citation Kommalapati, Raghava Rao, "Remediation of Contaminated Soils Using a Plant Based Surfactant." (1995). LSU Historical Dissertations and eses. 6115. hps://digitalcommons.lsu.edu/gradschool_disstheses/6115
Transcript
Louisiana State UniversityLSU Digital Commons
LSU Historical Dissertations and Theses Graduate School
1995
Remediation of Contaminated Soils Using a PlantBased Surfactant.Raghava Rao KommalapatiLouisiana State University and Agricultural & Mechanical College
Follow this and additional works at: https://digitalcommons.lsu.edu/gradschool_disstheses
This Dissertation is brought to you for free and open access by the Graduate School at LSU Digital Commons. It has been accepted for inclusion inLSU Historical Dissertations and Theses by an authorized administrator of LSU Digital Commons. For more information, please [email protected].
Recommended CitationKommalapati, Raghava Rao, "Remediation of Contaminated Soils Using a Plant Based Surfactant." (1995). LSU Historical Dissertationsand Theses. 6115.https://digitalcommons.lsu.edu/gradschool_disstheses/6115
2 LITERATURE R E V IE W ........................................................................... 72.1 General ................................................................................................ 72.2 Surfactants in Remediation.................................................................. 82.3 Colloidal Gas Aphron (CGA) Suspensions ....................................... 132.4 Natural Surfactant (Ritha) .................................................................. 172.5 Bioenhancement in the Presence of Surfactant ................................. 212.6 Test Organic C om pound..................................................................... 232.7 Scope of the Present W o rk .................................................................. 24
4 MATERIALS AND METHODS ............................................................. 274.1 Materials ............................................................................................. 27
4.1.1 Sapindus mukorossi (Ritha) ............................................... 274.1.2 Sodium Dodecyl Sulfate....................................................... 274.1.3 Hexachlorobenzene............................................................... 294.1.4 S o i l ........................................................................................ 294.1.5 Basal Salt M e d ia .................................................................. 294.1.6 Heterotrophic M ed ia ............................................................. 32
4.2 Experimental Methods ....................................................................... 324.2.1 Glassware ............................................................................. 324.2.2 Extraction of Fruit Pericarp into Different Solvents . . . . 324.2.3 Standard Method for Preparation of Natural Surfactant
Solutions ............................................................................. 334.2.4 Surface Tension Measurements .......................................... 344.2.5 Viscosity Measurements....................................................... 344.2.6 Solubility of Hexachlorobenzene in Natural Surfactant
4.2.7 Total Organic C a rb o n ........................................................ 354.2.S Chemical Oxygen Demand ................................................ 364.2.9 Organic N itrogen.................................................................. 364.2.10 p H ........................................................................................ 364.2.11 Absorbance Spectrum for Natural Surfactant Solution . . 374.2.12 Generation of Colloidal Gas A phrons.............................. 374.2.13 Size Distribution of CGA Suspensions ............................ 394.2.14 Stability and Quality of CGA Suspensions...................... 404.2.15 Soil Contamination............................................................ 404.2.16 Desorption of Hexachlorobenzene from S o i l ................... 414.2.170ne Dimensional Soil Flushing E xperim ents................... 414.2.18Bioenhancement Studies Under Aerobic Conditions . . . . 434.2.19 Bioenhancement Studies Under Anaerobic Conditions . . 464.2.20Extraction of Hexachlorobenzene from Aqueous
Surfactant Solutions............................................................ 484.2.21 Extraction of Hexachlorobenzene from Soil ................... 484.2.22Analysis of Hexachlorobenzene on Gas Chromatograph . 494.2.23 Statistical Analysis of the D a ta ......................................... 49
5 RESULTS AND DISCUSSION............................................................... 515.1 Development of Method for Hexachlorobenzene A na ly sis.............. 515.2 Preparation and Characterization of Natural Surfactant................... 54
5.2.1 Natural Surfactant Solutions ............................................... 545.2.2 Chemical Oxygen Demand(COD)....................................... 615.2.3 Total Organic Carbon (TO C )............................................... 625.2.4 Nitrogen and Phosphorous .................................................. 625.2.5 pH . ..................................................................................... 625.2.6 Empirical Form ula ............................................................... 645.2.7 Quantification of Natural Surfactant Using UV
5.3 Generation and Characterization of Colloidal Gas Aphron (CGA)Suspensions..................................................................................... 765.3.1 Size Distribution Param eters............................................... 775.3.2 Size Distribution .................................................................. 785.3.3 Effect of Natural Surfactant Concentration on the CGA
Size Distribution.................................................................. 825.3.4 Effect of Electrolytes .......................................................... 865.3.5 Comparison with CGAs Generated from Commercial
Surfactants.......................................................................... 885.3.6 Stability of CGA Suspensions ............................................ 90
v
5.4 Solubility of Hexachlorobenzene in Surfactant Solutions........ 965.4.1 HCB Solubility in Natural Surfactant Solutions .............. 965.4.2 Effect of Natural Surfactant Sterilization on the Solubility
of H C B ........................................................................1025.4.3 HCB Solubility in SDS Solutions ..........................................1035.4.4 Comparison Between Natural Surfactant Solutions and
5.5.1 Desorption Studies with Natural Surfactant Solutions . . . I l l5.5.2 Desorption Studies with SDS Solutions....................... 1155.5.3 Comparison Between Natural Surfactant and SDS
Solutions ................................................................................ 1195.6 Application of Natural Surfactant Solutions to Soil Flushing . . . . 119
5.6.1Flushing of Soils Contaminated to Different Levels ofH C B ..............................................................................120
5.6.2 Comparison Between CGA Suspensions and Natural Surfactant Solutions..................................................... 127
5.6.3 Effect of Surfactant Concentration.....................................1295.6.4 Pressure Build-up Across the Soil C olum ns.................... 1305.6.5 Effect of Alternating the Flushing Media with Water . . . 133
5.7 Bioenhancement in the Presence of Natural Surfactant Solutions . . 1395.7.1 Aerobic Bioenhancement Studies.................................. 140
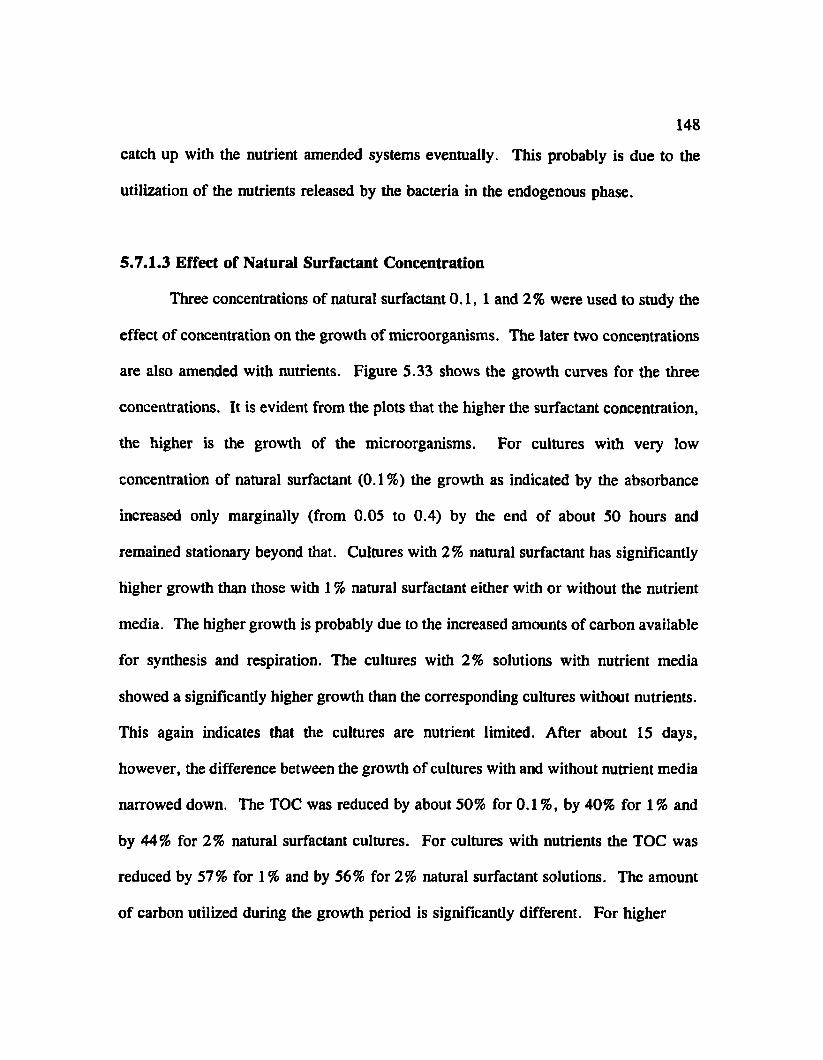
5.7.1.1 Effect of Hexachlorobenzene............................. 1425.7.1.2 Effect of Nutrients ................................................. 1455.7.1.3Effect of Natural Surfactant Concentration . . . . 148
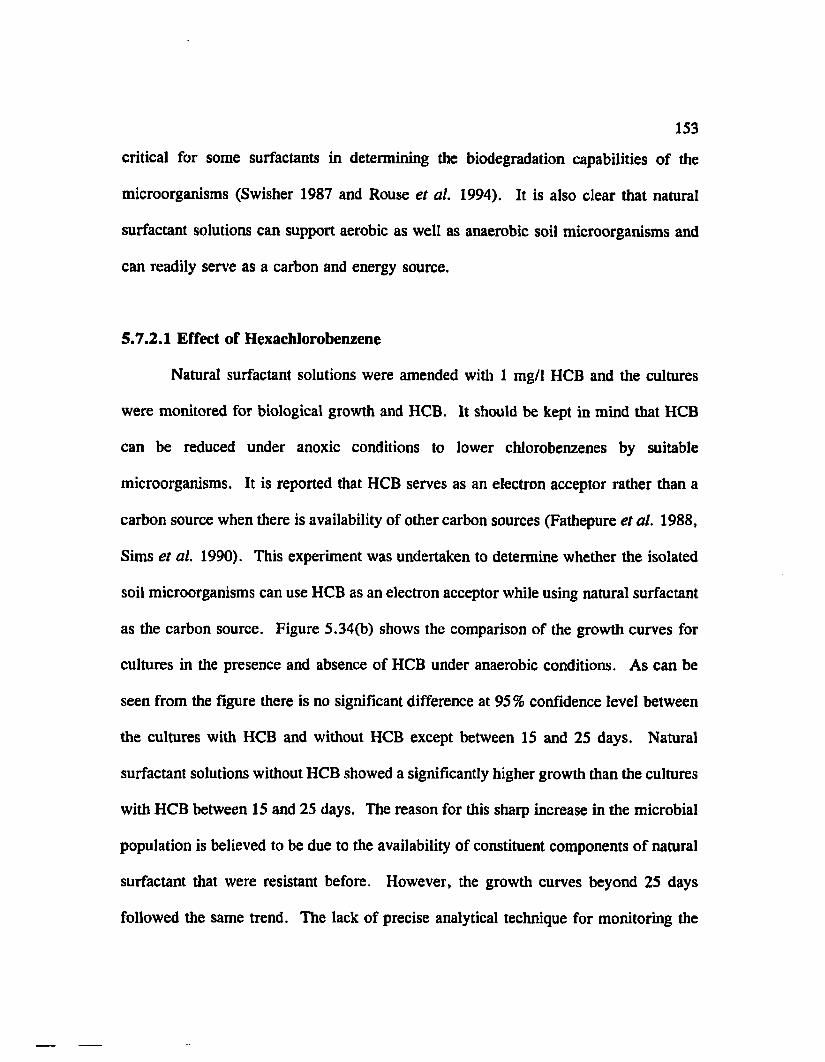
5.7.2 Anaerobic Bioenhancement Studies ....................................... 1505.7.2.1 Effect of Hexachlorobenzene ................................ 1535.7.2.2 Effect of Nutrients .................................................1555.7.2.3Effect of Natural Surfactant Concentration . . . . 157
VITA .........................................................................................................................187
vi
LIST OF TABLES
Table 4.1: Properties of the Surfactant, Sodium Dodecyl Sulfate.................. 28
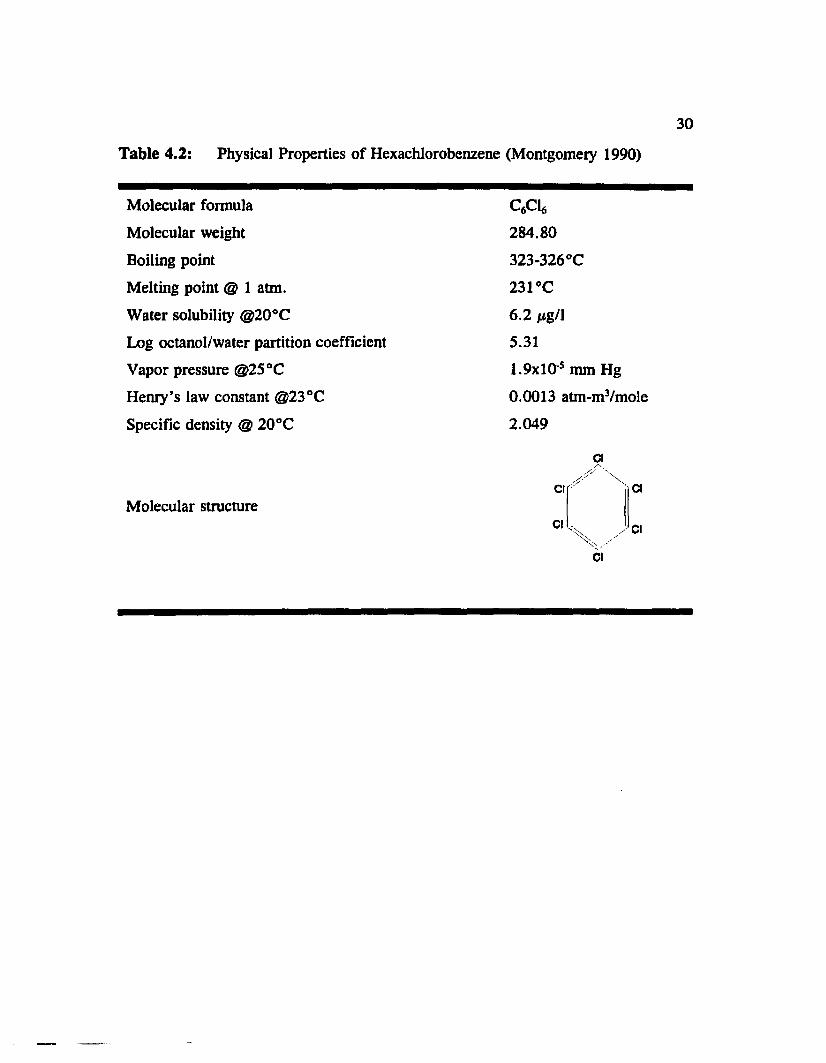
Table 4.2: Physical Properties of Hexachlorobenzene (Montgomery 1990)................................................................................................................. 30
Table 4.3: Physical and Chemical Characteristics of the S o i l ........................ 31
Table 4.4. Treatments Used in the Aerobic Bioenhancement Studies 45
Table 4.5. Treatments Used in the Anaerobic Bioenhancement Studies . . . 47
Table 5.1: Recovery of Hexachlorobenzene from Natural SurfactantSolutions.......................................................................................... 53
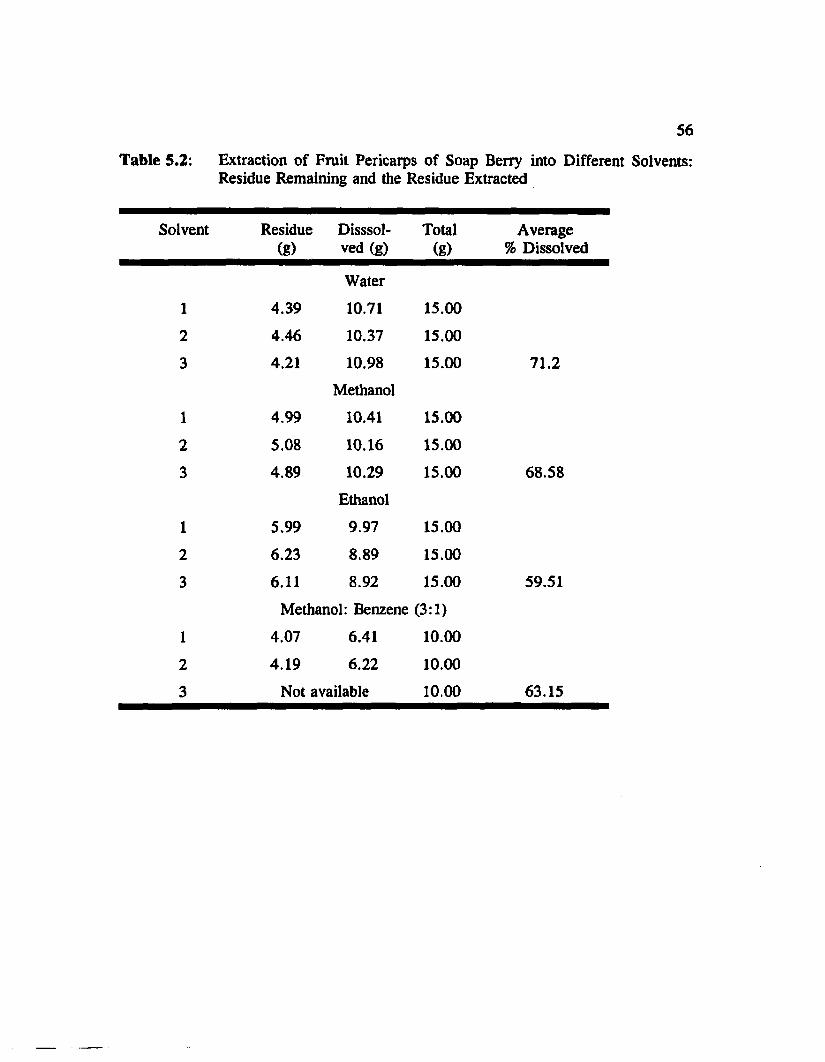
Table 5.2: Extraction of Fruit Pericarps of Soap Berry into DifferentSolvents: Residue Remaining and the Residue E x tracted 56
Table 5.3. Comparison of the Size Distribution of CGAs Generated withNatural Surfactant and Commercial Surfactants (Chaphalkar,1994) 91
Table 5.4: Comparison of Continuous and Alternate Flushing ........................ 136
vii
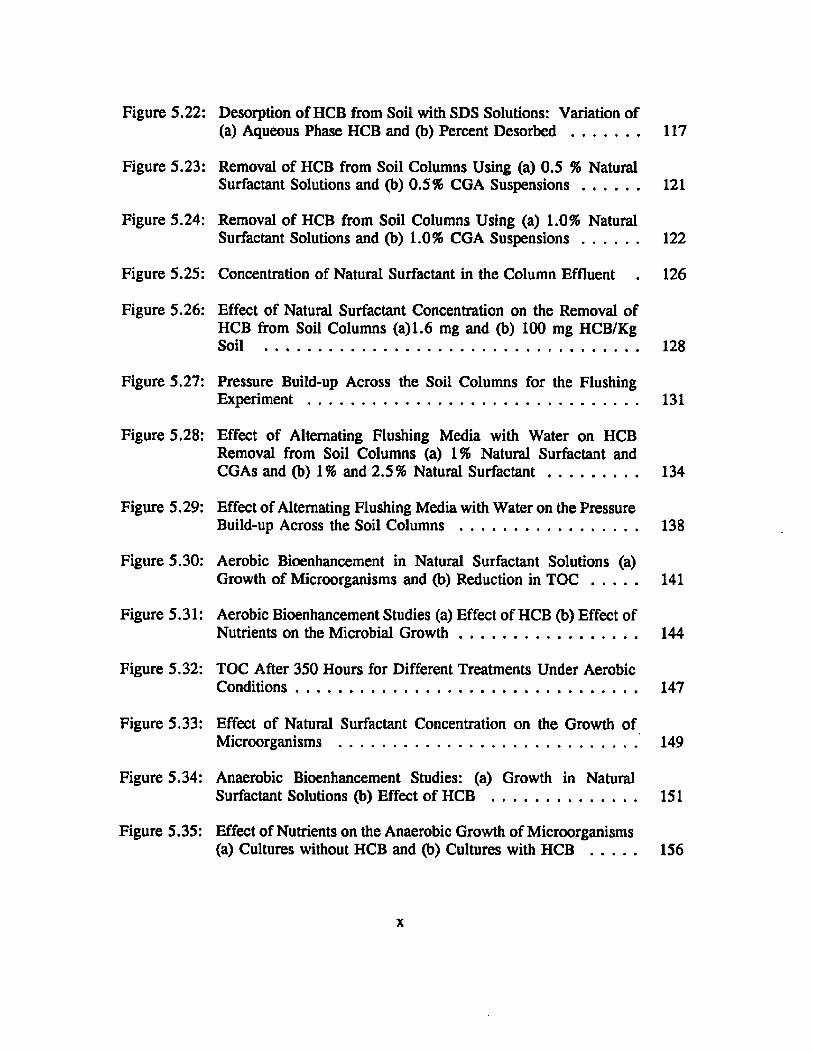
LIST OF FIGURES
Figure 2.1 : Structure of (a) Air Bubble, (b) Soap Bubble and (c) ColloidalGas A phron ..................................................................................... 14
Figure 2.2: Photograph of the (a) Tree Sapindus Mukurossi and (b) theFruits ............................................................................................. 18
Figure 4.1: Schematic Diagram of the CGA Generator ................................... 38
Figure 4.2: Schematic Diagram of the One Dimensional Soil ColumnFlushing Experiment ..................................................................... 42
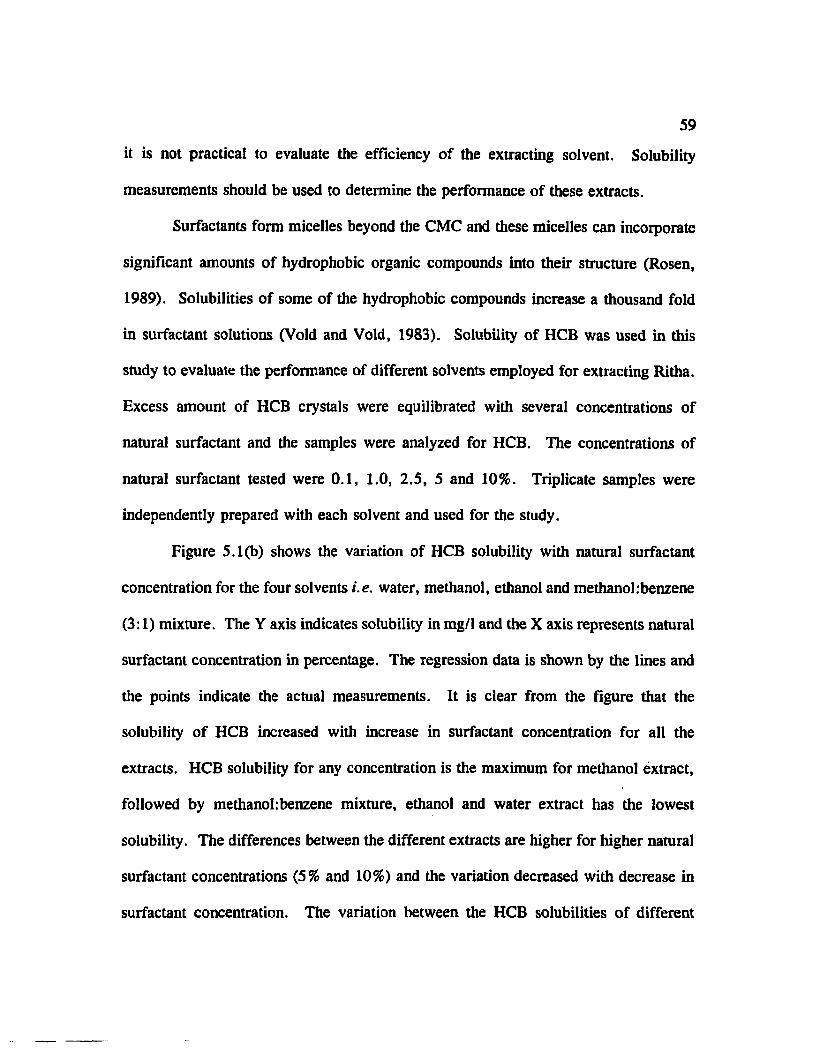
Figure 5.1 : Variation of (a) Surface Tension and (b) HCB Solubility withConcentration for Water, Methanol and Ethanol Extracts . . . . 58
Figure 5.2 : Variation of pH with Concentration for Natural SurfactantSolutions........................................................................................... 63
Figure 5.3 : Absorption Spectra for Natural Surfactant Solutions of SeveralConcentrations ................................................................................ 67
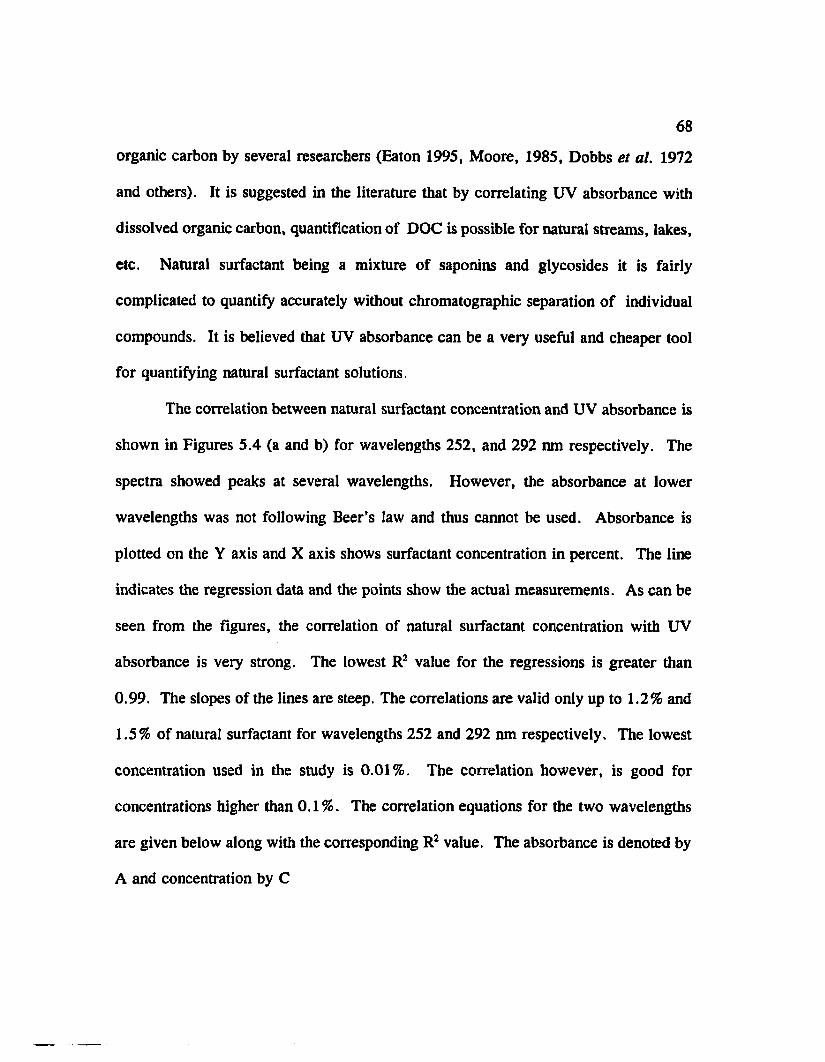
Figure 5.4 : Correlation Between Natural Surfactant Concentration andAbsorbance at (a) 252 nm and (b) 292 nm ................................. 69
Figure 5.5 : Absorption Spectra for Sterile and Non-Sterile Natural Surfactant Solutions at (a) 0.5% and (b) 1.5%Concentration.................................................................................. 71
Figure 5.6 : Determination of CMC of Natural Surfactant Solutions by (a)Surface Tension and (b) Viscosity Measurements .................... 74
Figure 5.7: Typical Size Distribution Curves for CGA SuspensionsGenerated with (a) 0.1%, (b) 0.5%, and (c) 1.0% Natural Surfactant Solu tions........................................................................ 79
Figure 5.8: Typical Variation in Size Distribution with Time for CGASuspensions Generated with (a) 0.5% and (b)1.0% Natural Surfactant Solutions........................................................................ 81
viii
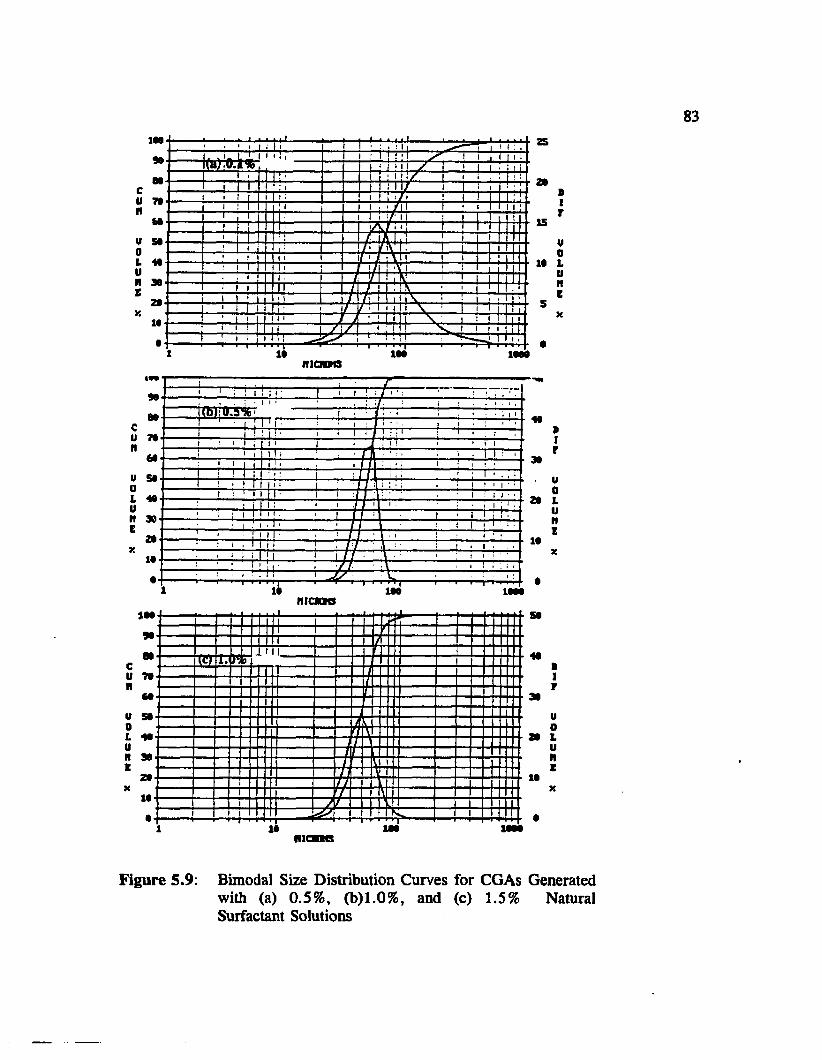
Figure 5.9: Bimodal Size Distribution Curves for CGAs Generatedwith (a) 0.5%, (b)1.0%, and (c) 1.5% Natural Surfactant Solutions....................................................................... 83
Figure 5.10: Effect of Natural Surfactant Concentration on the (a) 10Percentile and (b) 90 Percentile Size of CGA Suspensions . . . 84
Figure 5.11: Effect of Natural Surfactant Concentration on the SampleLoading Parameter (Dv) ............................................................... 87
Figure 5.12: Effect of the Presence of Salt on the (a) 10 Percentile and (b) 90 Percentile Size of CGAs Generated with 1 % Natural Surfactant Solution ........................................................................................... 89
Figure 5.13: Typical Curve for Drainage of Liquid from CGA Suspensions . 93
Figure 5.14: Comparison of (a) the Stability and (b) Quality of CGA Suspensions Generated with Several Concentrations of Natural Surfactant and SDS ..................... 94
Figure 5.15: Solubility of HCB in Natural Surfactant Solution: (a) Variation up to 25% and (b) Correlation Between Solubility and Concentration ................................................................................ 98
Figure 5.16: Effect of Steam Sterilization and Filter Sterilization on theSolubility of HCB in Natural Surfactant Solutions ................. 104
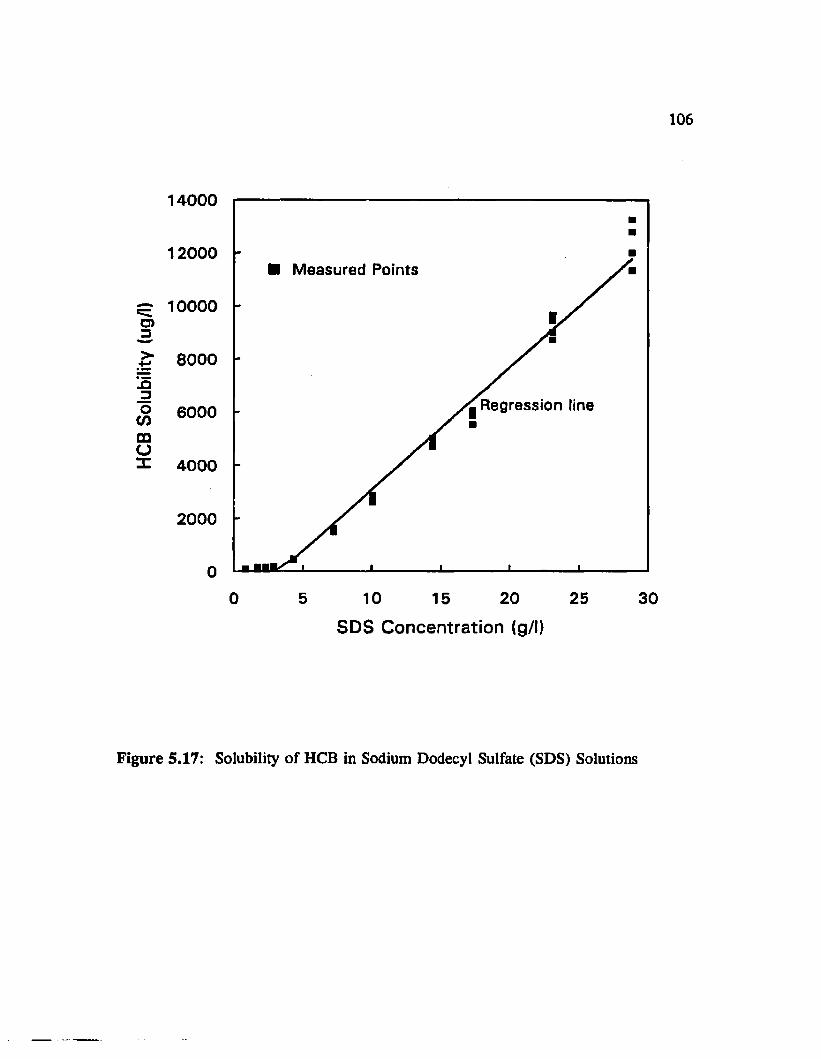
Figure 5.17: Comparison of HCB Solubilizing Capacities of Natural Surfactant Solutions and Commercial Surfactants as Reported by Jafvert et al. (1994)....................................................................... 106
Figure 5.18: Solubility of HCB in Sodium Dodecyl Sulfate (SDS) Solutions...................................................................................................... 109
Figure 5.19: Desorption of HCB from Soil with Natural Surfactant Solutions: Variation of (a) Aqueous Phase HCB and (b) Percent Desorbed
112
Figure 5.20: Desorption Isotherms for HCB in Natural Surfactant Solutionsin Non-Linear Form .................................................................. 114
Figure 5.21: Desorption Isotherms for HCB (a) Langmuir and (b) Freundlich 116
ix
Figure 5.22: Desorption of HCB from Soil with SDS Solutions: Variation of(a) Aqueous Phase HCB and (b) Percent Desorbed ................. 117
Figure 5.23: Removal of HCB from Soil Columns Using (a) 0.5 % NaturalSurfactant Solutions and (b) 0.5% CGA Suspensions.............. 121
Figure 5.24: Removal of HCB from Soil Columns Using (a) 1.0% NaturalSurfactant Solutions and (b) 1.0% CGA Suspensions.............. 122
Figure 5.25: Concentration of Natural Surfactant in the Column Effluent . 126
Figure 5.26: Effect of Natural Surfactant Concentration on the Removal ofHCB from Soil Columns (a) 1.6 mg and (b) 100 mg HCB/Kg Soil ............................................................................................. 128
Figure 5.27: Pressure Build-up Across the Soil Columns for the FlushingExperiment .................................................................................. 131
Figure 5.28: Effect of Alternating Flushing Media with Water on HCBRemoval from Soil Columns (a) 1% Natural Surfactant and CGAs and (b) 1% and 2.5% Natural Surfactant...................... 134
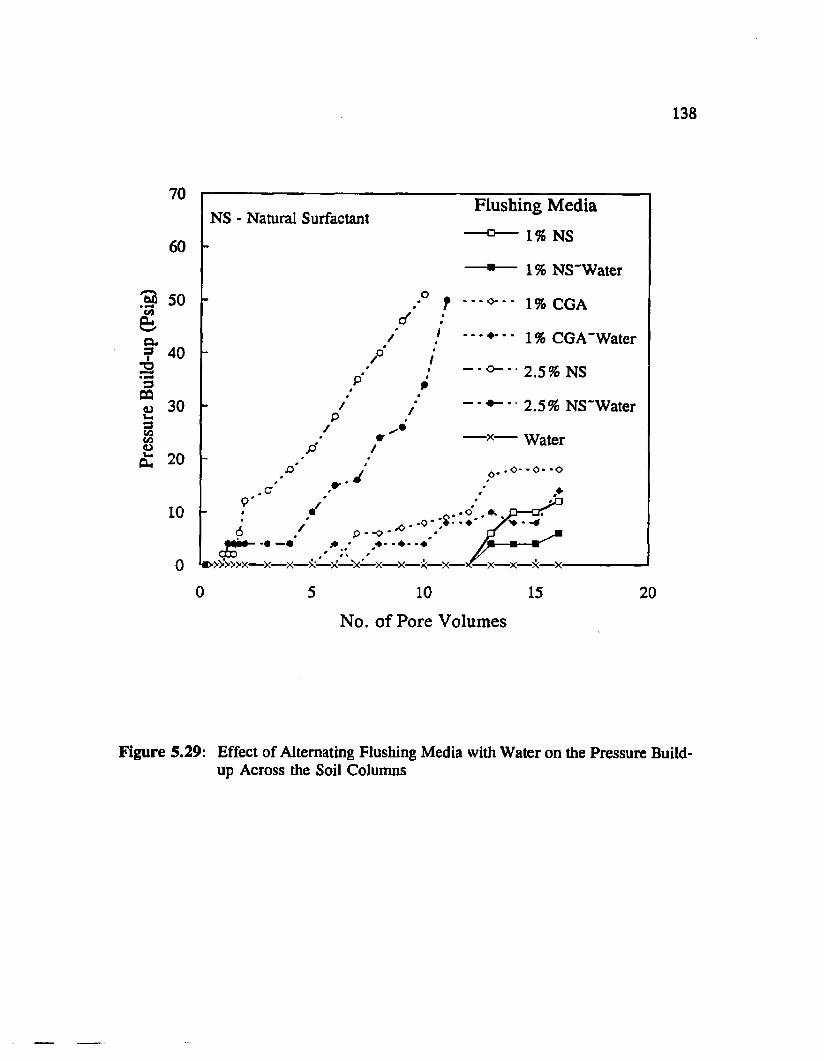
Figure 5.29: Effect of Alternating Flushing Media with Water on the PressureBuild-up Across the Soil Columns ............................................ 138
Figure 5.30: Aerobic Bioenhancement in Natural Surfactant Solutions (a)Growth of Microorganisms and (b) Reduction in T O C 141
Figure 5.31: Aerobic Bioenhancement Studies (a) Effect of HCB (b) Effect ofNutrients on the Microbial G row th ............................................ 144
Figure 5.32: TOC After 350 Hours for Different Treatments Under AerobicConditions..................................................................................... 147
Figure 5.33: Effect of Natural Surfactant Concentration on the Growth ofMicroorganisms .......................................................................... 149
Figure 5.34: Anaerobic Bioenhancement Studies: (a) Growth in NaturalSurfactant Solutions (b) Effect of HCB .................................... 151
Figure 5.35: Effect of Nutrients on the Anaerobic Growth of Microorganisms(a) Cultures without HCB and (b) Cultures with HCB ........... 156
x
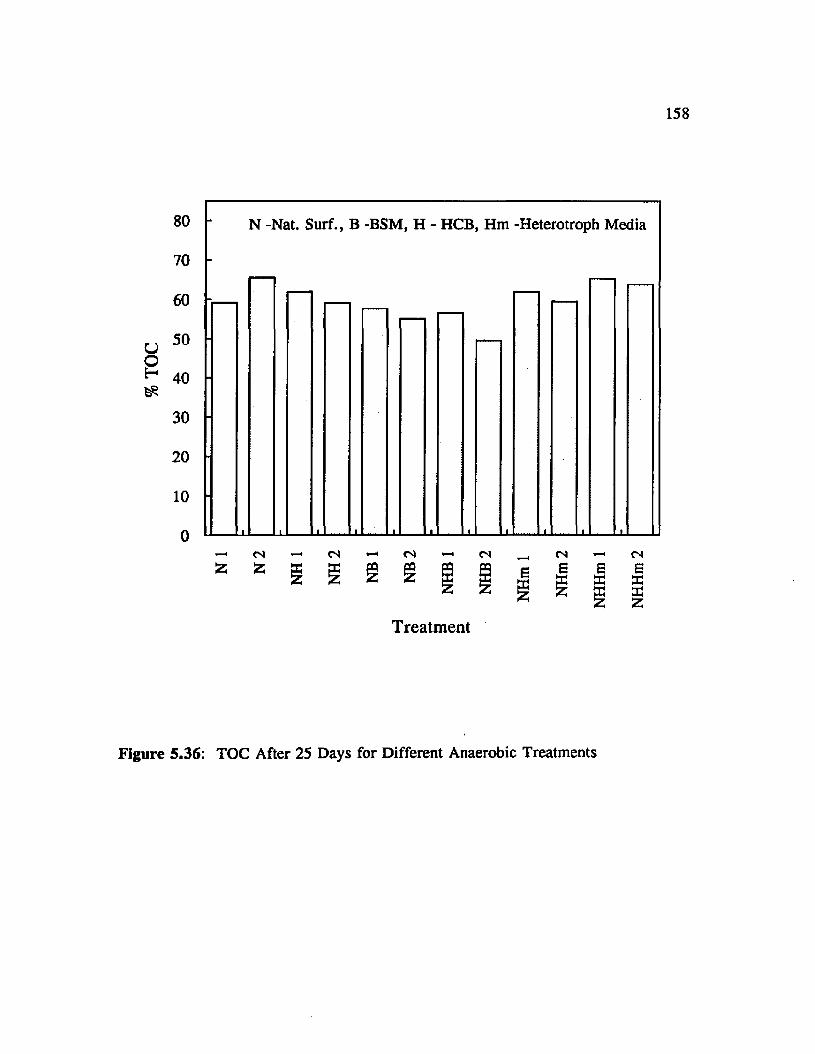
Figure 5.36: TOC After 25 Days for Different Anaerobic Treatments . . . . 158
Figure 5.37: Effect of Natural Surfactant Concentration on the AnaerobicGrowth of Microorganisms ....................................................... 159
ABSTRACT
A plant based surfactant extracted from fruit pericarps of Sapindus mukurossi
(Ritha) is employed for the first time to investigate remediation of contaminated soils.
A method for preparing natural surfactant solutions was developed and the solutions
were characterized followed by generation and characterization of colloidal gas aphron
(CGA) suspensions produced with these solutions. The variation of hexachlorobenzene
(HCB) solubility with natural surfactant solutions was estimated and desorption of HCB
from soils was investigated with batch and one-dimensional column experiments.
Bioenhancement of soil microorganisms in natural surfactant solutions was studied
under both aerobic and anaerobic conditions.
The empirical formula for natural surfactant solutions was found to be
(C26H3iOio)n with a critical micelle concentration (CMC) of 0.1%. CGA suspensions
generated from natural surfactant have (i) comparable size distribution characteristics,
(ii) more stability and (iii) lower gas fraction than those generated with commercial
surfactants. Natural surfactant concentrations beyond 1.5% were not suitable for
generating CGAs due to the low quality of the suspensions. Solubility of HCB in
natural surfactant solutions increased linearly with surfactant concentration beyond the
CMC. The mass of dry Ritha powder required to solubilize 1 mg of HCB in one liter
was found comparable to several commercial surfactants. Natural surfactant solutions
were able to desorb HCB up to 90% of the HCB solubility in the respective solutions
in batch studies. Natural surfactant solutions performed more efficiently than CGA
suspensions of similar concentration in recovering HCB from one dimensional soil
columns, with removals as high as 80% of the solubility of the respective solutions.
HCB recovery also increased with increasing surfactant concentration. However,
natural surfactant concentrations beyond 2.5% developed a high pressure drop across
the soil columns and resulted in termination of the experiment. Natural surfactant
solutions supported microbial growth and degraded to a considerable degree under both
oxygen rich and anoxic conditions. The presence of a chlorinated organic compound,
HCB, did not affect the growth and did not undergo any transformations under both
aerobic and anaerobic conditions. Significantly higher growth in nutrient amended
cultures indicate that the mictrobial populations may be nutrient limited.
CHAPTER 1
INTRODUCTION
Contamination of subsurface soils and groundwater formations is a pervasive
environmental problem that has proven to be extremely difficult to remediate. Early
efforts at groundwater clean-up were characterized as being costly, time consuming and
ineffective (Knox et al. 1984). There are about 30,000 potentially hazardous waste
sites in United States and 1208 of these sites are included on the Superfund, National
Priority List (US EPA 1988, and Olsen and Kavanaugh 1993). CERCLA, enacted
in 1980 by the US Congress, authorizes EPA to identify and clean-up the abandoned
hazardous waste sites. Conventional "pump and treat" technologies are among the
most widely used systems for the remediation of contaminated groundwater. However,
these systems require a long time to make significant reductions in the quantity of
organic contaminants (Mackay and Cherry 1989). The removal of hydrophobic
organic compounds (HOCs) from contaminated soils is handicapped by their very low
solubility in water and the high interfacial tension (Hunt and Sitar 1988). In recent
years there has been dramatic increases in the number of technologies being promoted
for subsurface remediation. Many of the technologies represent simple innovations of
existing procedures (Kim and Gee 1993).
When surfactants are used with the existing "pump and treat" systems, the
performance may be enhanced to a significant level. The surface activity of the
surfactants comes from their amphiphilic structure, meaning that their molecules
contain one soluble and one insoluble moiety. There are several classes of surfactants,
1
namely anionic, cationic, non-ionic, and zwitterionic, with both positive and negative
charges. The surfactant molecules tend to concentrate at the interfaces and thus lower
the interfacial tension considerably. Another very fundamental property of surfactants
is the formation of aggregates known as micelles at concentrations beyond the critical
micelle concentration (CMC). The two very important applications of surfactants are
(1) solubilization of contaminants in surfactant micelles and (2) mobilization of residual
liquids by reduction of the capillary forces trapping the liquid droplets in the aquifer
porous medium. Several researchers proposed their use in the remediation of the
abandoned hazardous waste sites (Ellis et al. 1985, Nash 1987, Gannon et al. 1989,
Abdul etal. 1990, Clarke et al. 1991, Edwards et al. 1991, Fountain et al. 1991, Liu
etal. 1991, Abdul etal. 1992, Palmer and Fish 1992, Darji 1993, Kommalapati 1994
and others). Cationic surfactants tend to adsorb to soil significantly and thus are not
very suitable for remediation (Peters et al. 1992). The cationic surfactants can
however be used to modify the aquifer material and thus contain the contaminants
(Burris and Antworth 1992). Anionic surfactants and non-ionic surfactants generally
do not undergo significant adsorption (Sabatini et al. 1992, and Liu et al. 1992).
Moreover the anionic surfactants can be recovered and reused (Gannon et al. 1989).
Several synthetic surfactants are being used for remediation of subsurface soils
at this time. Large quantities of these surfactants are being used in these processes,
and frequently the surfactant in question is toxic and recalcitrant to biodegradation.
Also the production of these chemicals produce by-products which has to be disposed
off safely. The surfactants left in the subsurface may influence the biodegradation of
the organic compounds significantly for better or worse (Laha and Luthy 1991, 1992,
Breuil et al, 1980, Oberbremer et al. 1990, Rouse et al. 1994, and others).
Surfactant interactions with bacterial cells also seem to be important (Swisher 1987,
and Rouse et al. 1994). Surfactant recycle is now being investigated in laboratories
and a technology is yet to be developed for complex wastes at the actual hazardous
waste sites (Gannon et al. 1989, Underwood etal. 1993a, 1993b, 1995, and Abdul et
al. 1992). Although researchers have conducted a number of encouraging laboratory
studies, none of the field studies have been highly successful (Nash, 1987, Fountain
et al. 1991, Abdul et al. 1992, West and Harwell 1992). One of the main reasons
for the failure of soil flushing by surfactants is that the surfactants clog the porous
media, making the process less efficient.
There is a need for better alternatives such as natural surfactants and
biosurfactants which are produced by plants and microorganisms, respectively. One
of the plant based natural surfactants derived from Sapindus mukurossi , commonly
known as Soap Nut or Ritha in the Indian sub-continent, seems to have a great
potential in remediation of contaminated soils (Mandava 1994). This plant is grown
in tropical and subtropical regions of Asia. The dry powder from the fruit pericarp
of this tree is extracted into water and is used as a detergent to wash hair and delicate
fabric such as wool and also as folk medicine. Even though an appreciable amount of
work has been done on isolating the saponin fraction and identification of the
individual chemical compounds of this fruit extract, none has been done to explore its
application to soil remediation, which is very much warranted. This research is
focussed on the use of a plant based natural surfactant (Ritha) for remediation of
contaminated subsurface soils.
Another innovative technology that has been shown to have potential for in-situ
soil flushing is the use of microfoam or Colloidal Gas Aphron (CGA) suspensions,
which are generated from surfactant solutions (Fugate 1984, Longe 1989, Roy et al.
1992b, Daiji 1993, Kommalapati 1994). CGA suspensions consist of 65% gas by
volume and therefore form a low density fluid. These bubbles do not coalesce easily
and are remarkably different from conventional soap bubbles in their stability and flow
through properties (Sebba, 1982). Two important considerations in the application of
CGA suspensions are: i) their colloidal size, resulting in a large surface area to volume
ratio and ii) the existence of a double film of surfactant encapsulating the gas that
retards the coalescence of the bubbles. The structure, fundamental properties and
possible applications of CGAs have been extensively studied by Sebba (1971, 1982),
Sebba and Barnett (1981), Longe (1989) and Chaphalkar (1994). The main application
of CGA suspensions are in three areas: (1) flotation (2) soil flushing and (3) in situ-
bioremediation. CGA suspensions can be employed for separating hydrophobic
organic compounds from aqueous waste streams, and they are found to be more
effective than conventional sparged air or solvent sublation (Chaphalkar et al. 1994).
Soil flushing of residual non aqueous phase liquids and other hydrophobic organic
compounds with CGA suspensions has been very promising ( Longe 1989, Roy et al.
1992, Darji 1993, and Kommalapati, 1994). CGA suspensions are able to mobilize
colloids from the soil matrix since air-water interface in motion is very effective in
transporting colloids in a porous media (Wan and Wilson 1992). CGA suspensions can
also be used to transport engineered microorganisms into the subsurface to enhance the
in-situ biodegradation of in the contaminated subsurface soils (Michelsen et al. 1984,
Michelsen et al. 1988 Jackson and Roy 1995). In addition, CGA suspensions can be
employed to transport nutrients and oxygen along with the microorganisms (Michelsen
1988).
This dissertation is directed at studying the application of a plant based natural
surfactant for remediation of contaminated soils. Solutions made from the fruit
pericarps of Sapindus mukurossi, commonly known as Ritha are used in this research.
This is accomplished by a series of four tasks. A method is developed for preparing
surfactant solutions from dry powder, and the properties such as critical micelle
concentration (CMC), empirical formula are determined. Solubilization of hydrophobic
organic compounds by natural surfactant solutions is studied and compared with
commercial surfactants. CGA suspensions are generated using natural surfactant
solution, and the size distribution and stability of the suspensions are studied. The
application of surfactant solutions and CGA suspensions to soil flushing of
contaminated soils is investigated. Bioenhancement of soil microorganisms in the
presence of natural surfactant solutions under both aerobic and anoxic conditions is
evaluated. The effect of a chlorinated organic compound on the bioenhancement of
soil microorganisms is also appraised.
The organization of the dissertation is in traditional book style. Chapter 1 gives
the introduction to the problem. Chapter 2 reviews the literature on the application of
The organization of the dissertation is in traditional book style. Chapter 1 gives
the introduction to the problem. Chapter 2 reviews the literature on the application of
surfactants for remediation of contaminated soils followed by application of colloidal
gas aphron suspensions. The role of surfactants in the biodegradation of hydrophobic
organic compounds is also reviewed. The test compound, hexachlorobenzene, is
reviewed subsequently. Finally the scope of the present work is outlined. Chapter 3
lists the objectives of the dissertation. Chapter 4 describes the materials and methods.
Chapter 5 deals with the results and discussion. The results are separated into 4 sub
sections, (1) Preparation and characterization of natural surfactant solutions; (2) The
study of colloidal gas aphron suspensions generated from natural surfactant solutions;
(3) Application of natural surfactant solutions to soil flushing; and (4) Bioenhancement
in the presence of natural surfactant solutions. Chapter 6 lists the conclusions of the
study followed by recommendations for further work in Chapter 7.
CHAPTER 2
LITERATURE REVIEW
2.1 General
Since its inception in 1986, the Superfund Innovative Technology Evaluation
(SITE) program had demonstrated 44 technologies through 1992 (US EPA 1993). Kim
and Gee (1993) made an excellent review on the available technologies for hazardous
waste treatment. Conventional pump and treat technology has been the most widely
used treatment system for the remediation of aquifers (U.S. General Accounting
Office, 1986). The contaminated groundwater is extracted and treated at the surface.
The treated water may then be returned to the aquifer or discharged to surface water
bodies (Mercer et al. 1990). It is very well known at this time that the pump and treat
systems require long periods of time to make any significant reductions in the quantity
of contaminants associated with both the liquid and solid phases of the subsurface
matrix (Mackay and Cherry, 1989, Palmer and Fish 1992, Hoffman, 1993, and
others). Macdonald and Kavanaugh (1994) in their recent review reported that at 8 of
the 77 sites for which data was available, the clean-up goals were achieved using the
pump and treat systems. The report also reviewed the available innovative
technologies, some of which are modifications of the existing pump and treat systems.
Chemical enhancements which can improve the rate of removal of contaminants from
the subsurface can be a very economical alternative (Palmer and Fish 1992).
Surfactants have been widely recommended as a class of chemicals that can increase
the rate of removal of contaminants from the aquifers by solubilizing significant
amounts of the contaminants (Ellis et al. 1985, Nash 1987, Kile and Chiou 1989,
Gannon et al. 1989, Abdul et al 1991, Clarke et al. 1991, Edwards et al. 1991, Liu
et al. 1991, and others). They can also be useful in removing non-aqueous phase
liquids from aquifers by decreasing the interfacial tension between the contaminant and
water (Fountain et al. 1991, Ang and Abdul 1991, Darji 1993, Kommalapati 1994 and
others).
2.2 Surfactants in Remediation
The word surfactant is a contraction of the descriptive phrase, "surface active
agent". Surfactants are in general composed of a hydrophobic moiety, often a long
chain aliphatic (C10 to C20) group and a hydrophobic moiety that can be anionic,
cationic, non-ionic, or zwitterionic (possesses both positive and negative charges). The
surfactant molecules tend to concentrate at interfaces due to their amphiphilic structure
and reduce interfacial tension (Rosen 1989). The reduced interfacial tension alters the
wetting properties of the soil matrix and make surfactants useful in the enhanced oil
recovery and the remediation of non aqueous phase liquids (NAPLs). Another
important property of surfactants that is very useful in the remediation of contaminated
soils is the formation of self aggregates called micelles beyond critical micelle
concentration (CMC). Above the CMC, the surfactant molecules exist mainly as
micelles and very few exist as individual amphiphiles with an equilibrium between the
two (Void and Void, 1983). In aqueous solutions, the polar or ionic portions of the
molecules are presented to the aqueous phase while the non-polar hydrocarbon tails of
the molecules are clustered together away from contact with the water molecules.
These micelles may take a number of different shapes, although they are usually
roughly spherical in dilute solutions. The interior of a micelle consisting of the
hydrocarbon tails of the surfactant species is a non-polar phase and can dissolve
appreciable quantities of non-polar solutes which are virtually insoluble in normal
aqueous solutions (Rosen 1989). This process known as solubilization is very useful
in secondary oil recovery, cleaning and laundering, and micellar catalysis. The
amount of hydrophobic solute that can be incorporated into these surfactant micelles
can be many fold depending on the hydrophobicity of the compounds (Void and Void,
1983).
Considerable research has been done on the use of aqueous phase surfactants
for remediation of contaminated soils (Ellis et al. 1983, Nash 1987, Kile and Chiou
1989, Gannon et al. 1989, Abdul et al 1991, Jafvert and Heath 1991, Jafvert 1991,
Clarke etal. 1991, Edwards et al. 1991, Liu et al. 1991, Peters et al. 1992, Abdul et
al. 1992, Edwards et al. 1994, Jafvert et al. 1994 Roy et al. 1994, 1995 and others).
The researchers reported that significant amounts of contaminants are solubilized by
surfactants at concentrations above the critical micelle concentration. An extensive
laboratory study was reported by Ellis et al. (1985) on the use of non-ionic surfactants
for washing petroleum hydrocarbons, PCBs and chlorinated phenols from soils. They
reported that the removal of PCB is not maximum at the maximum surfactant
concentration and concentrations below the CMC are ineffective. There is some
concentration at which the removal is maximum, which has to be determined from the
10
batch experiments. They noted that surfactant solutions are more effective than water
in removing hydrophobic organic compounds. It was suggested that leachate recycling
is necessary to conserve both water and surfactant and to reduce the cost of disposal
of the leachate. Kile and Chiou (1989) used 6 surfactants to study the water solubility
enhancements of DDT and trichlorobenzene at concentrations above and below CMC.
Abdul et al. (1990) evaluated the relative suitability of 10 commercial surfactants for
washing residual levels of automatic transmission fluid from a sandy material.
Edwards et al. (1991) determined the solubilities of polycyclic aromatic hydrocarbons
(PAHs) in micellar non-ionic surfactant solutions and found a linear correlation
between the surfactant concentration beyond CMC and PAH solubility. They also
reported that the partitioning of PAHs into aqueous surfactant solutions is linearly
correlated with octanol/ water partition coefficient. Liu et al. (1991) studied the
solubilization of PAHs in soil water systems and reported that the CMC of the
surfactants in soil water systems will be more than the aqueous solutions due to the
adsorption of surfactant by soil. Peters et al.(1992) conducted surfactant screening
experiments with 22 surfactants for mobilizing contaminants from the contaminated
soil. Anionic surfactants resulted in the greatest degree of mobilization. Jafvert et al.
(1994) studied the solubility of hexachlorobenzene in several anionic and non-ionic
surfactants. Valsaraj and Thibodeaux (1989), and Valsaraj et al. (1988) determined
partition coefficients between micelles and water for several hydrophobic non-polar
organics and correlated them with octanol/water partition constant. The experimental
distributions of polycyclic aromatic hydrocarbons between sediment and soil and
11
aqueous phase containing an anionic surfactant sodium dodecyl sulfate were determined
(Jafvert and Heath 1991, Jafvert 1991 and Abriola et a l 1993). Concentrations of
surfactants below the CMC do not effect the solubility of the organic compounds
(Valsaraj et a l 1989, Jafvert 1991, Liu et a l 1991). The ability of a surfactant to
solubilize a hydrophobic compound from soil is dependent on (i) interaction of the
compounds with the surfactant, (ii) sorption of the compounds on soil, (iii) sorption
of surfactant on soil and its effect on increasing the wettability of soil and (iv) the
partitioning of aqueous phase compound with the surfactant micelle (Liu et a l ,1991).
The presence of soil results in sorption of surfactant and hence the effective CMC will
be greater than the aqueous phase CMC (Liu et a l 1991 and Vigoii and Rubin, 1989,
Pennell et a l 1993, Rouse et a l 1993, and Edwards et a l 1994). A significant
portion of the contaminants in the soils are attached to the smaller sized particles or
fines (i.e. silt, clay and humus). The addition of a surfactant or a chelant can enhance
the effectiveness of washing from these fines, in particular surfactants increased the
removal of organics from soil significantly (Esposito et a/. ,1988).
Wilson and his group worked extensively on soil clean-up by surfactant washing
(Clarke et a l 1991, 1993, Oma et a l 1991, Oma et a l 1993, Megehee et a l 1993,
Burchfield et a l 1994) and soil clean-up by in-situ surfactant flushing (Wilson 1989,
Wayt and Wilson 1989, Gannon et a l 1989, Wilson and Clarke 1991, Underwood et
a l 1993a, and Underwood et a l 1993b, 1995). Their work includes all aspects of
surfactant washing and in-situ flushing including solubility, washing, column flushing
and mathematical modelling. They also reported encouraging results on the reuse of
12
anionic surfactant solutions after reclaiming the contaminant from the surfactant
solutions. They also showed that the reclaimed surfactant was as effective as the
virgin surfactant.
Nash (1987) tested the laboratory work of Ellis et al. (1985) at a field site
contaminated with aromatic and chlorinated hydrocarbons and petroleum hydrocarbons.
The positive results obtained with soil columns at laboratory scale, however, were not
substantiated by the field studies, which yielded ambiguous results. Abdul et al.
(1992) performed a field test of the surfactant washing at a site contaminated with
PCBs and oils and reported that the in-situ method is promising for the remediation of
contaminated soil systems. Schmitt and Caplan (1987) reported a successful
implementation of in-situ surfactant flooding along with in-situ bioremediation for
clean-up of contaminated soils. The site was contaminated with petroleum
hydrocarbons and the remediation scheme consisted of soil flushing with surfactant and
aerobic biodegradation. They were able to remove 78.5% aliphatics and 90.1%
aromatics. Clarke et al. 1991 demonstrated the washing of weathered-in PCBs from
soil on a bench scale experiments. Surfactant recycle and reuse was studied at
laboratory level using pure compounds by several researchers (Gannon et al. 1989 and
Underwood et al. 1993a, 1993b) and only anionic surfactants were found suitable for
recycle. However, the actual wastes are complex mixtures of many compounds and
the recovery of surfactant may not be feasible at the field scale. Moreover, the
problem with the application of surfactant solutions is that the soil-surfactant interaction
tend to clog the soil pores and result in the alteration of the hydraulic properties (Nash
13
1987, Liu 1993, Darji 1993, Kommalapati 1994). The preferential problem can
however, be addressed by using surfactant solutions in the form of microbubble or
colloidal gas aphron (CGA) suspensions (Darji 1993, and Kommalapati 1994).
2.3 Colloidal Gas Aphron (CGA) Suspensions
CGAs are micron size gas bubbles generated with a film of surfactant around
them and are stable for hours. CGAs were first developed by Sebba (Sebba 1971) and
were named as microfoams. A CGA contains about 65% of gas and is a class of
Kugelschaum foams. The CGA is typically 25-300 #im in size. These bubbles do not
coalesce easily and are remarkably different from conventional soap bubbles in their
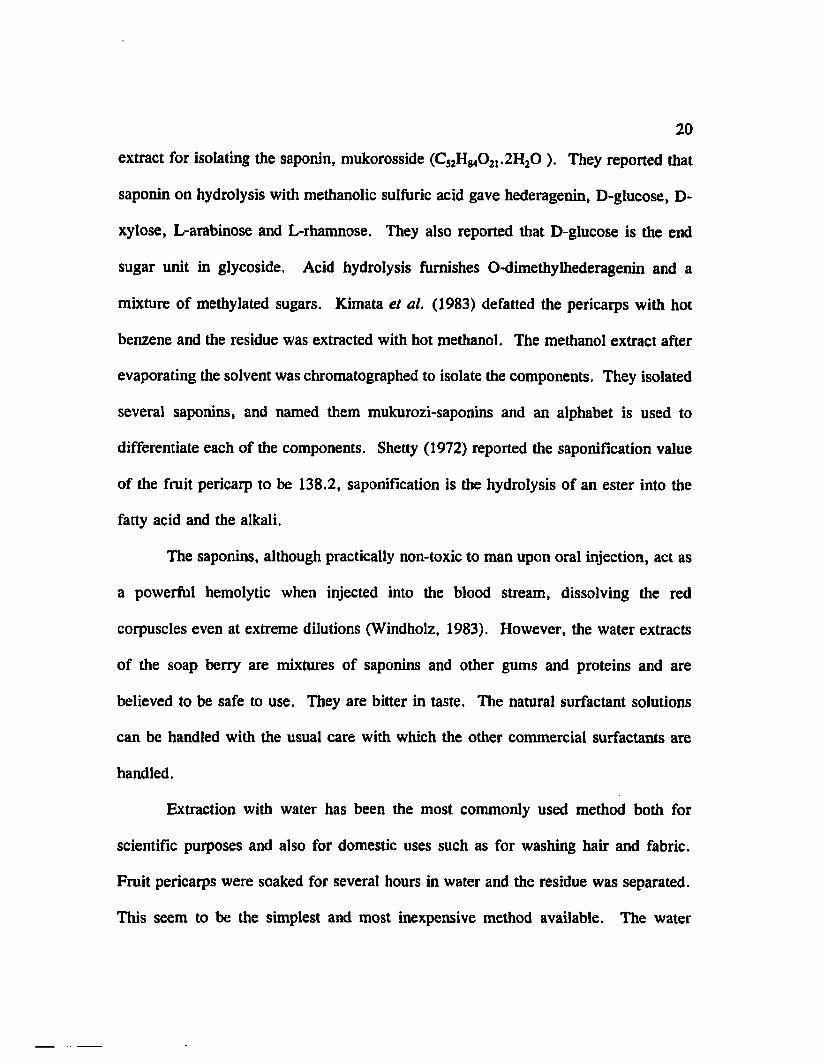
stability and flow-through properties. Figure 2.1 shows the structures of (a) air
bubble, (b) soap bubble and (c) CGA. As can be seen, the soapy film around the CGA
has inner and outer surfaces with surfactants mono-layers adsorbed on them. The
encapsulation retards the coalescence and improve the stability of bubbles significantly.
The CGA suspensions have viscosities similar to water, which make them suitable for
pumping without the deterioration in quality. The present method of production of
CGAs has been developed by Sebba (1985a). A unit was developed in our laboratory
by Chaphalkar et al. (1993) based on the design by Sebba (1985a).
There are number of potential applications for CGA suspensions in treating
polluted soil and water. These can be grouped into three categories (a) flotation, (b)
in-situ biodegradation and (c) soil flushing. The properties associated with CGAs
widens the scope of technological application. CGA suspensions can be used to float
14
AirWater
Bulk W ater ContainingSurfactant
(a) Air Bubble (b) S o ap Bubble
Bulk W ater Containing Surfactant
W ater Containing Surfactant
Viscous Water
"*“0 Surfactant Molecule
(c) Colloidal G as Aphron
Figure 2.1 : Structure of (a) Air Bubble, (b) Soap Bubble and (c) Colloidal Gas Aphron
15
suspended particulates, bubble-entrained floes, and hydrophobic compounds from
solution (Sebba and Barnett 1981, Sebba 1982, 1985b, Auten and Sebba 1984,
Honeycutt et al. 1983, Roy et al. 1992a, and Chaphalkar et al. 1994). CGA
suspensions can be used to deliver oxygen and necessary nutrients for enhancement o f
biodegradation in saturated soil systems (Michelsen et al. 1984, 1985, 1988). Jackson
and Roy (1995) used CGA suspensions to transport microorganisms through porous
media and reported that CGA suspensions enhanced the transport of bacteria
significantly over that of surfactant solutions and water. Application of CGA
suspensions in soil flushing was reported by Fugate 1984, Longe (1989), Roy et al.
(1992b), Darji (1993), and Kommalapati (1994). Longe (1989) reported that the CGA
is very effective in flushing a variety of hydrophobic organics from the soil and that
CGAs are more effective than surfactants at the same surfactant concentration.
Moreover, emulsification does not often occur with CGA flushing. Roy et al. (1992b)
applied CGA suspensions and surfactant solutions for washing 2,4-D from soil and
reported that the CGAs are more efficient than surfactants on a weight of contaminant
per weight of surfactant basis. They suggested that CGAs will be more effective for
hydrophobic compounds rather than hydrophilic compounds like 2,4-D. Darji (1993)
used surfactant solutions and CGA suspensions to flush columns contaminated with
hazardous oily waste from a Superfund site. The results indicate that the CGA
suspensions are more effective than surfactant solutions in most of the cases and as
effective in the remaining cases depending on the mode of operation. The main
advantage of employing CGA suspensions is that the pressure build-up across the soil
16
columns was significantly lower compared to flushing with surfactant solutions. The
surfactant-soil interactions and clogging of pores due to the colloids are thought to be
the reasons. Kommalapati (1994) used automatic transmission fluid at residual levels
for demonstrating the effectiveness of CGA suspensions over surfactant solutions.
Results are similar to those observed by Daiji (1993). These studies showed promising
results and warrants further research. Chaphalkar (1994) studied the transport of CGA
suspensions through soil columns using gamma ray densitometry and also modelled the
transport process. He observed gas saturation levels as high as 90% in the columns
when CGA suspensions are pumped into a initially water saturated column.
Although the commercial surfactants have shown good potential in terms of
recovery of contaminants from the soils, their fate in the subsurface is still unknown.
Some of the synthetic surfactants are recalcitrant and are toxic themselves. When these
surfactants are employed, they contaminate the aquifers increasing the load to the
subsurface soils. Now the attention has been shifting towards biosurfactants which are
produced by microorganisms (Wilson 1986, Falatko and Novak 1992, Desai and Desai
1993, Thangaman and Shreve 1994 and others). The studies indicate that these
biosurfactants improve the hydrocarbon dispersion and bacterial attachment to the
hydrophobic contaminants and thus enhance the solubility and increase the
biodegradation rates of these hydrophobic compounds. Major classes of these
surfactants include glycolipids, phospholipids and fatty acids, lipopeptide/ lipoproteins,
polymeric surfactant and particulate surfactants. Another class of these surfactants,
17
produced from plants, known as natural surfactants also seem to have a great potential
for remediation (Mandava 1994).
2.4 Natural Surfactant (Ritha)
Another class of natural surfactants are derived from plants belonging to the
genus Sapindaceae. These plants produce saponaceous substances called saponins,
which form lather or foam in water. Sapindus mukurossi, Sapindus trifoliatus,
Sapindus laurifolius and Sapindus emarginatus are widely grown in India and Pakistan
and other tropical and subtropical regions of Asia. Generally a mixture of these are
sold in local markets (Gedeon 1954). About 56% of the fruit is pericarp and the
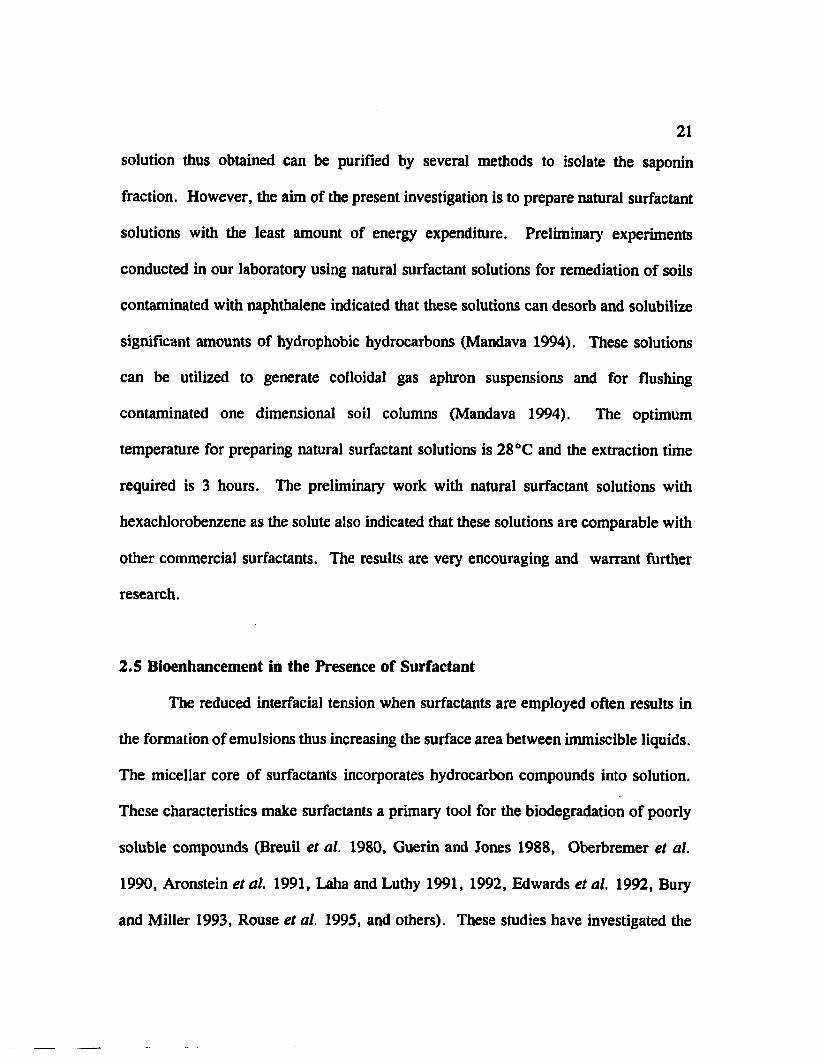
remaining is seed. A picture of the tree and the fruits are shown in Figure 2.2. As
can be seen from the photograph, the tree is of medium size with wide leaves. The
fruits are golden brown in color and globular in shape with a diameter between 1 and
3 centimeters. These fruits are locally known as soap berry, soapnut or Ritha in the
Indian subcontinent.
The fruit pericarps of the plants belonging to the genus Sapindaceae have
traditionally been used by man as soap substitute for fabric washing and bathing
(Oommachan, 1977, Uphof 1968, Bor 1953). This practice continues even today in
Asian countries despite the widespread use of commercial cosmetic shampoos. The
recorded use of this product by man as washing soap does not site any toxic effects on
human skin and eyes (Windholz 1983). The fruits of Sapindus mukurossi has also been
used as a folk medicine (Kimata et al. 1983, Nakayama et al. 1986, and Kasai et al.
Figure 2.2: Photograph of the (a) Tree Sapindus Mukurossi and (b) the Fruits
19
1988). It is used to treat epilepsy, chlorosis, and excessive salivation (CSIR, 1993).
Uppal and Mehta (1951) reported its utilization as a industrial textile auxiliary. Shetty
(1972) used Ritha as an air-entraining agent in the preparation of concrete.
Several researchers have isolated and identified the saponins from the fruit
pericarps of the plants of genus Sapindus (Sarin and Beri 1939, Uppal and Mehta,
Figure 5.8: Typical Variation in Size Distribution with Time for CGA SuspensionsGenerated with (a) 0.5% and (b)1.0% Natural Surfactant Solutions
82
and continuously re-circulated through a viewing cell and hence is considered to be
appropriate for representing the CGAs from the applications stand point.
The sample load in the system as indicated by the parameter, Dv starts with a
high value about 1.0 - 3.0 depending on the concentration of natural surfactant and
goes down exponentially with time. The size distribution was measured until Dv
reaches a value of about 0.005. By this time, the bubbles generally become unstable
and some bubbles become very big in size (400 - 700 fim) and eventually coalescence.
The size distribution of CGA suspensions changes to a bimodal distribution wherein
one mode is at the usual size 40-60 microns and the other one is at a larger size around
200 microns when the sample loading parameter, Dv becomes less than 0.01. The run
was terminated at this time. A typical size distribution of the suspensions following
a bimodal distribution is shown in Figure 5.9. This type of bimodal distribution
observed for CGA suspensions generated with plant-based surfactant solutions was not
reported in earlier studies (Sebba 1982, Longe 1989, and Chaphalkar 1994). As can
be seen from the figure, the distributions are identical for all the concentrations, 0.5,
1.0 and 1.5%. About 60% of the bubbles have diameters less than 100 fim and the
remaining bubbles have diameters between 100 and 500 /zm. This phenomena is
suggested to be due to the Laplace pressure of the small bubbles.
5.3.3 Effect of Natural Surfactant Concentration on the CGA Size Distribution
Figure 5.10 (a and b) shows the effect of natural surfactant concentration on the
sizes 10% and 90% respectively. As can be seen from the figure, 10% size decreased
83
cun
voL0HE
199- • ■ ' | T T T --------\ i lu r 1 i, i ; i ! !: I >" ! 1 1 I 1 1 :1(a).0.1% M ; I > 11 / i t i 1 : ; 1 ii 1 ..III' 1 I : i j i / r i i : !'r ! i •: i t i l l / i 1
i i . ! t : </. : i 1 i !i < : 1 : i i i ' / ii i • i 1 1 11 1 ■ I 1 i :/■ I 1 ; 1 1 t 1 !f 11 i/V I i t i 1 ! 1 11 11 f lA I,! 1 i i | 1........1 ' • i !/t / iV 1. 1 1 1
t ' . ! 11 1/ ' / ■ \ 11 1 I i |1 ! 1 1 11 ; / 1 / ! V i i I 11 ; ! ' l > i 1/ .V I I I1 i i i II " 1 j i • i ii i t > > i 1 i / r, ’ 111\ i l i i 1 ! •i ' i i 11 i ■ i 1/ V i I u 11 \ | i i i » 1i ' i i M u * / / I I V : t i l l 1 1i ' — Mi l / A ! I ! ■\ 1 ) ' I M ' 11 -r i | i ■ i i L i t 1 I
--------- ----- - i r 1 1 < 1 I
15
V0
I t L II H E
m em o
49CUn
vaIuhE
199
U0LIIRE
59
69
V 59
91T
VaLUnE
Figure 5.9: Bimodal Size Distribution Curves for CGAs Generatedwith (a) 0.5%, (b)1.0%, and (c) 1.5% NaturalSurfactant Solutions
50 84
(a)40
COeo
uN
20
10
Natural Surfactant Cone
— °— 0.1%
-•*«-*- o.5%1.0%
— *— 1.5%
J----------------- 1----------------- 1___________ I___________ I___________ L
350
300Cfleo
250oii" ? 200 6$
* > N y O
’Aoo\'Z 150_NV3
100
50
0 40 6010 20 30 50 70
Time (Minutes)
Figure 5.10: Effect of Natural Surfactant Concentration on the (a) 10 Percentile and (b) 90 Percentile Size of CGA Suspensions
85
with increase in surfactant concentration but only marginally. As the concentration
increased from 0.1 to 1.5%, the 10% size decreased from a mean of 35.5 to 31.5 pm.
Tukey multiple comparison test with 95% confidence level was performed on the data.
For 50% size also the increased concentration decreased the size (not shown).
However, this significant decrease in size was noticed only for concentrations up to
1.0%. Beyond 1.0% the concentration did not significantly change the 50% size. The
90% size of CGA suspensions also showed a similar trend. An increase in natural
surfactant concentration beyond 1.0% did not change the size significantly. The CGA
suspensions with 0.1% natural surfactant have the lowest 90% size and 0.5% have the
largest size which decreased when the concentration was increased. The CMC of
plant-based natural surfactant is 0.1% and the bubbles are unstable at concentrations
below CMC due to the non-availability of surfactant molecules to stabilize the
enormous interfacial area of the microbubbles (Longe 1989).
The significant differences in size distribution are due to the crowding of
surfactant molecules on the bubble surface which in turn reduces the interfacial tension
between the bubble and bulk water. This reduced interfacial tension reduce the bubble
size. The same trend was seen for all the surfactant concentrations except 0.5 % in the
case of 90% size. CGA suspensions generated with 0.5% natural surfactant did not
follow the trend, instead the sizes were on the higher side at the beginning of the run
and stabilized by the end of the run. This will be supported in the later sections by the
fact that these suspensions are more stable than those generated with other natural
surfactant concentrations. As the concentration of natural surfactant increased beyond
86
1.5%, the CGA suspensions became very thick, which prevented the air from
entraining in the solution. This resulted in low gas fraction (poor quality) of the CGA
suspensions. However, the suspensions are very stable as indicated by the longer
liquid drainage time. Natural surfactant is a complex mixture of organic compounds
which are believed to be responsible for the poor quality of the bubbles.
The variation of sample loading parameter (Dv) with time for different
concentrations of natural surfactant are plotted in Figure 5.11. As the concentration
of surfactant increased from 0.1% to 1% the Dv value increased significantly.
However, the changes were marginal when the concentration was increased from 1 to
1.5%. The bubbles generated with 0.5% surfactant are more stable and thus persisted
for longer time than the bubbles generated with low concentration, 0.1 % or the higher
concentrations, 1.0 and 1.5%. The Dv values decreased exponentially with time for
all the suspensions. For CGA suspensions made with concentrations higher than 1.5%,
the Dv value was very high (about 4) and took longer time to reach 0.005 where the
run was stopped. This indicates that the bubbles are very stable, however, the quality
(air content) of suspensions as determined from the drainage test is very low. As
mentioned earlier the constituent compounds are thought to be responsible for this.
5.3.4 Effect of Electrolytes
The effect of electrolytes on the size distribution of colloidal gas aphron
suspensions was studied by adding 200 mg/1 and 400 mg/1 of sodium chloride to
natural surfactant solutions before generating the CGA suspensions. The effect of salt
Dv,
Sam
ple
Load
ing
87
4
3.5 Cone, of Natural Surfactant
0 . 1%3
2.51.0 %
2 — *— 1.5%
1.5
1
0.5
0
60 700 20 30 4010 50
Time (Minutes)
Figure 5.11: Effect of Natural Surfactant Concentration on the Sample Loading Parameter (Dv)
on the size distributions is summarized in Figure 5.12 (a and b) for 10% and 90%
respectively. It is evident from the figures that the presence of electrolyte did not
effect the size of the bubbles significantly. The 50% size also showed similar trend
(not shown). Tukey multiple comparison test was performed with 95% confidence
level and the results indicated no significant difference over the entire duration of the
run. Lower amounts of salt (200 mg/1) used in earlier studies decreased the bubble
size for ionic surfactants. This is due to the adsorption of one of the ions of the salt
at the interface of the bubble along with the surfactant, resulting in the increase of the
effective surfactant concentration (Longe, 1989). However, for non-ionic surfactants
the electrolyte does not seem to affect the size distribution of the bubbles as the surface
of the bubbles are neutral. The invariability in different sizes due to the addition of
the salt indicate that the plant-based surfactant used to generate CGAs may be some
what non-ionic in nature. The sample loading parameter, Dv was not affected when
salt at concentration of 200 mg/1 and 400 mg/1 was used. However, there is a
significant difference at 95% confidence level between the Dv value of the CGA
suspensions generated with 200 mg/1 salt and 400 mg/1 salt. The Dv of CGAs
generated with 400 mg/1 salt was lower at the beginning of the run but the value was
after about 15 minutes and persisted for longer time indicating higher stability.
5.3.5 Comparison with CGAs Generated from Commercial Surfactants
The size distributions of CGA generated with natural surfactant solutions are
compared with those generated from commercial surfactants in our laboratory by
5089
40
uco
20
10
(a)
1<T
1% NS
NS - Natural Surfactanti I
1% NS+0.2g/l Salt
■*«--- l% NS+0.4g/l Salt
_i__________ L
350
300
o 250
~ 200
150 *0.
CO100
c x
50
020 25 3510 155
Time (Minutes)
Figure 5.12: Effect of the Presence of Salt on the (a) 10 Percentile and (b) 90 Percentile Size of CGAs Generated with 1 % Natural Surfactant Solution
Chaphalkar (1994). The results of this study are presented in Table 5.3 along with
those for commercial surfactants, sodium dodecylbenzene sulfonate (NaDBS), Tergitol
and hexadecyltrimethylammonium bromide (HTAB). The lower sizes (10% and 50%
sizes) of the CGAs generated with natural surfactant correspond very well with the
CGAs produced with the non-ionic surfactant, Tergitol. The ionic surfactants have
sizes 15-60 microns larger for the 10% and 50% size. However, the 90% size of the
CGAs in our study has significantly higher value than those of Tergitol, but these sizes
are closer to those of ionic surfactants. This suggests that the fruit extract used for
generating CGA suspensions could be a mixture of ionic and non-ionic compounds.
5.3.6 Stability of CGA Suspensions
Stability of CGA suspensions is defined as its ability to resist change in bubble
size, liquid content or degree of dispersion (Longe, 1989). Due to the constitution of
the two phases of CGA suspensions, the bubble cannot retain its integrity without some
external hydrodynamic force such as mixing or agitation. If agitation is discontinued,
the bubbles tend to rise to the top and cream as a result of density difference between
the gas and liquid phases. Longe (1989) suggested a simple method of gravity
drainage under static conditions to determine the stability of CGA suspensions. CGA
suspensions were filled into a graduated cylinder and the volume of the liquid drained
was monitored with time. Stability was measured in terms of half life, the time need
for 50% of the liquid content to drain. The total liquid volume collected by this
method was also used for calculating the quality of the suspensions, i.e. the gas
91
Table 5.3. Comparison of the Size Distribution of CGAs Generated with Natural Surfactant and Commercial Surfactants (Chaphalkar, 1994) *
SurfactantSize Distribution of CGAs (microns)
10% 50% 90%
Natural Surfactant Concentration
0.1% 34 55 202
0.5% 33 65 305
1.0% 32 60 290
1.0% + 200 mg/1 salt 32 62 290
1.0% + 400 mg/1 salt 31 48 279
1.5% 31 52 295
DDBS Concentration Anionic
200 mg/1 50 123 244
500 mg/1 54 124 194
500 mg/1 + 200 mg/1 salt 44 98 187
750 mg/1 46 112 198
Tergitol Concentration Non-ionic
50 mg/1 31 58 106
100 mg/1 32 57 128
100 mg/1 + 200 mg/1 salt 32 58 123
1000 mg/1 34 63 112
HTAB Concentration Cationic
200 mg/1 52 152 258
328 mg/1 46 105 186
328 mg/1 + 200 mg/1 salt 42 83 171
500 mg/1 50 112 200
* The percentile distribution reported is at time = 2 minutes
92
fraction. Another method to determine the stability of CGA suspensions is to use the
sample loading parameter, Dv, during the particle size analysis. The time required for
the value of Dv to reach low values (0.005) can be used to represent the stability of
the CGA suspensions. This method seems more appropriate as it is used under
dynamic conditions and also with aqueous phase. In our study both the methods are
used.
A typical drainage curve for the CGA suspensions is shown in Figure 5.13.
The figure shows the cumulative liquid volume with time for 0.5% natural surfactant
concentration. Rate of drainage was large at the beginning but it slowed with time.
The smaller bubbles appeared at the CGA/ liquid interface while the size increased
towards the top. From this figure, half life is calculated and compared for CGA
suspensions generated with different concentrations of natural surfactant and SDS. The
advantages of using half life to represent CGA stability rather than the H-factor are
discussed by Longe (1989). H-factor is defined as the height of the liquid column after
one minute drainage in a 250 ml graduated cylinder (Suggs, 1987). This factor can
be normalized by dividing with the final liquid height.
The half lives of CGA suspensions generated with different concentrations of
plant-based surfactant solutions are presented in Figure 5.14(a). The half lives for
CGA suspensions generated with sodium dodecyl sulfate (SDS) are also presented.
The figure shows that the stability of the suspensions increases with surfactant
concentration. These results are also supported by the particles size analysis data
presented earlier. The sample loading parameter, Dv, which represents the sample
Liqu
id Vo
lum
e (m
l)93
90
0.5% Natural Surfactant Quality = 67.1%
80-o
—O •70
60
— Flask 150
' Flask 240
Flask 3
30
20
10
0
100 20 30 40 50 60
Time (Minutes)
Figure 5.13: Typical Curve for Drainage of Liquid from CGA Suspensions
100.00 - / .«'**/ / # - * * *a/ . " S ' '0 . 0 0 ------ 1------1 Cl r r O F T ------------------------- I------------
0 2 4 6 8 10 12 14
No. o f Pore Volumes
Contamination
1 . 6 mg/kg
78 mg/kg
°“ 92 mg/kg
Contamination
~~a— 0 . 6 mg/kg
i.gnjg/jjg
5 4 mg/kg
- * o — 82 mg/kg
92 mg/kg
(b)
/ ■
/ # -,+ / a/ / // / A
/ ■p// P.*
«• *,T
.-••a*I 1.
Figure 5.24: Removal of HCB from Soil Columns Using (a) 1.0% Natural Surfactant Solutions and (b) 1.0% CGA Suspensions
123
and natural surfactant being a mixture of organics can adsorb to soil significantly. It
took about three to four pore volumes for the surfactant breakthrough to occur. HCB
concentrations increased steadily after the first pore volume and approach the
maximum HCB concentration by the fifth pore volume. This maximum concentration
was about 80% of the HCB solubility in the aqueous natural surfactant solution of the
corresponding concentration. HCB concentration in the effluent remains more or less
constant for the remainder of the experiment. The experiments were however,
terminated at 12 pore volumes after establishing the HCB removal trend. All the
experiments were continued for 12 pore volumes without stopping the runs. However,
in the case of CGA suspensions the experiments were stopped run for 6 to 8 pore
volumes before stopping and continued the following day. There was no remarkable
difference in the recoveries due to the break in the experiment. It should be noted that
CGA runs take about 30 hours as opposed to about 12 hours for natural surfactant
solutions. The reason for the longer times in case of CGA suspensions was that CGA
suspensions are only about 35 % liquid and it takes three times the time to collect one
liquid pore volume. It took between 2 and 3 hours to collect one pore volume with
CGA suspensions.
Total HCB recovered after flushing with natural surfactant solutions or CGA
suspensions for 12 pore volumes was about 200 ug for 0.5% and about 1000 fig for
1.0% natural surfactant. These amounts are about 20 and 100 times more than that
recovered with water (10 ug) from soil columns contaminated to about 100 mg HCB
/ kg soil. This significantly higher removal of HCB is very encouraging for the fact
124
that natural surfactant solutions can be used as a supplement at the existing "pump and
treat" facilities to enhance the performance. This will cut down the time required for
clean-up of the hazardous waste sites from several decades to years and hence lower
the treatment costs significantly.
Soil was analyzed at the end of the column run and mass balance on HCB was
performed to study the distribution of HCB in the column after flushing. The total
HCB recovered in the effluent and HCB remaining on the soil after the column run
were able to account for about 90% of the HCB in the column. The remaining 10%
HCB is believed to be lost due to volatilization losses from aqueous phase effluent and
from the soil and also any other error due to the non-homogeneous distribution of HCB
on soil. HCB is a semi-volatile compound and volatilize significantly from aqueous
solutions (Montgomery, 1990). The good mass balance obtained in this study provided
confidence in our analytical techniques and experimental procedures.
HCB remaining in the soil column was quantified by slicing the column into
four approximately equal sections and each section was analyzed independently. For
both CGA suspensions and natural surfactant solutions, the removal of HCB was
mainly from the influent end and the HCB present at the effluent end did not change
considerably. This indicates that the HCB removal starts from the soil at the influent
end first and the removal continues towards the effluent end. In some cases, HCB
concentration at the effluent end was higher than the initial contamination indicating
that the desorbed HCB may be getting re-adsorbed along with the surfactant during its
transport towards the effluent end.
125
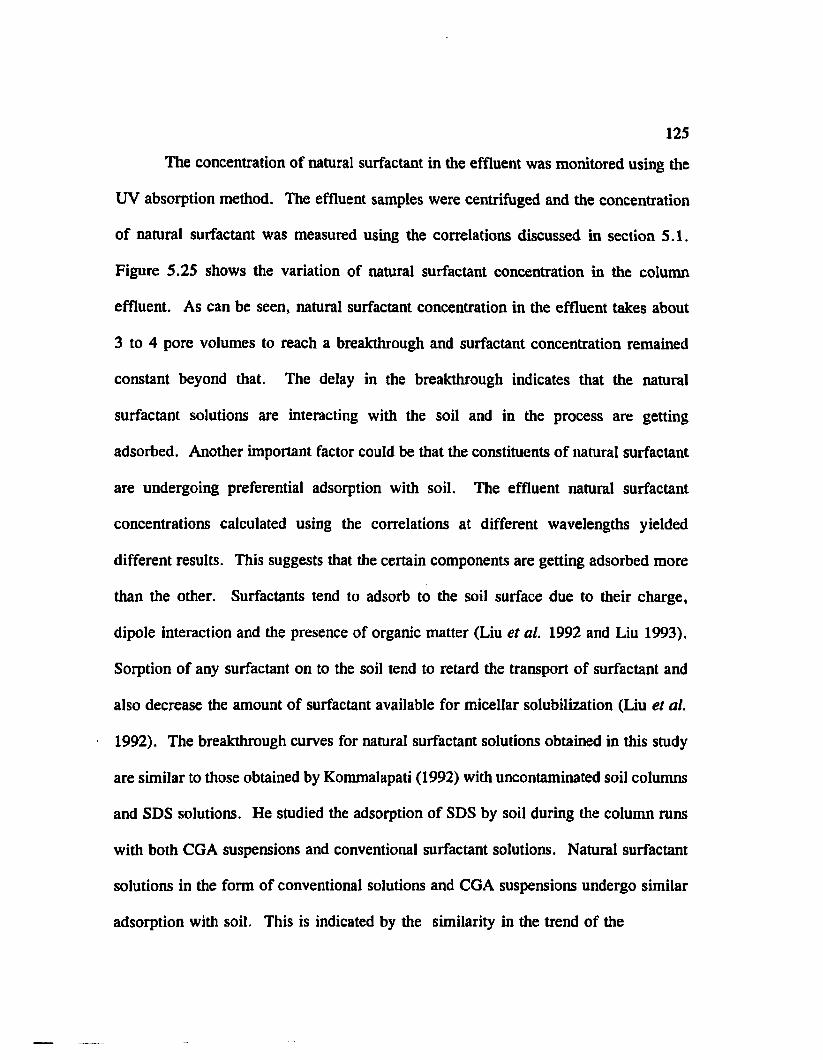
The concentration of natural surfactant in the effluent was monitored using the
IJV absorption method. The effluent samples were centrifuged and the concentration
of natural surfactant was measured using the correlations discussed in section 5.1.
Figure 5.25 shows the variation of natural surfactant concentration in the column
effluent. As can be seen, natural surfactant concentration in the effluent takes about
3 to 4 pore volumes to reach a breakthrough and surfactant concentration remained
constant beyond that. The delay in the breakthrough indicates that the natural
surfactant solutions are interacting with the soil and in the process are getting
adsorbed. Another important factor could be that the constituents of natural surfactant
are undergoing preferential adsorption with soil. The effluent natural surfactant
concentrations calculated using the correlations at different wavelengths yielded
different results. This suggests that the certain components are getting adsorbed more
than the other. Surfactants tend to adsorb to the soil surface due to their charge,
dipole interaction and the presence of organic matter (Liu et al. 1992 and Liu 1993),
Sorption of any surfactant on to the soil tend to retard the transport of surfactant and
also decrease the amount of surfactant available for micellar solubilization (Liu et al,
1992). The breakthrough curves for natural surfactant solutions obtained in this study
are similar to those obtained by Kommalapati (1992) with uncontaminated soil columns
and SDS solutions. He studied the adsorption of SDS by soil during the column runs
with both CGA suspensions and conventional surfactant solutions. Natural surfactant
solutions in the form of conventional solutions and CGA suspensions undergo similar
adsorption with soil. This is indicated by the similarity in the trend of the
Con
e, of
Naur
al S
urfa
ctan
t in
the
Efflu
ent
126
0.8
1 % NS♦-.
1 % CGA0.6- - o - - - 0.5% CGA
+ 0.5 %NS0.4
■« [ii — ’i*
♦0.2
NS- Natural Surfactant
0 2 4 6 8 10 12 14 16
No. of Pore Volumes
Figure 5.25: Concentration of Natural Surfactant in the Column Effluent
127
breakthrough curves. Roy et al. (1992c) also reported that the CGA suspensions and
surfactant solutions are transported through the column in much the same manner.
5.6.2 Comparison Between CGA Suspensions and Natural Surfactant Solutions
Natural surfactant solutions with a concentration of 0.5, 1.0, and 2.5% and
CGA suspensions generated with 0.5 and 1.0% were used to flush the soils
contaminated with HCB. The effect of natural surfactant concentration on the removal
of HCB from soil columns is shown in Figure 5.26 (a and b) for contamination levels
1.6 mg/kg and 100 mg/kg respectively. These figures also show the comparison
between CGA suspensions and conventional natural surfactant solutions. As can be
seen from the figures natural surfactant solutions have better performance than the
CGA suspensions generated with the corresponding natural surfactant solutions, even
though the differences are marginal. These results are in contrast to those reported in
the earlier studies on CGA suspensions (Kommalapati 1994, Darji 1993, Roy et al.
1992b, and others). Kommalapati (1994) and Darji (1993) used SDS solutions and
CGA suspensions generated from SDS solutions to recover residual levels of non
aqueous phase liquids (NAPLs) from soil columns and found CGA suspensions to be
better than the surfactant solutions. Roy et al. (1991) used 2,4-dichlorophenoxyacetic
acid (2,4-D) and found CGA suspensions to be as efficient as surfactant solutions.
Kongara (1994) however, used several surfactants and CGA suspensions generated
from those to flush soils contaminated with naphthalene and reported that surfactants
are better in recovering the contaminant than the CGA suspensions, even though the
120
Flushing Media
° — 1% Nat. Surf.100
CQUK
' 0.5% Nat. Surf.
• 1% CGAo>OE<u
P4<o>
- 0.5% CGA
40J23E3
u
128
4 6 8 10
No. of Pore Volumes12
Flushing Media
=— 1 % Nat. Surf
*” * 0.5% Nat. Surf
<>•** 1% CGA
° - - - 0.5% CGA
U 700
JS 300
14
Figure 5.26: Effect of Natural Surfactant Concentration on the Removal of HCB from Soil Columns (a) 1.6 mg and (b) 100 mg HCB/Kg Soil
129
differences are not very significant. This study also shows that the CGA suspensions
are not as effective as natural surfactant solutions, however, the differences between
the two are only marginal. It should be noted that the two studies mentioned above
(Kommalapati 1994, and Darji 1993) where the CGA suspensions have better
performance than surfactant solutions, the contaminant is a NAPL. In this study and
that of Kongara (1994) the test organic is in an adsorbed phase.
5.6.3 Effect of Surfactant Concentration
Figures 5.26 (a and b) depict the effect of surfactant concentration on the
removal of HCB for both surfactant solutions and CGA suspensions for two levels of
soil contamination. It is veiy clear from the figures that with the increase in the
concentration of natural surfactant there is a significant increase in the removal of HCB
from soil columns. The same is true for CGA suspensions. Surfactant solutions can
solubilize more and more of the hydrophobic compounds as the surfactant
concentration is increased. The higher the surfactant concentration, the higher is the
amount of organic that can be solubilized. Similar trends were observed for all the
contamination levels. When the natural surfactant concentration was increased from
1.0 to 2.5% the removal also increased significantly. However, the higher surfactant
concentrations tend to clog the soil columns resulting in high pressure build-up and
eventually in terminating the run. It should be noted that CGA suspensions cannot be
generated with natural surfactant solutions beyond 1.5%.
130
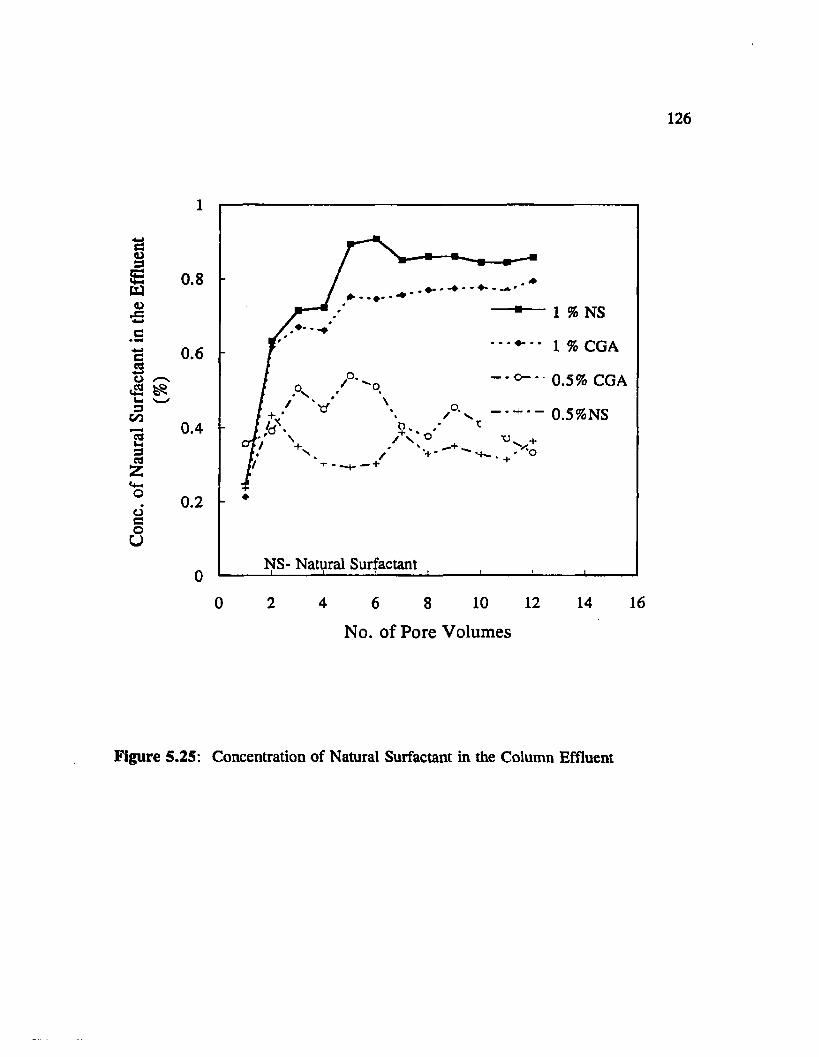
5.6.4 Pressure Build-up Across the Soil Columns
The pressure build-up phenomena often seem to be the controlling factor that
determines the application of surfactants at the field scale (Nash, 1987). Figure 5.27
shows the variation of pressure build-up for different flushing media with the number
of pore volumes. As can be seen from the figure the pressure variation is about the
same for all the runs except for the one with 2.5% concentration. The general trend
is that, pressure build-up increases with increase in surfactant concentration. However,
the increase in pressure was not very significant when the concentration is increased
from 0.5 to 1 %. The pressure increased gradually and approached about 60 psi by the
end of 8 pore volumes in case of 2.5% natural surfactant. When the concentration
was increased to 5% the pressure increased to 60 psi in 3 to 4 pore volumes (not
shown in the plot) and the run had to be terminated. It is believed that the interaction
of natural surfactant solutions with the soil are responsible for the increase in pressure.
This behavior was reported in the literature (Ang and Abdul 1991, and Liu 1993,
Kommalapati 1992 and 1994). However, it is not known at this time the specific
interactions that are responsible for the increase in pressure build-up. There was no
remarkable difference in pressure build-up between the CGA suspensions and natural
surfactant solutions. This observation is in contrast to those made by Kommalapati
(1994) with SDS solutions and automatic transmission fluid and Darji (1993) with SDS
solutions and a heavy oily waste. They observed lower pressure build-up when CGA
suspensions at the same concentration as surfactant solutions are used for flushing the
Pres
sure
Bu
ild-u
p (P
sig)
131
60Flushing MediaNS - Natural Surfactant
500.5% CGA
2.5% NS X-40
- 0.5% NS
1% NS30
20
10 -
0
0 4 8 12 16
No. of Pore Volumes
Figure 5.27: Pressure Build-up Across the Soil Columns for the Flushing Experiment
132
residually saturated contaminated soil columns. However, they also noted that the
pressure increased with increase in the surfactant concentration. The pressure build-up
across uncontaminated soil columns has similar trend indicating that the pressure build
up does not depend on the type of contaminant (Roy et al. 1992). The interactions
between the soil and the surfactant, surfactant and the contaminant seem to be
responsible for the pressure build-up. Ang and Abdul (1991) proposed that the
formation of floe and micelle and also the presence of any fine suspended particles as
the reason for pore clogging. The formation of "mat" due to the blocking of flow
paths along a continuous front can halt fluid flow and results in terminating the run
(Nash 1987). By increasing the surfactant concentration the solubility of the
contaminants can be increased and thus increase the recovery, but the pressure build-up
limits the concentration of the surfactant that can be employed. There should be a
compromise between the two. Some of the columns were flushed with natural
surfactant solutions and CGA suspensions for 16 pore volumes and the pressure build
up seem to be stable after 4 to 5 pore volumes. Natural surfactant at a concentration
of 1 % seem to be a very good compromise. CGA suspensions can be generated from
natural surfactant solutions at this concentration, pressure build-up does not create any
problem and the HCB removal was about 100 times more than that of water run. As
will be seen from later sections natural surfactant can also be used as a carbon source
at this concentration by soil microorganisms.
133
5.6.5 Effect of Alternating the Flushing Media with Water
Surfactants when pumped at higher concentrations tend to clog the pores and
some times the run has to be terminated due to the high pressure build-up. The CGA
suspensions or surfactant solutions were used for flushing in a continuous mode.
However, surfactant breakthrough occurs after about 3 to 4 pore volumes and the
recovery of the contaminant becomes more or less stable. It is interesting to see
whether one can avoid the pressure build-up problem by manipulating the flushing
media. We may even be able to reduce the amount of surfactant needed by alternating
the expensive surfactants and CGA suspensions with water. These manipulations
should first be studied in the laboratory before one can use at the real sites. In this
study two concentrations of natural surfactant, 1% and 2.5% and CGA suspensions
generated with 1 % surfactant were alternated with water and the HCB removal and the
pressure build-up phenomena are studied.
The results of the study are summarized in Figure 5.28 (a and b) respectively
for 1% and 2.5% natural surfactant. The soil was contaminated for all the runs in one
batch to avoid any variation due to soil contamination. The contamination used was
about 92 mg HCB /kg soil. Natural surfactant solutions recovered more HCB from
soil columns in 16 pore volumes than the CGA suspensions of same concentration in
a continuous mode of flushing (Figure 5.28a). Higher concentration of natural
surfactant (2.5%) was able to recover more HCB than 1% natural surfactant solutions
(Figure 5.28b). The alternate run with 2.5% natural surfactant and water followed the
same trend as the 1 % run. The continuous mode of operation of the flushing media
Cum
ulat
ive
Rem
oval
of
HCB
(ug)
C
umul
ativ
e R
emov
al o
f HC
B (u
g)
1400134
Flushing Media
— 3----- 1 * NS
■ —>* - 1 ft NS* Water
1200
1000Water
800 ■ *•• tftC G A
1 * CGA'Water
600 ♦ • - 1 f t CGA'Water
400
200
3500Flushing Media
----- 1R NS3000- IR NS* Water
■' NS - Natural Surfactant2500 Water
2.5 ft NS2000
2.5 R NS'Water Dotted Arrows: Water Solid Arrows: Flushing Media
1500
1000
500
No. of Pore Volumes
Figure 5.28: Effect of Alternating Flushing Media with Water on HCB Removal from Soil Columns (a) 1 % Natural Surfactant and CGAs and (b) 1 % and 2.5% Natural Surfactant
135
recovered twice as much HCB as the alternate runs recovered. In the alternating mode
also the natural surfactant solutions were giving higher recoveries of HCB than the
CGA suspensions under similar conditions. However, it should be noted that when the
flushing media is alternated , only half of the surfactant is pumped. For example for
a 16 pore volume experiment 9 pore volumes of surfactant was pumped and 7 pore
volumes of water was used. HCB recovered at the end of 16 pore volumes was used
to calculate the removal per gram of natural surfactant. The values are tabulated in
Table 5.4. The table clearly indicates that more contaminant can be recovered per
gram of natural surfactant with continuous flushing than alternating runs for all the
flushing media. In the alternate mode of operation, natural surfactant solutions or
CGA suspensions were pumped for about three pore volumes and then switched to
water. The first pore volume of water after switching basically replaces the surfactant
that was already pumped and thus the recovery does not reduce from that of earlier
pore volume. However, for the second pore volume the amount of surfactant present
in the effluent was low and thus could recover only small quantities of HCB. When
the flushing media was changed back to natural surfactant solutions or CGA
suspensions, the first pore volume basically replaces water and the recoveries become
lower than the earlier pore volumes. By the second pore volume the recoveries will
start increasing and the continue to increase for one pore volume even after switching
to water. The process was repeated as the flushing media was switched after every
two pore volumes. This can be seen from both the figures with a rise in the
cumulative HCB removal curve for about three pore volumes and followed by a
136
Table 5.4: Comparison of Continuous and Alternate Flushing
Description HCB recovered in 16 pore volumes (pig)
Recovery of HCB (pig) per gram of natural
surfactant
1% Nat. surf. 1321 68.8
1% Nat. surf, -w ater 512 48
1% CGA 1057 55
1% CGA —water 375 35
2.5% Nat. surf.1 3302 100
2.5% Nat. surf.—water* 1275 39
f Column runs were terminated after 11 pore volumes due to high pressure
137
stationary curve. Tamayo (1991) alternated CGA suspensions and surfactant solutions
with water for flushing 2,4-D from soil columns and observed that there is no
significant difference when the surfactant solutions or CGA suspensions are alternated
with water. It should be kept in mind that 2,4-D is fairly water soluble and even water
can flush all the 2,4-D. However, due to the hydrophobicity of HCB and its low water
solubility, the alternating procedure did not help in recovering HCB.
One of the main reasons for alternating natural surfactant solutions with water
is to investigate the possibility of overcoming the pressure build-up across the soil
columns. As mentioned in the earlier section, when natural surfactant solutions of
2.5% concentration are used there is very high pressure build-up across the soil
columns and the column run had to be terminated. Tamayo (1991) reported that the
pressure build-up across the column will reduce if the flushing media is switched to
water. However, the results of this study are contrary to those of Tamayo (1991).
Figure 5.29 shows the variation of pressure build-up across the soil columns for all the
alternate runs and the corresponding continuous mode runs. The pressure behavior did
not change significantly when the flushing media was alternated between natural
surfactant solutions or CGA suspensions and water. The columns where 2.5% natural
surfactant was used had to be terminated at about 11 pore volumes due to the high
pressure build-up. However, at the lower concentration (1%) both the CGA
suspensions and natural surfactant solutions have similar pressure trends and the
alternating with water did not change the pressure build-up considerably.
Pres
sure
Bu
ild-u
p (P
sig)
138
70 Flushing MediaNS - Natural Surfactant
60
50
40
30
20
10
1% NS
— ■— 1% NS "Water
P f . . . o . . . 1% C G A
tf :/ i ♦ - - 1 % CGA'Water
O '/ /' •,p ' *
'■ 2 .5% NS
/ / ~ * +- * 2.5 % NS WaterP /
/ *-• p .' f — x— Water
J 0 , . o - . o - - o
. - c9* .* .0* ' *“ v*-1—
cl / p J* -• —• * / Ai—■—r0 *«»<>>»X X X X— 'A—-X-—X X k X * —X X X X-
0 5 10 15 20
No. of Pore Volumes
Figure 5.29: Effect of Alternating Flushing Media with Water on the Pressure Buildup Across the Soil Columns
139
5.7 Bioenhancement in the Presence of Natural Surfactant Solutions
Surfactants are known to increase the aqueous concentrations of poorly soluble
organic compounds and interfacial areas between immiscible fluids beyond their critical
micelle concentration (Ellis et al. 1985, Rosen, 1989, Kile and Chiou 1989, Edwards
et al. 1992, Palmer and Fish 1992, Abdul et al. and others). The increased solubility
and decreased interfacial tension can improve the accessibility of these substances to
microorganisms. However, the literature suggests that the presence of surfactants may
enhance, inhibit or may not have any effect on the biodegradation of organic
compounds (Laha and Luthy 1991, 1992, Van Hoof and Rogers 1992, Aronstein and
Alexander 1992, 1993, Bury and Miller 1993, Tiehm 1994, Rouse et al. 1995 and
others). Rouse et al. (1994) made an excellent review on the factors involved and the
current state of knowledge concerning the influence of commercial surfactants and
bio-surfactants on the biodegradation of hydrocarbons. Another important factor in the
bioenhancement studies is the compatibility of surfactants with the cell membrane of the
bacteria (Swisher, 1987). Surfactants may form complexes with membrane proteins and
exoenzyme and could potentially inhibit the microbial system.
In this study, natural surfactant solutions are employed in the form of
conventional solutions and CGA suspensions for the remediation of contaminated soils.
The advantage of using a natural product in the remediation is that it does not add a
toxic load to the subsurface and it may even enhance the degradation of other toxic
contaminants present in the subsurface. It is very important to investigate the fate of
natural surfactant that is used in the clean-up of subsurface soils. The effect of the
140
presence of a natural surfactant on the growth of soil microorganisms was investigated
under both aerobic and anaerobic conditions. Natural surfactant concentration of 1%
was used for all the experiments, as this dose seem to be the optimum concentration for
flushing of contaminants from soil. The effect of natural surfactant concentration was
studied with 0.1% and 2.0% solutions. Natural surfactant solutions were amended with
nutrients and/or hexachlorobenzene to determine their effect on the microbial growth.
Total organic carbon (TOC) and absorbance at 540 n m o n a spectrophotometer were
monitored.
5.7.1 Aerobic Bioenhancement Studies
The microbial populations isolated from surface soils around the university
campus were acclimated in natural surfactant solutions for about a week and used as a
seed inoculum for the bioenhancement experiments. The results of the duplicate
bioenhancement studies are presented in Figure 5.30(a). The plot shows the growth of
microorganisms as measured by the absorbance at 540 nm of the solutions versus the
time of incubation in hours in a completely mixed batch system. Absorbance at 540
nm was used to monitor the bio-growth, as this was shown to correlate very well with
the microbial populations (Koch 1981). The aerobic growth was monitored over a
period of 360 hours. The microorganisms were in the lag phase for about 5 hours
followed by a log growth or exponential growth phase for about 100 hours. The
growth was very rapid during this phase. As can be seen from the figure the growth
3
2.5
2
1.5
1
0.5
90
80
70
60
50
40
e 5.:
141
Flask 1
Flask2
• Control
Flask 1
~ Control
50 100 150 200 250
Time (Hours)
300 350
Aerobic Bioenhancement in Natural Surfactant Solutions (a) Growth ofMicroorganisms and (b) Reduction in TOC
pattern followed a typical growth curve for pure cultures (Benefield and Randall, 1986).
There was a significant increase in growth again after about 200 hours after which the
stationary phase had begun. This could be due to the degradation of compound or
compounds that were resistant during the earlier log growth. Due to the lack of precise
quantification methods for natural surfactant and its constituent components, it was not
possible to identify and quantify the individual compounds. However, TOC was used
as a quantification tool for monitoring the changes in the total organic carbon content.
Figure 5.30(b) shows the TOC at different stages of the growth. X axis shows the time
and the Y axis indicates the TOC in grams per liter. As can be seen from the bars, the
TOC was reduced by 27% during the first 48 hours and the degradation was slow
beyond that point and the TOC after 360 hours was about 40%. The microorganisms
were able to degrade natural surfactant to about 60% of the initial concentration by the
end of 45 days. The experiment was repeated with a different seed inoculum and the
growth curves followed identical trends. Swisher (1987) and Rouse et al. (1994)
reported that surfactant interactions with the bacterial cell wall can be crucial in the
biodegradation of surfactants and hydrocarbons in the presence of surfactants.
However, the interactions of natural surfactant with the bacterial cells does not seem
to inhibit the growth of microorganisms.
5 .7 .1.1 Effect of Hexachlorobenzene
Hexachlorobenzene, a chlorinated hydrocarbon and a priority pollutant was used
in this study to investigate the performance of natural surfactant solutions in soil
143
flushing of contaminated soils and hence was selected to study the effect of the
hydrocarbons solubilized in natural surfactant solutions on the growth of
microorganisms. HCB was solubilized in natural surfactant solutions and the
microorganisms were added and monitored for bio-growth. Figure 5.31(a) shows the
effect of HCB on the aerobic bioenhancement of soil microorganisms. The HCB
concentration used was about 1 mg/1. As can be observed from the figure, there is no
significant difference in growth curves for cultures with and without HCB. Tukey
method for analysis of variance (Tukey 1953) with 95% confidence level was
performed to test for the significance. There was no significant difference between the
TOC of the two cultures. This clearly indicates that the presence of HCB at
concentrations up to 1 mg/1 does not significantly effect the growth of the
microorganisms in natural surfactant solutions. The concentration of HCB was
monitored at regular intervals to determine whether there is any degradation or
transformation due to the biological growth. Controls were also amended with HCB
to account for the volatilization losses. There was no remarkable change in HCB
concentration of the cultures after 360 hours when compared to the control flasks. It
is known that HCB can not be degraded aerobically as it is in a fully oxidized form.
However, it can be reduced to lower chlorobenzenes under anaerobic conditions
(Fathepure et al. 1988). These lower chlorobenzenes can be oxidized under aerobic
conditions (Fathepure and Vogel 1991).
144
2.5
BcsV)
■e NS 1
NS 2
~ NS+HCB 10.5
NS+HCB2
3.5
BcS<o
2.5uocC3
JOIJNS 1
NS 2
NS+BSM 10.5 NS+BSM 2
NS - Natural Surfactant
150 300 350100 200 2500Time (Hours)
Figure 5.31: Aerobic Bioenhancement Studies (a) Effect of HCB (b) Effect of Nutrients on the Microbial Growth
145
A test was performed to study the sorption of HCB onto the biomass over a
period of 210 hours. HCB was added to the cultures without any additional carbon and
the concentration of HCB and bio-growth was monitored over the test period. During
this period there was no significant growth of microorganisms. HCB concentration in
the aqueous phase did not change significantly indicating that HCB is not undergoing
significant adsorption with biomass. As mentioned earlier, HCB is fully oxidized
compound and it can not support aerobic biological growth. Rouse et al. (1994) in
their work on sulfated and sulfonated surfactants reported that surfactant interactions
such as sorption with biomass seem to be the main factor influencing the biodegradation
of hydrocarbon. However, in our study, natural surfactant is degraded considerably
and thus indicates that the bacterial cell and natural surfactant interactions are not
inhibiting the growth of the cultures.
5.7.1.2 Effect of Nutrients
Basal salt media (BSM) was added to the culture flasks to determine whether the
system is nutrient limited. Figure 5.31(b) shows the difference between the cultures
that were amended with nutrients and those without any nutrients. It is evident from
the figure that the presence of nutrients doubled the growth in the first hundred hours.
There was a considerable variation between the duplicate cultures amended with
nutrients. The log phase was much steeper than the culture without nutrients. The
cultures that were amended with the nutrients reached stationary phase by about 20
hours as against 100 hours by nutrient limited cultures. The nutrient limited cultures
146
however, had a significant increase in growth after around 200 hours and the
differences in bio-growth between the two cultures narrowed down by the end of the
run. This indicates that the system growth is limited by the nutrients. The continued
growth in case of cultures without nutrients indicate that the nutrients are utilized as
they are released from the endogenous phase. The endogenous phase around 150 hours
was followed by a significant exponential growth. The nutrients released during the
endogenous phase were utilized in the subsequent log phase. Addition of HCB to
cultures that were amended with nutrients did not effect the growth pattern as was noted
for cultures without nutrients (figure not shown). The growth curves were very similar
to those for cultures without HCB.
Figure 5.32 shows the variation of TOC for samples with natural surfactant,
natural surfactant and HCB, natural surfactant and nutrients, natural surfactant, HCB
and nutrients. It is very clear that the nutrient media is helping the microorganisms to
degrade natural surfactant to significantly lower amounts than the cultures without
nutrients. After about 15 days, the TOC was reduced by 40% in flasks without
nutrients and by 55% in flasks where nutrients were added. The TOC values are very
similar for systems amended with HCB. The TOC was reduced by about 42% and
61% for cultures without and with nutrients respectively. The degradation in nutrient
amended systems continued after 15 days and reached about 72% by the end of 45 days
as against 60% by nutrient limited cultures. This section clearly shows that the cultures
are limited by nutrients and the presence of HCB does not have any effect on the
bio-growth and the rate of growth. However, the nutrient limited cultures seem to
% T
OC
147
65
60
55
50
45
40
35
301 2 1 2 1 2 1 2
Treatments
Figure 5.32: TOC After 350 Hours for Different Treatments Under Aerobic Conditions
Natural Surfactant
Natural Surf. + HCB
Nat. Surf. + BSM
■ I I I l i t I I I _____________ j u _______________ I I I , - . . I I
148
catch up with the nutrient amended systems eventually. This probably is due to the
utilization of the nutrients released by the bacteria in the endogenous phase.
5.7.1.3 Effect of Natural Surfactant Concentration
Three concentrations of natural surfactant 0.1, 1 and 2% were used to study the
effect of concentration on the growth of microorganisms. The later two concentrations
are also amended with nutrients. Figure 5.33 shows the growth curves for the three
concentrations. It is evident from the plots that the higher the surfactant concentration,
the higher is the growth of the microorganisms. For cultures with very low
concentration of natural surfactant (0.1 %) the growth as indicated by the absorbance
increased only marginally (from 0.05 to 0.4) by the end of about 50 hours and
remained stationary beyond that. Cultures with 2% natural surfactant has significantly
higher growth than those with 1 % natural surfactant either with or without the nutrient
media. The higher growth is probably due to the increased amounts of carbon available
for synthesis and respiration. The cultures with 2% solutions with nutrient media
showed a significantly higher growth than the corresponding cultures without nutrients.
This again indicates that the cultures are nutrient limited. After about 15 days,
however, the difference between the growth of cultures with and without nutrient media
narrowed down. The TOC was reduced by about 50% for 0.1 %, by 40% for 1 % and
by 44% for 2% natural surfactant cultures. For cultures with nutrients the TOC was
reduced by 57% for 1% and by 56% for 2% natural surfactant solutions. The amount
of carbon utilized during the growth period is significantly different. For higher
Abso
rban
ce
at 540
nm
149
8
2% NS+ BSM7 &*---------
6
52% NS
4
31%NS
2
1 NS - Natural SurfactantNS
0
35050 200 250 3000 100 150
Time (Hours)
Figure 5.33: Effect of Natural Surfactant Concentration on the Growth of Microorganisms
150
concentrations of natural surfactant higher amounts of carbon were utilized for the
growth. This is indicated by the increased absorbance with increase in natural
surfactant concentration in the concentration ranges tested. However, from the soil
flushing experiments it is learned that natural surfactant concentrations higher than
2.5% are not suitable and concentrations lower than 0.1% are not effective due to the
low solubility of HCB. The present study covers the range of natural surfactant
concentrations that are generally useful in flushing experiments.
5.7.2 Anaerobic Bioenhancement Studies
The subsurface soils are typically cutoff from the atmosphere and hence are
under anoxic conditions. As mentioned in the earlier section, oxygen can be provided
to the subsurface by injecting CGA suspensions. However, it is important to appraise
the bioenhancement of soil microorganisms under anoxic conditions.
Hexachlorobenzene is known to undergo reductive dechlorination under anaerobic
conditions and in the presence of an additional carbon source (Fathepure et al. 1988,
Pardue 1992). In this section the results of bioenhancement studies under anaerobic
conditions in the presence of natural surfactant solutions are evaluated and the effect of
the addition of nutrients and HCB are appraised.
Figure 5.34(a) shows the growth curves for soil microorganisms under anaerobic
conditions with natural surfactant as the only carbon source. The inoculum
acclimatized with natural surfactant for about 2 weeks was used as seed for the studies.
The concentration used was 1%, as this dose seems to be the optimum for flushing
Figure 5.35: Effect of Nutrients on the Anaerobic Growth of Microorganisms (a) Cultures without HCB and (b) Cultures with HCB
The TOC at the end of 25 days for all the cultures is shown in Figure 5.36. As
can be seen from the figure, the decrease in TOC for all the cultures is about the same.
It should be noted that the initial concentration of natural surfactant used in cultures
with heterotrophic media is higher than the other cultures. The percent of TOC
reduced is in the range of 35 to 45% for all the cultures. The cultures with BSM
degraded TOC by about 45 % and the cultures with heterotrophic media by about 40%
as against 38% by cultures without any nutrients. These values are lower than those
obtained for aerobic cultures. In aerobic studies the addition of nutrients improved the
degradation by more than 10% as indicated by the percent TOC disappeared.
5.7.2.3 Effect of Natural Surfactant Concentration
Natural surfactant concentrations 0.1, 1 and 2% were used to study the effect
of concentration on the bioenhancement. The same concentrations were also amended
with BSM. Figure 5.37 shows the growth curves for the three concentrations both
without and with the nutrient media, BSM. This growth curve once again clearly
shows that the nutrient media is significantly increasing the growth of microorganisms.
The 1% cultures with nutrients has higher growth than the 2% cultures without
nutrients. The cultures with 2% natural surfactant seem to have a lower growth than
those with 1 % natural surfactant, however by about 25 days the cultures growing on
2% cultures were able to catchup with the 1% cultures. This probably is due to the
limitation of nutrients and also possible toxic affects of higher natural surfactant
% T
OC
158
80
70
60
50
40
30
20
10
0
N -Nat. Surf., B -BSM, H - HCB, Hm -Heterotroph Media
*' ■■*** CN2 2
CN CN (N CNE
INE
Treatment
Figure 5.36: TOC After 25 Days for Different Anaerobic Treatments
Abso
rban
ce
at 54
0 nm
159
3.5N -Natural Surfactant, B -BSM
“ 0.1% N3
0.1 %NB
2.5
- - O ' - 1 %NB2
2% N
2% NB1.5o
1
m
—-fj — —
00 10 20 30 40 50
Time (Days)
Figure 5.37: Effect of Natural Surfactant Concentration on the Anaerobic Growth of Microorganisms
160
concentrations. But the cultures of same natural surfactant concentration when amended
with BSM showed no inhibition and had a significantly higher growth. The cultures
with 2% natural surfactant utilized about 67% carbon which is significantly higher than
that observed (38%) for 1% and 0.1% cultures. The cultures amended with nutrients
utilized 69%, 44% and 40% carbon for 2%, 1% and 0.1% natural surfactant
respectively. The higher surfactant concentrations can provide higher amounts of
degradable carbon for the microbial populations and thus the increased growth. It is
evident again that the presence of nutrients did not significantly effect the amount of
TOC degraded, even though the growth showed significant increase. This is in contrast
to the observations made with aerobic studies where, the increase in the TOC utilized
was about 10%.
CHAPTER 6
CONCLUSIONS
There has been a keen interest in the recent past on biosurfactants and natural
surfactants which are produced by microorganisms and plants respectively. Fruits from
the plants belonging to the genus Sapindaceae, commonly known as Soap Nut or Ritha
in the Indian sub-continent are known for their detergent properties and has been
traditionally used for washing fabric and hair. There were no reported investigations
on the use of these natural detergents in the remediation of hazardous wastes. This
research is aimed at studying the application of fruit pericarps of Sapindus mukurossi,
for the remediation of soils contaminated with hazardous wastes. A comprehensive
research was conducted to characterize and study the applications based on the results
of preliminary investigations. The specific conclusions from this research are:
• The natural surfactant solutions can be prepared using a very simple method, by
extracting the dry powder obtained from fruit pericarps with water.
• The water extract of Ritha is as effective as methanol, ethanol and
methanol:benzene (3:1) extracts for concentrations below 2.5% in solubilizing
a chlorinated aromatic hydrocarbon, hexachlorobenzene.
• About 70% of the dry Ritha powder is extracted in to water and methanol and
about 60% into ethanol and methanol: benzene (3:1) mixture.
• Stock solutions are always prepared with 10% strength, which is 10 grams of
dry Ritha powder in 100 ml of DI water.
161
The COD and TOC of 10% natural surfactant solutions are 124.3 grams/liter
and 41.2 grams/liter and the organic nitrogen and phosphorous content is
negligible. The. pH of natural surfactant solutions is about 4.5 for
concentrations 1.0 % and above.
The empirical molecular formula for natural surfactant solutions (water soluble
fraction of the fruit extract) is determined to be (C26H31Oj0)n where n is a
constant that needs to be determined.
The UV absorption properties of natural surfactant solutions can be utilized to
quantify natural surfactant. Very good correlations are found between the
absorbance and natural surfactant concentration at several wavelengths. Two
wavelengths 252 and 292 are selected however, as the solutions exhibited peaks
in their spectrums at these wavelengths.
The critical micelle concentration (CMC) is found to be in the neighborhood of
0.1% from the surface tension and viscosity measurements.
The usefulness of a particle size analyzer is demonstrated for characterizing the
CGA suspensions. The dynamic changes that occur when CGA suspensions are
introduced into an aqueous system can be studied only using a particle size
analyzer.
The mean volume diameter used by earlier researchers can not be used to
represent the dynamic changes in size distributions. The size fractions 10, 50
and 90 percentile, are used along with the mean volume diameter for studying
the size distribution of CGA suspensions.
The CGA suspensions generated from natural surfactant solutions have bubble
diameters ranging from 10 to 300 fim. This range is similar to that reported for
CGA suspensions generated with commercial surfactants.
Increase in natural surfactant concentration decreased all the sizes, even though
the decrease is marginal in some cases.
The stability of CGA suspensions increased when the surfactant concentration
was increased from 0.1 to 1.5%. The CGA suspensions generated with 0.5%
natural surfactant seem to be more stable than those generated with other
concentrations.
The presence of salt did not effect the size distribution or stability significantly.
The quality of CGA suspensions increased when natural surfactant concentration
was increased from 0.1 to 0.5%, however, the quality decreased when natural
surfactant concentrations were increased beyond 0.5%.
CGA suspensions generated with natural surfactant concentrations beyond 1.5%
have very low quality and are very thick in consistency.
CGA suspensions generated with natural surfactant solutions have size
distributions very similar to those generated with commercial non-ionic
surfactant solutions.
CGA suspensions generated with natural surfactant solutions are more stable
than those generated with SDS solutions, even though the quality is lower.
Solubility of hexachlorobenzene is increasing linearly with surfactant
concentration beyond CMC. However, the solubility beyond 10% natural
surfactant concentration is not linear and follows a saturation type curve. The
inefficient extraction of Ritha into water and saturation of the surfactant micelles
with HCB are thought to be responsible.
Solubility of HCB in SDS solutions increase linearly with SDS concentration
beyond CMC for concentrations up to 100 mM.
Natural surfactant solutions are comparable with commercial surfactants in
solubilizing HCB. About 10.5 grams of raw Ritha powder and about 5.5 grams
of SDS are required in one liter water to solubilize 1 mg HCB. The
commercial surfactants required ranged from 0.5 to 81 grams.
Batch desorption studies show that the natural surfactant solutions are favorable
for desorption like other commercial surfactant solutions such as SDS. Natural
surfactant and SDS solutions are able to desorb HCB up to 90% of their
solubilization capacity.
The desorption isotherms follow both Freundlich and Langmuir isotherms with
some limitations.
Natural surfactant solutions either in the form of conventional solutions or CGA
suspensions recovered HCB from soil columns very effectively when compared
with water flood.
Natural surfactant solutions are able to recover as much as 90% of their HCB
solubilization capacity when the soils have high contamination levels. For low
contamination soils, natural surfactant solutions recovered as much as 90% of
the total HCB.
Natural surfactant solutions seem to be more effective than the CGA suspensions
in recovering HCB from soil columns.
Increase in natural surfactant concentration increased the recovery of HCB
significantly. The increased solubility of HCB enhanced the removal.
The pressure build-up across the soil columns remained fairly low when natural
surfactant was used at concentrations up to 1%.
The pressure build-up increased up to 60 psi and resulted in the termination of
the experiment after about 10 pore volumes when natural surfactant at 2.5%
concentration was employed.
Alternating the flushing media with water did not help to reduce the pressure
build-up or to increase the removals per gram of Ritha.
Natural surfactant solutions can support biological growth and serve readily as
carbon source under oxygen rich conditions and both as carbon and energy
source under anoxic conditions.
HCB did not affect the bio-growth significantly under both aerobic and
anaerobic conditions. Tests show that HCB does not adsorb to biomass.
Addition of basal salt media (BSM) increased the bio-growth significantly under
both aerobic and anoxic conditions suggesting that the cultures are nutrient
limited. However, the percent reduction in TOC remained about the same
under anaerobic conditions and was about 10% more for cultures with BSM for
aerobic cultures. However, the addition of heterotrophic nutrient media to
anaerobic cultures did not enhance the growth of microorganisms.
The increase in natural surfactant concentration from 0.1 to 2.0% increased the
growth significantly under both aerobic and anaerobic conditions. The percent
TOC reduction was significantly higher for higher surfactant concentration under
anaerobic cultures and did not change appreciably for aerobic cultures.
HCB did not undergo any transformations over the period of the study under
both aerobic and anaerobic conditions.
CHAPTER 7
RECOMMENDATIONS
Application of surfactants for both in-situ and ex-situ remediation of
contaminated sites is shown to have a tremendous potential at laboratory level, and real
sites. Commercial surfactants however, are manufactured with the aid of energy
intensive and cost consuming process, not to mention the possible toxic by-products.
This work is focussed on the applicability of plant based surfactants for the remediation
of contaminated soils at laboratory level. It is evident that natural surfactant solutions
are comparable to commercial surfactants in (a) solubilizing HOCs, (b) desorbing HOCs
from soil, and (c) flushing organic contaminants from one dimensional soil columns.
Natural surfactants also support microbial growth under both aerobic and anaerobic
conditions. The following areas need to be researched further before one could
establish the usefulness of natural surfactants and implement at the actual sites.
• In the present study fruit pericarps of Sapindus mukurossi are employed.
However, there are several other plants belonging to the genus Sapindaceae
which produce fruits with similar characteristics. The fruit pericarps of these
plants should also be studied for the possible application to remediation.
• Characterization of natural surfactant solutions should be done with sophisticated
methods. The present study estimated the empirical formula based on TOC,
COD and organic nitrogen. However, these solutions should be analyzed with
mass spectrometry and NMR to identify the constituent compounds and
167
determine the exact molecular formula. An analytical technique should be
developed to quantify natural surfactant solutions.
Feasibility studies should be conducted for the disposal of un-extracted residue
as a fertilizer for agricultural lands.
The interaction of natural surfactant solutions with soil need to be investigated
to understand (a) adsorption characteristics, (b) to determine the effective
surfactant available for solubilization and (c) pore clogging phenomena during
soil flushing.
The possible application of CGA suspensions generated with natural surfactant
for recovering contaminants from aqueous streams should be studied.
The biotic degradation or reduction of HOCs in the presence of natural
surfactant solutions should be studied under both aerobic and anaerobic
conditions
Pilot scale testing is necessary before adopting the technology for a
contaminated site.
A mathematical model should be developed incorporating the fate of natural
surfactant and HOCs in the subsurface. The model should include biological
degradation, physical and chemical interactions between contaminants and
natural surfactant.
REFERENCES
Abdul, S. A., Gibson, T. L., and Rai D. N., 1990. Selection of Surfactants for the Removal of Petroleum Products from Shallow Sandy Aquifers, Ground Water, 28(6): 920-926.
Abdul S. A., Gibson T.L., Ang C. C., Smith J. C., and Sobczynki R. E., 1992. In- Situ Surfactant Washing of Polychlorinated Biphenyls and Oils from a Contaminated Site, Ground Water, Vol 30(2): 219-231.
Abriola L. M., Dekker T. J., and Pennell K. D., 1993. Surfactant Enhanced Solubilization of Residual Dodecane in Soil Columns: 2. Mathematical Modeling, Environmental Science and Technology, Vol 27(12):2341-2351.
Ang, C. C., and Abdul, S. A., 1991. Aqueous Surfactant Washing of Residual Oil Contamination from Sandy Soil, Ground Water Monitoring Review, Spring 1991: 121-127.
Aronstein B. N., Calvillo Y. M., and Alexander M., 1991. Effect of Surfactants at Low Concentrations on the Desorption and Biodegradation of Sorbed Aromatic Compounds in Soil, Environmental Science and Technology, Vol 25 (10): 1728- 1731.
Aronstein B. N ., and Alexander M ., 1992. Surfactants at low Concentrations Stimulate Biodegradation of Sorbed Hydrocarbons in Samples of Aquifer Sands and Soil Slurries, Environmental Toxicology and Chemistry, Vol 11(9): 1227-1233.
Aronstein B. N., and Alexander M., 1993. Effect of a Non-Ionic Surfactant Added to the Soil Surface on the Biodegradation of Aromatic Hydrocarbons Within the Soil, Applied Microbiology and Biotechnology, Vol 39(3): 386-390.
Auten W. L., and Sebba F., 1984. The Use of Colloidal Gas Aphrons (CGAs) for Removal of Slimes from Water by Floe Flotation, in Solid and Liquid Separations, Gregory J. (ed), Ellis Horwood, U.K.
Beck J., and Hansen K. E., 1974. Degradation of Quintozene and Pentachloroaniline in Soil, Pesticide Science, 5(l):41-48.
Benefield L. D., and Randall C. W., 1986. Biological Process Design fo r Wastewater Treatment, Prentice-Hall Inc., Englewood Cliffs, NJ.
169
170
Boopathy R., Kulpa C. F., and Wilson M., 1993. Metabolism of 2,4,6- Trinitrotoluene (TNT) by Desulfovibrio sp. (B strain), Applied Microbiology and Biotechnology, Vol 39: 270-275.
Bor, N. 1., 1953. Manual o f Indian Forest Botany, Oxford University, Calcutta, India.
Borra C., Andreolini F ., and Novotny M., 1989. Use of Capillary Supercritical Fluid Chromatography and Microcolumn Liquid Chromatography for the Determination of Nonvolatile Organics in Aqueous Environmental Samples, Analytical Chemistry Vol 61(11): 1208-1210.
Breuil C., and Kushner D. J., 1980. Effects of Lipids, Fatty Acids and Other Detergents on Bacterial Utilization of Hexadecane, Canadian Journal o f Microbiology, Vol 26: 223-231.
Bunch R. L., Barth E. F ., and Ettinger M. B., 1961. Organic Materials in Secondary Effluents, J. Water Pollution Control Federation, Vol 33(2): 122-126.
Burchfield S. B., Wilson D. J., and Clarke A. N., 1994. Soil Clean-up by Surfactant Washing: V. Supplementary Laboratory Testing, Separation Science and Technology, Vol 29(1): 47-70.
Burris D. R., and Antworth C. P ., 1992. In-Situ Modification of an Aquifer Material by a Cationic Surfactant to Enhance Retardation of Organic Contaminants, J. Contaminant Hydrology, Vol 10: 325-337.
Bury S. J., and Miller C. A., 1993. Effect of Micellar Solubilization on Biodegradation Rates of Hydrocarbons, Environmental Science and Technology, Vol 27(1): 104-110.
Caballero M., Cela R., and Perez-Bustamente J. A., 1989. Studies on the Use of Colloidal Gas Aphrons in Coflotation and Solvent Sublation Processes. A Comparison with the Conventional Technique. Separation Science and Technology, Vol 24(9 & 10): 629-640.
Chaphalkar P. G., Valsaraj K. T., and Roy D., 1993. A Study of the Size Distribution and Stability of Colloidal Gas Aphrons Using Particle Size Analyzer, Separation Science and Technology, Vol 28(6): 1287-1302.
Chaphalkar P. G., Valsaraj K. T., and Roy D., 1994, Flotation Using Microgas Dispersions for the Removal of Pentachlorophenol from Aqueous Solutions, Separation Science and Technology, Vol 29(7): 907-921.
171
Chaphalkar P. G., 1994. Characterization and Application o f Colloidal Gas Aphrons fo r Groundwater Remediation, Ph.D. Dissertation, Louisiana State University, Baton Rouge, LA.
Chiang T,, Liao W., and Williams L. R., 1987. Use of Solid Phase Florisil Cartridges to Separate Fat from Semi volatile Organic Compounds in Adipose Tissue, J. Association Off, Analytical Chemists, Vol 70(1): 100-102.
Chiou C. T., Malcolm R. L., Brinton T. I., and Kile D. E., 1986. Solubility Enhancements of Some Organic Pollutants and Pesticides by Dissolved Humic and Fulvic Acids, Environmental Science and Technology, Vol 29(5): 502-508.
Christensen D. R., and McCarty P. L., 1975. Multi-Process Biological Treatment Model, J. Water Pollution Control Federation, Vol 47(11): 2652-2664.
Christian S. D,, Smith G. A., Tucker E. E., and Scamehom J. F ., 1985. Semiequilibrium Dialysis: A New Method for Measuring the Solubilization of Organic Solutes by Aqueous Surfactant Solutions, Langmuir, Vol 1(5): 564- 567.
Clarke A. N., Plumb P. D., Subramanyan T. K., and Wilson D. J., 1991. Soil Cleanup by Surfactant Washing: I Laboratory Results and Mathematical Modelling, Separation Science and Technology, Vol 26(3): 301-343.
Clarke A. N., Oma K. H., Megehee M. M., and Wilson D. J., 1993. Soil Clean-up by Surfactant Washing: II. Design and Evaluation of the Components of the Pilot-Scale Surfactant Recycle System, Separation Science and Technology, Vol 28(13 & 14): 2103-2135.
Daniels L ., Belay N ., and Rajagopal BS., 1986. Assimilatory Reduction of Sulfate and Sulfite by Methanogenic Bacteria, Applied Environmental Microbiology, Vol 56: 703-709.
Darji M., 1993. Removal o f Hazardous Oily Waste from Soil Matrix Under Different Flow Conditions, M.S. Thesis, Louisiana State University, Baton Rouge, LA.
Desai J. D ., and Desai A. J., 1993. Production of Biosurfactants, In Biosurfactants Kosaric N. (Ed), Marcel and Dekker, Inc., New York, NY.
Dobbs R. A., Wise R. H., and Dean R. B., 1972. The Use of Ultraviolet Absorbance for Monitoring the Total Organic Carbon Content of Water and Wastewater, Water Research, Vol 6(10): 1173-1180.
172
Eaton A., 1995. Measuring UV-Absorbing Organics: A Standard Method, J. American Water Works Association, Vol 87(2):86-90.
Edwards D. A., Luthy R. G., and Liu Z., 1991. Solubilization of Polycyclic Aromatic Hydrocarbons in Micellar Non-Ionic Surfactant Solutions, Environmental Science and Technology, Vol 25(1): 127-133.
Edwards D. A., Laha S., Liu Z., and Luthy R. G., 1992. Solubilization and Biodegradation of Hydrophobic Organic Compounds in Soil-Aqueous Systems with Non-Ionic Surfactants, in Transport and Remediation o f Subsurface Contaminants, D. A. Sabatini and R. C. Knox (eds.), ACS Symposium Series 491, American Chemical Society, Washington D. C.
Edwards D. A., Adeel Z., and Luthy R. G., 1994. Distribution of Non-Ionic Surfactant and Phenanthrene in a Sediment/Aqueous System, Environmental Science and Technology, Vol 28(8): 1550-1560.
Ellis W.D., Payne J. R., and McNaab G. D., 1985. Treatment o f Contaminated Soils with Aqueous Surfactants, EPA/600/2-85/129, U. S. Environmental Protection Agency, Cincinnati, OH.
Esposito M. P., Locke B. B., Greber J., and Traver R. P., 1988. Superfund Standard Analytical Reference Matrix Preparation and Results o f Physical Soil Washing Experiments, EPA/600/9-88/021, U. S. Environmental Protection Agency, Cincinnati, OH.
Faltkao D. M., and Novak J. T., 1992. Effects of Biologically Produced Surfactants on the Mobility and Biodegradation of Petroleum Hydrocarbons, Water Environment Research, Vol 64(2): 163-169.
Fanner W. J., Yang M., Letey J., and Spencer W. F., 1980. Land Disposal o f Hexachlorobenzene Wastes: Controlling Vapor Movement in Soil, EPA-600/2- 80-119, U. S. Environmental Protection Agency, Cincinnati, OH.
Fathepure B. Z ., Tiedje J. M., and Boyd S. A., 1988. Reductive Dechlorination of Hexachlorobenzene to Tri- and Dichlorobenzenes in Anaerobic Sewage Sludge, Applied and Environmental Microbiology, Vol 54: 327-330.
Fathepure B. Z., and Vogel T. M., 1991. Complete Degradation of Polychlorinated Hydrocarbons by a Two Stage Biofilm Reactor, Applied and Environmental Microbiology, Vol 57: 3418-3422.
173
Foster P., and Morris A. W., 1971. The Use of Ultraviolet Absorption Measurements for the Estimation of Organic Pollution in Inshore Sea Waters, Water Research, Vol 5(1): 19-27.
Fountain J.C., Klimek A., Beikirch M. G., and Middleton T.M., 1991. The Use of Surfactants for In-Situ Extraction of Organic Pollutants from a Contaminated Aquifer, J . Hazardous Materials, Vol 28: 295-311.
Fransisco V. R., 1992. In-Situ Surfactant Flushing of a Sandy Aquifer Contaminated with Gasoline Hydrocarbons, Ground Water, Vol 30 (5): 788-799.
Freundlich H., 1926. Colloid and Capillary Chemistry, Metheun, London.
Fugate E., 1984. The Use o f Colloidal Gas Aphrons to Facilitate Decontamination o f Subsoil Hydrocarbon Spills, M. S. Thesis, Virginia Polytechnic Institute and State University, Blacksburg, VA.
Gannon O. K., Bibring P., Raney K., Ward J. A., Wilson D. J., Underwood J. L., and Debelak K. A., 1989. Soil Clean-up by In-Situ Surfactant Flushing: III. Laboratory Results, Separation Science and Technology, Vol 24(14): 1073- 1094.
Gedeon J., 1954. Saponins from Indian Soapnuts, J. Sci. IndustriRes., Vol 13B: 427- 428.
Gee G. W., and Bauder J. W., 1986. Particle Size Analysis, in Methods o f Soil Analysis Part I: Physical and Mineralogical Methods, Klute (ed), 2nd edition, American Society of Agronomy, Madison, WI.
Greenberg A. E., Clesceri L. S., and Eaton A. D., 1992. Standard Methods fo r the Examination o f Water and Wastewater, 18th edition. APHA, AWWA and WEF, Washington D. C.
Guerin W. F., and Jones G. E., 1988. Mineralization of Phenanthrene by a Mycobacterium sp., Applied Environmental Microbiology, Vol 54(4): 937-944.
Gupta D. R., and Ahmed B., 1990. Emarginatosides B and C: Two New Saponins from Sapindus Emarginatus Fruits, Indian Journal o f Chemistry Vol 29B: 268- 270.
Harwell J. H., 1992. Factors Affecting Surfactant Performance in Groundwater Remediation Application, In Transport and Remediation o f Subsurface
174
Contaminants, D. A. Sabatini and R. C. Knox (eds,), ACS Symposium Series 491, American Chemical Society, Washington D. C.
Hassett J. P., and Anderson M. A., 1982. Effects of Dissolved Organic Matter on Adsorption of Hydrophobic Organic Compounds by River-Borne Particles, Water Research Vol 16(5): 681-686.
Hoffman F., 1993. Ground-Water Remediation Using Smart Pump and Treat, Ground Water, Vol 31(1): 98-106.
Hoffmann H., and Rehage H., 1987, Rheology of Surfactant Solutions, in Surfactant Solutions: New Methods o f Investigation, Zana R. (ed). Marcel Dekker, Inc., New York, NY.
Honeycutt S. S., Wallis D. A., and Sebba F., 1983. A Technique for Harvesting Unicellular Algae Using Colloidal Gas Aphrons, Biotechnology and Bioengineering Symposium No. 13: 567-575.
Hunt J. R., and Sitar N., 1988. Non-Aqueous Phase Liquid Transport and Clean-up:1. Analysis of Mechanisms, Water Resources Research, Vol 24(8): 1247-1258.
Jackson W. A ., and Roy D ., 1995. Transport of Bacteria Through a Soil Matrix Using Colloidal Gas Aphrons, Applied Environmental Microbiology (In Review).
Jafvert C. T., and Heath J. K., 1991. Sediment and Saturated Soil Associated Reactions Involving an Anionic Surfactant (Dodecylsulfate): 1. Precipitation and Micelle Formation, Environmental Science arid Technology, Vol 25(6): 1031-1038.
Jafvert C. T., 1991. Sediment and Saturated Soil Associated Reactions Involving an Anionic Surfactant (Dodecylsulfate): 2. Partition of PAH Compounds Among Phases, Environmental Science and Technology, Vol 25(6): 1039-1045.
Jafvert C. T., Van Hoof P. L., and Heath J. K., 1994. Solubilization of Non-Polar Compounds by Non-Ionic Surfactant Micelles, Water Research Vol 28(5): 1009-1017.
Jirka A. M., and Carter M. J., 1975. Micro Semi-automated Analysis of Surface and Waste Waters for Chemical Oxygen Demand, Analytical Chemistry, Vol 47: 1397.
Karrer P., 1950. Organic Chemistry, Elsevier Publishing Company, Inc., New York, NY.
175
Kasai R., Nishi M., Mizzutani K., Miyahara I., Moriya T., Miyahara K., and Tanaka O., 1988. Trifoliosode II, An Acyclic Sesquiterpine Oligoglycoside from Pericarp of Sapindus trifoliatus, Phytochemistry, Vol 27(7): 2209-2211.
Keller G., Warrack B., and Bartel H., 1988. Statistics fo r Management and Economics: A Systematic Approach, Wadsworth Publishing Company, Belmont, CA.
Keenaga E. E., and Goring C., 1980. Relationship Between Water Solubility, Soil Sorption, Octanol-Water Partitioning and Concentration of Chemicals in Biota, in Aquatic Toxicology, ASTM STP 707, Eaton J G., Parrish P. R., and Hendricks A. C ., (eds)American Society for Testing and Materials, Philadelphia, PA.
Kile D. E., and Chiou C. T., 1989. Water Solubility Enhancements of DDT and Trichlorobenzene by Some Surfactants Below and Above the Critical Micelle Concentration. Environmental Science and Technology, Vol 23(7): 832-838.
Kim B. J., and Gee C. S., 1993. Hazardous Waste Treatment Technologies, Water Environment Research, Vol 64(4):430.
Kimata H ., Nakashima T., Kokubun S., Nakayama K., Mitoma Y., Kitahara T., Yata N., and Tanaka O., 1983. Saponins of Pericarps of Sapindus mukurossi Gaertn. and Solubilization of Monodesmosides by Bisdesmosides, Chemistry and Pharmaceutical Bulletin, Vol 31(6): 1998-2005.
Knox R. C., Canter L.W., Kincannon D.F., Stover E.L., and Ward C.H., 1984. State-of-the Art o f Aquifer Restoration, EPA/600/S2-84/182, U.S. Environmental Protection Agency, Ada, OK.
Koch A. L., 1981. Growth Measurement in Manual o f Methods fo r General Bacteriology, Gerhardt P., Murray R., Costilow R. N., Nester E. W., Wood W. A., Krieg N. R., and Phillips C. B. (eds), American Society for Microbiology, Washington D.C.
Kommalapati R. R., 1992. In-Situ Flushing o f Disturbed Uncontaminated Soil Cores from the PPI Site Using Surfactants and Colloidal Gas Aphron Suspensions, Unpublished Work, Louisiana State University, Baton Rouge, LA.
Kommalapati R. R., 1993. In-Situ Flushing o f Undisturbed Contaminated Cores from the PPI Site Using Surfactants and Colloidal Gas Aphron Suspensions, Unpublished Work, Louisiana State University, Baton Rouge, LA.
176
Kommalapati R. R., 1994. Soil Flushing o f Non Aqueous Phase Liquids Using Conventional Surfactant Solutions and Colloidal Gas Aphron Suspensions, M.S. Thesis, Louisiana State University, Baton Rouge, LA.
Kongara V., 1994. Application of Surfactant Solutions and Colloidal Gas Aphrons in Flushing Naphthalene from the Soil, M.S. Thesis, Louisiana State University, Baton Rouge, LA.
Laha S., and Luthy R. G., 1991. Inhibition of Phenanthrene Mineralization by Non- Ionic Surfactants in Soil-Water Systems, Environmental Science and Technology, Vol 25(11): 1920-1930.
Laha S ., and Luthy R. G ., 1992. Effects of Non-Ionic Surfactants on the Solubilization and Mineralization of Phenanthrene in Soil-Water Systems, Biotechnology and Bioengineering, Vol 40(11): 1367-1380.
Landrium P. F., Nihart S. R., Eadie B. J., and Graner W. S., 1984. Riverse-Phase Separation Method for Determining Pollutant Binding to Aldrich Humic Acid and Dissolved Organic Carbon of Natural Waters, Environmental Science and Technology, Vol 18(3): 187-192.
Langmuir I. J., 1918. The Adsorption of Gases on Plane Surfaces of Glass, Mica and Platinum, J. American Chemical Society, Vol 40: 1361.
Liu M., 1993. Mobilization o f a Hydrophobic Organic Compound Using Surfactant fo r Soil Washing, Ph. D. Dissertation, Louisiana State University, Baton Rouge, LA.
Liu Z., Laha S., and Luthy R. G., 1991. Surfactant Solubilization of Polycyclic Aromatic Hydrocarbons in Soil Water Suspensions, Water Science and Technology, Vol 23: 475-485.
Liu Z., Edwards D. A., and Luthy R. G., 1992. Sorption of Non-Ionic Surfactants onto Soil, Water Research, Vol 26(10): 1337-1345.
Longe T. A ., 1989. Colloidal Gas Aphrons: Generation, Flow Characterization and Application in Soil and Groundwater Decontamination, Ph. D. Dissertation, Virginia Polytechnic Institute and State University, Blacksburg.
Macdonald J. A., and Kavanaugh M. C., 1994. Restoring Contaminated Groundwater: An Achievable Goal?, Environmental Science and Technology, Vol 28(8)362- 368.
177
Mackay D. M ., and Cherry J. A., 1989. Groundwater Contamination, Pump and Treat, Environmental Science and Technology, Vol 23(6): 630-634.
Mandava S., 1994. Application o f a Natural Surfactant from Sapindus Emarginatus to In-Situ Flushing o f Soils Contaminated with Hydrophobic Organic Compounds, M.S. Thesis, Louisiana State University, Baton Rouge, LA.
Megehee M. M., Clarke A. N., Oma K. H., and Wilson D. J., 1993. Soil Clean-up by Surfactant Washing: IV. Modification and Testing of Mathematical Models Separation Science and Technology, Vol 28(17 & 18): 2507-22527.
Mercer J. W., Skipp D. C., and Giffin D., 1990. Basics o f Pump and Treat Groundwater Remediation Technology, EPA-600/8-90/003, U. S. Environmental Protection Agency, Office of Research and Development, Ada, OK..
Metcalf R. L., Kapoor I. P., Lu P. Y., Schuth C. K., and Sherman P., 1973. Model Ecosystem Studies of the Environmental Fate of Six Organochlorine Pesticides, Environmental Health Perspect., June 1973: 35-44.
Michelsen D. L., Wallis D. A., and Sebba F., 1984. In-Situ Biological Oxidation of Hazardous Organics. Environmental Progress, Vol 3: 103-110.
Michelsen D. L., Wallis D. A., and Lavinder S. R., 1985. In-Situ Biodegradation of Dispersed Organics Using a Microdispersion of Air in Water. Proceedings o f the 5lh National Conference on Management o f Uncontrolled Hazardous Waste Sites, Washington D. C.
Michelsen D. L., Smith J. W., and Suggs J. A., 1988. Use of Colloidal Gas Aphrons for In-Situ Biodegradation of Contaminated Groundwater, Proceedings o f the 14h Annual Hazardous Waste Symposium, United States Environmental Protection Agency, Cincinnati, OH.
Miller M, M., Wasik S. P., Huang G. L., Shiu W. Y., and Mackay D., 1985. Relationships Between Octanol-Water Partition Coefficient and Aqueous Solubility, Environmental Science and Technology, Vol 19(6): 522-529.
Montgomery J. H., and Welkin L. M., 1986. Ground water Chemicals Desk Reference, Lewis Publishers, New York, NY.
Moore T. R., 1985. The Spectrophotometric Determination of Dissolved Organic Carbon in Peat Waters, Soil Science Society o f America Journal, Vol 49:1590- 1592.
178
Morrison R. T., and Boyd R. N., 1986. Organic Chemistry, 2nd edition, Allyn and Bacon, Inc., Boston, MA.
Mueller J. G., Chapman P. J., BlattmannB. O., and Pritchard P. H ., 1990. Isolation and Characterization of a Fluoranthene Utilizing Strain of Pseudomonas Paucomobilis, Applied Environmental Microbiology, Vol 56(4): 1079-1086.
Nash J. H., 1987. Field Studies o f In-Situ Soil Washing, EPA/600/2-87/110, United States Environmental Protection Agency, Cincinnati, OH.
Nakayama K., Fujino H., Kasai R., Tanaka O., and Zhou J., 1986. Saponins of Pericarps of Chinese Sapindus delavayi (Pyi-shiau-tzu), a Source of Natural Surfactant, Chemistry and Pharmaceutical Bulletin , Vol 34(5): 2209-2213.
Oberbremer A., Muller-Hurtig R., and Wagner F., 1990. Effect of Addition of Microbial Surfactants on Hydrocarbon Degradation in a Soil Population in a Stirred Reactor, Applied Microbiology, Biotechnology, Vol 32: 485-489.
Olsen R. L., and Kavanaugh M. C., 1993. Can Groundwater Restoration be Achieved?, Water Environment Technology, Vol 5(3): 42-47.
Oma, K. H., Clarke, A. N., Mutch, R. D., and Wilson, D. J., 1991. Surfactant Flushing/Washing: Design and Preliminary Testing of an Innovative Process for Recovery and Recycle of Surfactant, Presented at the I&EC Special Symposium, American Chemical Society, Atlanta, October 1991.
Oma K. H., Clarke A. N., Megehee M. M., and Wilson D. J., 1993. Soil Clean-up by Surfactant Washing: III. Design and Evaluation of the Integrated Pilot-Scale Surfactant Recycle System, Separation Science and Technology, Vol 28(15 & 16): 2319-2349.
Oommachan M., 1977. The Flora o f Bhopal: Angiosperms, J. K. Jain Brothers, Bhopal, India.
Palmer C. D,, and Fish W., 1992. Chemical Enhancements to Pump and Treat Remediation, EPA/540/S-92/001,United States Environmental Protection Agency, Ada, OK.
Pardue J. H., 1992. Assimilation o f Organic Contaminants in Wetlands: Processes and A Conceptual Model, Ph. D. Dissertation, Louisiana State University, Baton Rouge, LA.
179
Patrick W., 1993, Biogeochemistry o f Wetland Soils and Sediments, Lecture Notes, Louisiana State University, Baton Rouge, LA.
Pennell K. D., Abriola L. M., and Weber W. J., 1993. Surfactant Enhanced Solubilization of Residual Dodecane in Soil Columns: 1. Experimental Investigation, Environmental Science and Technology, Vol 27(12):2332-2340.
Peters R. W., Montemagno C. D., Shem L., and Lewis B., 1992. Surfactant Screening of Diesel-Contaminated Soil, Hazardous Waste and Hazardous Materials, Vol 9(2): 113-136.
Preston W. C., 1948. J. Phys. Colloid Chem. Vol 52: 84.
Quinlivan S., Ghassemi M., and Santy M., 1976. Survey o f Methods Used to Control Wastes Containing Hexachlorobenzene, U. S. Environmental Protection Agency, Office of Solid Waste Management Programs, Washington D. C., EPA-530/SW-120C.
Ranganna S., Sastry M. V., and Siddappa G. S., 1963. Preparation of Saponins from Soapberry, Indian Journal o f Technology Vol 1: 97-98.
Rosen M. J., 1978. Surfactants and Interfacial Phenomena, John Wiley & Sons Ltd., New York.
Rouse J. D., Sabatini D. A., and Harwell J. H., 1993. Minimizing Surfactant Losses Using Twin-Head Anionic Surfactants in Subsurface Remediation, Environmental Science and Technology, Vol 27(10): 2072-2078.
Rouse J. D., Sabatini D. A., Suflita J. M., and Harwell J. H., 1994. Influence of Surfactants on Microbial Degradation of Organic Compounds, Critical Reviews in Environmental Science and Technology, Vol 24(4): 325-370.
Rouse J. D ., Sabatini D. A., and Harwell J. H., 1995. Influence of Anionic Surfactants on Bioremediation of Hydrocarbons, Manuscript in Preparation
Row, L. R., and Rukmini C., 1966a. Chemistry of Saponins: Part 1 - Saponin of Sapindus Mukorossi Gaertn. Indian J. Chemistry, Vol 4: 36-38.
Row, L. R., and Rukmini C., 1966b. Chemistry of saponins: Part II - Saponin of Sapindus Emarginatus Vahl. Indian J. Chemistry, Vol 4: 149-150.
180
Roy D., Valsaraj K. T., and Kottai S., 1992a. Separation of Organic Dyes from Wastewater by Using Colloidal Gas Aphrons, Separation Science and Technology, Vol 27(5): 573-588.
Roy D., Valsaraj K. T., and Tamayo A., 1992b. Comparison of Soil Washing Using Conventional Surfactant Solutions and Colloidal Gas Aphron Suspensions, Separation Science and Technology, Vol 27(12): 1555-1568.
Roy D., Valsaraj K. T., and Constant W. D., 1992c. In-Situ Soil Washing Using Surfactants and Colloidal Gas Aphrons to Enhance Pump and Treat Remediation at the PPI Site. Internal Report Submitted to College of Engineering, Louisiana State University, Baton Rouge, LA.
Roy D., Valsaraj K. T., Constant W. D. and Darji M., 1994. Removal of Hazardous Oily Waste from a Soil Matrix Using Surfactants and Colloidal Gas Aphron Suspensions Under Different Flow Conditions, J. Hazardous Materials, Vol 38: 127-144.
Roy D., Kommalapati R. R., Valsaraj K. T., and Constant W. D., 1995. Soil Flushing of Residual Transmission Fluid: Application of Colloidal Gas Aphron Suspensions and Conventional Surfactant Solutions, Water Research, Vol 29(2): 589-595.
Sabatini D., Rouse J., Lipe M., and Harwell J., 1992. Surfactant Enhanced Subsurface Remediation: Minimization of Surfactant Losses and Recovery of Surfactant, Ground Water, Vol 30(5):795.
Sarin J. L., and Beri M. L., 1939. Extraction of Saponin from Soap Nut, Industrial and Engineering Chemistry, Vol 31(6): 712-713.
Schmitt E, K., and Caplan J. A., 1987. In-Situ Biological Clean-up of Petroleum Hydrocarbons in Soil and Groundwater, Proceedings o f the 5lh Annual Hazardous Materials Management Conference, June 9-11, 1987, Atlantic City, NJ.
Sebba F., 1971. Microfoams- An Unexplored Colloid System, J. Colloid and Interface Science, Vol 35(4): 643-646.
Sebba F., and Barnett S. M., 1981. Separations Using Colloidal Gas Aphrons, Proceedings o f 2 nd World Congress o f Chemical Engineering, Montreal, Vol IV: 27-31.
181
Sebba F., 1982, Investigation o f the Modes o f Contaminant Capture in CGA (.MGD) Foams, Report OWRT/RU-82/10 to U. S. Department of the Interior, Office of Water Research and Technology.
Sebba F., 1985a. An Improved Generator for Micron Sized Bubbles, Chemistry and Industry, Feb 1985, 91-92.
Sebba F., 1985b. Separations Using Aphrons, Separation and Purification Methods, Vol 14(1): 127-148.
Shea, P. T., and Barnett, S. M., 1979. Flotation Separation Using Micro Gas Dispersion, Separation Science and Technology, Vol 14(9):757-762.
Shetty, M. S., 1972. The Use of Ritha Powder as an Air- Entraining Agent. Indian Concrete Journal, Vol. 46: 116-122.
Sims J. L., Suflita J. M., and Russell H. H., 1990. Reductive Dehalogenation o f Organic Contaminants in Soils and Ground Water, Ground Water Issue, EPA/540/4-90/054, United States Environmental Protection Agency, Washington D. C.
Singhal N., and Roy D., 1988. Modeling Kinetics of 2,4-D Degradation by Two New Pseudomonas Isolates, The Chemical Engineering Journal, Vol 39: B37-B45.
Spence J. T., Cotton J. W., Underwood B. J., and Duncan C. P., 1983. Elementary Statistics, 4th edition, Prentice-Hall, Inc., Englewood Cliffs, NJ.
Suggs J. A., 1987. Generation o f Microbubble Foam Using a Packed Bed, M. S. Thesis, Virginia Polytechnic Institute and State University, Blacksburg, VA.
Swisher R. D., 1987. Surfactant Biodegradation, 2nd edition, Marcel Dekker Inc., New York, NY.
Tamayo A., 1991. Application o f Surfactant and Colloidal Gas Aphrons in Washing Soils Contaminated with 2,4-D, M.S. Thesis, Louisiana State University, Baton Rouge, LA.
Tanford C., 1980. The Hydrophobic Effect: Formation o f Micelles and Biological Membranes. Wiley, New York, NY.
Thangamani S., and Shreve G. S., 1994. Effect of Anionic Biosurfactant on Hexadecane Partitioning in Multiphase Systems, Environmental Science and Technology, 28(12): 1993-2000.
182
Tiehm A., 1994. Degradation of Polycyclic Aromatic Hydrocarbons in the Presence of Synthetic Surfactants, Applied Environmental Microbiology, Vol 60(1):258- 263.
Travis C. C., and Doty C. B., 1990, Can Contaminated Aquifers at Superfund Sites be Remediated?, Environmental Science and Technology, 24(10): 1464-1466.
Tukey J. W., 1953. The Problem o f Multiple Comparisons, (mimeographed) Princeton, NJ.
Underwood J. L., Debelak K. A. Wilson D. J., and Means J. M., 1993a. Soil Cleanup by In-Situ Surfactant Flushing: V. Micellar Solubilization of Some Aromatic Contaminants, Separation Science and Technology, Vol 28(8): 1527-1537.
Underwood J. L., Debelak K. A., and Wilson D. J., 1993b. Soil Clean-up by In-Situ Surfactant Flushing: VI. Reclamation of Surfactant for Recycle, Separation Science and Technology, Vol 28(9): 1647-1669.
Underwood J. L., Debelak K. A., and Wilson D. J., 1995. Soil Clean-up by In-Situ Surfactant Flushing: VII. Determination of Mass Transfer Coefficients for Reclamation of Surfactant for Recycle, Separation Science and Technology, Vol 30(l):73-87.
United States Environmental Protection Agency, 1988. Technology Screening Guide fo r Treatment o f CERCLA Soils and Sludges, Office of Solid Waste and Emergency Response, EPA/540/2-88/004, Washington D. C.
United States Environmental Protection Agency, 1993. The Superfund Innovative Technology Evaluation Program, Office of Solid Waste and Emergency Response and Office of Research and Development, EPA/540/R-93/525, Washington D. C.
United States Environmental Protection Agency, 1991, Guide fo r Conducting Treatability Studies Under CERCLA: Soil Washing, EPA/540/2-91/20B.
United States General Accounting Office, 1986. Hazardous Waste :EPA’s Considerations o f Permanent Remedies, GAO/RCED 86-178BR, July, 1986.
Uphof, J. C. T, 1968. Dictionary o f Economic Plants. Cramer, L. J, New York. NY.
Uppal I. S. and Mehta R. L., 1951. Industrial Utilization of Saponin as Textile Auxiliary: Part I - Wetting and Lime soap Dispersing Properties, J. Sci. and Indust. Res. Vol 10B: 190-195.
183
Usher, G., 1974. A Dictionary o f Plants Used by Man. Hafner Press, New York, NY.
Valsaraj K. T., Gupta A., Thibodeaux L. J., and Harrison D. P., 1988. Partitioning of Low Molecular Weight Aliphatic Hydrocarbons Between Aqueous Phase and Surfactant Micelle Phases, Water Research, Vol 22(9): 1173-1183.
Valsaraj K. T., and Thibodeaux L. J., 1989. Relationships BetweenMicelle-Water and Octanol-Water Partition Constants for Hydrophobic Organics of Environmental Interest, Water Research, Vol 23(1): 183-189.
Van Hoof P. L., and Rogers J. F., 1992. Influence of Low Levels of Non-Ionic Surfactants on the Aerobic Dechlorination of Hexachlorobenzene, in Biosystems Technology Development Program. Bioremediation o f Hazardous Wastes, EPA/600/R-92/126, United States Environmental Protection Agency, Washington D. C.
Vigon B. W., and Rubin A. J., 1989. Practical Considerations in Surfactant Aided Mobilization of Contaminants in Aquifers, J. Water Pollution Control Federation, Vol 61(7): 1233-1240.
Void R. D., and Void M. J., 1983. Colloid and Interface Chemistry, Addison-Wesley, Reading, MA.
Wan J., and Wilson J. L., 1992, Colloid Transport and the Gas-Water Interface in Porous Media, in Transport and Remediation o f Subsurface Contaminants, Sabatini D. A., and Knox R. C. (eds.), ACS Symposium Series 491, American Chemical Society,Washington D.C.
Wark, K., and Warner, C. F., 1981. Air pollution: Its Origin and Control. Harper & Row, New York, NY.
Wayt H. J., and Wilson D. J., 1989. Soil Cleanup by In-Situ Surfactant Flushing: II. Theory of Micellar Solubilization. Separation Science and Technology, Vol 24(12 & 13): 905-937.
Wershaw R. L., Burcar P. J., and Goldberg M. C., 1969. Interaction of Pesticides with Natural Organicc Material, Environmental Science and Technology, Vol 3(3): 271-273.
West, C. C., and Harwell, J. H., 1992. Surfactants and Subsurface Remediation, Environmental Science and Technology, Vol 26(12): 2324-2330.
184
Wilson D. J., 1989. Soil Clean-up by In-Situ Surfactant Flushing: I. Mathematical Modeling, Separation Science and Technology, Vol 24(11): 863-892
Wilson D. J., and Clarke A. N,, 1991. Soil Clean-up by In-Situ Surfactant Flushing: IV. A Two-Component Mathematical Model. Separation Science and Technology, Vol 26(9): 1177-1194.
Wilson S. B., 1986. In-Situ Biosurfactant Production: An Aid to Biodegradation of Organic Groundwater Contaminants, Proceedings o f the NWWA/API Conference on Petroleum Hydrocarbons and Organic chemicals in Groundwater: Prevention, Detection and Restoration, November 13-15, 1985, Houston, TX.
Windholz M.,(ed) 1983. The Merck Index: An Encyclopedia o f Chemicals, Drugs, and Biologicals, Merck & Co., Inc., Rathway, NJ.
APPENDIX
A generalized custom half reaction for the oxidation of an unknown organic is