27
Remote Sensing • Geographic Information Systems • Global Positioning Systems

Remote Sensing • Geographic Information Systems • Global Positioning Systems

Lei JiDepartment of GeographyUniversity of Nebraska-Lincoln
AVHRR-NDVI: Jan 1999
AVHRR-NDVI: July 1999
Assessing Seasonal VegetationResponse to Drought

Introduction
Drought and drought indices, e.g. Standardized PrecipitationIndex (SPI)
Use of AVHRR – NDVI in detecting vegetation vigor anddrought
Relationship between NDVI and SPI
Objectives
Determine seasonal NDVI response to moisture
Determine relationship between NDVI and SPI
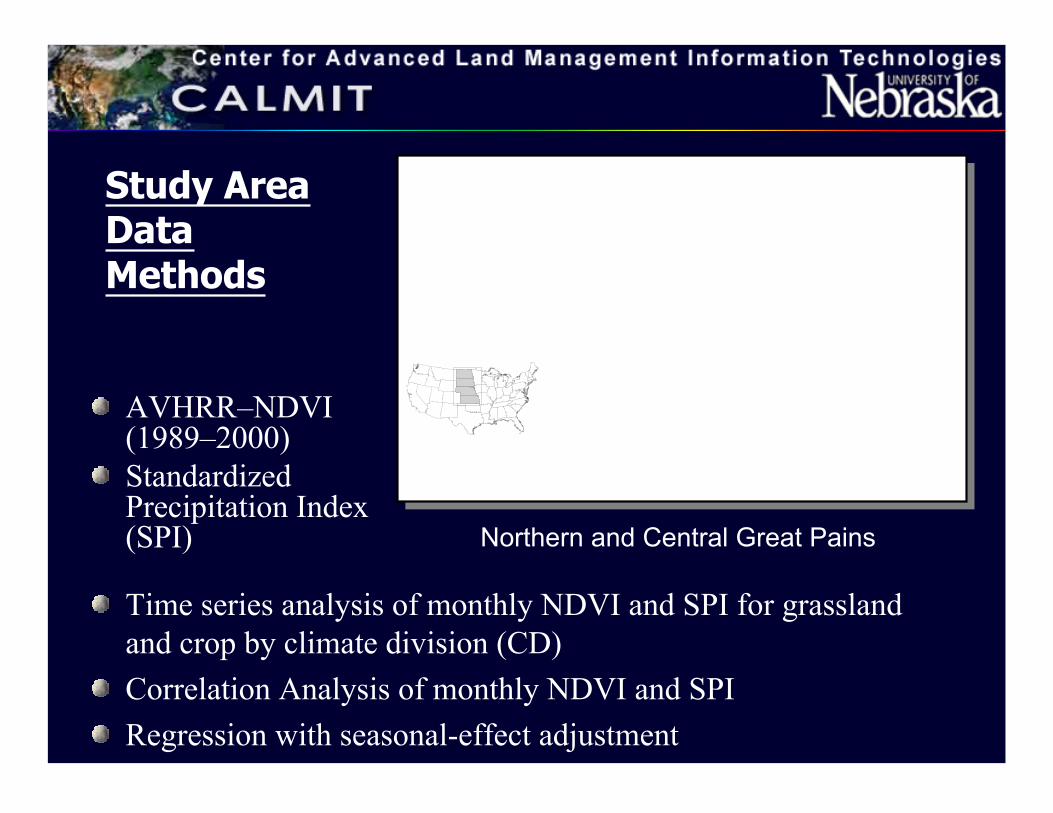
Study AreaDataMethods
AVHRR–NDVI(1989–2000)StandardizedPrecipitation Index(SPI)
Time series analysis of monthly NDVI and SPI for grasslandand crop by climate division (CD)
Correlation Analysis of monthly NDVI and SPI
Regression with seasonal-effect adjustment
Northern and Central Great Pains

Results
GrasslandNebraska North-central CD
CroplandNebraska Northeastern CD
Correlation of monthly NDVI and SPI
NDVI Correlation Coefficient

Relationship between vegetation condition and moistureavailability is strong
Relationship varies with growth stage
Use of NDVI for drought monitoring requires considerationof the seasonal effect
ConclusionsConclusions
Regression Model Test
p = 0.0027
R2 = 0.123
p < 0.0001
R2 = 0.792
Cropland
northeastern CD
p = 0.0016
R2 = 0.135
p < 0.0001
R2 = 0.674
Grassland
North-central CD
Simple RegressionSeasonal Adjusted
RegressionLand Cover

Andrés Viña
CALMIT
University of Nebraska-Lincoln
December, 2002
Effects of Corn Tassel on Canopy Optical Measurements

Objective
To evaluate the effects of corn tassels (flowers)on canopy optical measurements, specifically:
• Spectral regions of maximal effect
• Vegetation indices
• Leaf Area Index estimation

Results – Reflectance
With Tassels
Without Tassels
Lup
Ednρρρρλλλλ = (L↑↑↑↑λλλλ/E↓↓↓↓λλλλ)
0
5
10
15
20
25
30
35
40
45
50
400 500 600 700 800 900
Wavelength (nm)
Ref
lect
ance
(%
)
0
5
10
15
20
25
30
Rel
ativ
e D
iffe
renc
e (%
)
With Tassel
Without Tassel
RelativeDifference
0
0.1
0.2
0.3
0.4
0.5
0.6
0.7
0.8
0.9
1
150 170 190 210 230 250 270 290
Day of the Year
ND
VI
-0.3
-0.2
-0.1
0
0.1
0.2
0.3
0.4
0.5
0.6
0.7
VA
RI
VARI
NDVI
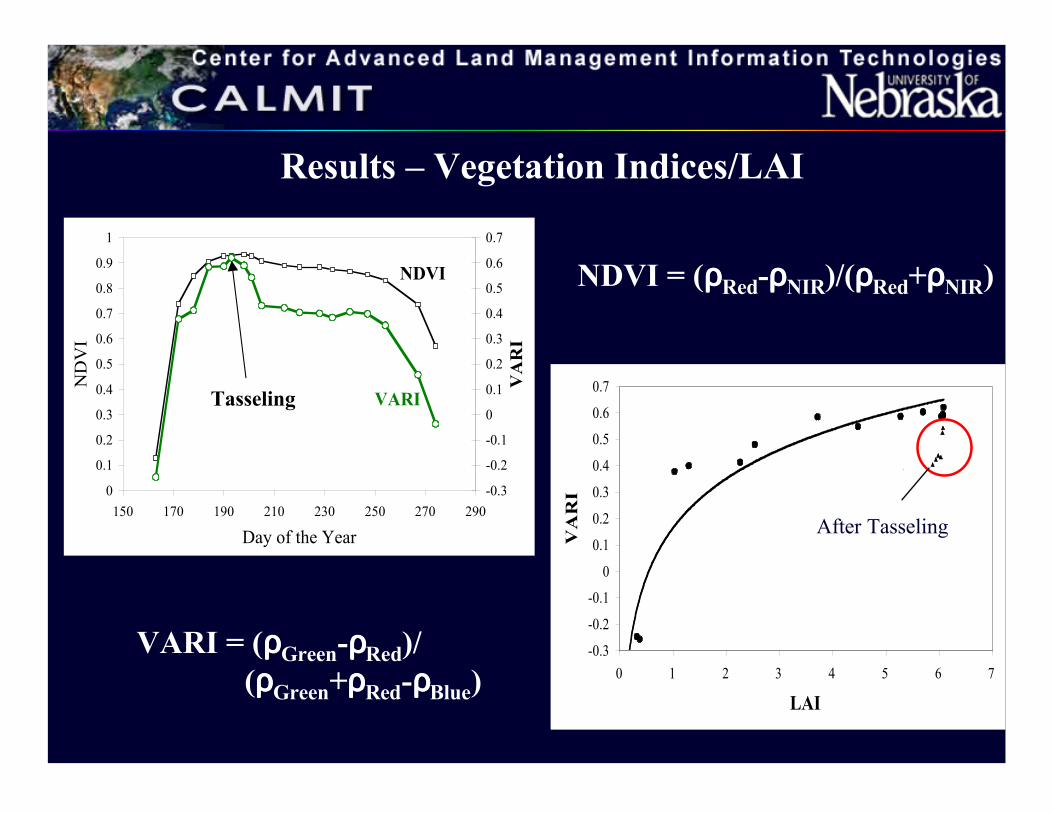
Results – Vegetation Indices/LAI
NDVI = (ρρρρRed-ρρρρNIR)/(ρρρρRed+ρρρρNIR)
VARI = (ρρρρGreen-ρρρρRed)/(ρρρρGreen+ρρρρRed-ρρρρBlue)
-0.3
-0.2
-0.1
0
0.1
0.2
0.3
0.4
0.5
0.6
0.7
0 1 2 3 4 5 6 7
LAI
VA
RI
After Tasseling
Tasseling

Conclusions
• The red region (around 676 nm) showed themaximum relative response to theappearance of tassels.
• NDVI showed little or no sensitivity to thetassel.
• VARI showed high sensitivity to the tassel.
• VARI is a good estimator of LAI, althoughits predictive capability is reduced whentassels appear.
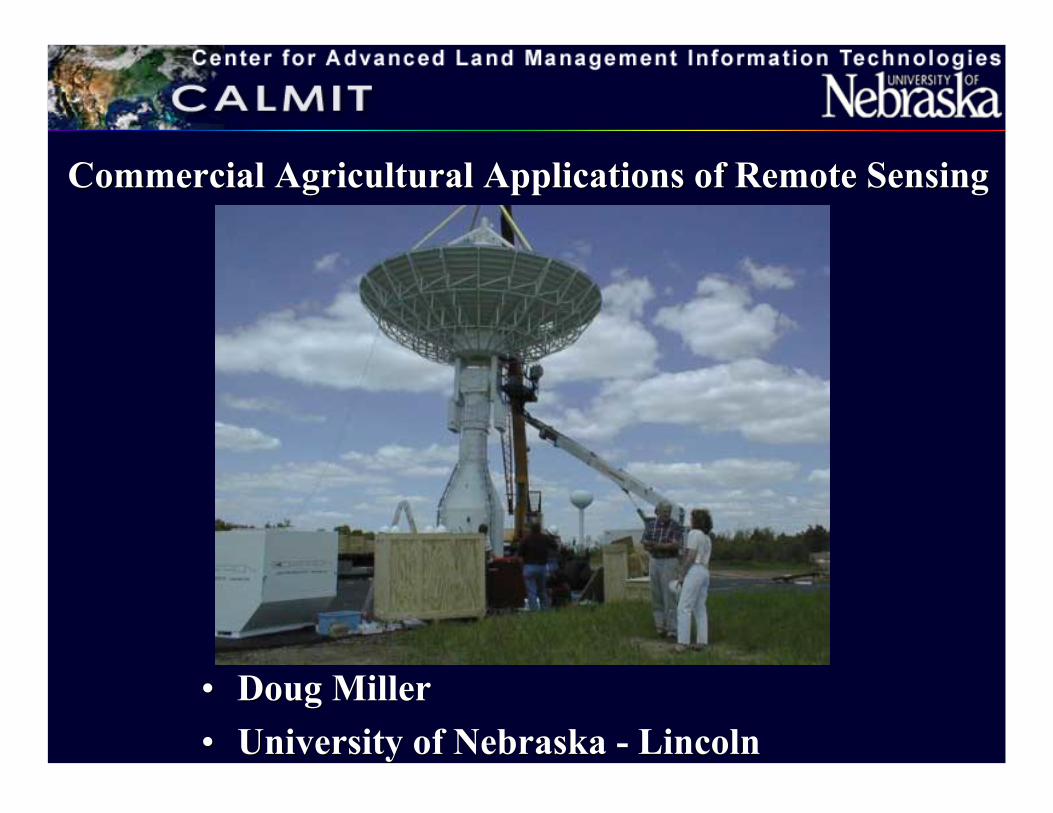
•• Doug MillerDoug Miller
•• University of Nebraska - LincolnUniversity of Nebraska - Lincoln
Commercial Agricultural Applications of Remote SensingCommercial Agricultural Applications of Remote Sensing

Types of Data RequiredTypes of Data RequiredBusiness ObjectivesBusiness Objectives
IBM Joint Application Development SessionIBM Joint Application Development SessionKansas City, MissouriKansas City, Missouri
March 1994March 1994
•• Make MoneyMake Money
•• Effective SupportEffective Support
•• Speed up DecisionSpeed up DecisionMakingMaking
•• Provide Fast Accurate,Provide Fast Accurate,& User Friendly& User FriendlyInformationInformation
•• Environmental ModelingEnvironmental Modeling
•• Crop ConditionsCrop Conditions
•• Soil PropertiesSoil Properties
•• Crop Production (Yield)Crop Production (Yield)
•• WeatherWeather
•• Agronomic PracticesAgronomic Practices
•• Incidence of Disease and insectIncidence of Disease and insectdamagedamage

•• Reasonably PricedReasonably Priced
•• Timely DeliveryTimely Delivery
•• PrecisePrecise
•• Reliable AccuracyReliable Accuracy
•• Current - Updated Daily (Projected/Actual)Current - Updated Daily (Projected/Actual)
•• Fits Market StructureFits Market Structure
Product ParametersProduct Parameters

Defining Market Segments in AgricultureDefining Market Segments in Agriculture
•• Who Collects Data?Who Collects Data?•• How is it used?How is it used?•• Define information sourcesDefine information sources•• Design vendor products promoting addedDesign vendor products promoting added
value products for farmersvalue products for farmers
View GPSWeather HelpModelsTSA
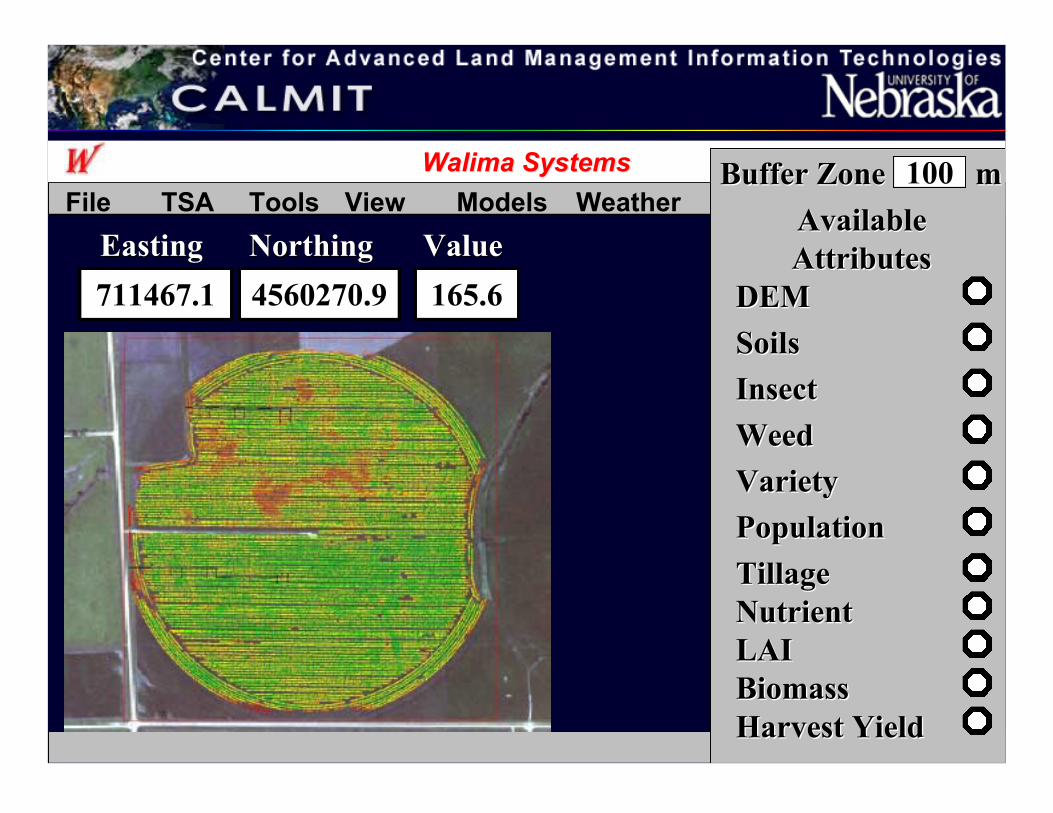
Walima SystemsWalima Systems
ReportsFile Tools
EastingEasting NorthingNorthing ValueValue
711467.1 4560270.9 165.6
Buffer ZoneBuffer Zone 100 mm
AvailableAvailableAttributesAttributes
DEMDEM
SoilsSoils
InsectInsect
WeedWeed
VarietyVariety
PopulationPopulation
TillageTillageNutrientNutrientLAILAIBiomassBiomassHarvest YieldHarvest Yield

ALGORITHMS FOR REMOTE ESTIMATIONOF WATER QUALITY
Giorgio Dall’OlmoCenter for Advanced Land Management Information Technologies,
School of Natural Resource Sciences,
University of Nebraska-Lincoln
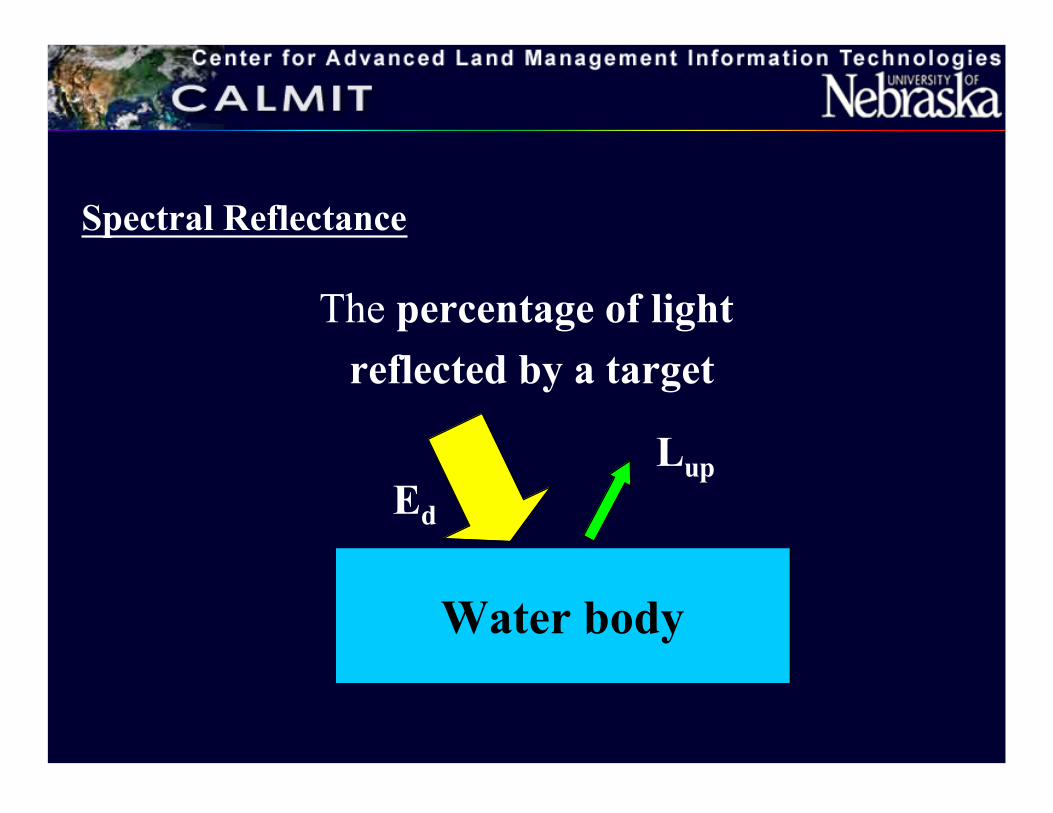
The percentage of light
reflected by a target
Water body
Ed
Lup
Spectral Reflectance

0
1
2
3
4
5
400 500 600 700 800 900
Wavelength, nm
Ref
lect
ance
, %
High[Chl-a]
Low[Chl-a]

Spectral Indices
Combinations of reflectance
values at different wavelengths

Results: Chl-a model validation
0
50
100
150
0 50 100 150
OBSERVED, mg/m3
PR
ED
ICT
ED
, mg
/m3
1:1
STE = 9 mg/m 3

Geospatial Technologies for Homeland Security
Featured in PE&RS September 2002, Volume 68, Number 9
Jeff Arnold

Emergency Services,Notification andEvacuation Mapping
Critical and SensitiveFacilities Inventory
Special NeedsPopulationDetermination
Risk Assessment and Preparation
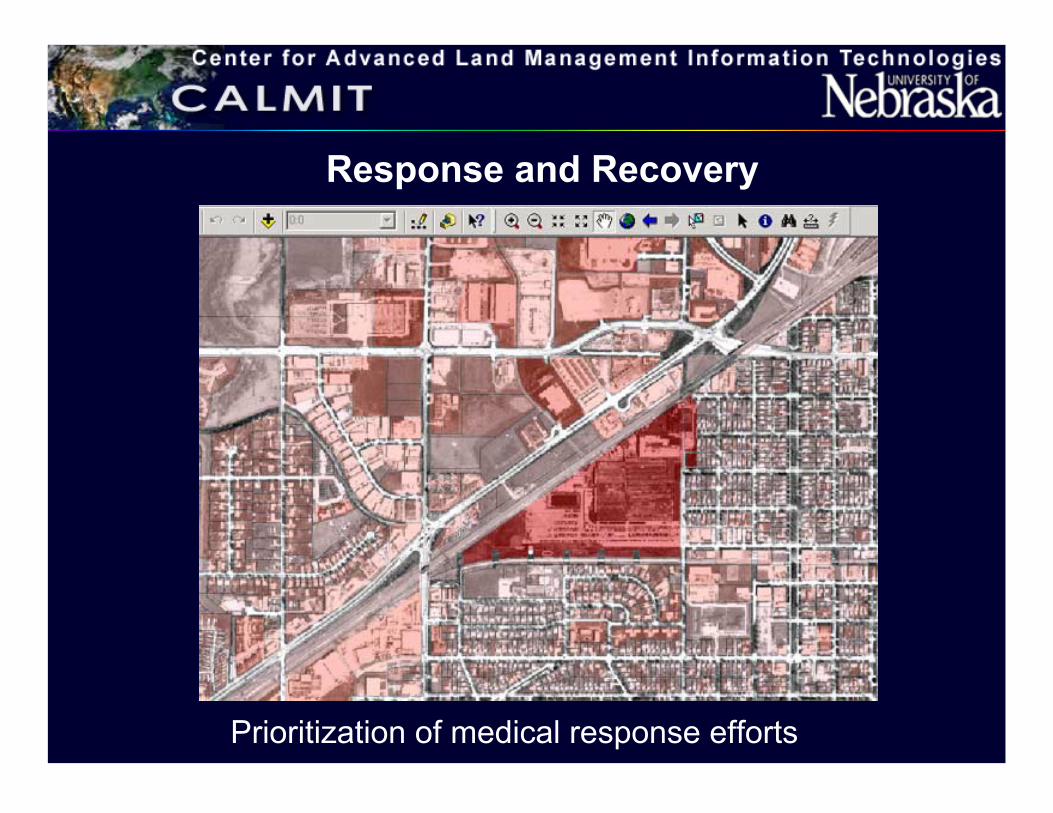
Prioritization of medical response efforts
Response and Recovery

On-line maps with query capabilities
Information Distribution
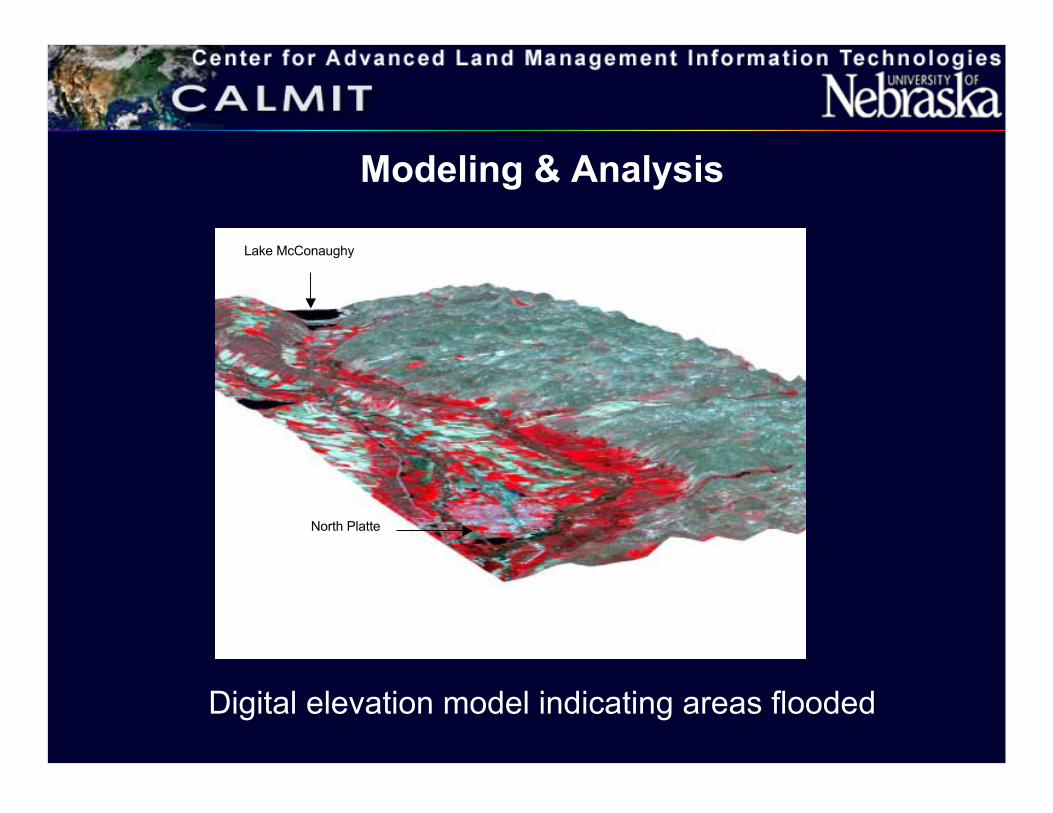
Modeling & Analysis
Lake McConaughy
North Platte
Digital elevation model indicating areas flooded

Remote Sensing • Geographic Information Systems • Global Positioning Systems


