Int. J. Wildland Fire 6(3): 125-136,1996 O IAWF. Printed in USA. Remote Sensing of Forest Fire Severity and Vegetation Recovery Joseph D. White1, Kevin C. Ryan2, Carl C. Key3,and Steven W. Running1 'Numerical Terradynamics Simulation Group, School of Forestry, University of Montana, Missoula, MT, 59812, Tel. 406 243 5616; Fax 406 243 4510; email: [email protected], [email protected]. *USDAForest Service, Intermountain Fire Sciences Laboratory, P.O. Box 8089, Missoula, MT, 59807, Tel. 406 543 4830; Fax 406 329 4800; [email protected]. 3National Biological Service, Glacier National Park, West Glacier, MT, 59936, Tel. 406 888 5441; Fax ; emai1:[email protected]Abstract. Burned forested areas have patterns of varying burn severity as a consequence of various topographic, vegetation, and meteorological factors. These patterns are detected and mapped using satellite data. Other ecological information can be abstracted from satellite data regarding rates of recovery of vegetation foliage and variation of burn severity on different vegetation types. Middle infra- red wavelengths are useful for burn severity mapping because the land cover changes associated with burning increase reflectance in this part of the electromagnetic spectrum. Simple stratification of Landsat Thematic Mapper data define varying classes of burn severity be- cause of changes in canopy cover, biomass removal, and soil chemical composition. Reasonable maps of burn se- verity are produced when the class limits of burn severity reflectance are applied to the entire satellite data. Changes in satellite reflectance over multiple years reveal the dy- namics of vegetation and fire severity as low burn areas have lower changes in reflectance relative to high burn areas. This results as a consequence of how much the site was altered due to the burn and how much space is available for vegetation recovery. Analysis of change in reflectance across steppe, riparian, and forested vegetation types indi- cate that fires potentially increase biomass in steppe areas, while riparian and forested areas are slower to regrow to pre-fire conditions. This satellite-based technology is useful for mapping severely burned areas by exploring the ecological manifestations before and after fire. Keywords: Vegetation recovery; Glacier National Park; Burn severity; Landsat Thematic Mapper; Reflectance; Classification Introduction Fire burned landscapes are suitable targets for remote sensing research because of the obvious physical changes the fire has on the land cover. Characteristic changes of burned areas include canopy consumption, ground char- ring, and soil color alteration. These characterisitics are detectable using satellite sensors if the patch size of the burn is within the resolution range of the satellite sensor. Remote sensing is a useful tool for mapping the extent of the burn, understanding the biological responses due to differential surface heating (i.e. fire severity), and quanti- fying the extent and pattern of these burned areas. Classification and analysis of burned areas using re- mote sensing requires some knowledge of the land cover disturbance effect on reflection of electromagnetic energy. Variation in spectral response following fire is a function of severity and vegetation type. Based on the Landsat MSS spectral data, Jakubauskas et al. (1990) found that burn severity was detected differently among conifers, decidu- ous trees, and shrubs because of differences in re-vegeta- tion patterns among these communities. The re-establish- ment of vegetation is very important as it relates to the detection of fire severity because more severely burned areas have less vegetation cover and different radiation budgets in post-fie years (Hall et al. 1980). Jakubauskas (1988) used GIs technology to assess changes in spectral responses and vegetation classifications for three time pe- riods. As expected, vegetative recovery was retarded on severely burned sites. Fire has a significant effect on the reflective properties of the land surface due to vegetation removal, soil exposure, and soil color alteration making the observation of fire severity by spectral data possible (Jakubauskas, et al. 1990; Milne, 1986). Pre-fire vegeta- tion conditions also influence spectral classification of burn severity. Turner, et al. (1994) mapped burn severity in Yellowstone National Park using Landsat TM data and found some bias for particular severity classes that were attributed to pre-existing conditions such as pine-beetle infestations and stand fire history. Ryan and Noste (1985) developed a classification sys- tem for qualifying fire severity in wildland fires. Fire se- verity is a descriptive term that integrates the physical, chemical, and biological changes on a site as a result of fire disturbance. The classification system provides a physical description for assessing the heat impact on over- and understory vegetation and soils. This system is used
Transcript
Int. J . Wildland Fire 6(3): 125-136,1996 O IAWF. Printed in U S A .
Remote Sensing of Forest Fire Severity and Vegetation Recovery
Joseph D. White1, Kevin C. Ryan2, Carl C. Key3, and Steven W. Running1
'Numerical Terradynamics Simulation Group, School of Forestry, University of Montana, Missoula, MT, 59812, Tel. 406 243 5616; Fax 406 243 4510; email: [email protected], [email protected].
3National Biological Service, Glacier National Park, West Glacier, MT, 59936, Tel. 406 888 5441; Fax ; emai1:[email protected]
Abstract. Burned forested areas have patterns of varying burn severity as a consequence of various topographic, vegetation, and meteorological factors. These patterns are detected and mapped using satellite data. Other ecological information can be abstracted from satellite data regarding rates of recovery of vegetation foliage and variation of burn severity on different vegetation types. Middle infra- red wavelengths are useful for burn severity mapping because the land cover changes associated with burning increase reflectance in this part of the electromagnetic spectrum. Simple stratification of Landsat Thematic Mapper data define varying classes of burn severity be- cause of changes in canopy cover, biomass removal, and soil chemical composition. Reasonable maps of burn se- verity are produced when the class limits of burn severity reflectance are applied to the entire satellite data. Changes in satellite reflectance over multiple years reveal the dy- namics of vegetation and fire severity as low burn areas have lower changes in reflectance relative to high burn areas. This results as a consequence of how much the site was altered due to the burn and how much space is available for vegetation recovery. Analysis of change in reflectance across steppe, riparian, and forested vegetation types indi- cate that fires potentially increase biomass in steppe areas, while riparian and forested areas are slower to regrow to pre-fire conditions. This satellite-based technology is useful for mapping severely burned areas by exploring the ecological manifestations before and after fire.
Fire burned landscapes are suitable targets for remote sensing research because of the obvious physical changes the fire has on the land cover. Characteristic changes of burned areas include canopy consumption, ground char- ring, and soil color alteration. These characterisitics are
detectable using satellite sensors if the patch size of the burn is within the resolution range of the satellite sensor. Remote sensing is a useful tool for mapping the extent of the burn, understanding the biological responses due to differential surface heating (i.e. fire severity), and quanti- fying the extent and pattern of these burned areas.
Classification and analysis of burned areas using re- mote sensing requires some knowledge of the land cover disturbance effect on reflection of electromagnetic energy. Variation in spectral response following fire is a function of severity and vegetation type. Based on the Landsat MSS spectral data, Jakubauskas et al. (1990) found that burn severity was detected differently among conifers, decidu- ous trees, and shrubs because of differences in re-vegeta- tion patterns among these communities. The re-establish- ment of vegetation is very important as it relates to the detection of fire severity because more severely burned areas have less vegetation cover and different radiation budgets in post-fie years (Hall et al. 1980). Jakubauskas (1988) used GIs technology to assess changes in spectral responses and vegetation classifications for three time pe- riods. As expected, vegetative recovery was retarded on severely burned sites. Fire has a significant effect on the reflective properties of the land surface due to vegetation removal, soil exposure, and soil color alteration making the observation of fire severity by spectral data possible (Jakubauskas, et al. 1990; Milne, 1986). Pre-fire vegeta- tion conditions also influence spectral classification of burn severity. Turner, et al. (1994) mapped burn severity in Yellowstone National Park using Landsat TM data and found some bias for particular severity classes that were attributed to pre-existing conditions such as pine-beetle infestations and stand fire history.
Ryan and Noste (1985) developed a classification sys- tem for qualifying fire severity in wildland fires. Fire se- verity is a descriptive term that integrates the physical, chemical, and biological changes on a site as a result of fire disturbance. The classification system provides a physical description for assessing the heat impact on over- and understory vegetation and soils. This system is used
White, J.D., Ryan, K.C., Key, C.C., and Running, S.W.
for describing fire effects at the field level but is also applicable to remote sensing because the discriminating features are detectable from satellite data.
In this paper, we demonstrate the use of remote sens- ing for identifying areas of differing burn severity and evaluating the spectral changes in these burned areas over multiple years to assess vegetation response. The pur- pose of this paper is to a) describe how field evaluation of burn severity is related to spectral response, b) iden- tify what ecological changes affect spectral response to fire over time, and c) use this information to map burn severity using satellite data.
Methodology
Study Area
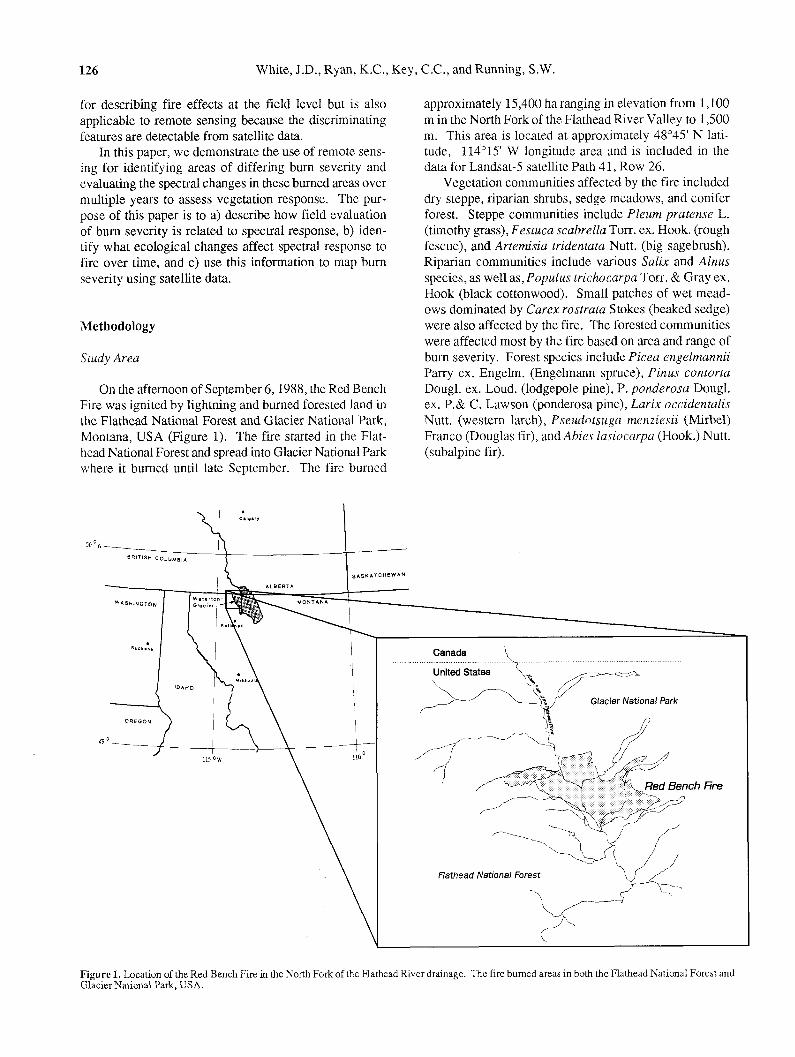
On the afternoon of September 6,1988, the Red Bench Fire was ignited by lightning and burned forested land in the Flathead National Forest and Glacier National Park, Montana, USA (Figure 1). The fire started in the Flat- head National Forest and spread into Glacier National Park where it burned until late September. The fire burned
approximately 15,400 ha ranging in elevation from 1,100 m in the North Fork of the Flathead River Valley to 1,500 m. This area is located at approximately 48'45' N lati- tude, 114O15' W longitude area and is included in the data for Landsat-5 satellite Path 4 1, Row 26.
Vegetation communities affected by the fire included dry steppe, riparian shrubs, sedge meadows, and conifer forest. Steppe communities include Pleum pratense L. (timothy grass), Festuca scabrella Torr. ex. Hook. (rough fescue), and Artemisia tridentata Nutt. (big sagebrush). Riparian communities include various Salix and Alnus species, as well as, Populus trichocarpa Tom. & Gray ex. Hook (black cottonwood). Small patches of wet mead- ows dominated by Carex rostrata Stokes (beaked sedge) were also affected by the fire. The forested communities were affected most by the fire based on area and range of burn severity. Forest species include Picea engelmannii Parry ex. Engelm. (Engelmann spruce), Pinus contorta Dougl. ex. Loud. (lodgepole pine), P. ponderosa Dougl. ex. P.& C. Lawson (ponderosa pine), Larix occidentalis Nutt. (western larch), Pseudotsuga menziesii (Mirbel) Franco (Douglas fir), and Abies lasiocarpa (Hook.) Nutt. (subalpine fir).
Canada 1 United States
Glacier National Park
Fire
flathead National Forest .. Figure 1. Location of the Red Bench Fire in the Xorth Fork of the Flathead Rwer drainage. The fire burned areas in both the Flathead National Forest and Glacier National Park, USA.
- Remote Sensing of Forest Fires Severity and Vegetation Recovery - 127
From pre-fire surveys, P. contorta dominated the burned area by approximately 50 percent. Within these forests, infestations of mountain pine beetle (Dendroctus ponderosae Hopk.) had caused massive defoliation and mortality. This condition provided ample fuel for carry- ing the fire across the landscape and promoting very hot, intense burns.
Satellite Data Processing
Three Landsat TM data, one pre-fire and two post- fire, from August 28,1988, September 20,1989, and Sep- tember 3, 1990 were obtained for investigating the ther- modynamic and ecological effects of the fire on the veg- etated landscape. The data were subsetted to include the Red Bench Fire area and a periphery of area outside the fire. The data were georectified using a nearest-neighbor technique with a 30 by 30 m resolution. The reflective band TM data (Table 1) were scaled to radiance values (L,) from the original digital numbers (DN)
using gain (G) and offset (0) values from the CCT header files. Radiance measured by the satellite is a combina- tion of:
scattered incoming radiation by atmospheric particles, path radiance (Lp), and surface radiance (Ls) reduced by the transmittance of the atmosphere (T). Transmittance refers to the selective absorption of wavelengths by aero- sols present in the atmosphere at a given time. Path radi- ance was reduced using the "clear-lake" method (Jensen 1986). Minimum radiance values were selected from large, deep lakes in the region and were subtracted from the ra- diance value of each band.
Atmospheric transmittance differences among scene dates were minimized by calculating linear regression models between the '88-89 and '88-90 data pairs (Coppin and Bauer, 1992; Casselles andLopez Garcia, 1989). From outside the burn area, 21 points were chosen to represent a range of reflectance values from landcover types includ- ing water, bare ground, and forests. Regression coeffi- cients were calculated from these data (Table 2) and were used to model radiance values for 1989 and 1990.
Sun-angle differences also affect radiance values by changing the flux density of radiation per unit ground sur- face. To account for sun angle difference, L values were converted to reflectance (R) values using the following equation:
7t . L, R, =
Es, . cos ps ( 3 )
Table 1. Landsat Thematic Mapper bands and corresponding electromagnetic energy wavelengths.
TM Band No. Wavelength @m)
where Es, is the exoatmospheric solar irradiance value in- tegrated for each TM bandwidth, i , and ps is the incident solar zenith (Markham and Barker, 1985; Leprieur, et al., 1988; Chavez, 1989).
The 1989 data contained a large horizontal stripe with 10 lines of missing data. Unfortunately, this stripe passed through the northern section of the burn area. Data were interpolated into the missing lines using an inverse dis- tance weighted average technique (Isaaks and Srivastava, 1989). Three pixels north and three south were used as reference to the missing pixel. This process created a pattern of reflectance values across the stripe which main- tained the general spatial pattern of the area in the north- south direction.
Post-Fire Spectral Analysis
In October of 1988, 36 permanent plots were estab- lished in the burn area and were sampled for pre-fire veg- etation, age class, and burn severity. Plots were selected to represent a range of burn severities and were located before sampling on 1: 15,840 scale aerial photos taken af- ter the fire. Plots were classified into three levels burn
Table 2. Regression coefficients and statistics for comparisons between the pre-fire, 1988, and post-fire, 1989 and 1990, radiance values (mW ~ m - ~ p m - ' ) . Regressionmodel is in the form y =m+b. Models created by comparing points outside of burn area across a variety of landcover types.
Image and m b r2 SEE Band
128 White, J.D., Ryan, K.C., Key, C.C., and Running, S.W
Table 3. Field bum severity classification criteria (after Ryan and Noste, 1985).
Bum Litter Soil Fuel Vegetation Severity
Light not consumed
moderate completely consumed
high completely consumed
not few small fuel some scorch, esp. altered consumed shrubs
darkened w/ small fuels small diameter trees white ash consumed and shrubs killed
stability lost, small and medium all vegetation kllled, reddish w/ white fuels consumed incl. rhizomes ash
severity (after Ryan and Noste, 1985), light, moderate, and high (Table 3) and described based on using three generalized vegetation categories, steppe, riparian, and forest. All sites were located on 1:24,000 scale topo- graphic maps for reference.
Reflectance values of the sample sites were extracted from the three TM images using a 3 by 3 window. This "windowing" technique was used to minimize the effects of random errors associated with the satellite data (Conese, et nl., 1988). Plot s i~es were inspected visually in the 1988 satellite data to assess homogeneity of landcover. Some plots were located close to water and bare ground so it was necessary to ensure that non-vegetated reflec- tance were not included in the pixel extraction.
The spectral data were evaluated for the areas of dif- ferent burn severity by assessing pre- and post-fire spec- tral reflectance for each band. Average reflectance across the reflective bandwidths were calculated for each burn class and cover type. Inter-annual reflectance difference was calculated by subtracting the reflectance of one year from the previous year. This was calculated for '88-89, '88-90, and '89-90 reflectance. This analysis helped de- termine what spectral data and year contained the most distinguishing information for mapping burn severity. We limited this analysis to bands 3, 4, 5 , and 7 because a) band 3 was demonstrative of most visible energy reflec- tion, b) band 4 is sensitive to vegetation regeneration and cover (Butera, 1986; Fiorella and Ripple, 1993), c) bands 5 and 7 wavelengths are sensitive to ground exposure (Murphy and Wadge, 1994) and soil color differences (Stoner and Baumgardner, 1981), and d) band 6 was cor- related with band 5 and is also sensitive to surface tem- peratures that are related to weather conditions, as well as, burn severity.
Finally, Normalized Difference Vegetation Index (NDVI) were calculated from bands 3 and 4 for all three years as a means of estimating changes in foliar mass (Tucker, 1979). Inter-annual difference in NDVI values were also calculated (ANDVI). Error in the NDVI and ANDVI values as a result of the linear transformation of the post-fire data (Table 2). The error term of ANDVI was estimated by including the wavelength-specific stan- dard error of the estimate (SEE) values of the linear mod- els from the band radiance before reflectance and NDVI
were calculated. The SEE value was either added or sub- tracted from band 3 and 4 radiance but not both (i.e. band 3 subtracted, band 4 added) because the effect of atmo- spheric transmission in these wavelengths is positively correlated (Olsson, 1995). No error was estimated for the '89-90 ANDVI because SEE values from the regres- sion model were not applicable to the comparison of these two years.
Fire Severity Map
A map of fire severity was produced using the field plots within the burn area to guide classification of the satellite spectral data. Statistical analysis of the plot-de- rived reflectance values were performed to determine which TM bands contained the most information regard- ing burn severity. Student's t-tests were calculated for each spectral band, NDVI, and ANDVI values from all three years of data to determine significant differences in reflectance values between burn severity classes. The result of this test revealed that the 1989 data had the high- est significant differences among spectral bands and NDVI data. Based on this analysis, we chose to use only 1989 for mapping burn severity.
The pre- and post-fire spectral characteristics (Figure 2) and change in reflectance in the post-fire data (Figures 3 and 4) demonstrated that the 1989 bands 3,4, 5,7, and NDVI contained the largest source of variation regarding burn severity. However, the t-test analysis demonstrated that only band 7 could distinguish all burn severity classes among forests, the dominant pre-fire landcover class.
Reflectance in the burn encompassed the full radio- metric range of band 7 as landcover in the bum area ranged from full forest cover lo bare ground. Band 7 reflectance wcre classified into burn severity classes by evenly di- viding the reflectance into three density classes. The re- flectance ranged between 1.6 and 35.4% and were grouped into three density classes of approximately 12.3% reflec- tance per burn severity class. Low reflectance was as- signed to the low burn category and so on. Mapping was accomplished by simply assigning a bum severity attribute value for the appropriate band 7 reflectance range of a particular burn severity class.
- Remote Sensing of Forest Fires Severity and Vegetation Recovery - 129
1 2 3 4 5 7
TM Band * steppe low -*- riparian low -* iparian moderate ..-. forest low + forest moderate -* forest high
Figure 2. Average spectral reflectance of reflective TM bands by vegetation type and bum severity class for a) 1988, b) 1989, and c) 1990. Reflectance values were taken from sampled areas within the bum in October, 1988, just after the fire.
The aggregation of reflectance into density levels showed that the burn perimeter could not be ident~lied within the subsetted image scene. Instead, the classif~ca- tion mapped burn areas in the same categories as bare ground, meadow, and clouds outside of the burn. A burn perimeter was digitized from aerial photographs obtained shortly after the fire in 1988. For mapping purposes, we masked the digital TM data using this digitized perimeter and classified the data to map burn severity only within the burn area.
Areas of varying burn severity were identified on 1: 15,840 false color infrared aerial photos taken between September 22 and 28, 1988, for Glacier National Park. Burn severity classes were assessed from vegetation re- moval and surface color and tone in the photographs. Maps of burn severity were produced from the photo- graphs by hand tracing the identified areas onto 1:24,000 topographic maps and digitizing into a GIS database. This map did not include cover for the Flathead National For- est Lands but included approximately two-thirds of the
total bum area. Agreement between the maps was as- sessed by comparing 202 randomly selected points to de- rive overall percent map-to-map correspondence. This was done for each burn category and for the map as a whole. The two maps were also compared based on the total predicted area of each burn class.
Results
Analysis of the three image data show trends in re- flectance associated with cover type, burn severity, and vegetation regeneration. The overall spectral character- istics of the pre- and post-fire images demonstrate that there are detectable changes in visible and infrared (IR) reflectance associated with vegetation type and burn se- verity (Figure 2a-c). The differences are less apparent in the visible spectrum but quite distinct in the IR region. Analysis of the spectral response in 1989 (Figure 2b) il- lustrates that reflectance in forested areas increased in the
TM Band steppe Ion npanan low npanan moderafe
forest low forest moderafe forest h~gh
Figure 3. Inter-annual relectance differences calculated for TM bands 3,4,5, and 7 from sampled field sites: a) 1988-89, b) 1988- 90 and c) 1989-90. Negative values indicated reflectance of preceeding year were less than following year.
White, J.D., Ryan, K.C., Key, C.C., and Running, S.W.
A NDVI
steppe low
riparian low
riparian moderate
forest low
forest moderate
forest high
Vegetation -0.2 -0.1 Burn Severity
0.0 0.1 0.2 0.3
T
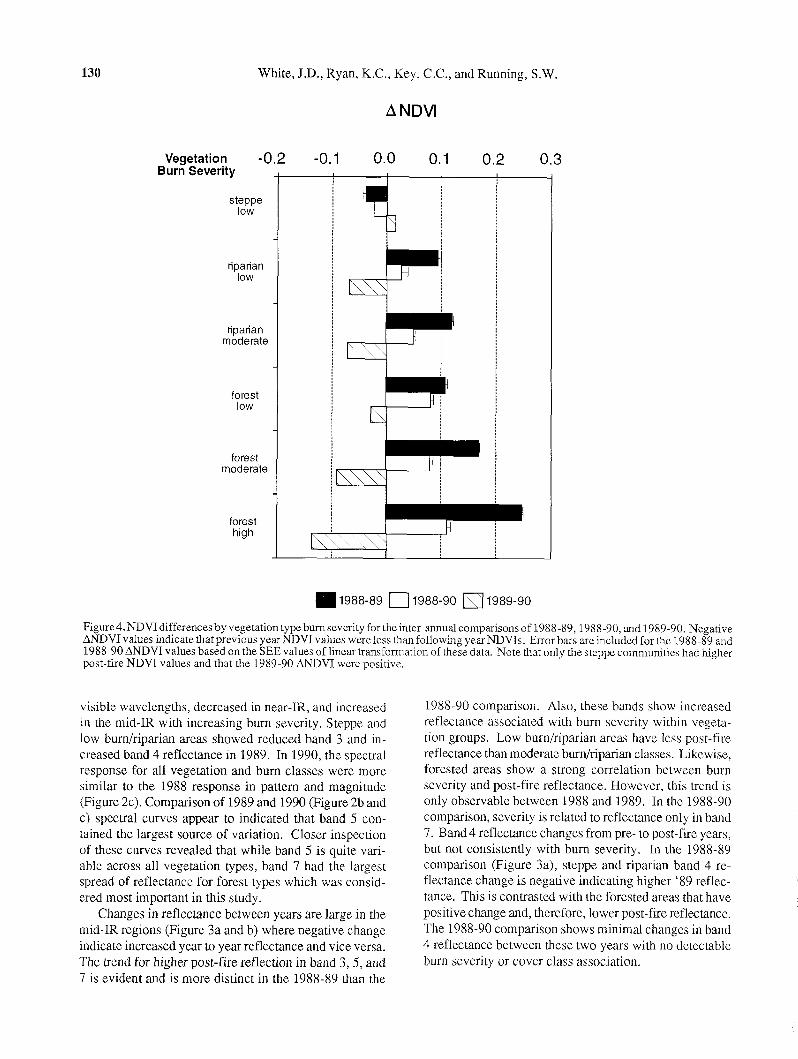
Figure4.NDVIdifferences by vegetation type burnseverity for the inter-annualcomparisons of 1988-89,1988-90, and 1989-90. Negative ANDVIvalues indicate that previous year NDVI values wereless than following year NDVIs. Error bars are included for the 1988-89 and 1988-90 ANDVI values based on the SEE values of linear transformation of these data. Note that only the steppe comlnunities had higher post-fire NDVI values and that the 1989-90 ANDVI were positive.
visible wavelengths, decreased in near-IR, and increased 1988-90 comparison. Also, these bands show increased in the mid-IR with increasing burn severity. Steppe and retlectance associated with burn severity within vegeta- low burnlriparian areas showed reduced band 3 and in- tion groups. Low burnlriparian areas have less post-fire creased band 4 reflectance in 1989. In 1990, the spectral reflectance than moderate burnlriparian classes. Likewise, response for all vegetation and burn classes were more forested areas show a strong correlation betwcen burn similar to the 1988 response in pattern and magnitude severity and post-fire reflectance. However, this trend is (Figure 2c). Comparison of 1989 and 1990 (Figure 2b and only observable between 1988 and 1989. In the 1988-90 c) spectral curves appear to indicated that band 5 con- comparison, severity is related to reflectance only in band tained the largest source of variation. Closer inspection 7. Band 4 reflectance changes from pre- to post-fire years, of these curves revealed that while band 5 is quite vari- but not consistently with burn severity. In the 1988-89 able across all vegetation types, band 7 had the largest comparison (Figure 3 4 , steppe and riparian band 4 re- spread of reflectance for forest types which was consid- flectance change is negative indicating higher '89 reflec- ered most important in this study. tance. This is contrasted with the forested areas that have
Changes in reflectance between years are large in the positive change and, therefore, lower post-fire reflectance. mid-IR regions (Figure 3a and b) where negative change The 1988-90 comparison shows minimal changes in band indicate increased year to year reflectance and vice versa. 4 reflectance between these two years with no detectable The trend for higher post-fire reflection in band 3 , 5 , and burn severity or cover class association. 7 is evident and is more distinct in the 1988-89 than the
- Remote Sensing of Forest Fires Severity and Vegetation Recovery - 131
Examination of the 1989-90 changes indicate variable response across bands, bum severity classes, and vegeta- tion type (Figure 3c). Generally, bands 3 and 7 illustrate decreasing reflectance in forested areas across burn se- verity classes, with the exception of the low burn class in band 3. Steppe and riparian areas also demonstrate lower 1990 reflectance in these bands though not related to burn severity. In band 4, reflectance decreased in the steppe and riparian communities and increased in forested areas from '89 to '90. Band 5 reflectance increased sharply in 1990 in the low bumlriparian class relative to the other classes. Band 5 reflectance differences were inversely proportional to bum severity in forested areas in the two post-fire years.
The ANDVI values are related to burn severity within vegetation classes in 1989 (Figure 4). Steppe communi- ties have negative change for all comparisons indicating higher post-fire vegetation index values. All other com- munities have lower NDVI values in the post-fire years. NDVI differences between 1989 and 1990 demonstrate a strong correlation between higher '90 NDVI values and increasing burn severity classes among riparian and for- ested areas. The steppe shows minimal NDVI change in the two post-fire years. Analysis of ANDVI error term demonstrates that variation attributable to the linear re- gression models (Table 2) is approximately k0.01 of the ANDVI values.
The band 7 reflectance values range from 1.6 to 35.4%. The mean reflectance values of the three burn severity classes are 6.8, 18.4, and 30.2% representing the low, moderate, and high severity burn classes, respectively. Comparatively, the average 1989 band 7 values for the extracted field plot data are 11.2, 14.4, 18.8 for rhe same bum severity classes.
Point agreement among the two maps is 63% overall (Table 4). The individual burn categories correspond by 77.5%, 56.0%, and 38.5% for the low, moderate, and high classes, respectively. The satellite prediction of total area of each burn class is higher for the low burn class and less for the moderate and high severity classes as com- pared to the aerial photograph-derived map (Table 4).
Discussion
Post-Fire Spectral Analysis
A dominant characteristic of large and destructive fires, such as the Red Bench Fire, is that foliar and woody plant matter are consumed during the fire. The spectral changes and the large response of certain spectral wave- lengths to burn severity seen in this study are related to the change in vegetation cover and biomass, the expo- sure of soil, and alteration of soil color. The difference in percent changes among the spectral bands gives evi-
Table 4. Correlation matrix between the aerial photo interpreta- tion and 1989 Landsat TM band 7 data classifications of bum severity of the Red Bench Fire. Classification aggreement was calcutated by comparing 202 randomly selected points, weight- ing the number of points per class by the area of the severity class in the aerial photo classification. This analysis only includes the bum within the Glacier National Park boundary.
dence of the biological response to different degrees of fire perturbation.
A full year passed between the fire and the date of the satellite data used for this analysis. During this period, vegetative regeneration occurred which must be included in our evaluation of the relationship between the spectral and severity data. Fire severity greatly influenced the plant communities ability to re-sprout or seed, degree of canopy degeneration due to cambium and crown scorch, and bio- physical environment for plant to establishment. As a result, the spectral response to fire severity is partly based on the effect of the fire on plant regeneration. The spec- tral response is related to the fire effects on fuels, soils, litter, and vegetation in as much as these characteristics relate to post-fire regeneration. The change values sup- port this relationship by the direction and pattern of change associated with the burn severity classes.
Our analysis demonstrated that burn severity is pri- marily correlated with increased band 7 reflectance and decreased NDVI from the pre- to post-fire years. This re- lationship is indicative of reduced plant cover related to fire severity and re-vegetation of these sites following the fire. At high vegetation cover, band 7 wavelengths are absorbed by water and thus by affected canopy water con- tent (Tucker, 1980; Cibula, et al., 1992). With less plant canopy, as in highly burned areas, the exposed soil prop- erties are more important in detected reflection. Expo- sure of bare soil and rock due to vegetation removal in- creases reflectance in the band 7 wavelengths (2.08 to 2.35 l m ) (Murphy and Wadge, 1994). In addition, these changes are linearly related to the proportion of rock to vegetation seen by the sensor. The band 7 wavelengths are partially sensitive to defoliation (Ahern, et al., 1991) but to a limited degree (Ekstrand, 1994). Increased band 7 reflectance is also associated with the reflectance prop- erties of the sites not recovered by vegetation in the post- fire images. We described fire severity partly based on the degree of soil surface color alteration, especially red- dening of soils due to iron oxide formation. The pres- ence of iron-oxide in soils increases reflectance across a
large wavelength band ranging from 0.5 to 2.4 pm rela- tive to organic soils (Stoner and Baumgardner, 1981). This increase is restricted to iron-oxide concentrations of >4% but is associated with soils having iron-oxide coat- ings on coarse soil particles.
The ANDVI values (Figure 4 ) are related to change in pre-fire foliar (Spanner, et al., 1990) and whole plant bio- mass (Ahern, 1991). These NDVI differences are sensi- tive to vegetation type and time since fire. The negative change values in the grass communities between the pre- and post-fire years indicate a positive growth response in the community following the fire. Asrar, et al. (1989) demonstrated positive NDVI change in unburned versus burned treatments of prairie grassland and also showed higher leaf production in burned areas. In our analysis, it is difficult to determine whether this difference is a result of the fire or is related to differences in growing season climate from year to year. Meteorological data for the area show growing season precipitation in the 1989 and 1990 were 7 and 3 times greater, respectively, than 1988. However, temperature data indicate that several below freezing nights had occurred before the 1988 and 1989 observations. This climatic information leads us to be- lieve that pre-image weather conditions were: a) in 1988 cold and dry, b) 1989 cold and wet, and c) 1990 moder- a~ely dry and warm. The rapid response of the grass and herbaceous species to fire and climate make this infor- mation relevant for understanding how the fire might have affected the community ecologically. Fire also influences growth by making available ammonium nitrate sources sequestered in fuels (Agee, 1993). As a result, the fire and weather were jointly responsible for positive plant growth in both 1989 and 1990 calculated as a negative NDVI change in our analysis.
The correlation of positive ANDVI and burn severity in 1989 is apparent for both riparian and forested areas (Figure 4). In both community types, the satellite detected the removal of vegetation consistent with the ground ob- servations and classification. The lack of this same rela- tionship between 1988 and 1990 underscores the impor- tance of rapid and frequent sampling for this type of analy- sis. In more mesic climates, vegetation response to fire- scorched areas in these type communities would likely be faster and more vigorous requiring acquisition of sat- ellite data at time intervals less than the annual observa- tions used here.
Reduced correlation between ANDVI and burn sever- ~ t y from 1989 to 1990 is indicative vegetation recovery, however, this type analysis cannot determine what veg- etation returned to the site. Field observations of the burn in 1991 indicate that herbaceous cover dominated by Epilobium angustifolium L. (fireweed) ranged from 30 to 100% on most sites (R. Ringleb, pers. comm.). This is a common and dominant post-fire species of North Ameri- can coniferous forests (Barbour and Billings, 1988). From
these observations, it is likely that the 1989-90 ANDVI values are influenced by the change in foliar biomass and by the difference in reflective properties of the structure of the vegetation caused by different degrees of burn se- verity. Vegetation canopies in the post-fire communities varied from a mixture of thinned forested overstory and light herbaceous understory to no overstory and herba- ceous understory as a function of fire severity. These gra- dients influence the interpretation of NDVI change. Stands with overstory components have lower NDVI val- ues due to lower near-IR reflectance from shadows (Franklin, 1986) and absorption by exposed stems (Guyot, et al., 1989). Low burn areas retained most of the for- ested canopy and have little dynamic potential for canopy change. Moderate and high severity burn sites were left with very thin or no forest canopies. These sites have a higher potential for canopy development from herbaceous and tree seedling regeneration. These understories may have higher NDVI values as the highly reflective herba- ceous vegetation dominates the spectral response (Span- ner, er al., 1990). These differences exaggerate the NDVI changes seen in the post-fire years among the various burn severity classes in forested areas.
The change in band 7 reflectance and NDVI between the two post-fire years also demonstrates a correlation bctween vegetation recovery and bum severity . The band 7 and ANDVI indicate that the more severely burned for- est and riparian communities had higher recovery rates in 1990. This response is likely due to more light and less competition in the more severely disturbed areas. These results indicate that the vegetation canopy in 1990 had not fully developed to the pre-fire condition, but that the more severely damaged sites are recovering rapidly.
The 1989-90 change analysis showed a strong increase in band 5 reflection in 1990 for the low burn, riparian areas (Figure 3c). These areas were the only community that had lower band 5 reflectance changes from 1988 to 1989 (Figure 3 4 . These predominantly wet, sedge mead- ows re-vegetated quickly following the burn (Willard, et al., 1995). The increased band 5 is a response to the wet- ter weather of 1989 described previously. Higher 1989 precipitation saturated the wet meadows resulting in boggy field conditions and higher band 5 absorption. In 1988 and 1990, drier weather resulted in less saturated soil con- ditions and higher band 5 reflectance.
Burn Severity Mapping
Current image processing software products provide an abundance of classification and analysis tools for digital data. Supervised and unsupervised classification of multi- spectral data are certainly useful given a broad category of landcover classification. As part of a trial and error process in the development of the methodology described here, a number of simple classification techniques were
- Remote Sensing of Forest Fires Severity and Vegetation Recovery - 133
employed. These included supervised and unsupervised classifications of different band combinations, classifica- tion of ratio and modified band data, and inclusion of to- pographic databases. In short, the simple band 7 classifi- cation presented here was by far the most useful for burn severity mapping.
As we have described previously, our burn severity mapping process was based on understanding what spec- tral bands were most sensitive to the fire. We demon- strated that band 7 was very sensitive to the characteris- tics of burn severity in a variety of communities. The NDVI and ANDVI data are also good indicators of burn severity, however, NDVI is subject to variable results at low canopy cover (Major, er al., 1990; Huete, et al., 1994) and, therefore, may not be as useful for classification of burn severity across a range of vegetation and soil condi- tions.
From a practical standpoint, we chose to limit spec- tral information used in the classification to forested ar- eas. This is justified because forests were the dominated the vegetation of the disturbed area. Nevertheless, this demonstrates a weakness of using this simple classifica- tion process for mapping burn severity among vegetation types. Mapping the variety of communities affected by the fire is just as important as mapping the extent of the fire for numerous management reasons. We conclude that the band 7 classification described here is sufficient for mapping overall bum severity classes, but not useful for distinguishing among different affected communities. A better fire severity classification may be produced by pre- stratifying the spectral data using a pre-fire vegetation map and then using the band 7 reflection as burn severity indi- cator as described here.
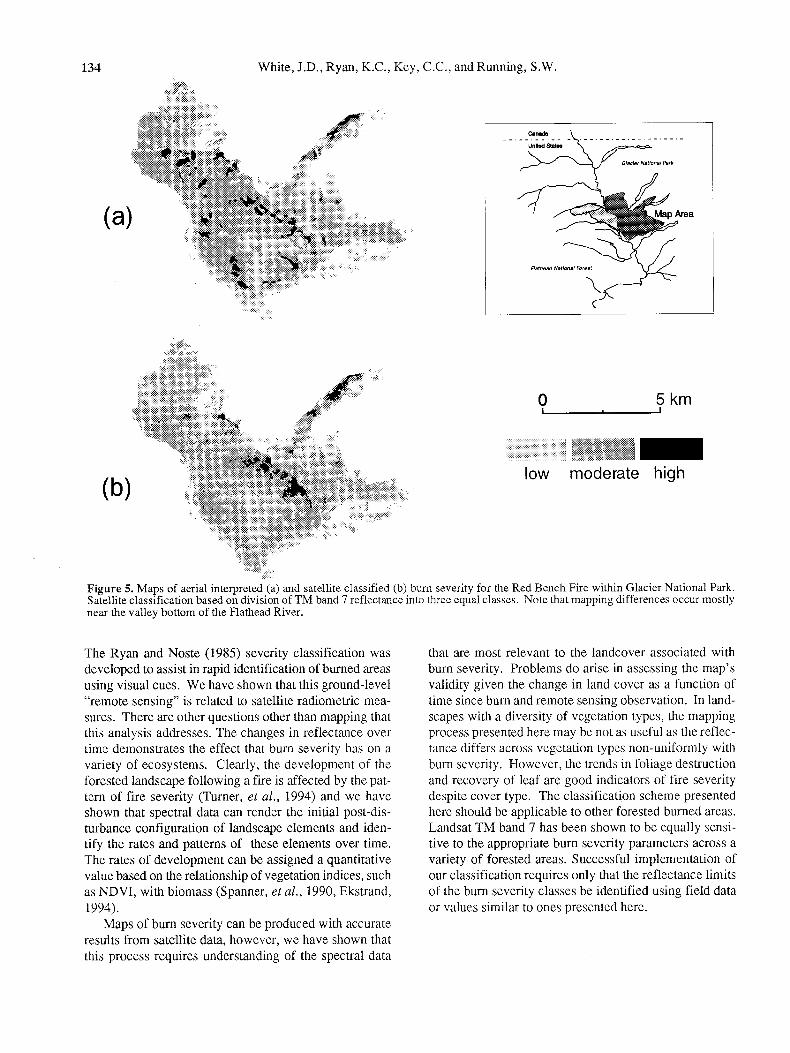
The 63% classification map accuracy was influenced by two factors: 1) the data used as reference information to check map accuracy and 2) the time elapsed between the fire and image data acquisition. Burn severity classes were delineated and hand-digitized from the photos with an estimated minimum mapping unit of 100 m2 and, there- fore, the aerial photo interpretation had a spatial resolu- tion that was coarser than the satellite data. The photo- interpreted map shows large homogeneous bum units con- trasted with the satellite-derived map that has a larger pixel-to-pixel classification variability (Figure 5). To account for this spatial variation difference, the single points chosen for map comparison were derived from tak- ing the most frequently occurring class value within a 3- by-3 pixel observation. However, we analyzed the spa- tial frequency of contiguous patches of both maps and found that the photo-interpreted map had 242 unique patches versus 949 in the satellite classification. This in- dicates that the satellite image has a higher spatial detail. Given these differences in spatial variation, information from point-to-point accuracy calculations are difficult to assess and interpret. However, visual inspection of the
two maps (Figure 5) demonstrates very similar spatial patterning of the low, moderate and high severity burn areas.
Several difficulties arose in obtaining images that were closer in time to the fire event. Images from the end of 1988 and winter of 1989 were obscured by clouds and snow. The September 20, 1989, image was selected to represent the best estimate of post-fire conditions while minimizing differences in vegetation phenology, sun- angle, and weather conditions between the pre- and post- fire data. Because of the year delay, it is reasonable to expect differences between the photo and satellite classi- fications as a function of the nascency to the fire event. As we have noted, vegetation regrowth occurred with some vigor following the fire (Willard, et al., 1994; Willard, et al., 1995). The result of this re-vegetation should have the effect of reducing the size of the more severely burned classes as detected by the satellite in 1989. In fact, we found a shift in the area of predicted burn sc- verity from high to low relative to the photo-interpreted map. The area totals for the photograph-derived map are 3477.78, 4894,29, and 453.69 ha for the low, moderate, and high burn classes compared to values of 4800.78, 3773.70, and 251.28 ha from the satellite-derived map. These results also correspond to the classification accu- racies of the individual burn categories whereby accura- cies decrease with increasing burn severity. Low burn pixels occur more frequently in the satellite classification and therefore have a higher probability of co-occurring with pixels in the photo map. Visual inspection of the two classification reveal that most of the errors occur near the bottom of the valley in areas close to the Flathead River (Figure 5). In these areas, high severity burns iden- tified in the aerial photographs are interpreted as moder- ate burns in the satellite due to more productive valley- bottom sites having higher re-vegetation rates than the ridge and upper-slope sites.
Ecosystem processes observable at this spatial reso- lution are complex and require analysis over relatively long periods of time. Single date analysis of burned ar- eas are relevant for describing the physical nature of the disturbance. As we have demonstrated, the ecological dynamics of the system can also be described by estab- lishing the appropriate temporal frame of reference and comparing reflectance changes as a function of the veg- etative regeneration.
The success of any classification logic is to identify the features of a set of objects that can be the most useful for their discrimination. We have demonstrated in this study that remote sensing of burn severity must take into consideration the physical and biological effects of fire.
White, J.D., Ryan, K.C., Key, C.C., and Running, S.W
low moderate high
Figure 5. Maps of aerial interpreted (a) and satellite classified (b) burn severity for the Red Bench Fire within Glacier National Park. Satellite classification based on division of TM band 7 reflectance into three equal classes. Note that mapping differences occur mostly near the valley bottom of the Flathead River.
The Ryan and Noste (1985) severity classification was developed to assist in rapid identification of burned areas using visual cues. We have shown that this ground-level "remote sensing" is related to satellite radiometric mea- sures. There are other questions other than mapping that this analysis addresses. The changes in reflectance over time demonstrates the effect that burn severity has on a variety of ecosystems. Clearly, the development of the forested landscape following a fire is affected by the pat- tern of fire severity (Turner, et al., 1994) and we have shown that spectral data can render the initial post-dis- turbance configuration of landscape elements and iden- tify the rates and patterns of these elements over time. The rates of development can be assigned a quantitative value based on the relationship of vegetation indices, such as NDVI, with biomass (Spanner, et al., 1990, Ekstrand, 1994).
Maps of burn severity can be produced with accurate results from satellite data, however, we have shown that this process requires understanding of the spectral data
that are most relevant to the landcover associated with burn severity. Problems do arise in assessing the map's validity given the change in land cover as a function of time since burn and remote sensing observation. In land- scapes with a diversity of vegetation types, the mapping process presented here may be not as useful as the reflec- tance differs across vegetation types non-uniformly with burn severity. However, the trends in foliage destruction and recovery of leaf are good indicators of fire severity despite cover type. The classification scheme presented here should be applicable to other forested burned areas. Landsat TM band 7 has been shown to be equally sensi- tive to the appropriate burn severity parameters across a variety of forested areas. Successful implementation of our classification requires only that the reflectance limits of the burn severity classes be identified using field data or values similar to ones presented here.
- Remote Sensing of Forest Fires Severity and Vegetation Recovery - 135
Acknowledgements. The authors would like to thank the following persons for their contribution to this paper: Barry Dutton, Steve Cooper, Dean Sirucek, and Richard Ringleb. We would also like to thank Dr. Ramaknshna Nemani for his insights during the writing of this manuscript. This research was supported in part by funds provided by the Intermountain Research Station, Forest Service, U.S. De- partment of Agriculture, and by an interagency research agreement between the USDA Forest Service, Intermoun- tain Research Station, the National Biological Service, and the University of Montana, INT-89440-RJVA.
References
Agee, J.K. 1993. Fire Ecology of Pacific Northwest Forest. Island Press, Washington D.C. 493 pages.
Ahem, F.J., T. Erdle, D.A. MacLean, I.D. Kneppeck 1991. A quantitative relationship between forest growth rates and Thematic Mapper reflectance measurements. International Journal of Remote Sensing 12(3):387-400.
Asrar, G., R.B.Myeni, Y. Li, andE.T. Kanemasu. 1989. Measur- ing andmodeling spectral characteristics of a tallgrass prairie. Remote Sensing of the Environment 27:143-155.
Barbour, M.G. and W.D. Billings 1988. North AmericanTerres- trial Vegetation. Cambridge University Press, Cambridge. 434 pages.
Butera, M.K. 1986. A correlation and regression analysis of percent canopy closure versus TMS spectral response for selectedforest sites in the San JuanNational Forest, Colorado. IEEE Transactions on Geoscience and Remote Sensing GE- 24(1): 122-129.
Caselles, V. and M.J. U p e z Garcia 1989. An alternative simple approach to estimate atmospheric correction in multitemporal studies. International Journal of Remote Sensing lO(6): 1127- 1134.
Chavez, P.S. 1989. Radiometriccalibration of Landsat Thematic Mapper multispectral images. Photograrnrnetric Engineering and Remote Sensing 55(9):1285-1294.
Cibula, W.G., E.F. Zetka, and D.L. Rickrnan 1992. Response of thematic mapper bands to plant water stress. International Journal of Remote Sensing 13(10):1869-1880.
Conese, C., G. Maracchi, F. Miglietta, F. Maselli, andV.M. Sacco 1988. Forest classification by principal component analyses of TM data. International Joumal of Remote Sensing 9(10- 11):1597-1612.
Coppin, P.R. andM.E. Bauer 1992. Optimization of the informa- tion content of multitemporal Landsat TM data sets for moni- toring forest cover disturbance. International Geoscience and Remote Sensing Symposium, May 26-29, 1992, Houston, Texas. pages 983-985.
Ekstrand, S. 1994. Assessment of forest damage with Landsat TM: correction for varying forest stand characteristics. Ke- mote Sensing of the Environment 47:291-302.
Fiorella, M. and W.J. Ripple 1993. Analysis of conifer fores~ regeneration using Landsat Thematic Mapper data. Photo- grammetric Engineering and Remote Sensing 59(9):1383- 1388.
Franklin, J. 1986. Thematic Mapper analysis of coniferous forest structure and composition. International Journal of Remote Sensing 7(10):1287-1301.
Guyot, G., D. Guyon, and J. Riom. 1989. Factors affecting the spectral response of forest canopies: a review. Geocarto International 3:3-18.
Hall,D.K., J.P. Ormsby,L. Johnson, and J.Brown 1980. Landsat digital analysis of the initial recovery of burned tundra at Kokolik River, Alaska. Remote Sensing of the Environment 10:263-272.
Huete, A., C. Justice, and H. Liu. 1994. Development of vegetation and soil indices for MODIS-EOS. Remote Sens- ing of the Environment 49:224-234.
Isaaks, E.H. and R.M. Srivastava 1989. An Introduction to Applied Geostatistics. Oxford University Press, New York. 561 pages.
Jakubauskas, M.E. 1988. Postfire vegetation change detection using Landsat MSS and TM data. M.A. Thesis, Indiana State University, Department of Geography and Geology. 108 pages.
Jakubauskas, M.E., K.P. Lulla, andP.W. Mausel. 1990. Assess- ment of vegetation change in a fire altered forest landscape. PhotogrammetricEngineering andRemote Sensing 56(3):37 1 - 377.
Jensen, J.R. 1986. Introductory Digital Image Processing. Prentice-Hall, New Jersey, 379 pages.
Leprieur, C.E., J.M. Durand, and J.L Peyron 1988. Influence of topography on forest reflectance using Landsat Thematic Mapper and digital terrain data. Photogrammetric Engineer- ing and Remote Sensing 54(4):491-496.
Major, D.J., F. Baret, and G. Guyot. 1990. A ratio vegetation index adjusted for soil brightness. Intemational Joumal of Remote Sensing 11(5):727-740.
Markham, B .L. and J.LBarker 1985. Spectral characterization of the LANDSAT Thematic Mapper sensors. Intemational Journal of Remote Sensing 6(5):697-7 16.
Milne, A.K. 1986. The use of remote sensing in mapping and monitoring vegetational change associated with bushfire events in eastern Australia. Geocarto International 1:25-32.
Morgan, P.M. 1984. Modeling shrub succession following clearcutting and burning. PhD Dissertation, University of Idaho, Moscow, ID, 146 pages.
Murphy, R.J. and G. Wadge. 1994. The effects of vegetation on the ability to map soils using imaging spectrometer data. International Journal of Remote Sensing l5(l): 63-86.
Olsson, H. 1995. Reflectance calibration of thematic mapper data for forest change detection. International Journal of Remote Sensing 16(1):81-96.
Ryan, K.C. andN.V. Noste 1985. Evaluating prescribed fires. In: J.E. Lotan, B.M. Kilgore, W.C. Fischer, and R.W. Mutch, Tec. Coord. Proc. Symposium and Workshop on Wilderness Fire. USDA Forest Service General Tec. Rep. INT-182. Intermountain Forest and Range Experiment Station, Ogden, Utah, pages 230-238.
Spanner, M.A., L.L. Pierce, D.L. Peterson, and S.W. Running 1990. Remote sensing of coniferous forest leaf area index: the influence of canopy closure understory vegetation and back- ground reflectance. International Journal of Remote Sens- ing.l1(1):95-111.
Stoner, E.R. andM.F. Baurngardner 1981. Characteristic varia- tions in reflectance of surface soils. Soil Science Society American Journal. 45: 1161 -1 165.
Tucker, C.J. 1979. Red and photographic infrared linear combi- nations for monitoring vegetation. Remote Sensing of the Environment 8:127-150.
136 White, J.D., Ryan, K.C., Key, C.C., and Running, S.W.
Tucker, C.J. 1980. Remote sensing of leaf water content in the near infrared. Remote Sensing of the Environment 10:23-32.
Turner, M.G., W.H. Hargrove, R.H. Gardner, andW.H. Romme. 1994. Effectsof fieonlandscape heterogeneity inYellowstone National Park, Wyoming. Journal Of Vegetation Science 5:73 1-742.
Willard, E.E.,R.H. Wakimoto, andKevinC. Ryan. 1995. Vegeta- tion recovery in sedge meadow communities within the Red Bench Fire, Glacier National Park, In: Proceedings of the Tall
Timbers Fire Ecology Conference No. 19 (edited by S.I. Ceru1eanandR.T. Engstrom), TallTimbers Research Station, Tallahassee, Florida, pages 102-1 10.
Willard, E.E., R.H. Wakimoto, andKevinC. Ryan 1994. Effects of wildfire on survival and regeneration of ponderosa pine in Glacier National Park. Proceedings of the 12thConference on Fire and Forest Meteorology, Jekyll Island, Georgia, Oct. 26- 28, 1993, pages 723-728.


![[Vegetation and Remote Sensing] Vegetation](https://static.documents.pub/doc/80x56/577cdfd71a28ab9e78b21a32/vegetation-and-remote-sensing-vegetation.jpg)


