Xiangming Xiao (肖向明) Center for Spa,al Analysis Earth Observa,on and Modeling Facility Department of Microbiology and Plant Biology University of Oklahoma, Norman, Oklahoma, 73019, USA hIp://www.eomf.ou.edu Remote Sensing Applica4ons for Dynamics and Produc4vity of Grasslands and Croplands 2014 Oklahoma Workshop on Remote Sensing Technology and Applica,on Na,onal Weather Center, OU, Norman, Oklahoma, November 12, 2014
Transcript
Xiangming Xiao (肖向明)
Center for Spa,al Analysis Earth Observa,on and Modeling Facility
Department of Microbiology and Plant Biology University of Oklahoma, Norman, Oklahoma, 73019, USA
hIp://www.eomf.ou.edu
Remote Sensing Applica4ons for Dynamics and Produc4vity of Grasslands and Croplands
2014 Oklahoma Workshop on Remote Sensing Technology and Applica,on Na,onal Weather Center, OU, Norman, Oklahoma, November 12, 2014
Earth Observa4on and Modeling Facility
A. The Computa4onal Laboratory
12 computer servers
800 Terabyte online data storage, and a member of OU PetaStore facility B. The Data Visualiza4on Laboratory C. The Remote Sensing Laboratory
Hyperspectral, mul,-‐spectral and thermal remote sensing GIS, GPS,
Eco-‐epidemiology Zoono4c infec4ous diseases Risk assessment and forecast Global Health, One Health
Land use and land cover Irriga4on/inunda4on Evapotranspira4on Hydrological models Climate models Geo-‐informa4cs
Models
H5N1
$1.5 million annual expenditure in FY2012 from federal grants
Earth Observa4on and Modeling Facility
Outline of the presenta4on § Integrated Land Data Portal (hZp://www.eomf.ou.edu)
§ Land use and land cover changes
§ Water quality and harmful algae
§ Carbon and water fluxes of grasslands and croplands
§ Drought impact assessment
Integrated Land Data Portal (iLand) (hZp://www.eomf.ou.edu)
7 billions in 2011
Big Data Science 1. How to empower researchers and millions of people to collect
and share in-‐situ ground reference data? 2. How to integrate and share in-‐situ data and images from
airborne and spaceborne sensors? 3. How to engage researchers and millions of people to par4cipate
in data product evalua4on and improvement?
Global Geo-‐Referenced Field Photo Library at the University of Oklahoma
(hZp://www.eomf.ou.edu/photos) A ci,zen science data portal for sharing and archiving geo-‐tagged field photos of cropland, rangeland, forest, wetland, water body, harmful algal bloom, wildlife, fire, drought, flood, diseases in the world. All photos are linked with satellite images (e.g., MODIS) from 2000 to present.
Share your field photos, show your footprint of travel and
support monitoring of our planet Earth
Field Photo App is freely available in Apple store and Google Play store
Image quality Frequency of bad-‐quality observa,ons (clouds, cloud shadow, SLC-‐off, snow)
Number of images over years by month
In-‐situ field data collec4on, management, visualiza4on
ü Smartphone app “Field Photo” (IOS, Android)
ü Photos are linked with
,me series MODIS data in 2000 – 2014
Share your field photos
and Your contribu>on is
essen>al for us to develop be?er data products
h?p://www.eomf.ou.edu
Remote Sensing of Water Quality in Lakes and Reservoirs
In collabora,on with Karl D. Hambright (OU) & Andy Dzialowski (OSU)
Long-‐term goal of the project To devise an effec,ve and affordable program for monitoring water quality and harmful algal bloom (HABs) of lakes in Oklahoma
Specific objec4ves of the project Provide a proof-‐of-‐concept demonstra,on of the use of satellite-‐ and digital camera-‐ based imagery to quan,fy and monitor HABs across space and ,me in Lake Texoma and Grand Lake
Lake Eufaula
Grand Lake
HABs in Oklahoma
Water Quality
In situ hyperspectral data measurement
Chlorophyll, µg L-1 low
high
True color of Landsat TM band321.
Lake Texoma
In situ water sampling and chlorophyll measurement
Chlorophyll Phycocyanin
Carbon and Water Fluxes of Grasslands and Croplands
Integrated Grassland & Cropland Observa4on Sites in Oklahoma
• Mul>-‐sensor and mul>-‐scale observa>ons for be?er understanding of agro-‐ecosystems and land-‐atmosphere interac>on
• Testbeds for (1) airborne and spaceborne sensors and (2) model development and evalua>on
Integrated grassland and cropland observa4on sites (IGOS and ICOS) in El Reno, Oklahoma, USA
AZribu4on of changing climate, soil moisture, land use and management
Satellite-‐based Modeling of Gross & Net Primary Produc4on of Grasslands and Croplands
Vegeta4on types
Satellite-‐based vegeta4on indices
Climate (T, PAR)
Vegeta4on Photosynthesis Model (VPM)
Gross and net primary produc4on
Time (8-day periods)
Dec Jan Feb Mar Apr May Jun Jul Aug Sep Oct Nov Dec Jan
LSW
I
-0.3
-0.2
-0.1
0.0
0.1
0.2
0.3
Control 2000-13Burned 2000-13Burned 2006
The impacts of drought on vegeta4on index and GPP of grasslands
MODIS
Land surface water index
Grassland CO2 flux tower, El Reno, OK
a) El Reno Control
Time (8-day periods)
Mar Apr May Jun Jul Aug Sep Oct Nov Dec Jan Feb Mar Apr May Jun Jul Aug Sep Oct Nov
Car
bon
flux
(g C
m-2
day
-1)
0
3
6
9
12
15
GPPVPM GPPEC
b) El Reno Burned
Time (8-day periods)
Apr May Jun Jul Aug Sep Oct Nov Dec Jan Feb Mar Apr May Jun Jul Aug Sep Oct Nov C
arbo
n flu
x (g
C m
-2 d
ay-1
)0
3
6
9
12
15
18
2005 2006
2005 2006
c) Fermi Prairie
Time (8-day periods)
Apr May Jun Jul Aug Sep Oct Nov Dec Jan Feb Mar Apr May Jun Jul Aug Sep Oct Nov
Car
bon
flux
(g C
m-2
day
-1)
0
3
6
9
12
15
2005 2007
El Reno
severe drought in 2006
GOSAT GOME-‐2 OCO-‐2
!
! !
How to evaluate VPM-‐predicted GPP at regional to global scales ? Sun-‐induced chlorophyll fluorescence data
-‐-‐ GOME-‐2 sensor
!
Mead, Nebraska
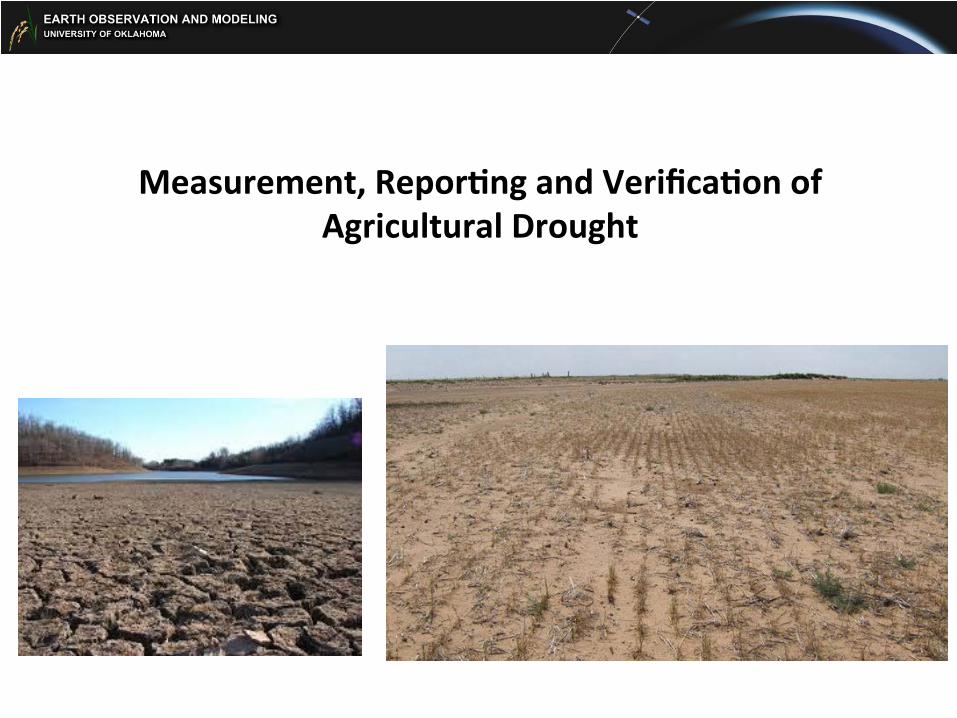
Measurement, Repor4ng and Verifica4on of Agricultural Drought
Three slides were removed, as they are not published, yet.
1. Con4nue to improve Integrated Land Data Portal (hZp://www.eomf.ou.edu)
2. Con4nue to integrate 4me series data from MODIS, Landsat and other sensors (e.g., Sen4nel-‐2) to generate maps of grassland, croplands, forests
3. Con4nue to integrate op4cal sensors (Landsat, Sen4nel-‐2) for water quality and harmful algal bloom in lakes and reservoirs
4. Con4nue to provide data service to the community and to establish new research collabora4ons in the region
Rubber
Acacia
Eucalyptus
Teak
Bamboo
Oil palm
Thank you hIp://www.eomf.ou.edu
forest in Hainan Island,
China
PALSAR image (HH, HV, HH/HV)
PALSAR forest map (50-‐m resolu4on)
Workflow from field photos, photo library, images to land cover map
POI, AOI, Algorithm, Evalua4on
Photo uploading, edi4ng
Field Photo
(Dong et al., 2012. JPRS)
High-‐resolu4on images &
Google Earth
Integrated Cropland Observa4on Site (iGOS) at EL Reno, Oklahoma
PALSAR-‐based Forest and Planta4on Maps
hZp://www.eomf.ou.edu/
A 50-m Forest Cover Map in Southeast Asia from ALOS/PALSAR and Its Application on Forest FragmentationAssessmentJinwei Dong1, Xiangming Xiao1*, Sage Sheldon1, Chandrashekhar Biradar2, Geli Zhang1,3, Nguyen Dinh
Duong4, Manzul Hazarika5, Ketut Wikantika6, Wataru Takeuhci7, Berrien Moore III8
1 Department of Microbiology and Plant Biology, and Center for Spatial Analysis, University of Oklahoma, Norman, Oklahoma, United States of America, 2 International
Center for Agricultural Research in Dry Areas, Amman, Jordan, 3 Institute of Geographic Sciences and Natural Resources Research, Chinese Academy of Sciences, Beijing,
China, 4 Institute of Geography, Vietnam Academy of Science and Technology, Hanoi, Vietnam, 5 Geoinformatics Center, Asian Institute of Technology, Pathumthani,
Thailand, 6 Center for Remote Sensing, Institute of Technology Bandung, Bandung, Indonesia, 7 Institute of Industrial Science, The University of Tokyo, Meguro, Tokyo,
Japan, 8 College of Atmospheric and Geographic Sciences, University of Oklahoma, Norman, Oklahoma, United States of America
Abstract
Southeast Asia experienced higher rates of deforestation than other continents in the 1990s and still was a hotspot of forestchange in the 2000s. Biodiversity conservation planning and accurate estimation of forest carbon fluxes and pools needmore accurate information about forest area, spatial distribution and fragmentation. However, the recent forest maps ofSoutheast Asia were generated from optical images at spatial resolutions of several hundreds of meters, and they do notcapture well the exceptionally complex and dynamic environments in Southeast Asia. The forest area estimates from thosemaps vary substantially, ranging from 1.736106 km2 (GlobCover) to 2.696106 km2 (MCD12Q1) in 2009; and theiruncertainty is constrained by frequent cloud cover and coarse spatial resolution. Recently, cloud-free imagery from thePhased Array Type L-band Synthetic Aperture Radar (PALSAR) onboard the Advanced Land Observing Satellite (ALOS)became available. We used the PALSAR 50-m orthorectified mosaic imagery in 2009 to generate a forest cover map ofSoutheast Asia at 50-m spatial resolution. The validation, using ground-reference data collected from the Geo-ReferencedField Photo Library and high-resolution images in Google Earth, showed that our forest map has a reasonably high accuracy(producer’s accuracy 86% and user’s accuracy 93%). The PALSAR-based forest area estimates in 2009 are significantlycorrelated with those from GlobCover and MCD12Q1 at national and subnational scales but differ in some regions at thepixel scale due to different spatial resolutions, forest definitions, and algorithms. The resultant 50-m forest map was used toquantify forest fragmentation and it revealed substantial details of forest fragmentation. This new 50-m map of tropicalforests could serve as a baseline map for forest resource inventory, deforestation monitoring, reducing emissions fromdeforestation and forest degradation (REDD+) implementation, and biodiversity.
Citation: Dong J, Xiao X, Sheldon S, Biradar C, Zhang G, et al. (2014) A 50-m Forest Cover Map in Southeast Asia from ALOS/PALSAR and Its Application on ForestFragmentation Assessment. PLoS ONE 9(1): e85801. doi:10.1371/journal.pone.0085801
Editor: Ben Bond-Lamberty, DOE Pacific Northwest National Laboratory, United States of America
Received July 19, 2013; Accepted December 2, 2013; Published January 22, 2014
Copyright: ! 2014 Dong et al. This is an open-access article distributed under the terms of the Creative Commons Attribution License, which permitsunrestricted use, distribution, and reproduction in any medium, provided the original author and source are credited.
Funding: This study was supported by National Aeronautics and Space Administration (NASA) Land Cover and Land Use Change Program (NNX11AJ35G) andNational Science Foundation (NSF) EPSCoR Program (NSF-0919466). The PALSAR 50-m orthorectified mosaic imagery was provided by JAXA as the ALOS sampleproduct. We thank the Degree Confluence Project and Panoramio for providing GPS-referenced photos for validation. The funders had no role in study design,data collection and analysis, decision to publish, or preparation of the manuscript.
Competing Interests: The authors have declared that no competing interests exist.
Dramatic changes in forests, especially tropical forests, havesignificant impacts on regional climate, water and carbon cycles aswell as biodiversity [1,2]. Southeast Asia consists of 11 countries(Cambodia, Laos, Myanmar, Thailand, Vietnam, Malaysia,Brunei, Indonesia, Philippines, Singapore, and East Timor) andits population increased rapidly from approximately 359 million in1980 to 593 million in 2010 [3]. To meet the rising demand forfood, fiber, water, and housing, substantial land use and land coverchanges, especially deforestation, have taken place in the region.As the third largest area of tropical rainforests in the worldfollowing the Amazon and Congo Basin [4,5], Southeast Asiaexperienced more dramatic deforestation than any other continentin annual rate in the 1990s [6]. This region was also a hotspot of
forest cover change from 2000 to 2010, e.g., Margono et al. [7].For example, Indonesia and Myanmar were listed among the topten countries with the largest annual net loss of forests whileVietnam had a large annual net gain of forest area from 2000 to2010 [8]. National forestry policies differ between these countries,which further contributes to different forest change patterns andasymmetric forest transitions affected by the wood product tradesamong them [9]. Although government and scientists have madeefforts to reinforce forest protection in Southeast Asia, forestconversion to plantations (e.g. oil palm) has continued to increase,which leads to fragmentation and affects biodiversity and carbonsequestration in peatlands [10–12]. To support regional sustain-able development, including forest management, carbon emissionestimation, habitat planning, and biodiversity conservation, it is
PLOS ONE | www.plosone.org 1 January 2014 | Volume 9 | Issue 1 | e85801
Mapping deciduous rubber plantations through integration of PALSAR andmulti-temporal Landsat imagery
Jinwei Dong a, Xiangming Xiao a,⁎, Bangqian Chen b, Nathan Torbick c, Cui Jin a,Geli Zhang d, Chandrashekhar Biradar a
a Department of Microbiology and Plant Biology, and Center for Spatial Analysis, University of Oklahoma, Norman, OK 73019, USAb Rubber Research Institute, Chinese Academy of Tropical Agricultural Sciences, Danzhou, Hainan, 571737, Chinac Applied Geosolutions, Durham, NH, 03857, USAd Institute of Geographic Sciences and Natural Resources Research, Chinese Academy of Sciences, Beijing, 100101, China
a b s t r a c ta r t i c l e i n f o
Article history:Received 20 November 2012Received in revised form 1 March 2013Accepted 18 March 2013Available online xxxx
Due to increasing global demand for natural rubber products, rubber (Hevea brasiliensis) plantation expan-sion has occurred in many regions where it was originally considered unsuitable. However, accurate mapsof rubber plantations are not available, which substantially constrain our understanding of the environmentaland socioeconomic impacts of rubber plantation expansion. In this study we developed a simple algorithmfor accurate mapping of rubber plantations in northern tropical regions, by combining a forest map derivedfrom microwave data and unique phenological characteristics of rubber trees observed from multi-temporal Landsat imagery. Phenology of rubber trees and natural evergreen forests in Hainan Island, China,was evaluated using eighteen Landsat TM/ETM+ images between 2007 and 2012. Temporal profiles of theNormalized Difference Vegetation Index (NDVI), Enhanced Vegetation Index (EVI), Land Surface WaterIndex (LSWI), and near-infrared (NIR) reflectance for rubber trees and natural forest were constructed. Theresults showed that rubber plantations are distinguishable from natural evergreen forests in two phenolog-ical phases: 1) during the defoliation (leaf-off) phase in late February–March, vegetation index (NDVI, EVI,LSWI) values were lower in rubber plantations than in natural evergreen forests; and 2) during the foliation(new leaf emergence) phase in late March–April, rubber plantations had similar NDVI and LSWI values buthigher EVI and NIR reflectance values than in natural forests. Therefore, it is possible to delineate rubber plan-tations within forested landscapes using one to two optical images acquired in the defoliation and/or foliationperiod. The mapping technique was developed and applied in the Danzhou Region of Hainan. Phased Arraytype L-band Synthetic Aperture Radar (PALSAR) 50-m Orthorectified Mosaic images were used to generatea forest cover map and further integrated with the phenological information of rubber plantations extractedfrom Landsat TM images during the foliation phase. The resultant map of rubber plantations has high accu-racy (both producer's and user's accuracy is 96%). This simple and integrated algorithm has the potentialto improve mapping of rubber plantations at the regional scale. This study also shows the value of time seriesLandsat images and emphasizes imagery selection at appropriate phenological phase for land cover classifi-cation, especially for delineating deciduous vegetation.
Plantation development by the agroforestry industry, such as theexpansion of Pará rubber tree (Hevea brasiliensis) plantations, hasbeen a critical driver of land cover change around the world, particu-larly in the tropics. The Food and Agriculture Organization (FAO) ofthe United Nations Global Forest Resources Assessment (FRA) 2010
reported that globally rubber plantation extent has steadily increasedby 25% during the past two decades (FAO, 2010). Approximately 97%of global natural rubber supply comes from Southeast Asia (Li & Fox,2012). This land use is a primary driving factor for the conversionfrom swidden to monocultural cash plantations in montane areas ofmainland Southeast Asia (Fox & Vogler, 2005). This land use changeprocess has both economic and environmental outcomes. On theone hand, local farmers can improve financial stability as rubberplantations provide greater agricultural profit due to the increaseddemand for rubber products. Further, rubber plantations tend to havegreater agricultural resiliency compared to traditional cash cropsthat are more stressed by adverse weather. On the other hand, the
Remote Sensing of Environment 134 (2013) 392–402
⁎ Corresponding author at: Department of Microbiology and Plant Biology, and Centerfor Spatial Analysis, University of Oklahoma, 101 David L. Boren Blvd. Norman, OK 73019,USA. Tel.: +1 405 325 8941.
Contents lists available at SciVerse ScienceDirect
Remote Sensing of Environment
j ourna l homepage: www.e lsev ie r .com/ locate / rse
Mapping tropical forests and rubber plantations in complex landscapesby integrating PALSAR and MODIS imagery
Jinwei Dong a,⇑, Xiangming Xiao a, Sage Sheldon a, Chandrashekhar Biradar a, Guishui Xie b
a Department of Botany and Microbiology, and Center for Spatial Analysis, University of Oklahoma, 101 David L. Boren Blvd., Norman, OK 73019, USAb Rubber Research Institute, Chinese Academy of Tropical Agricultural Sciences, Baodaoxincun, Danzhou, Hainan 571737, China
a r t i c l e i n f o
Article history:Received 31 October 2011Received in revised form 15 July 2012Accepted 23 July 2012
Knowledge of the spatial distribution of forest types in tropical regions is important for implementationof Reducing Emissions from Deforestation and Forest Degradation (REDD), better understanding of theglobal carbon cycle, and optimal forest management. Frequent cloud cover in moist tropical regions poseschallenges for using optical images to map and monitor forests. Recently, Japan Aerospace ExplorationAgency (JAXA) released a 50 m orthorectified mosaic product from the Phased Array Type L-band Syn-thetic Aperture Radar (PALSAR) onboard the Advanced Land Observing Satellite (ALOS). PALSAR data pro-vides information about the land surface without cloud interference. In this study we use the fine beamdual (FBD) polarization PALSAR 50 m mosaic imagery and a Neural Network (NN) method to produce aland cover map in Hainan Island, China. Subsequently, forest areas are classified into evergreen anddeciduous forests and rubber plantations are mapped using vegetation and land surface water indicesderived from 250 to 500 m resolution MODIS products. The PALSAR 50 m forest cover map, MODIS-basedforest types and rubber plantation maps are fused to generate fractional maps of evergreen forest, decid-uous forest and rubber plantation within 500 m or 250 m pixels. PALSAR data perform well for land coverclassification (overall accuracy = 89% and Kappa Coefficient = 0.79) and forest identification (both theProducer’s Accuracy and User’s Accuracy are higher than 92%). The resulting land cover maps of forest,cropland, water and urban lands are consistent with the National Land Cover Dataset of China in 2005(NLCD-2005). Validation from ground truth samples indicates that the resultant rubber plantation mapis highly accurate (the overall accuracy = 85%). Overall, this study provides insight on the potential ofintegrating cloud-free 50 m PALSAR and temporal MODIS data on mapping forest types and rubber plan-tations in moist tropical regions.! 2012 International Society for Photogrammetry and Remote Sensing, Inc. (ISPRS) Published by Elsevier
B.V. All rights reserved.
1. Introduction
Tropical forests play an important role in the terrestrial carboncycle and reduce the amount of greenhouse gases such as carbondioxide (CO2), carbon monoxide (CO) and nitrogen monoxide(NO) in the atmosphere (Lelieveld et al., 2008). Tropical forests alsoprovide many ecosystem services that substantially affect humanwell-being (Foley et al., 2005; Pielke, 2005). Both human-induceddeforestation (primarily to convert land to agricultural uses) andnatural disturbance (e.g. fire, drought, wind blow-down) occurextensively in tropical regions (Bond-Lamberty et al., 2007; Kum-mer and Turner, 1994; Page et al., 2002; Sakaguchi et al., 2011).Plantations used for production of biofuels (e.g. oil palm) andindustrial resources (e.g. rubber, Hevea brasiliensis) have expanded
rapidly in tropical regions in the last 50 years (Fox and Vogler,2005). This expansion has brought along a detrimental cascade ofenvironmental effects including increasing threats to biodiversityand reduction in forest carbon stocks (Li et al., 2007; Ziegleret al., 2009). Accurate information on the area and spatial distribu-tion of natural and planted forests in tropical areas is necessary forthe implementation of Reducing Emissions from Deforestation andForest Degradation (REDD) (Achard et al., 2007) and for modelingglobal carbon cycles (Dixon et al., 1994).
During the past few decades, optical remote sensing has beenwidely utilized for forest mapping (Asner et al., 2005; Collinset al., 2004; Thessler et al., 2008; Xiao et al., 2009, 2002). Previousstudies have explored the potential for tropical forest mappingusing imagery from the Advanced Very High Resolution Radiome-ter (AVHRR) (Achard and Estreguil, 1995; Achard et al., 2001),SPOT4-VEGETATION (Stibig et al., 2004; Stibig and Malingreau,2003) and Moderate Resolution Imaging Spectroradiometer(MODIS) (Miettinen et al., 2012). Most of these studies employed
0924-2716/$ - see front matter ! 2012 International Society for Photogrammetry and Remote Sensing, Inc. (ISPRS) Published by Elsevier B.V. All rights reserved.http://dx.doi.org/10.1016/j.isprsjprs.2012.07.004
A comparison of forest cover maps in Mainland Southeast Asia frommultiple sources:PALSAR, MERIS, MODIS and FRA
Jinwei Dong a,⁎, Xiangming Xiao a, Sage Sheldon a, Chandrashekhar Biradar a,Nguyen Dinh Duong b, Manzul Hazarika c
a Department of Microbiology and Plant Botany, and Center for Spatial Analysis, University of Oklahoma, Norman, OK 73019, USAb Institute of Geography, Vietnam Academy of Science and Technology, 18 Hoang Quoc Viet Rd., Cau Giay, Hanoi, Vietnamc Geoinformatics Center, Asian Institute of Technology, P.O. Klong Luang, Pathumthani 12120, Thailand
a b s t r a c ta r t i c l e i n f o
Article history:Received 20 January 2012Received in revised form 14 August 2012Accepted 19 August 2012Available online xxxx
The uncertainty in tracking tropical forest extent and changes substantially affects our assessment of the con-sequences of forest change on the global carbon cycle, biodiversity and ecosystem services. Recentlycloud-free imagery useful for tropical forest mapping from the Phased Array Type L-band Synthetic ApertureRadar (PALSAR) onboard the Advanced Land Observing Satellite (ALOS) has become available. We usedPALSAR 50-m orthorectified mosaic imagery in 2009 and a decision tree method to conduct land cover clas-sification and generate a 2009 forest map, which was evaluated using 2106 field photos from the GlobalGeo-referenced Field Photo Library (http://www.eomf.ou.edu/photos). The resulting land cover classificationhad a high overall accuracy of 93.3% and a Kappa Coefficient of 0.9. The PALSAR-based forest map was thencompared with three existing forest cover products at three scales (regional, national, and continental):the Food and Agriculture Organization of the United Nations (FAO) Forest Resources Assessments (FRA)2010, Global Land Cover Map with MERIS (GlobCover) 2009, and the MODIS Terra+Aqua Land Cover Typeproduct (MCD12Q1) 2009. The intercomparison results show that these four forest datasets differ. ThePALSAR-based forest area estimate is within the range (6.1–9.0×10⁵ km2) of the other three products andclosest to the FAO FRA 2010 estimate. The spatial disagreements of the PALSAR-based forest, MCD12Q1 forestand GlobCover forest are evident; however, the PALSAR-based forest map provides more details (50-m spatialresolution) and high accuracy (the Producer's and the User's Accuracies were 88% and 95%, respectively) andPALSAR can be used to evaluate MCD12Q1 2009 and GlobCover 2009 forest maps. Given the higher spatialresolution, PALSAR-based forest products could further improve the modeling accuracy of carbon cycle intropical forests.
Large-scale deforestation in tropical regions has attracted muchattention in the past fewdecades due to its strong effects on atmospher-ic greenhouse gases (Fearnside, 2000), biodiversity (Lawton et al., 1998;Pimm & Raven, 2000), and regional climate (Salati & Nobre, 1991). For-est management requires timely and accurate information on forests(Hansen et al., 2008).
Southeast Asia has the third largest area of tropical rainforest in theworld, which is composed of tropical evergreen forest and deciduousforest in seasonal drought areas. However, it has been experiencing amore significant deforestation for conversion into agriculture (such asoil palm plantations) than anywhere else (UNEP/GRID-Arendal, 2009).
The humid tropical forest cover in Southeast Asia underwent the largestchanges with an annual net cover decrease rate of 0.71% from 1990 to1997, higher than Latin America and Africa (Achard et al., 2002).Much attention has been focused on those hotspots of deforestation,including Borneo (Curran, 2004; Langner et al., 2007; Meijaard &Sheil, 2007; Miettinen, 2007) and Sulawesi (Dechert et al., 2004). Anaccurate forest map is essential for efforts in ‘reducing emissions fromdeforestation and forest degradation’ (REDD).
Remote sensing has been used for forest inventory for decades(Hansen et al., 2010a, 2010b, 2008) and is considered to be an effec-tive tool for detecting forest extents and changes at regional and glob-al scales. A number of studies have sought to map forests in SoutheastAsia using a remote sensing approach. For example, the NationalOceanic and Atmospheric Administration Advanced Very High Reso-lution Radiometer (NOAA/AVHRR) data of 1990–1992 was used tomap forests through unsupervised classification of a vegetationindex (Normalized Difference Vegetation Index, NDVI) and Channel3 radiance (Achard & Estreguil, 1995). However, its accuracy could
Remote Sensing of Environment 127 (2012) 60–73
⁎ Corresponding author at: Department ofMicrobiology and Plant Botany, and Centerfor Spatial Analysis, University of Oklahoma, 101 David L. Boren Blvd. Norman, OK73019, USA. Tel.: +1 405 325 6091.
Mapping forest cover in mainland Southeast Asia at 50-‐m resolu4on
PALSAR image (HH, HV, HH/HV)
Field Photos
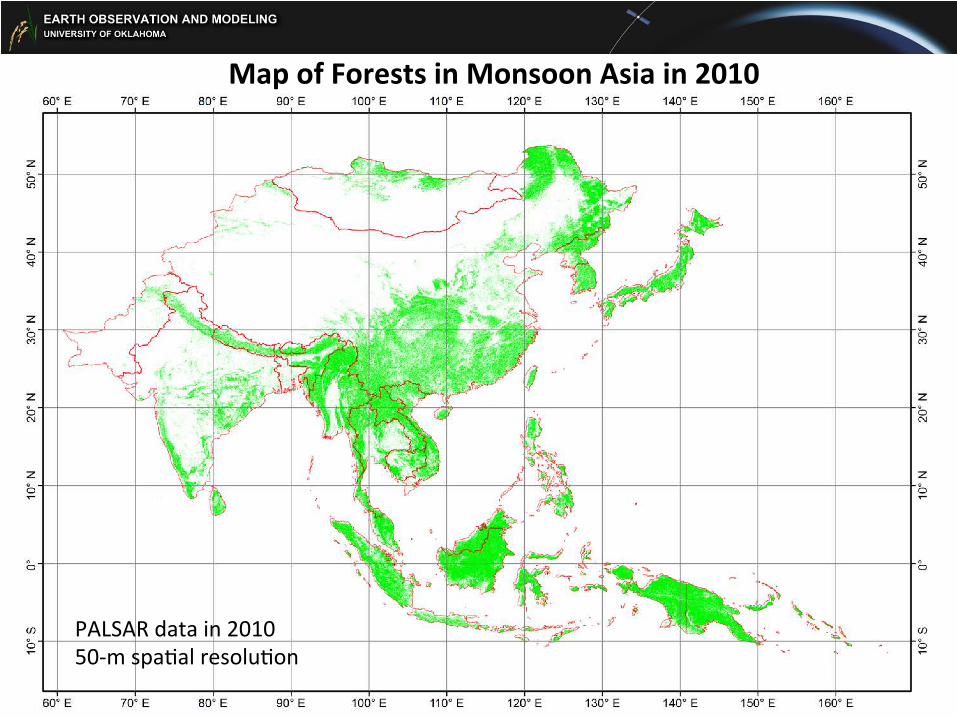
Map of Forests in Monsoon Asia in 2010
PALSAR data in 2010 50-‐m spa,al resolu,on
Integrated Land Data Portal (iLand) (hZp://www.eomf.ou.edu)
Data Storage Facility Petabyte off-‐line data archive system (OU/OSCER PetaStore, tapes) Petabyte near-‐line data storage system (OU/OSCER PetaStore, disks) Petabyte online data processing system (OU/EOMF, disks)
Cyberinfrastructure for Big Data Science Geo-‐ and Eco-‐Informa>cs