Removal of BTEX & Phenols from Highly Saline Water Using an Advanced Electrochemical Unit Bassam Tawabini, PhD., Eng. Water & Environmental Specialist Geosciences Department KFUPM, Dhahran, Saudi Arabia February 12, 2020
Transcript
Removal of BTEX & Phenols from Highly Saline Water
Using an Advanced Electrochemical Unit
Bassam Tawabini, PhD., Eng.
Water & Environmental Specialist
Geosciences Department
KFUPM, Dhahran, Saudi Arabia
February 12, 2020
Outline Introduction
The Problem Statement (Produced Water)
Research Objectives
Methodology
Results and Discussions
Removal of Phenols
Removal of BTEX
Concluding Remarks
Environmental Challenges
o Overpopulation and Environmental Health
o Poverty & Social Aspects
o Resources Utilization and Conservation
o Environmental Pollution
o Waste Management
o Ecology and Biodiversity
o Desertification, Deforestation….etc.
Human Use of Resources - Water
• Access to clean water is essential to life (a human right).
• More than 780 million people do not have access to potable water
• Additional 2.8 billion people live in water-scarce environments.
• Freshwater is unsustainably managed by wasting it, polluting it, and charging too little for it.
• Population, urbanization, economic development and even climate change cause water scarcity. In 2080, expected rise in global temperature by 3-4°C could add 1.8 billion people in areas of high water-stress.
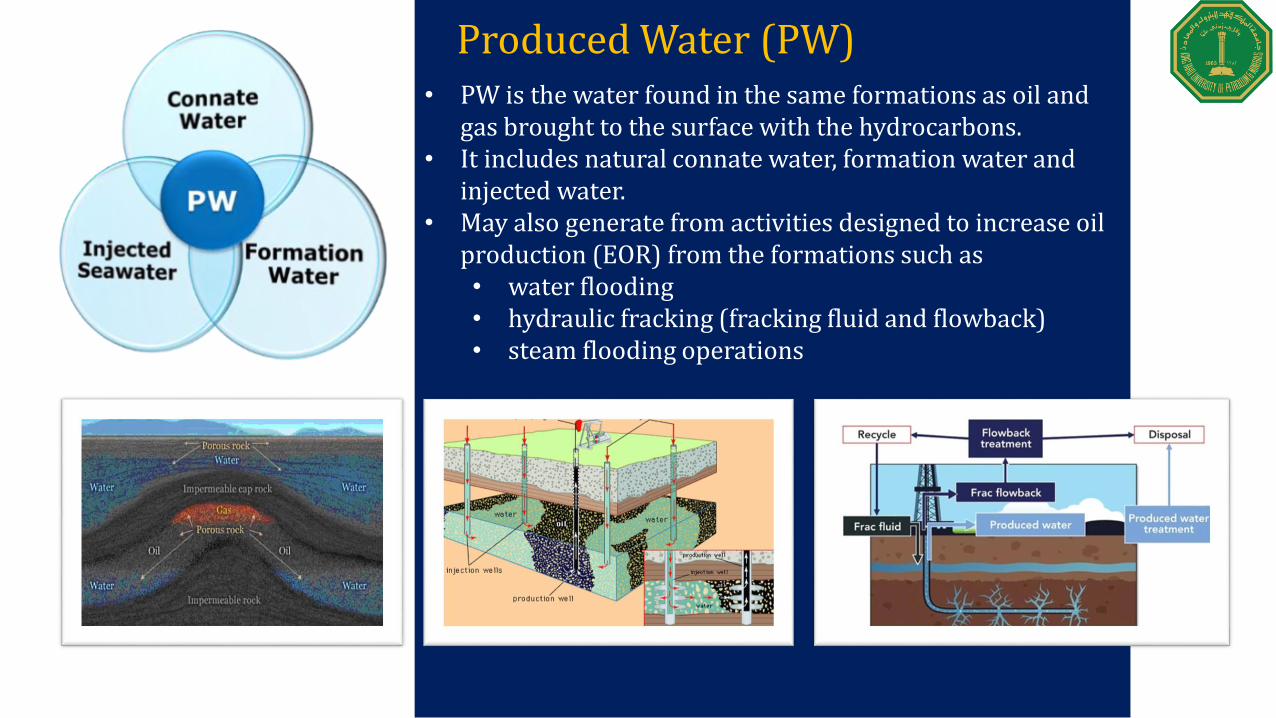
Produced Water (PW)• PW is the water found in the same formations as oil and
gas brought to the surface with the hydrocarbons.• It includes natural connate water, formation water and
injected water.• May also generate from activities designed to increase oil
production (EOR) from the formations such as • water flooding • hydraulic fracking (fracking fluid and flowback)• steam flooding operations
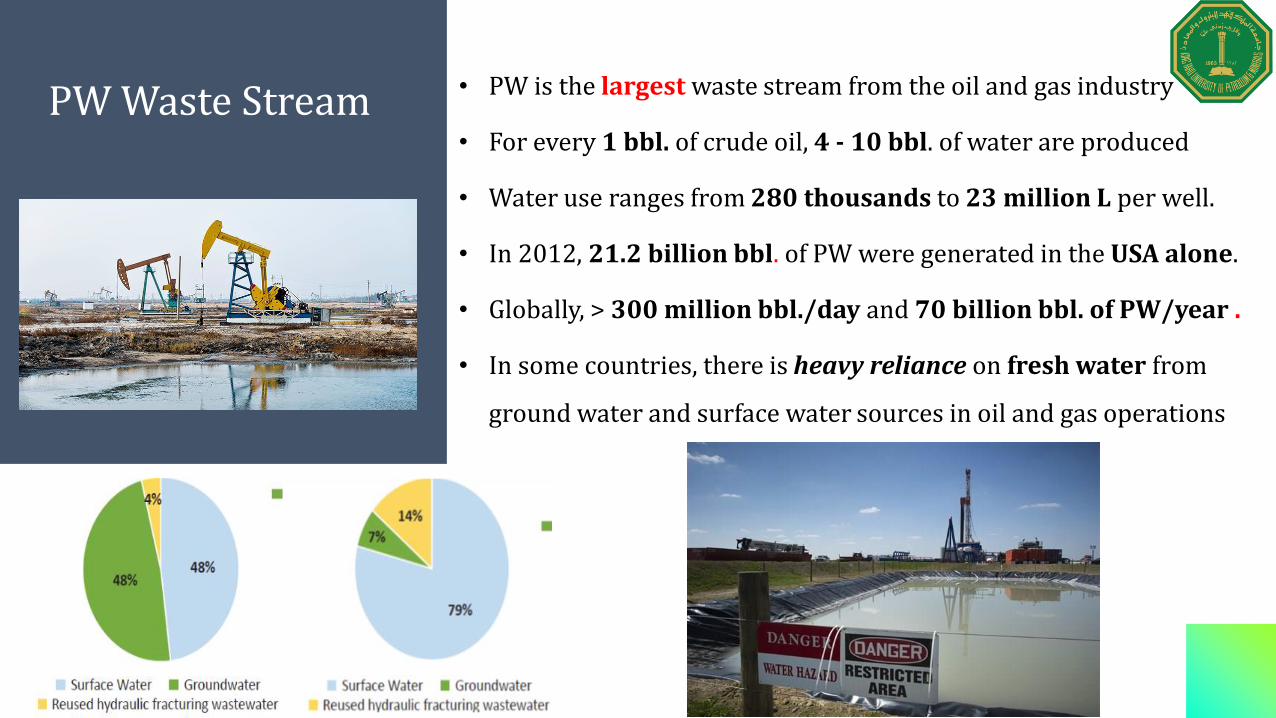
• PW is the largest waste stream from the oil and gas industry
• For every 1 bbl. of crude oil, 4 - 10 bbl. of water are produced
• Water use ranges from 280 thousands to 23 million L per well.
• In 2012, 21.2 billion bbl. of PW were generated in the USA alone.
• Globally, > 300 million bbl./day and 70 billion bbl. of PW/year .
• In some countries, there is heavy reliance on fresh water from
ground water and surface water sources in oil and gas operations
PW Waste Stream
• Chemical and physical characteristics of PW varyconsiderably from well to well.
• Produced water is usually highly saline (> 250,000 ppm), chemically complex and contains the characteristics of the formation from which it was produced.
• Solids• Chemical additives• Metals• Bacteria• NORMs• Others
Produced Water Characteristics
Average hydraulic fracturing fluid composition for US shale
Parameter Abdalla et al.,
2011
Rosenblum et
al., 2017
Total alkalinity (mg/L) 138 475
Hardness (as CaCO3) (mg/L) 17,700 -
Total Suspended Solids (TSS) (mg/L) 99 172
Total Dissolved Solids (TDS) (mg/L) 67,300 18,756
Turbidity (NTU) 80 223
Chloride (mg/L) 41,850 11,650
Bromide (mg/L) 445 168.5
Specific conductance (mS/cm) 16,750 -
Total Kjeldahl nitrogen (mg/L) 86.1 -
Ammonia nitrogen (mg/L) 71.2 -
Biochemical Oxygen Demand (BOD5) (mg/L) 144 -
Chemical Oxygen Demand (COD) (mg/L) 4,870 2,543
Total Organic Carbon (TOC) (mg/L) 62.8 -
Dissolved Organic Carbon (DOC) (mg/L) 114 -
pH - 6.80
• TSS may be in hundreds of ppm
• TDS range from 8,000 to 200,000 ppm
• TOC can be up to 2000 ppm
• COD may reach 20,000 ppm in the
flowback water
• Iron (Fe) can reach a max. of 500 ppm
• Heavy metals are also present in PW in
varying levels
• High organic contents of hydrocarbons
(phenols, BTEX, PAHs…etc.)
Contents of flowback/produced water
Abdalla, C.W. et al (2011) Marcellus shale wastewater issues in Pennsylvania–current and emerging treatment and disposal technologies, Penn State Water Resources Extension, The Pennsylvania State University
Rosenblum, J., et al (2017) Science of the Total Environment 596–597, 369–377.
• One of the largest challenges facing the oil & gas industry
• Needs economical and environmental friendly methods of treatment for the sake of recycling/reuse for beneficial use.
• The methodology of handling PW depends on:
The composition and quantity of PW
Location
The availability of resources (cost…etc.)
• The strategies applied to management options can be of a 3-tiered water hierarchy :
• Minimization
• Reuse/recycle, and
• Disposal
Management of Produced
Water
Management of The Produced Water…
What are our options?
Minimization
• Reduce water use via mechanical methods
Reuse/Recycle
• Treatment for beneficial reuse in the O&G• Re-injection for EOR processes
• Treatment for beneficial recycle (irrigation, livestock consumption, industrial cooling…etc.)
Disposal
• Onshore-Offshore Disposal• Evaporation (ponds)• Deep well Injection (Class II)
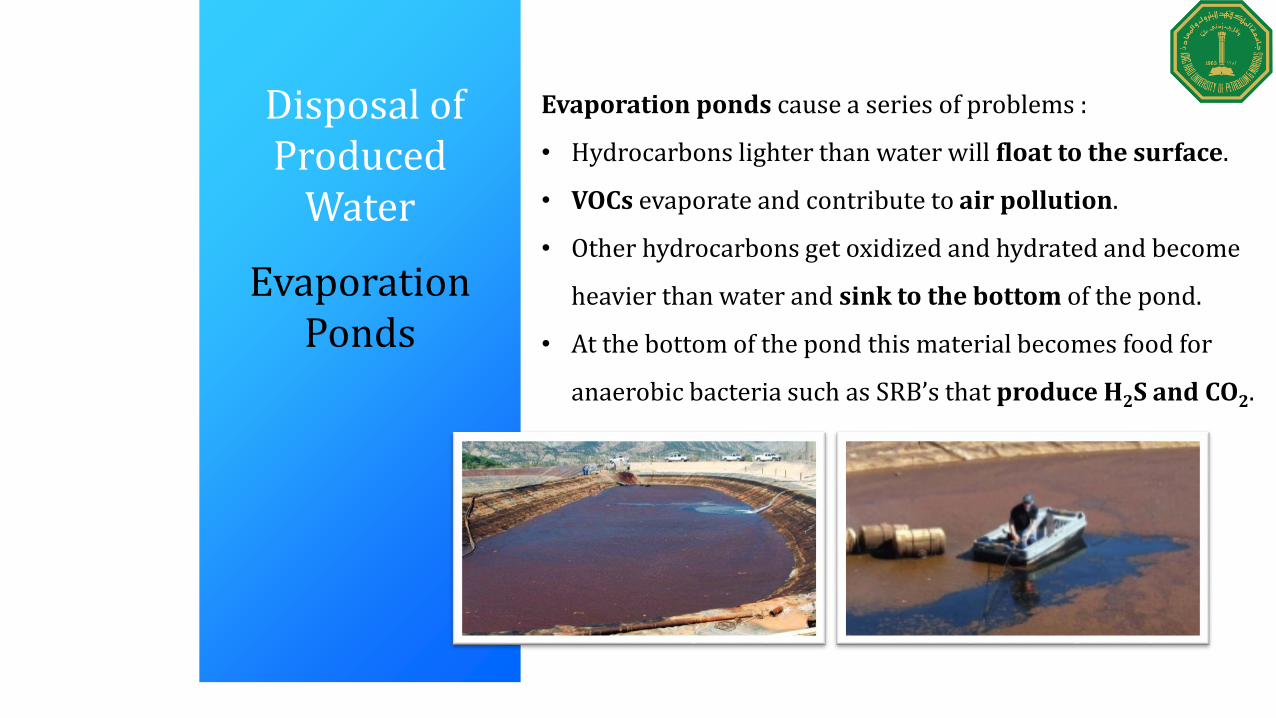
Evaporation ponds cause a series of problems :
• Hydrocarbons lighter than water will float to the surface.
• VOCs evaporate and contribute to air pollution.
• Other hydrocarbons get oxidized and hydrated and become
heavier than water and sink to the bottom of the pond.
• At the bottom of the pond this material becomes food for
anaerobic bacteria such as SRB’s that produce H2S and CO2.
Disposal of Produced
Water
Evaporation Ponds
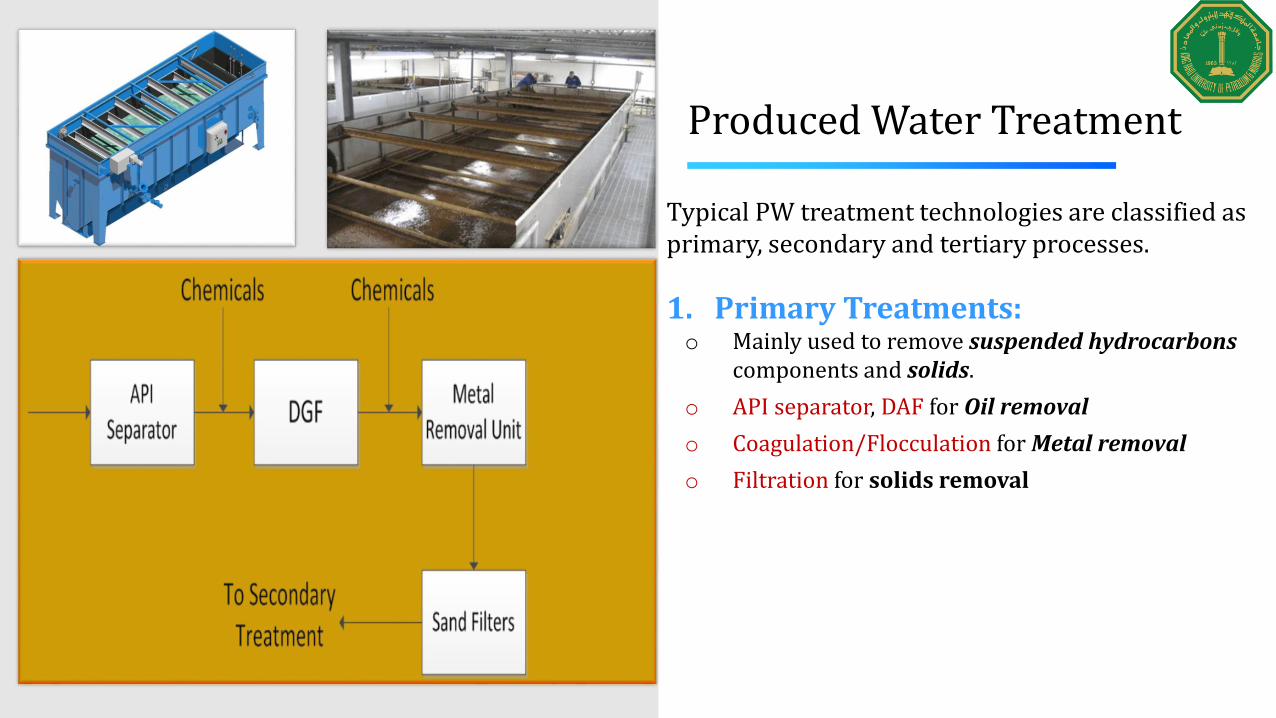
Multiple processes are needed for the treatment for PW aiming to:
• De-oiling – removal of free and dispersed oil, grease, etc.
• Soluble organics removal – removal of dissolved organics
• Suspended solids removal – removal of sand, clay, etc.
• Dissolved gas removal – removal of CO2, H2S, etc.
• Desalination or demineralization – removal of salts, etc.
• Softening – removal of excess water hardness
• Miscellaneous –NORM removal
• Disinfection – removal of bacteria, etc.
Produced Water Treatment
Treatment Methods of Produced
Water
Water End Uses Water Quality Required
Reuse for hydraulic fracturing Moderate TDS, Low SSLow Ca, Mg, Fe, sulfate (scale formers)
Deep well disposal Low Ca, Mg, Fe, sulfate (scale formers)Low SS
Discharge to surface water (e.g. in, US) < 500mg/L TDS, < 250 mg/L chloride, < 250 mg/L sulfates,< 10mg/L total barium, < 10mg/L total strontium
Crop irrigation Low salinity (TDS), Low toxicity (free of organic and trace metals)Low sodium adsorption ratio (SAR <6)
Wildlife and livestock consumption Moderate TDS (<5,000 mg/L), pH 6.5‒8, SAR 5‒8
Aquaculture and hydroponic vegetable culture Moderate TDS, Low metals
Dust control on roads and in mining Low SS and Low in specific constituents like metals
Vehicle and equipment washing Low SS and Moderate TDS
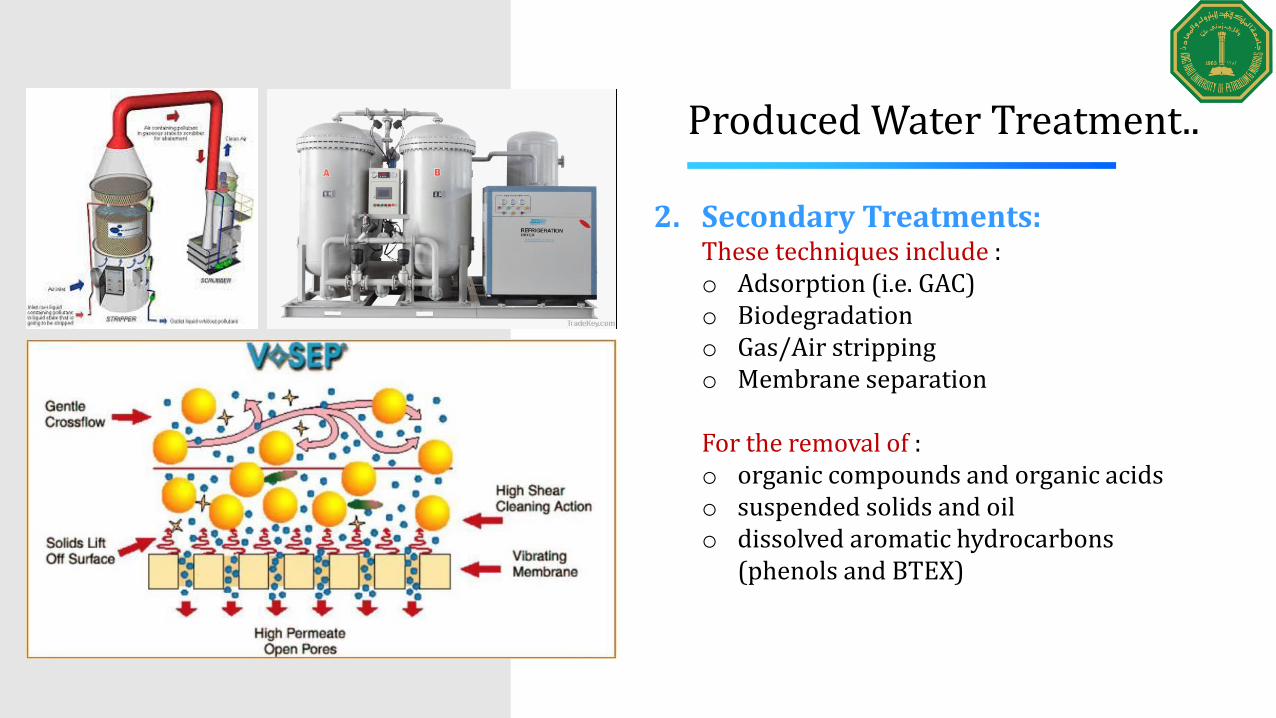
• Offer several advantages such as compact module, lower energy consumption, environmental friendliness and high quality product independently on fluctuations in feed quality
• Issues include high cost, fouling and residue.
Produced Water Treatment…
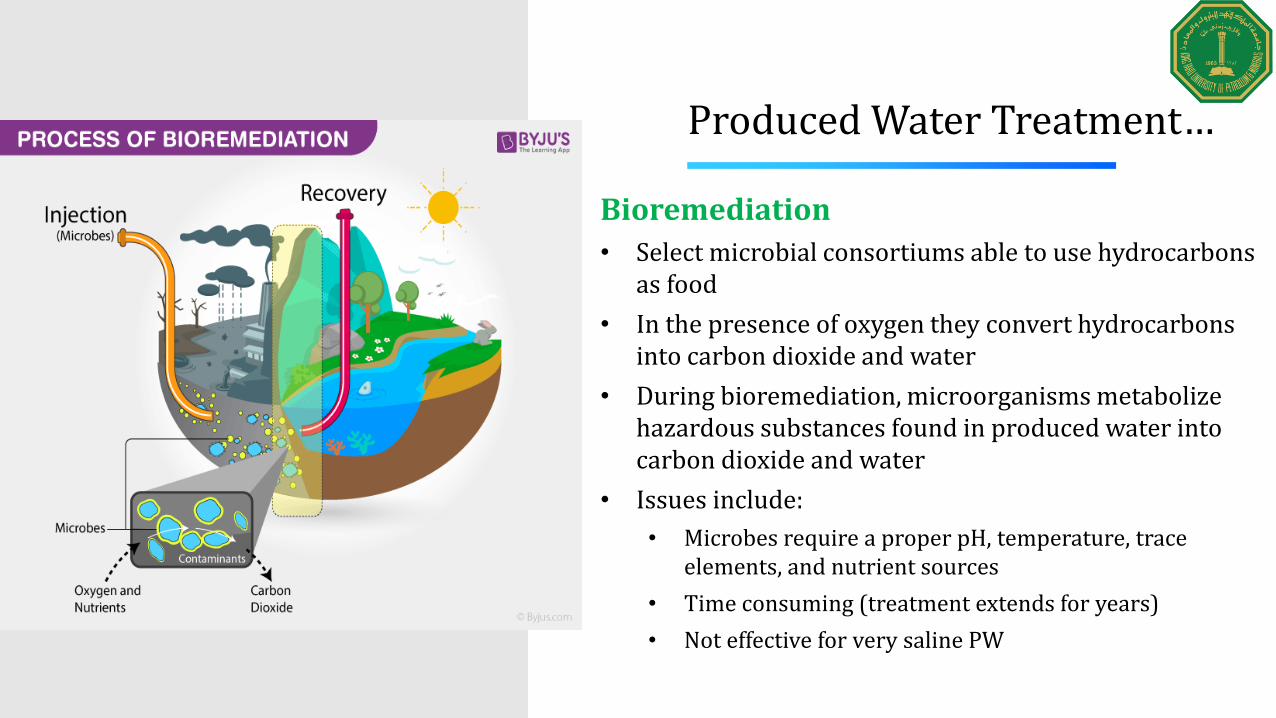
Bioremediation
• Select microbial consortiums able to use hydrocarbons as food
• In the presence of oxygen they convert hydrocarbons into carbon dioxide and water
• During bioremediation, microorganisms metabolize hazardous substances found in produced water into carbon dioxide and water
• Issues include:
• Microbes require a proper pH, temperature, trace elements, and nutrient sources
• Time consuming (treatment extends for years)
• Not effective for very saline PW
Produced Water Treatment…
Constructed Wetland
Achieved by interactions between water, plants, microorganisms, filter media and oxygen.
• The Bauer-Nimr Water Treatment Plant (NWTP) is the world's largest engineered constructed wetland, located in Oman for Petroleum Development-Oman Co.
• It can treat more than 115,000m3/day produced water.
Produced Water Treatment…
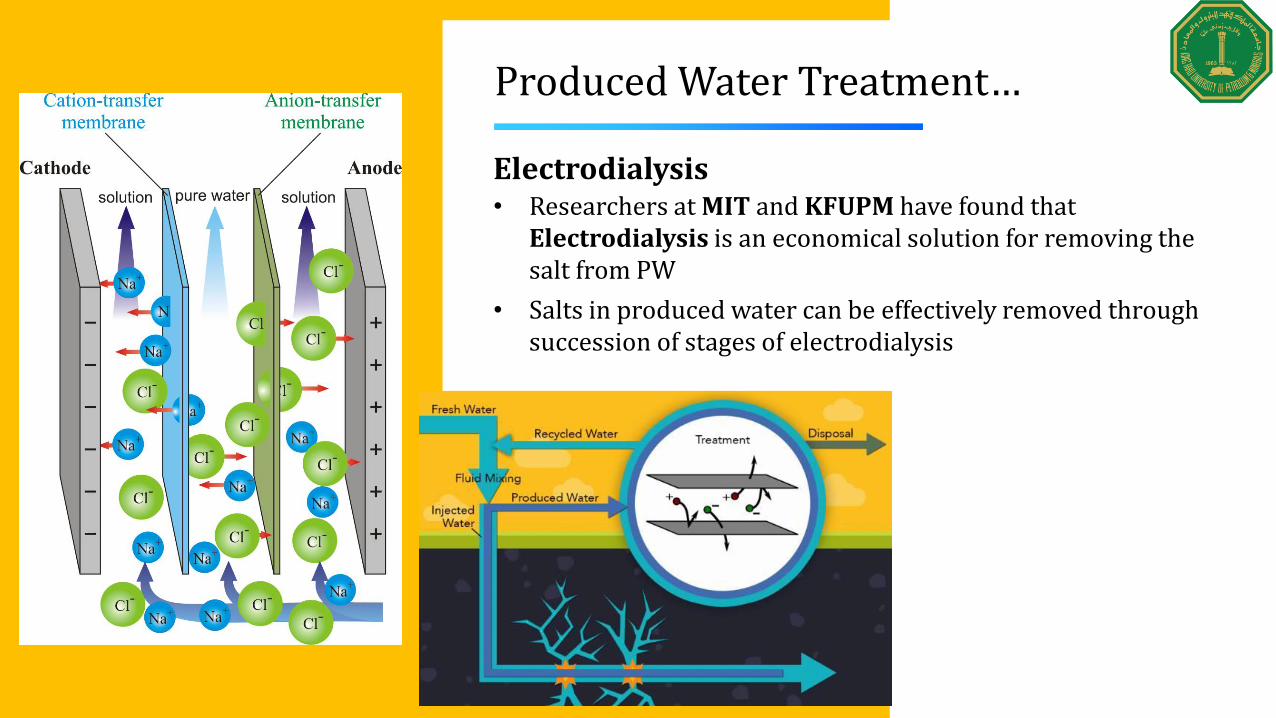
Electrodialysis• Researchers at MIT and KFUPM have found that
Electrodialysis is an economical solution for removing the salt from PW
• Salts in produced water can be effectively removed through succession of stages of electrodialysis
Produced Water Treatment…
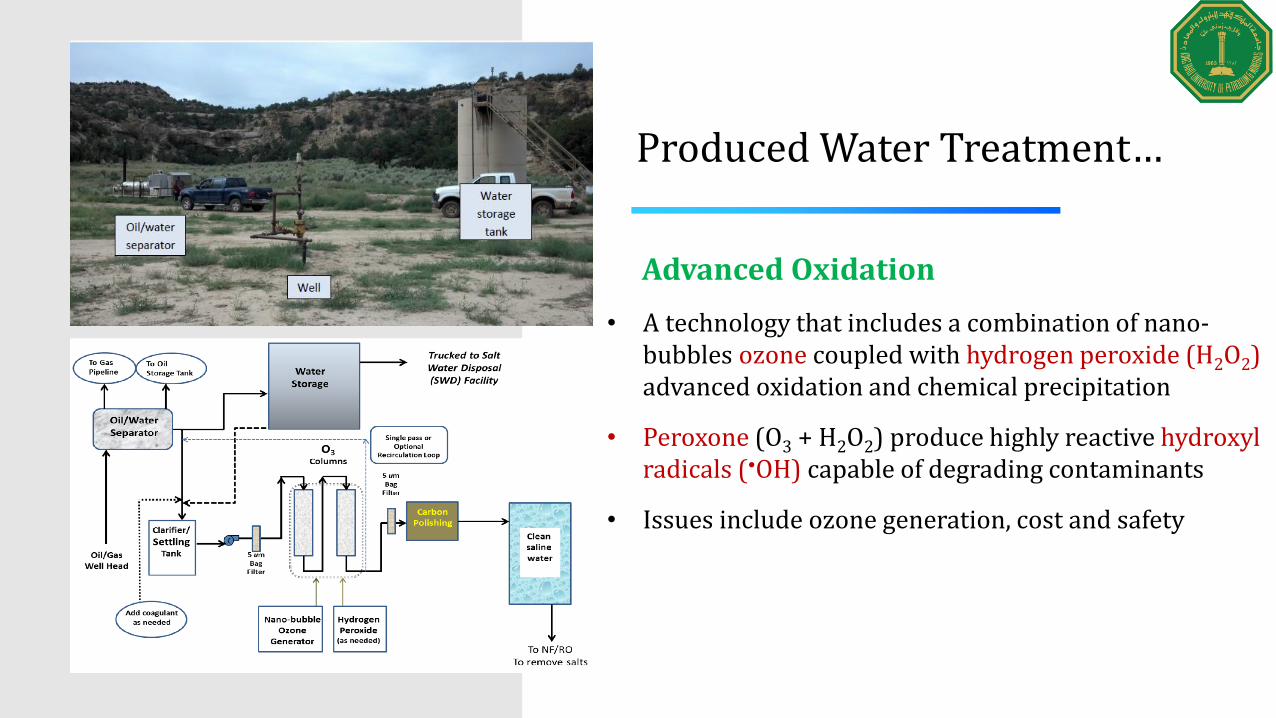
Advanced Oxidation
• A technology that includes a combination of nano-bubbles ozone coupled with hydrogen peroxide (H2O2) advanced oxidation and chemical precipitation
• Peroxone (O3 + H2O2) produce highly reactive hydroxyl radicals (•OH) capable of degrading contaminants
• Issues include ozone generation, cost and safety
Electrochemical treatment
• Based upon the complete degradation of contaminants in water via electro-generated oxidants (H2O2 and O3) and strong oxidants such as hydroxyl radicals (•OH)
• Can be of different types :
• Electrooxidation / Electroreduction
• Electrodialysis
• Electrocoagulation/Electroflotation
• Photo-assisted electrochemical
• Fenton-based electrochemical
Produced Water Treatment…
Electrochemically generation of Fenton’s reagent.
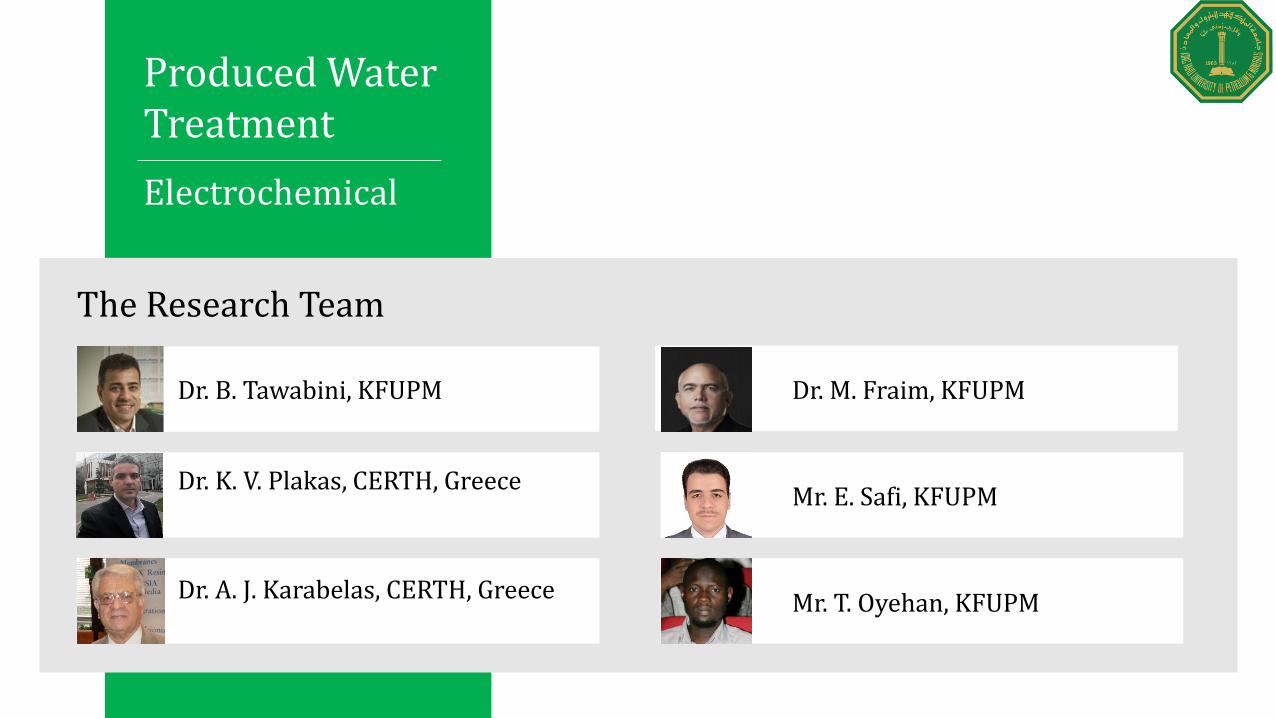
Dr. M. Fraim, KFUPM
Mr. E. Safi, KFUPM
Mr. T. Oyehan, KFUPM
Dr. B. Tawabini, KFUPM
Dr. K. V. Plakas, CERTH, Greece
Dr. A. J. Karabelas, CERTH, Greece
The Research Team
Produced Water Treatment
Electrochemical
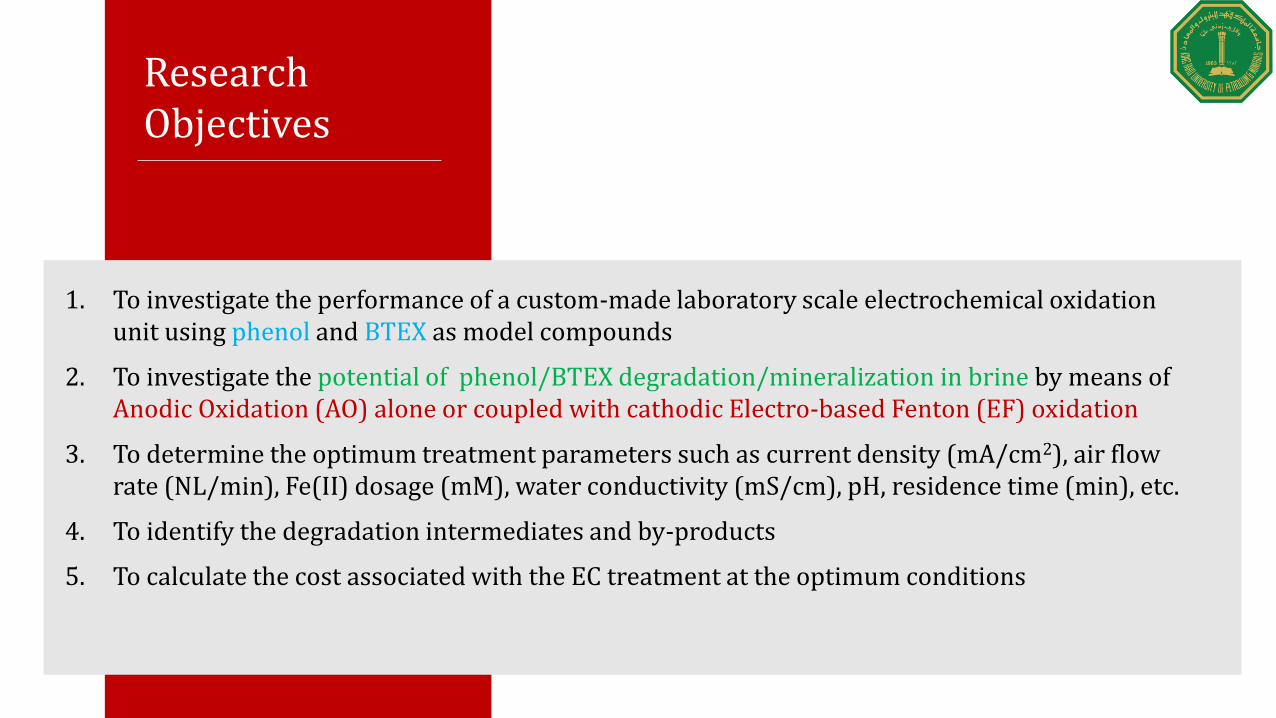
Research Objectives
1. To investigate the performance of a custom-made laboratory scale electrochemical oxidation unit using phenol and BTEX as model compounds
2. To investigate the potential of phenol/BTEX degradation/mineralization in brine by means of Anodic Oxidation (AO) alone or coupled with cathodic Electro-based Fenton (EF) oxidation
3. To determine the optimum treatment parameters such as current density (mA/cm2), air flow rate (NL/min), Fe(II) dosage (mM), water conductivity (mS/cm), pH, residence time (min), etc.
4. To identify the degradation intermediates and by-products
5. To calculate the cost associated with the EC treatment at the optimum conditions
• pH, conductivity, temperature and redox potential are monitored and recorded
• untreated and treated brine spiked with phenols and BTEX was assessed under various treatment conditions
• degradation by-products were monitored
The Pilot EC Unit
Schematic diagram of the Electrochemical Treatment System pilot plant equipped with (1) a plate-and-frame electrochemical cell, (2) a DC power supply, (3) a compressed air system, (4) an horizontal multistage pump, (5) a feed tank and several sensors located at the inlet and the outlet of the cell, measuring different operating variables. (b) Front view of the pilot unit.
Front view
Back view
Phenol/BTEX Degradation Tests
• Phenol Initial Concentration: 50 mg/L
• BTEX Initial Concentration: 0.5-2.5 mg/L
• Water Matrix: Distilled water, Brackish water (GW), Synthetic saline water(water + NaCl), Seawater and RO reject water.
• Conductivity : ∼ 2000 to 70,000 μS/cm
• pH : 3 - 10
• Fe(II): 0.5 – 2 mM (28-112 mg/L)
• Current density (j) : 0 – 60 (mA/cm2 or 2-6 Amp)
• Air Flowrate : 0 - 5 (NL/min)
• Water Circulation Rate : 0.2 - 0.4 (m3/h)
• Phenol and BTEX Concentrations: measured by Thermo GC/MS
• TOC by Analytik Jena Multi N/C 3100 TOC Analyzer
Thermo Fisher ISQ Series Single Quadrupole GC-MS Systems
N/C 3100 pharma Analytik Jena TOC analyzer
Parameter Unit Distilled water Brackish water Seawater
Conductivity µS/cm 2.2 5706.5 63925.0
pH - 6.1 6.9 8.2
TOC mg/L n.d 0.0 0.3
Inorg. Carbon mg/L n.d 62.0 0.0
Na+ mg/L n.d 467.8 8860.0
K+ mg/L n.d 20.1 306.4
Mg2+ mg/L 0.5 104.5 1657.3
Ca2+ mg/L n.d 297.1 769.9
Li+ mg/L n.d 0.5 n.d
NH4+ mg/L n.d n.d n.d
F- mg/L n.d 1.8 6.9
Cl- mg/L 0.1 1387.7 23121.5
SO42- mg/L 0.3 661.5 3550.5
Br- mg/L n.d 8.7 108.4
NO3- mg/L n.d 9.2 32.5
HPO42- mg/L n.d n.d n.d
NO2- mg/L n.d n.d n.d
Water quality parameters of feed water types used in the experiments
Phenol Removal
Effect of current density
0.0
0.2
0.4
0.6
0.8
1.0
0 20 40 60 80 100 120 140
[Ph
eno
l]/[
Ph
eno
l]o
Electrolysis time (min)
0 mA/cm2
20 mA/cm2
40 mA/cm2
60 mA/cm2
a b
0.0
0.2
0.4
0.6
0.8
1.0
0 20 40 60 80 100 120 140
[TO
C]/
[TO
C] o
Electrolysis time (min)
0 mA/cm2
20 mA/cm2
40 mA/cm2
60 mA/cm2
0 mA cm-2
20 mA cm-2
40 mA cm-2
60 mA cm-2
0 mA cm-2
20 mA cm-2
40 mA cm-2
60 mA cm-2
The higher the current density the faster the degradation.
Phenol Removal
Effect of the water matrix (chloride content)
Increasing the salinity tends to significantly enhance phenol removal and the respective degree of mineralization.
highly reactive chlorine species electrogenerated in the cell can effectively strengthen the oxidation of the dissolved phenol in the bulk.
0.0
0.2
0.4
0.6
0.8
1.0
0 20 40 60 80 100 120 140
[TO
C]/
[TO
C] o
Electrolysis time (min)
BW (2330 μS/cm)
BW+RW (4800 μS/cm)
RW (5700 μS/cm)
SW (36150 μS/cm)
0.0
0.2
0.4
0.6
0.8
1.0
0 20 40 60 80 100 120 140
[Ph
eno
l]/[
Ph
eno
l]o
Electrolysis time (min)
BW (2330 μS/cm)
BW+RW (4800 μS/cm)
RW (5700 μS/cm)
SW (36150 μS/cm)
a bBW (2330 μS cm-1)
BW+RW (4800 μS cm-1)
RW (5700 μS cm-1)
SW (36150 μS cm-1)
BW (2330 μS cm-1)
BW+RW (4800 μS cm-1)
RW (5700 μS cm-1)
SW (36150 μS cm-1)
Phenol Removal
Effect of Fe(II) concentration –Electro-Fenton investigation
The addition of ferrous ions did not enhance the degradation and the mineralization rate of phenol (i.e. negligible Fenton reactions due to scavenging effect of chloride ions)
a) b)
0.0
0.2
0.4
0.6
0.8
1.0
0 20 40 60 80 100 120 140
[Ph
eno
l]/[
Ph
eno
l]o
Electrolysis time (min)
0.0 mM Fe
0.5 mM Fe
1.0 mM Fe
2.0 mM Fe
0.0
0.2
0.4
0.6
0.8
1.0
0 20 40 60 80 100 120 140
[TO
C]/
[TO
C] o
Electrolysis time (min)
0.0 mM Fe
0.5 mM Fe
1.0 mM Fe
2.0 mM Fe
a b
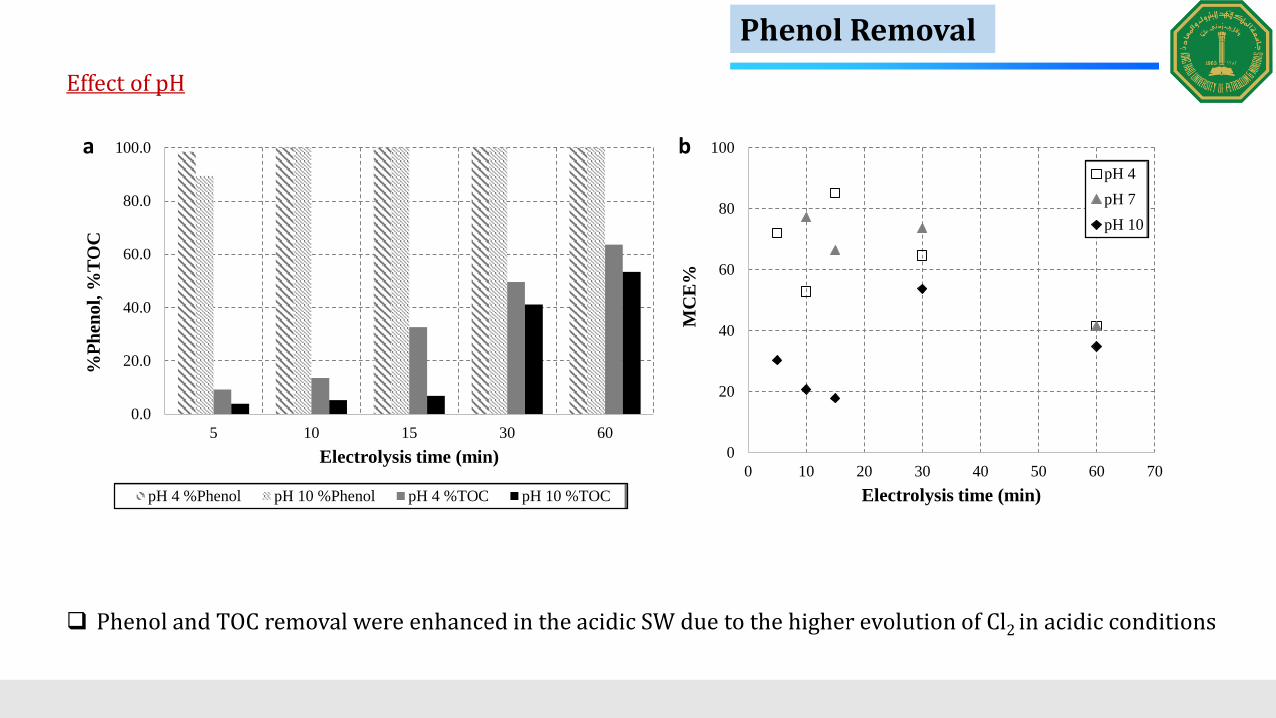
Phenol Removal
Effect of pH
Phenol and TOC removal were enhanced in the acidic SW due to the higher evolution of Cl2 in acidic conditions
0.0
20.0
40.0
60.0
80.0
100.0
5 10 15 30 60
%P
hen
ol,
%T
OC
Electrolysis time (min)
pH 4 %Phenol pH 10 %Phenol pH 4 %TOC pH 10 %TOC
a
0
20
40
60
80
100
0 10 20 30 40 50 60 70
MC
E%
Electrolysis time (min)
pH 4
pH 7
pH 10
b
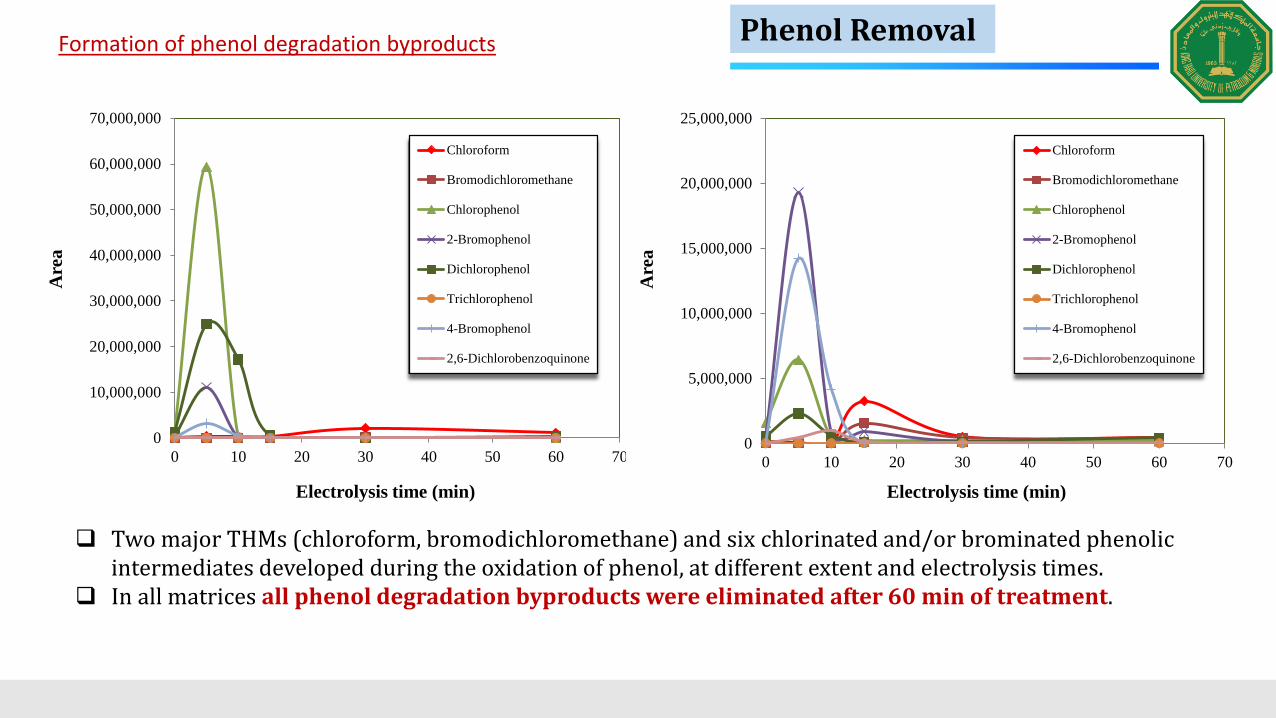
Phenol RemovalFormation of phenol degradation byproducts
0
10,000,000
20,000,000
30,000,000
40,000,000
50,000,000
60,000,000
70,000,000
0 10 20 30 40 50 60 70
Are
a
Electrolysis time (min)
Chloroform
Bromodichloromethane
Chlorophenol
2-Bromophenol
Dichlorophenol
Trichlorophenol
4-Bromophenol
2,6-Dichlorobenzoquinone
0
5,000,000
10,000,000
15,000,000
20,000,000
25,000,000
0 10 20 30 40 50 60 70
Are
a
Electrolysis time (min)
Chloroform
Bromodichloromethane
Chlorophenol
2-Bromophenol
Dichlorophenol
Trichlorophenol
4-Bromophenol
2,6-Dichlorobenzoquinone
Two major THMs (chloroform, bromodichloromethane) and six chlorinated and/or brominated phenolic intermediates developed during the oxidation of phenol, at different extent and electrolysis times.
In all matrices all phenol degradation byproducts were eliminated after 60 min of treatment.
Removal mechanism
BDD
anodeGDE
cathode
- +Air
Η2
Ο
BDD(•OH)
Cl-
Cl2
Cl-
Cl•
Halogenat
ed
byproduct
s
CO2+H2O
BDD(•OH)
Η2
Ο
2e-
O2
2O2-
2H+
O2Η2Ο
2O2
(anod
e)
Oxidation owing to the high oxidation power of the heterogeneously formed hydroxyl radicals (BDD(•OH)) on the BDD anode:
BDD + H2O → BDD(•OH) + H+ + e-
Oxidation by other oxidants formed homogeneously in the bulk electrolyte:
3Η2ΟΟ3(g) + 6H+ + 6e-
2Cl- Cl2
2SO42- S2O8
2- + 2e-
2HSO4- S2O8
2- + 2H+ + 2e-
Exp. No Water matrix Conductivity (μS cm-1) Ecell (V) I (A) ΔTOC (g L-1) EC (kWh gTOC-1) CE (USD m-3)
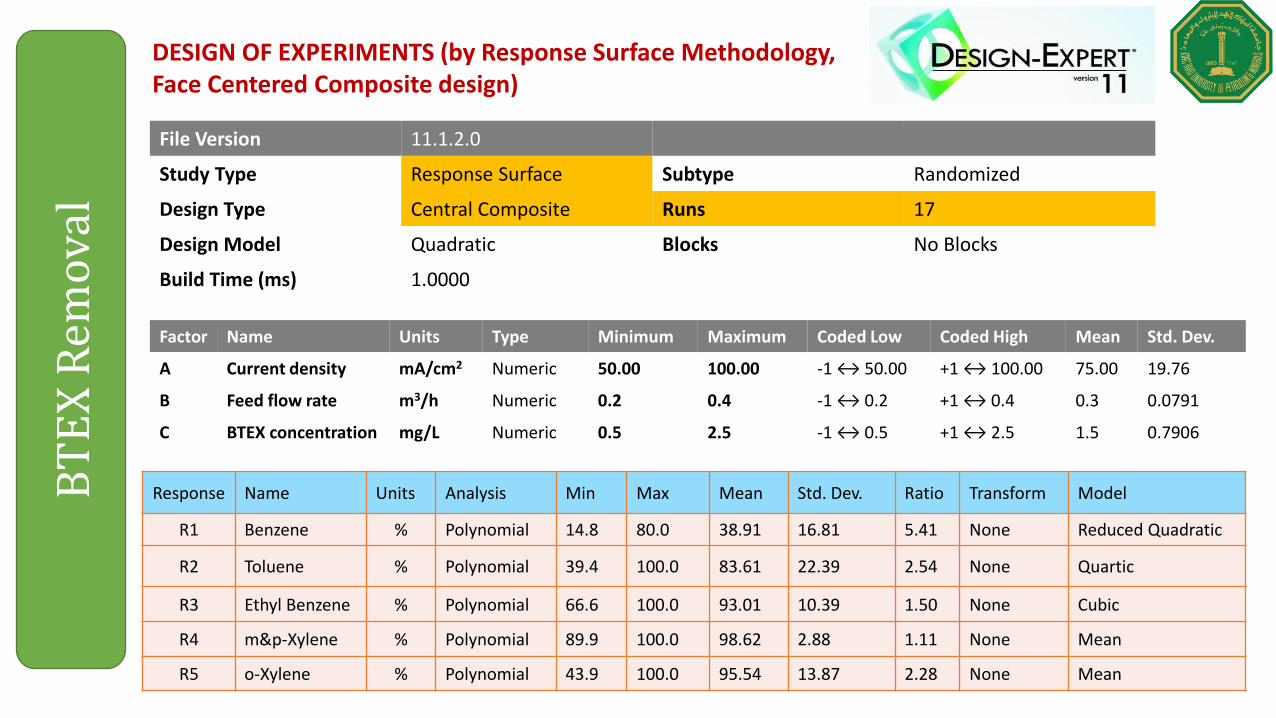
DESIGN OF EXPERIMENTS (by Response Surface Methodology, Face Centered Composite design)
-20.0
0.0
20.0
40.0
60.0
80.0
100.0
120.0
0 20 40 60 80 100 120 140
o Xylene, F Rate = 0.4, 2.5 ppm,
7.5 10
0 5
-20.0
0.0
20.0
40.0
60.0
80.0
100.0
120.0
0 20 40 60 80 100 120 140
m,p Xylene, F = 0.3, 2.5 ppm
0 10
5 7.5
BT
EX
Rem
ova
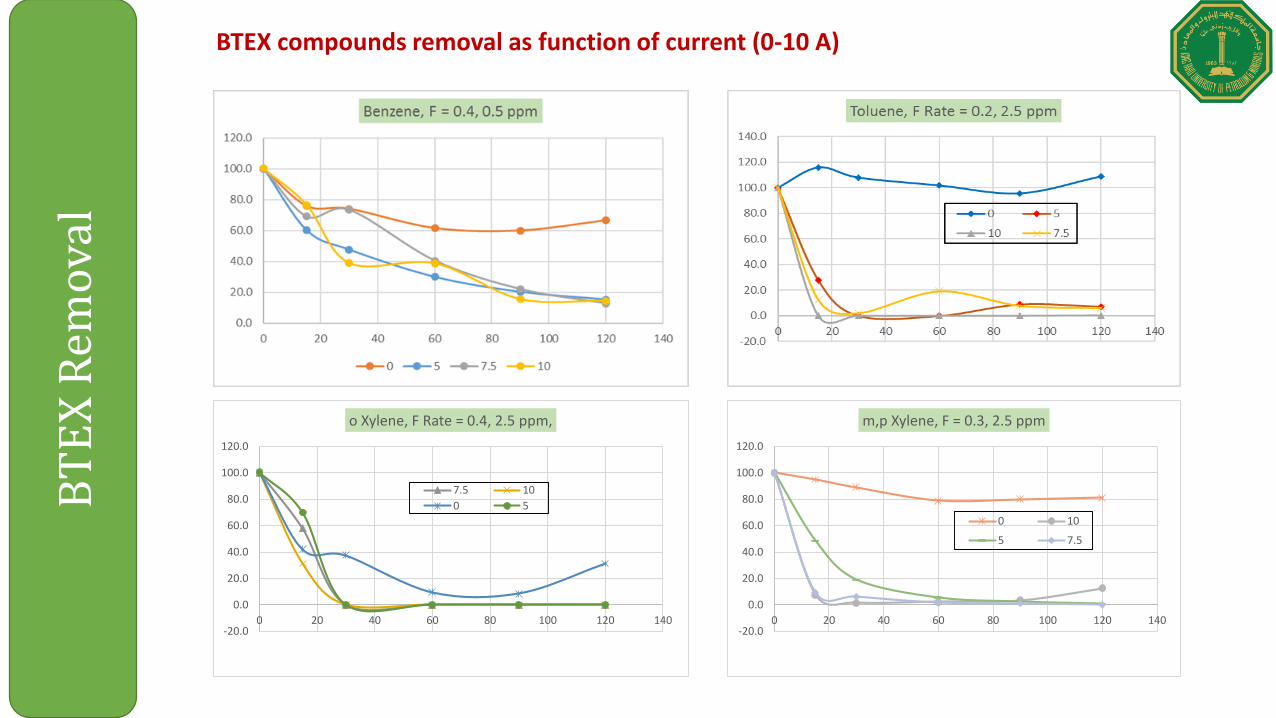
l BTEX compounds removal as function of current (0-10 A)
a) Contour plots and b) 3D surface plots for the five BTEX molecules as function of the electric current (A) and feed flow rate (B). Experimental data correspond to 30 min of batch operation at [BTEX]=1.5 mg/L
Total removal of xylenes with no direct correlation to j or FFR
BT
EX
Rem
ova
l…
Run A: j (mA/cm2) B: FFR
(m3/h)
C: [BTEX]
(mg/L)
%Benzene
Removal
%Toluene
Removal
%Ethyl
Benzene
Removal
%m&p-
Xylene
Removal
%o-
Xylene
Removal
1 100 0.4 0.5 61.2 100 100 100 100
2 75 0.3 1.5 22.9 97.9 90.3 100 100
3 50 0.4 2.5 38.3 100 100 100 96.3
4 100 0.2 2.5 34 100 100 99.9 100
5 75 0.3 1.5 25.3 98.1 92.4 100 100
6 50 0.2 0.5 40.6 99.8 100 99.9 84
7 75 0.3 2.5 24.6 58.5 100 93.8 100
8 50 0.3 1.5 37.4 50.8 80.4 95.6 100
9 75 0.3 0.5 55 99.9 100 100 100
10 75 0.4 1.5 14.8 39.4 100 100 43.9
11 50 0.4 0.5 52.5 99.9 100 99.9 100
12 100 0.3 1.5 42.4 54.6 75.7 89.9 100
13 100 0.4 2.5 52.1 63.2 66.6 100 100
14 50 0.2 2.5 29.3 100 100 100 100
15 100 0.2 0.5 80 99.1 100 99.8 100
16 75 0.3 1.5 24.6 96.8 91.1 100 100
17 75 0.2 1.5 26.5 63.4 84.6 97.7 100
Summary of main experimental conditions and results (for electrolysis time 30 min)
• The performance of a novel process scheme, employing an electrochemical advanced oxidation treatment that couples anodic oxidation (AO), electro-Fenton (EF) and electrochlorination (ECL) has been investigated for degradation of phenol and BTEX present in high salinity waters.
• Contrary to expectations, EF reactions are not favored in high salinity waters as evidenced by the reduced phenol/BTEX mineralization efficiencies in the presence of ferrous iron.
• Feeding air to the cathodic electrode (GDE) reduced the degradation and overall process performance.
• The electrochemical treatment of strongly saline waters and of elevated chloride content resulted in an increased phenol and BTEX degradation/mineralization.
• Major phenol degradation by-products, identified during water treatment, including dichlorophenol, trichlorophenol, napthalene, THMs, were totally degraded under the highly oxidative conditions prevailing in the cell.
• Estimated energy consumption and cost of treatment of the investigated novel process, contrasted to those of other relevant technologies are encouraging.
• Currently, the research team is investigating the by-products of BTEX degradation by ECL.