Page 1
1
Removal of several pesticides in a falling water film DBD reactor
with activated carbon textile: energy efficiency
Patrick Vanraes1,*
, Houria Ghodbane2,3
, Dries Davister4, Niels Wardenier
1,4, Anton
Nikiforov1, Yannick P. Verheust
4, Stijn W. H. Van Hulle
4, Oualid Hamdaoui
2, Jeroen
Vandamme5, Jim Van Durme
5, Pieter Surmont
6, Frederic Lynen
6, Christophe Leys
1
1 Department of Applied Physics, Ghent University, Sint-Pietersnieuwstraat 41 B4, 9000 Ghent, Belgium
2Laboratory of Environmental Engineering, Department of Process Engineering, Badji Mokhtar-Annaba , University, 23000 Annaba,
Algeria
3University of Souk Ahras, Faculty of Science and Technology, Department of Process Engineering, 41000 Souk
Ahras, Algeria
4LIWET, Department of Industrial Biological Sciences, Ghent University Campus Kortrijk, Graaf Karel de Goedelaan 5, 8500 Kortrijk,
Belgium
5Research Group Molecular Odor Chemistry, Department of Microbial and Molecular Systems (M2S), KU Leuven, Technology Campus,
Gebroeders De Smetstraat 1, 9000 Ghent, Belgium
6 Separation Science Group, Department of Organic and Macromolecular Chemistry, Ghent University, Krijgslaan 281 S4-bis, 9000 Gent,
Belgium
* Corresponding author
E-mail address: [email protected] (P. Vanraes).
Abstract
Bio-recalcitrant micropollutants are often insufficiently removed by modern wastewater treatment plants to meet the future
demands worldwide. Therefore, several advanced oxidation techniques, including cold plasma technology, are being
investigated as effective complementary water treatment methods. In order to permit industrial implementation, energy
demand of these techniques needs to be minimized. To this end, we have developed an electrical discharge reactor where
water treatment by dielectric barrier discharge (DBD) is combined with adsorption on activated carbon textile and additional
ozonation. The reactor consists of a DBD plasma chamber, including the adsorptive textile, and an ozonation chamber,
where the DBD generated plasma gas is bubbled. In the present paper, this reactor is further characterized and optimized in
Page 2
2
terms of its energy efficiency for removal of the five pesticides α-HCH, pentachlorobenzene, alachlor, diuron and
isoproturon, with initial concentrations ranging between 22 and 430 µg/L. Energy efficiency of the reactor is found to
increase significantly when initial micropollutant concentration is decreased, when duty cycle is decreased and when oxygen
is used as feed gas as compared to air and argon. Overall reactor performance is improved as well by making it work in
single-pass operation, where water is flowing through the system only once. The results are explained with insights found in
literature and practical implications are discussed. For the used operational conditions and settings, α-HCH is the most
persistent pesticide in the reactor, with a minimal achieved electrical energy per order of 8 kWh/m3, while a most efficient
removal of 3 kWh/m3 or lower was reached for the four other pesticides.
Keywords: plasma treatment; pesticides; energy yield; nitrite; nitrate; peroxone
1. Introduction
With ongoing improvement of chemical analytical methods, various compounds and their
transformation products are increasingly detected in water bodies in low concentrations in the range of
microgram to nanogram per liter. Among these so-called micropollutants are food additives, industrial
chemicals, pesticides, pharmaceuticals and personal care products. Despite their low concentrations,
various hazardous environmental effects have been observed (Milla et al. 2011, Rizzo et al. 2013).
Additionally, there is growing concern about their effect on human health. Conventional wastewater
treatment plants are often unable to sufficiently remove these micropollutants (Luo et al. 2014).
Preventive measures are, unfortunately, strongly limited by the increasing demand, while
enhancement of conventional techniques often has negligible effect on many persistent
micropollutants (Luo et al. 2014). Therefore, advanced treatment methods, such as activated carbon,
have recently received more attention for their effective removal of micropollutants. Nonetheless,
these techniques are associated with high costs and the additional problem of hazardous concentrate or
adsorbate disposal. As a promising alternative, advanced oxidation techniques are the most effective
available methods to decompose bio-recalcitrant organics. Since their energy costs are high up to now,
research needs to focus on optimization of their energy efficiency. Combination of oxidation methods
Page 3
3
with each other or with other advanced treatment techniques is hereto proposed in many reviews as an
effective strategy (Ghatak 2014, Oturan and Aaron 2014).
Amongst the advanced oxidation techniques, plasma technology for water treatment takes an
interesting place, since it is able to produce a wide spectrum of oxidative species, leading to a low
selectivity of the decomposition process. Moreover, its flexible design facilitates synergetic
combination with other advanced separation and oxidation methods. In prior research, we have found
a synergy between micropollutant adsorption and dielectric barrier discharge (Vanraes et al. 2015a).
Further, we have developed and characterized a new type of plasma reactor for water treatment
(Vanraes et al. 2015b). In this reactor, micropollutant decomposition by atmospheric dielectric barrier
discharge in dry air is combined with adsorption on activated carbon textile and with extra bubbling of
plasma-generated ozone. To this end, the water solution under treatment is recirculated between a
plasma chamber with the carbon textile and an ozonation chamber. Atrazine was used as model
micropollutant with an initial concentration of 30 µg/L. Plasma gas bubbling contributed to up to
40.5% of total atrazine decomposition, confirming an interesting optimization of the reactor’s energy
efficiency, as compared to plasma treatment alone.
In the present study, our reactor is investigated and optimized further in terms of its energy efficiency.
For this purpose, five persistent pesticides with significantly diverse properties are investigated for
their removal kinetics: α-hexachlorocyclohexane (α-HCH), pentachlorobenzene (PeCB), alachlor,
diuron and isoproturon. Their variety permits to gain a more comprehensive view on the overall
reactor performance and optimization. As in our previous research, initial concentration of the
pollutants is taken in the order of 100 µg/L, to have sufficient agreement with real-world situations
and with the maximally allowed limits defined by the United States Environmental Protection Agency
(EPA 2007), by the World Health Organization (WHO 2008) and by the European Parliament and the
Council (EC 2006). Prior to micropollutant removal kinetics analysis, the evolution of pH and
conductivity during plasma treatment is investigated and explained. Next, the contribution of
Page 4
4
micropollutant evaporation and adsorption to the total removal process is studied in detail.
Afterwards, the effect of pH, salt addition, initial concentration, applied power and feed gas on the
reactor’s performance is shown and compared with insights from literature. Finally, the reactor is
modified to work in single-pass operation, where water is flowing through the system only once. The
influence of the sequence of plasma chamber and ozonation chamber is discussed and the reactor’s
performance is compared with its recirculated batch operation.
2. Experimental methods and materials
2.1. DBD water treatment reactor and determination of solution parameters
Each pesticide removal experiment is performed with the plasma reactor described in our previous
study (Vanraes et al. 2015b). In short, a pesticide solution is continuously recirculated between a
plasma chamber and an ozonation chamber. Based on the water flow rate of 95.3 mL/min and solution
volume of 400 mL in the ozonation chamber, hydraulic residence time in the ozonation chamber is
calculated to be 4.20 min. Relative to this value, hydraulic residence time in the plasma chamber is
negligible (0.86 ± 0.02 s). The plasma chamber consists of a coaxial DBD electrode system, where the
grounded inner electrode is covered with one layer of Zorflex®, 100% activated carbon textile. The
solution under treatment flows downwards along the carbon textile. Plasma is generated in dry air
over the carbon textile by applying a pulsed AC high voltage on the outer mesh electrode that covers
the tubular quartz glass dielectric barrier. The duty cycle of the power is defined as the fraction of
time during which the plasma is operating, given by the ratio of the variable power pulse width to the
fixed pulse period of 30 ms. In the ozonation chamber, the ozone generated in the plasma chamber is
bubbled through the solution for additional pesticide oxidation, in order to enhance the reactor
efficiency without extra energy input. Solution samples for micropollutant analysis are taken after
passing the ozonation chamber. The reactor standard settings are different from the ones used in
previous work and are given in Table 1. Information on the Zorflex® textile, on the method for power
determination and on the measurement methods of pH and conductivity is given in (Vanraes et al.
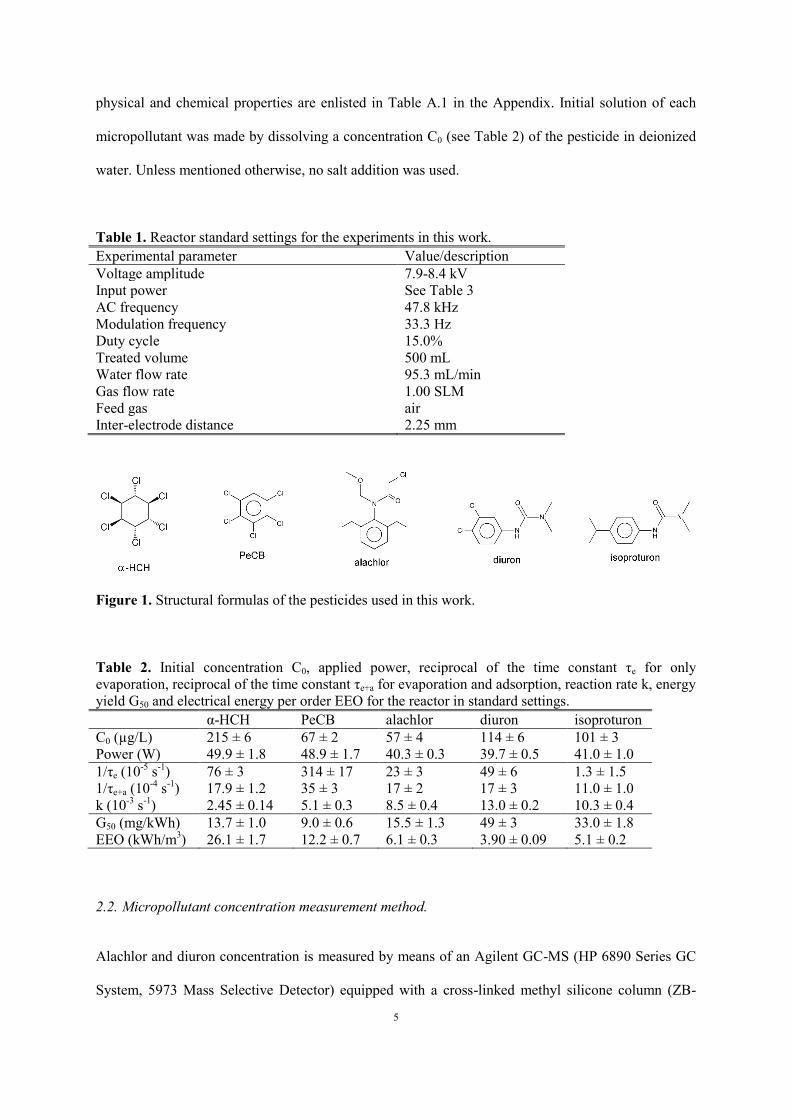
2015b). The structural formulas of all compounds are depicted in Figure 1 and their most relevant
Page 5
5
physical and chemical properties are enlisted in Table A.1 in the Appendix. Initial solution of each
micropollutant was made by dissolving a concentration C0 (see Table 2) of the pesticide in deionized
water. Unless mentioned otherwise, no salt addition was used.
Table 1. Reactor standard settings for the experiments in this work.
Experimental parameter Value/description
Voltage amplitude 7.9-8.4 kV
Input power See Table 3
AC frequency 47.8 kHz
Modulation frequency 33.3 Hz
Duty cycle 15.0%
Treated volume 500 mL
Water flow rate 95.3 mL/min
Gas flow rate 1.00 SLM
Feed gas air
Inter-electrode distance 2.25 mm
Figure 1. Structural formulas of the pesticides used in this work.
Table 2. Initial concentration C0, applied power, reciprocal of the time constant τe for only
evaporation, reciprocal of the time constant τe+a for evaporation and adsorption, reaction rate k, energy
yield G50 and electrical energy per order EEO for the reactor in standard settings.
α-HCH PeCB alachlor diuron isoproturon
C0 (µg/L) 215 ± 6 67 ± 2 57 ± 4 114 ± 6 101 ± 3
Power (W) 49.9 ± 1.8 48.9 ± 1.7 40.3 ± 0.3 39.7 ± 0.5 41.0 ± 1.0
1/τe (10-5
s-1
) 76 ± 3 314 ± 17 23 ± 3 49 ± 6 1.3 ± 1.5
1/τe+a (10-4
s-1
) 17.9 ± 1.2 35 ± 3 17 ± 2 17 ± 3 11.0 ± 1.0
k (10-3
s-1
) 2.45 ± 0.14 5.1 ± 0.3 8.5 ± 0.4 13.0 ± 0.2 10.3 ± 0.4
G50 (mg/kWh) 13.7 ± 1.0 9.0 ± 0.6 15.5 ± 1.3 49 ± 3 33.0 ± 1.8
EEO (kWh/m3) 26.1 ± 1.7 12.2 ± 0.7 6.1 ± 0.3 3.90 ± 0.09 5.1 ± 0.2
2.2. Micropollutant concentration measurement method.
Alachlor and diuron concentration is measured by means of an Agilent GC-MS (HP 6890 Series GC
System, 5973 Mass Selective Detector) equipped with a cross-linked methyl silicone column (ZB-
Page 6
6
5MS, 30 m x 0.25 mm, 0.25 μm film thickness; Phenomenex). Before extraction, 19.00 g of the
solution was hermetically sealed in 20 mL vials, where alachlor was incubated for 5 minutes at 50 °C
and diuron for 1 minute at 30 °C using agitation. Extraction of both dissolved compounds was
performed with a MPS-2 XYZ autosampler equipped with a headspace-solid phase microextraction
unit (multi-PurposeSampler® or MPS®, Gerstel®, Mülheim and der Ruhr, Germany). Extraction
from the water matrix occurred on a SPME fibre (75 µm Carboxen/Polydimethylsiloxane
(CAR/PDMS), fused silica fibre core, Supelco, USA), for 45 minutes at 50°C in the case of alachlor
and for 30 minutes at 30°C in the case for diuron. The compounds were separated using Helium as the
carrier gas (flow rate 1 mL min-1). For alachlor, the temperature gradient was 60 °C (6 min) to 160
°C at 15 °C min-1
, held 11 minutes; then 7 °C/min to 205 °C for 0 min; then 25 °C/min to 250 °C for 5
min. For diuron, the gradient was 35 °C (6 min) to 160 °C at 15 °C min-1
, held 5 minutes; then 100
°C/min to 250 °C for 1 min. The injector and transfer lines were maintained isothermally at 250 °C
and 280 °C, respectively. Both compounds are measured in Selected Ion Mode (SIM), alachlor at a
retention time of 28.4 min and diuron at 16.3 min. Calibration of the detector was made with solutions
of known concentration, from 1 to 100 µg/L. The integrated peak area in the obtained chromatogram
was found to be linear with concentration in this range for each micropollutant.
Analysis of α-HCH, PeCB and isoproturon was carried out with Agilent GC-MS (6890 series GC
system, 5973 MS) using Chemstation software. Before analysis, 20 mL water samples were extracted
towards CH2Cl2 solvent by means of liquid-liquid extraction. α-HCH and PeCB extraction was
executed with addition of 2 mL of CH2Cl2. The method was improved for isoproturon by using a
CH2Cl2 volume of only 1 mL. The samples were shaken by hand for 5 min in 22.5 mL sized vials.
Afterwards, 0.6 mL of the CH2Cl2 drop was separated by means of a micropipette. In the case of α-
HCH and PeCB, 2 grains of dry CaCl2 were added in order to absorb any water traces in the sample.
Splitless injection of 1 µL sample occurred at temperature of 250°C and pressure of 78.4 kPa in HP-5
MS column (0.25 mm x 30 m x 0.25 µm) with constant He flow of 1 mL/min. α-HCH and PeCB were
measured with an identical oven program. Oven temperature started at 125 °C, rising to 195 °C at 25
Page 7
7
°C/min and further rising to 210 °C at 10 °C/min with a final hold of 1.5 min. Mass spectra were
recorded in SIM mode with target ion 219 and qualifier ions 181 and 183 in the case of α-HCH and
with target ion 250 and qualifier ions 247 and 252 in the case of PeCB (MS source at 230°C, MS quad
at 150 °C, solvent delay of 2 min). For isoproturon, splitless injection of 1 µL sample occurred at
temperature of 270°C and pressure of 68.1 kPa. Oven temperature started at 90 °C held for 1 min,
rising to 190 °C at 40 °C/min and further rising to 270 °C at 20 °C/min with a final hold of 2 min.
Mass spectra were recorded in SIM mode with target ion 146 and qualifier ions 161 and 128 (solvent
delay of 3 min). All other instrumental settings were kept the same. Peaks of α-HCH, PeCB and
isoproturon were detected at a retention time of 5.13 min, 4.03 min and 4.06 min, respectively. All
three compounds were calibrated for the range of 0 to 1000 µg/L, where linear dependence on
concentration was found. Naphthalene was used as internal standard.
3. Results and discussion
3.1. Conductivity and pH
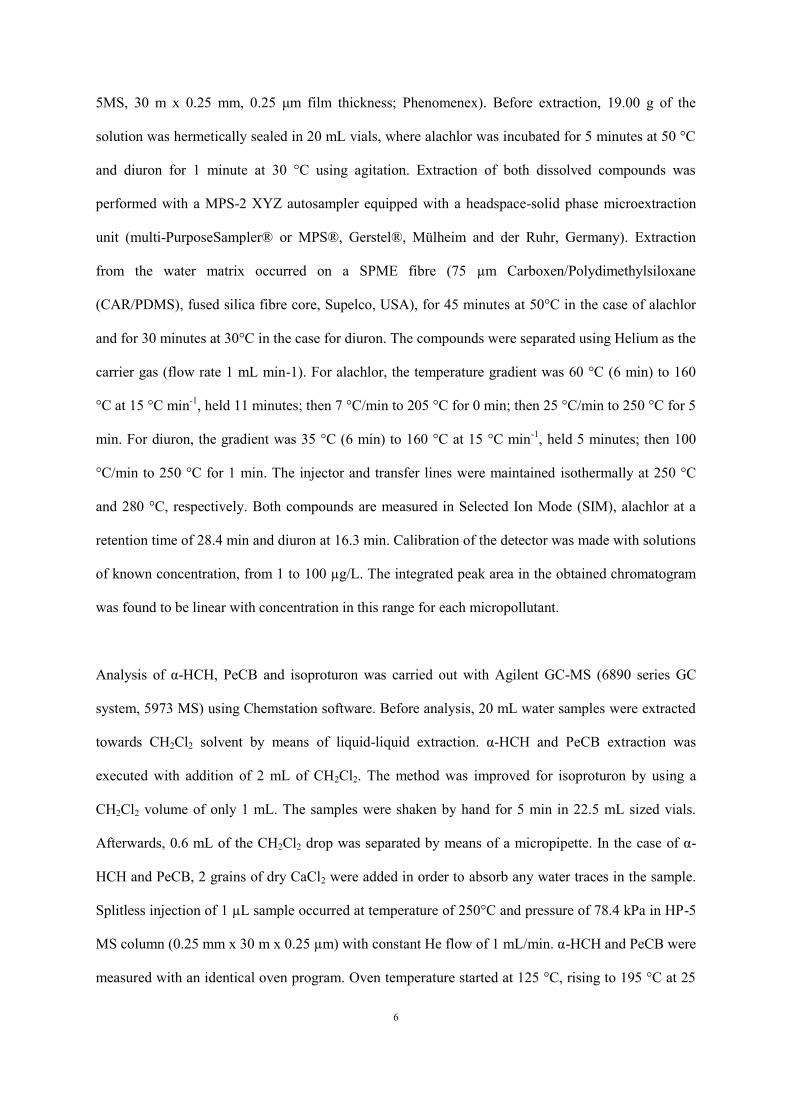
The formation of aqueous radicals and other species by plasma treatment induces a change in
conductivity and pH during each experiment. Figure 2a gives an example of both solution parameters
as a function of treatment time, where the initial conductivity of 350 µS/cm was prepared by addition
of NaH2PO4•2H2O to demineralized water. As can be seen, conductivity grows gradually towards
approximately 1.3 mS/cm during 30 min, while pH drops abruptly towards a value around 3 in the
first 2.5 min of treatment time, followed by a slight further decrease. The end values of conductivity
and pH after 30 min were found to be rather independent of initial conductivity and pH. When the
solution is only recirculated through the ozonation chamber, hence without direct contact to the active
plasma region, the sharp pH drop at the start of the experiment does not occur, as shown in Figure 2b.
The latter experiment is performed by recirculating a separate 500 mL solution of deionized water
through the plasma chamber. This difference is explained with the formation of aqueous nitrites and
nitrates in the plasma chamber through the dissolution of nitrogen oxides formed in the plasma by
reactions of dissociated N2 and O2. During this process, H+ ions are generated in the water phase, as
Page 8
8
described with the overall reactions (Lukes et al. 2014):
𝑁𝑂2 ∙ +𝑁𝑂2 ∙ +𝐻2𝑂 ⟶ 𝑁𝑂2− + 𝑁𝑂3
− + 2𝐻+ (8.1)
𝑁𝑂 ∙ +𝑁𝑂2 ∙ +𝐻2𝑂 ⟶ 2𝑁𝑂2− + 2𝐻+ (8.2)
Other species can contribute to pH and conductivity change as well, including O3 and H2O2. Figures
2c-d show the end values of both solution parameters for different power settings, where duty cycle is
varied. It was found that power variation at fixed duty cycle has a very limited effect on the final pH
value. Increasing the duty cycle, on the other hand, has a stronger effect, causing a reduction of the
end pH, due to more abundant formation of nitrites and nitrates. Accordingly, end conductivity is
influenced stronger by duty cycle than by power at fixed duty cycle and is linearly proportional to
both.
Figure 2. Measured pH and conductivity data during experiments with reactor settings as specified in
Table 1. Initial conductivity was set at 350 µS/cm by addition of NaH2PO4•2H2O to demineralized
water. (a) and (b) pH and conductivity as a function of treatment time for applied power of 59 W. In
(b), pH evolution is compared with an experiment where the solution is subjected to plasma gas
bubbling alone. In the latter configuration, the investigated solution was not in direct contact with the
active plasma zone, but another solution was recirculated through the plasma chamber in an isolated
circuit. (c) and (d) pH and conductivity after 30 min treatment time for different duty cycles.
Page 9
9
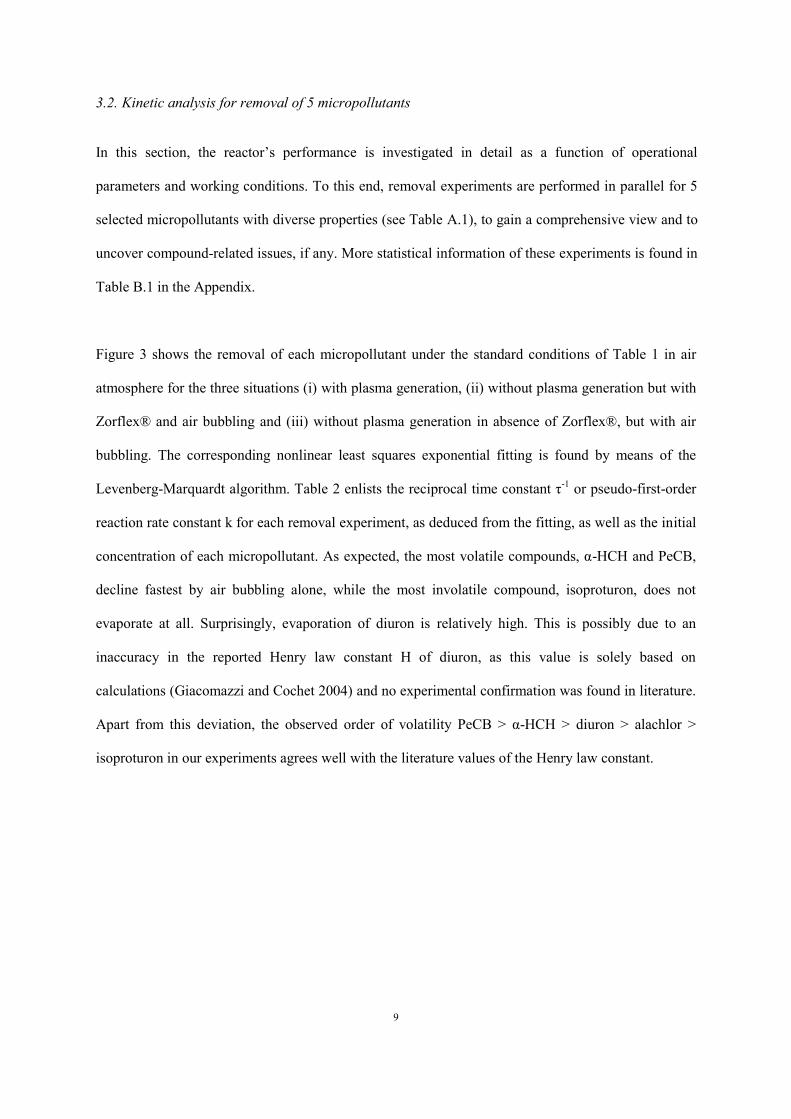
3.2. Kinetic analysis for removal of 5 micropollutants
In this section, the reactor’s performance is investigated in detail as a function of operational
parameters and working conditions. To this end, removal experiments are performed in parallel for 5
selected micropollutants with diverse properties (see Table A.1), to gain a comprehensive view and to
uncover compound-related issues, if any. More statistical information of these experiments is found in
Table B.1 in the Appendix.
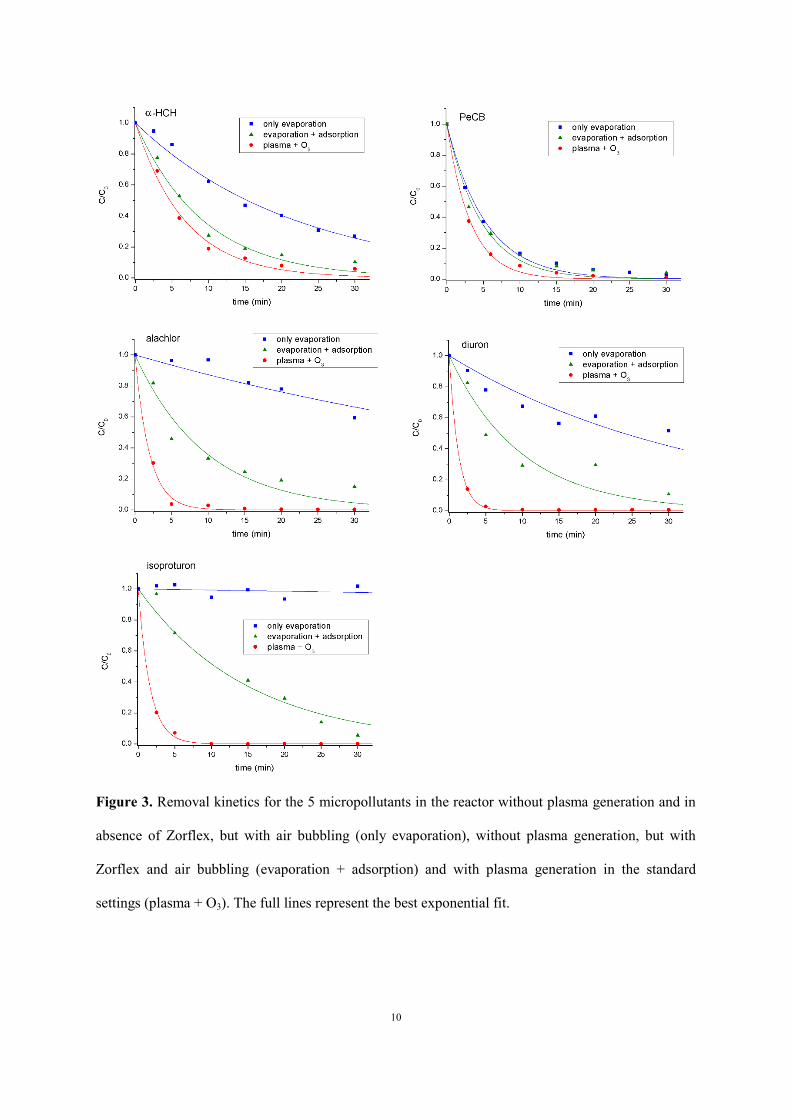
Figure 3 shows the removal of each micropollutant under the standard conditions of Table 1 in air
atmosphere for the three situations (i) with plasma generation, (ii) without plasma generation but with
Zorflex® and air bubbling and (iii) without plasma generation in absence of Zorflex®, but with air
bubbling. The corresponding nonlinear least squares exponential fitting is found by means of the
Levenberg-Marquardt algorithm. Table 2 enlists the reciprocal time constant τ-1
or pseudo-first-order
reaction rate constant k for each removal experiment, as deduced from the fitting, as well as the initial
concentration of each micropollutant. As expected, the most volatile compounds, α-HCH and PeCB,
decline fastest by air bubbling alone, while the most involatile compound, isoproturon, does not
evaporate at all. Surprisingly, evaporation of diuron is relatively high. This is possibly due to an
inaccuracy in the reported Henry law constant H of diuron, as this value is solely based on
calculations (Giacomazzi and Cochet 2004) and no experimental confirmation was found in literature.
Apart from this deviation, the observed order of volatility PeCB > α-HCH > diuron > alachlor >
isoproturon in our experiments agrees well with the literature values of the Henry law constant.
Page 10
10
Figure 3. Removal kinetics for the 5 micropollutants in the reactor without plasma generation and in
absence of Zorflex, but with air bubbling (only evaporation), without plasma generation, but with
Zorflex and air bubbling (evaporation + adsorption) and with plasma generation in the standard
settings (plasma + O3). The full lines represent the best exponential fit.
Page 11
11
When Zorflex® is added in the reactor, stronger removal is observed for all micropollutants. Alachlor
and isoproturon appear to be the most efficiently removed compounds by adsorption, followed by
diuron. PeCB, on the other hand, is adsorbed least efficiently in addition to evaporation. With the
assumption that evaporation and adsorption have an accumulative effect, these observations can be
explained as follows. According to Moreno-Castilla, four features of an organic compound regulate its
rate of adsorption on activated carbon (Moreno-Castilla 2004):
1. molecular size;
2. acid dissociation constant pKa, in case it is an electrolyte;
3. solubility;
4. nature of substituents, in case it is aromatic.
The molecular size determines the compound’s accessibility to the micro-pores of the carbon. The
pKa value controls the dissociation of an electrolytic compound into ions, dependent on solution pH.
Consequently, adsorption of the resulting organic ion is strongly regulated by electrostatic interaction
with the charges on the carbon surface. Since all selected micropollutants in our study are similar in
size and nonionic, differences in their adsorption rate are supposed to be regulated predominantly by
other factors, such as their solubility and their substituents. Each molecule’s water solubility (see
Table A.1 in the Appendix) is directly related to its hydrophobicity, which dictates how easily it is
rejected by the aqueous solution and thus how readily it is accepted by another phase contacting the
solution. Clearly, solubility is not the dominant factor, since the best soluble compounds, alachlor and
isoproturon, are adsorbed more rapidly, while the most hydrophobic molecules, α-HCH and PeCB,
are adsorbed worst. The amount of electron-withdrawing chlorine atoms on the aromatic ring of a
micropollutant, on the other hand, seems to strongly regulate the adsorption rate. Namely, electron-
withdrawing or electron-donating substituents on the aromatic ring are expected to affect the π-π
dispersion interaction between the aromatic ring of the compound and the aromatic structure of the
graphene layers (Moreno-Castilla 2004). Possibly, donor-acceptor interactions between the
compound’s aromatic ring or substituents and functional surface groups such as carbonyl can also
play a role. The five chlorine atoms present in PeCB strongly decrease the electron density in the ring,
Page 12
12
which explains its low adsorption on Zorflex®. Alachlor and isoproturon, in contrast, have an
electron-rich aromatic cycle because of the absence of direct chlorine substitution. Diuron has a very
similar molecular structure to isoproturon, but with two chlorines attached to the ring, corresponding
to a lower adsorption rate. This is in good agreement with the observed results, suggesting that the
above mentioned π-π dispersion or acceptor-donor interactions are the dominant mechanisms for
adsorption in our experiments.
When plasma is turned on, all micropollutants are removed to higher extent. The additional removal
process by plasma oxidation is strongest for isoproturon, diuron and alachlor, while α-HCH and PeCB
appear most recalcitrant to oxidation by plasma-generated aqueous oxidants. It should be emphasized,
nonetheless, that decomposition processes occur in the vapor phase as well, under influence of
gaseous oxidants. A detailed study on this topic is made by Ognier et al., who used an AC powered
coaxial DBD reactor similar to ours but without additional bubbling for treatment of 4 volatile
compounds: acetic acid, phenol, ethanol and 1-heptanol (Ognier et al. 2009). When plasma was
switched on in their reactor, an increase was observed in mass transfer of each pollutant from the
liquid to the gas phase, proportional to the corresponding Henry law constant. This mass transfer
increased was attributed to the intense mixing in the liquid film and the reaction of the pollutant with
active species in the gaseous phase, in agreement with computational fluid dynamic modelling results.
The same authors also measured a minimum of 95 % decomposition of these compounds in the gas
phase. Accordingly, decomposition in the gas phase was found to be significantly more effective that
decomposition in the liquid phase.
Energy efficiency of plasma reactors is often expressed by the energy yield G50 (in g/kWh) for 50%
pesticide removal, which is calculated by adapting the formula from (Hijosa-Valsero et al. 2013),
𝐺50 = −𝐴𝑘𝐶0𝑉
2𝑃 ln(0.5) (8.3)
where A = 3.6 × 10⁶ J/kWh is a unit conversion factor, k is reaction rate constant (in s
-1), C0 is initial
concentration (in g/L), V is treated water volume (in L) and P is applied power (in W). G50 is,
Page 13
13
however, not recommended as comparative parameter for reactor energy efficiency, since it strongly
depends on initial pollutant concentration C0. Therefore, we used electrical energy per order EEO,
defined as the number of kilowatt hours of electrical energy required to reduce a pollutant’s
concentration by 1 order of magnitude (90%) in 1 m3 of contaminated water (Wohlers et al. 2009),
𝐸𝐸𝑂 =ln(10) × 𝑃
3600 × 𝑉 × 𝑘 (8.4)
Table 2 gives the energy yield G50 and electrical energy per order EEO of the overall removal for each
micropollutant in our reactor. The input energy required for 90% reduction increases in the order:
diuron < isoproturon < alachlor < PeCB < α-HCH. With the used reactor settings, it takes about 7
times as much energy to remove the same amount of α-HCH from the solution as compared to diuron,
indicating that EEO values in our reactor for different compounds can vary over almost one order of
magnitude. With the inclusion of more micropollutants, this range is likely to expand further. As
should be noted, the contribution of the oxidation by-products to the overall micropollutant
concentration in our reactor is expected to be negligible, based on HPLC-TOF-MS analysis. More
detailed information on the by-product analysis will be published in a separate paper.
3.2.1. Effect of pH and salt addition
As this work mainly focuses on reactor characterization and optimization, the influence of the water
matrix is illustrated only for isoproturon. Figure C.1a in the Appendix shows the decomposition of the
pesticide for different initial pH. In the standard experiment mentioned above, the initial pH was 5.03.
Reduction of pH to 4.2 with addition of H2SO4 has little effect on the oxidation rate, but further
decrease to 2.08 leads to significant improvement of the degradation process. This is possibly due to
the formation of peroxymonosulfuric acid (H2SO5), also known as Caro’s acid, via the reaction
(McDonogh and Sanders 1995)
𝐻2𝑆𝑂4 + 𝐻2𝑂2 ⟶ 𝐻2𝑆𝑂5 + 𝐻2𝑂 (8.5)
Peroxymonosulfuric acid is one of the strongest oxidants, which is able to decompose organics non-
selectively with a redox potential comparable to the one of the hydroxyl radical (Spivey et al. 2015).
Page 14
14
As an additional explanation, the lower pH leads to higher H2O2 stability, which can cause stronger
isoproturon decomposition. Increase of the pH to 7.2 with addition of NaOH quenches the oxidation
of isoproturon, while further increase to a pH of 10 enhances the decomposition process again. Since
isoproturon is relatively reactive to ozone, with reported values of kO3 from 141 to 2191 M-1
s-1
(Table
A.1), its degradation in our reactor is strongly influenced by the stability of aqueous O3. Elevation of
pH is known to gradually lower the stability of ozone, explaining the initial decrease. It is, however,
less known that in highly alkaline solution, starting from addition of 5 M NaOH, ozone stability
abruptly rises again (Eriksson 2005, Heidt and Landi 1967). In the case that this stage of high O3
stability has not been reached yet at pH = 10, the re-established decomposition rate can alternatively
be explained with the peroxone process. Namely, the peroxone rate constant increases with pH and
can take the upper hand in isoproturon decomposition above a certain pH value (Catalkaya and Kargi
2009).
The influence of salt addition is shown in Figure C.1b. In the accuracy of the measurements, addition
of NaH2PO4 and Na2SO4 did not have any visible effect on isoproturon decomposition. NaHCO3,
however, significantly lowered the oxidation rate. Carbonate is an effective OH scavenger through the
reaction (Eriksson 2005):
𝐶𝑂32− + 𝑂𝐻 ∙⟶ 𝐶𝑂3
− + 𝑂𝐻− (8.6)
Therefore, the reduction in the reaction rate is due to inhibition of OH radical attack. As the above
results indicate, direct attack by OH radicals plays a significant role during the degradation of
isoproturon at the standard conditions.
3.2.2. Effect of initial concentration
EEO is a comparative parameter of preference for reactor energy efficiency in organic removal. A
priori, it is more advisable to carry out such comparison for a fixed initial pollutant concentration C0,
to exclude any concentration related effects. In practice, however, it is useful to experimentally
investigate the influence of the initial pollutant concentration on its removal rate and thus on the EEO
Page 15
15
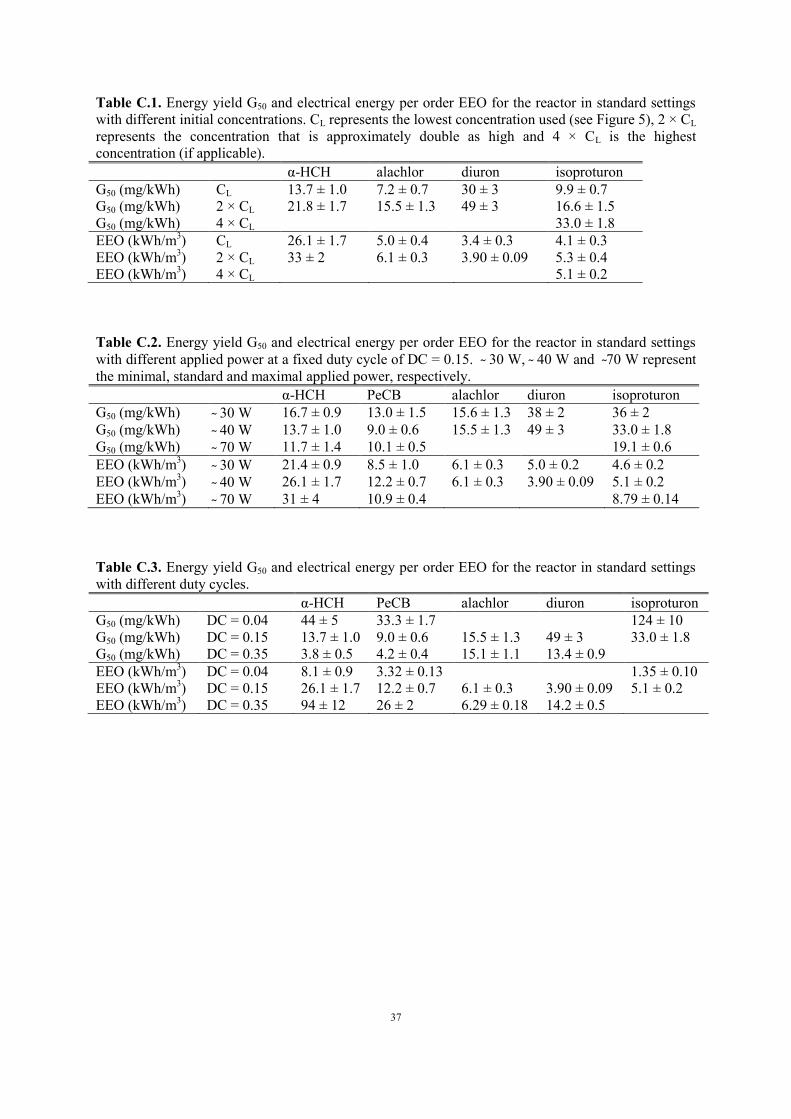
value. As shown in Figure C.2 and Table C.1 in the Appendix, this influence is relatively small for
our reactor. With decreasing C0, a drop in EEO is observed for α-HCH, alachlor, diuron and
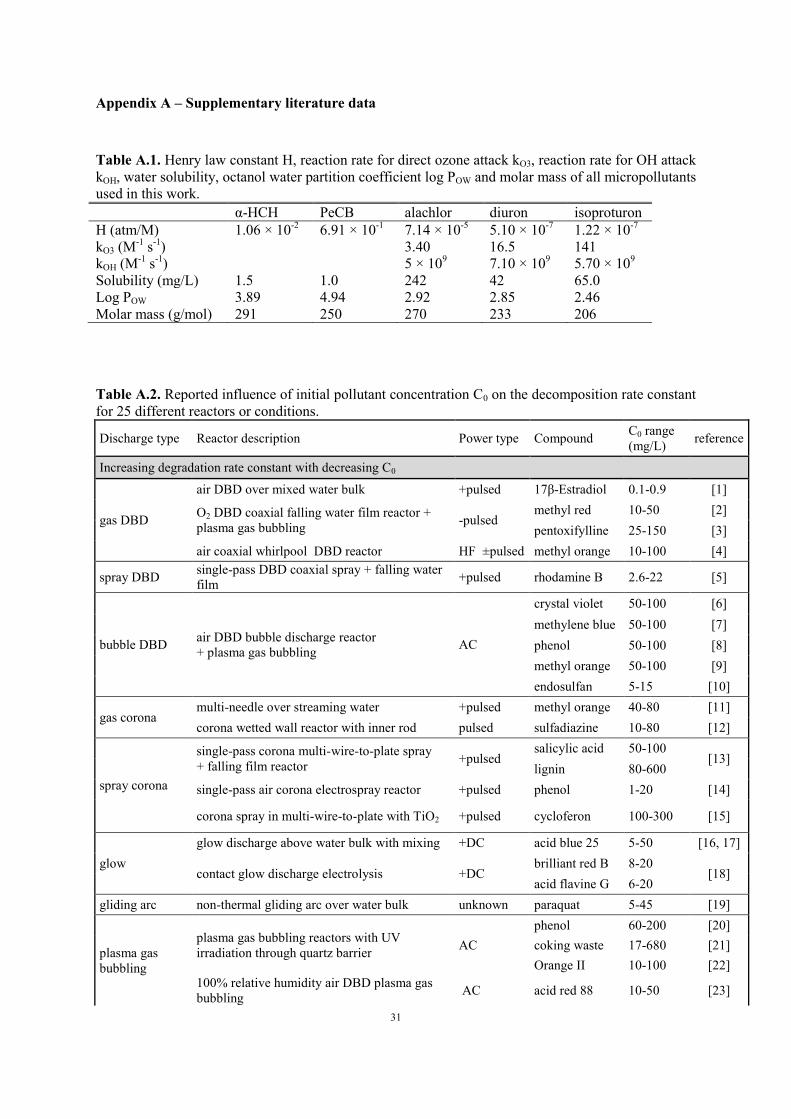
isoproturon. This is in good agreement with the observation of many other authors. Table A.2 in the
Appendix enlists all reported effects of a decreasing initial concentration of a water pollutant on its
decomposition rate constant that have been found in literature on plasma reactors. For 25 cases
dealing with different reactor types, decreasing C0 caused an increase in decomposition rate.
Frequently, authors explain this concentration effect with a decrease in competition for OH radicals
between the pollutant molecules as well as their by-products, assuming a constant concentration of
OH radicals or other dominant oxidants. With the introduction of EEO as a physical quantity for
energy efficiency, Cater et al. already stated this for advanced oxidation processes in general (Cater et
al. 2000), as shortly reviewed for pharmaceutical compounds in (Magureanu et al. 2010). The
magnitude for this effect is, however, extremer for higher concentrations, while the concentration
effect can become negligible for lower concentrations. A nearly constant decomposition rate has for
instance been observed for the lower concentration ranges of 0.1 to 0.3 mg/L 17β-Estradiol in DBD
over water in (Gao et al. 2013), 1.9 to 3.3 mg/L rhodamine B in the DBD spray reactor of (Nakagawa
et al. 2003), 5 to 10 mg/L acid blue 25 treated by DC glow discharge (Ghodbane et al. 2014) and 5 to
10 mg/L paraquat under gliding arc (Fouodjouo et al. 2013). This explains the relatively small
deviations in our experiments. Accordingly, the strongest relative change of the oxidation rate and
thus of EEO is observed for α-HCH, the compound with highest initial concentration (see Table C.1).
The above results and discussion imply that, generally, literature values of the oxidation rate constant
for micropollutants in plasma reactors are underestimations for realistic situations in urban and rural
wastewater treatment plants, where concentrations up to a few microgram per liter are usually
measured. Even in hospital wastewater, concentrations are in general only one order of magnitude
higher (Verlicchi et al. 2010). Therefore, we want to accentuate the importance of experimental
research with realistic or sufficiently low micropollutant concentrations as in the present work, in
order to gather energy efficiency data that is more representative for real-world applications. It should
Page 16
16
be taken into account, however, that the raw wastewater’s matrix will influence the aqueous oxidative
chemistry, likely increasing the total energy demand.
3.2.3. Effect of power at constant duty cycle
Applied power in our reactor can be changed in two ways: by varying the momentary power and by
adjusting the duty cycle. The duty cycle DC of the power source is defined as the fraction of time in
which the power is active. Figure C.3 and Table C.2 in the Appendix present the results for variation
of the momentary power at a fixed duty cycle DC = 0.15. As expected, increasing power leads in
general to a higher oxidation rate, in agreement with other DBD reactors (see Table A.3 in the
Appendix). For α-HCH, PeCB and isoproturon, G50 drops and EEO rises slightly for higher power.
For alachlor, energy efficiency remains constant in the accuracy of the measurements, as in the case
of atrazine reported in our previous research (Vanraes et al. 2015b). For diuron, there is a slight rise in
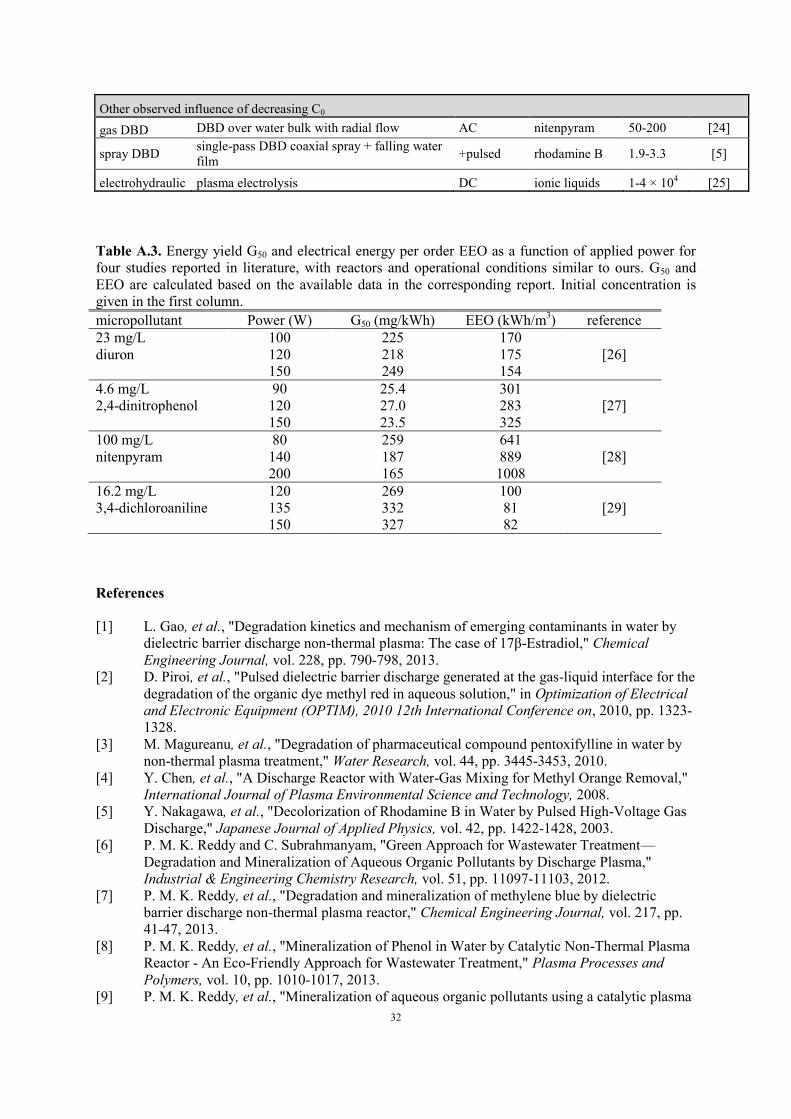
energy efficiency when power is increased. Table A.3 shows energy efficiency data as a function of
applied power for four AC powered DBD reactors with discharge in air. Since the operational
conditions of these reactors, including input power, are similar to our experiments, this data is
expected to be representative for our study. G50 and EEO are calculated from the reported values of
the reaction rate constant, power, initial concentration and solution volume. According to these data,
there is no consistent trend of energy efficiency as a function of applied power. Since the four
compounds in Table A.3 are decomposed in very similar reactors, these results suggest that the effect
of power might be specific for each compound. In our reactor, the influence of adsorption on
Zorflex® is compound-specific and should be considered as well. In any case, the dependency of
EEO on power seems to be rather limited, which is beneficial for applications where removal rate
needs to be controlled as a function of the influent micropollutant concentrations.
3.2.4. Effect of duty cycle
Figure 4 and Table C.3 in the Appendix present the effect of duty cycle on compound removal in our
Page 17
17
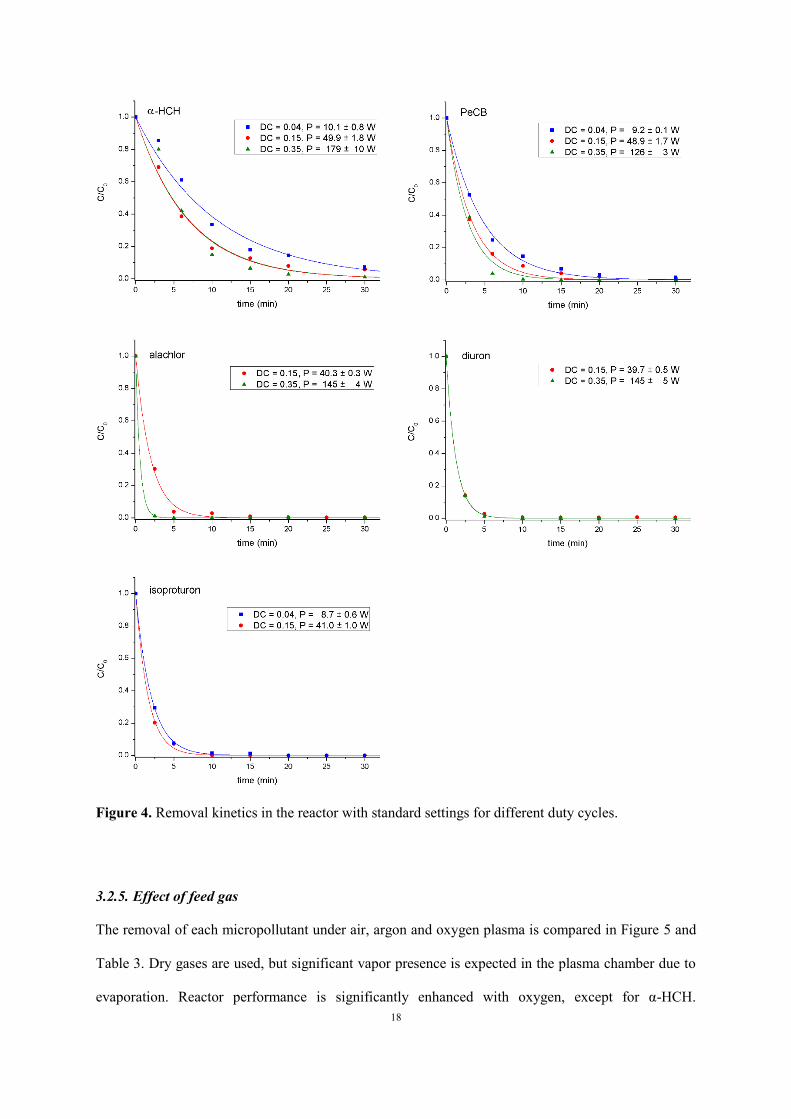
reactor. As seen from the measured data, an increase in duty cycle leads to a higher oxidation rate in
general, except for diuron, for which removal rate remains constant in the accuracy of the
measurement. Nonetheless, a higher duty cycle results in a significant decrease in energy efficiency.
The same effect has been found with the gas phase DBD reactor of (Olszewski et al. 2014) with pulse-
modulated AC power, where increasing the duty cycle from 25% to 100% lowered energy efficiency
2.11 times. The authors explained the latter effect with additional organic degradation during plasma
off time under influence of long living reactive species such as O3 and H2O2. As seen in section 3.1, a
higher duty cycle results in a lower pH due to stronger NO2- and NO3
- formation. These anions and
their conjugated acids can inhibit oxidation by O3 and OH, which gives an alternative explanation for
the reduction in energy efficiency at higher duty cycle. This effect will be discussed in more detail in
section 3.2.6. The effect of duty cycle on the pollutant removal can also be explained with significant
gas temperature increase in the plasma zone, which inhibits O3 and H2O2 production.
Page 18
18
Figure 4. Removal kinetics in the reactor with standard settings for different duty cycles.
3.2.5. Effect of feed gas
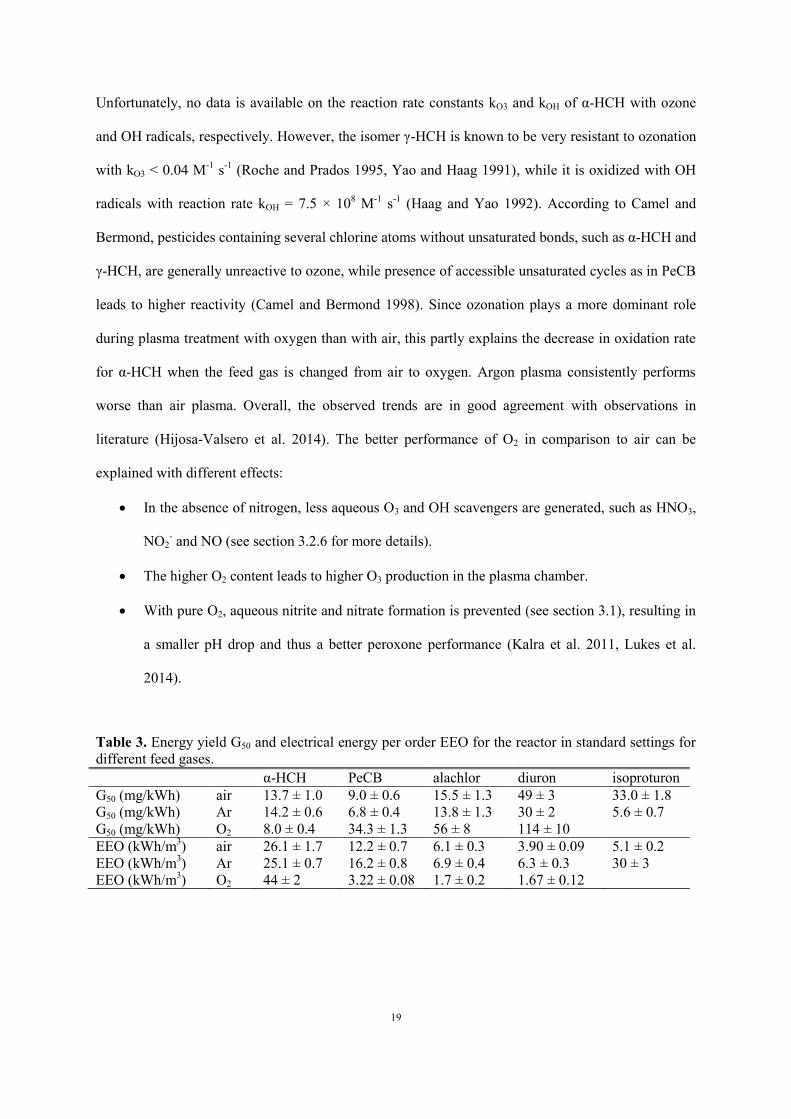
The removal of each micropollutant under air, argon and oxygen plasma is compared in Figure 5 and
Table 3. Dry gases are used, but significant vapor presence is expected in the plasma chamber due to
evaporation. Reactor performance is significantly enhanced with oxygen, except for α-HCH.
Page 19
19
Unfortunately, no data is available on the reaction rate constants kO3 and kOH of α-HCH with ozone
and OH radicals, respectively. However, the isomer γ-HCH is known to be very resistant to ozonation
with kO3 < 0.04 M-1
s-1
(Roche and Prados 1995, Yao and Haag 1991), while it is oxidized with OH
radicals with reaction rate kOH = 7.5 × 10⁸ M
-1 s
-1 (Haag and Yao 1992). According to Camel and
Bermond, pesticides containing several chlorine atoms without unsaturated bonds, such as α-HCH and
γ-HCH, are generally unreactive to ozone, while presence of accessible unsaturated cycles as in PeCB
leads to higher reactivity (Camel and Bermond 1998). Since ozonation plays a more dominant role
during plasma treatment with oxygen than with air, this partly explains the decrease in oxidation rate
for α-HCH when the feed gas is changed from air to oxygen. Argon plasma consistently performs
worse than air plasma. Overall, the observed trends are in good agreement with observations in
literature (Hijosa-Valsero et al. 2014). The better performance of O2 in comparison to air can be
explained with different effects:
In the absence of nitrogen, less aqueous O3 and OH scavengers are generated, such as HNO3,
NO2- and NO (see section 3.2.6 for more details).
The higher O2 content leads to higher O3 production in the plasma chamber.
With pure O2, aqueous nitrite and nitrate formation is prevented (see section 3.1), resulting in
a smaller pH drop and thus a better peroxone performance (Kalra et al. 2011, Lukes et al.
2014).
Table 3. Energy yield G50 and electrical energy per order EEO for the reactor in standard settings for
different feed gases.
α-HCH PeCB alachlor diuron isoproturon
G50 (mg/kWh) air 13.7 ± 1.0 9.0 ± 0.6 15.5 ± 1.3 49 ± 3 33.0 ± 1.8
G50 (mg/kWh) Ar 14.2 ± 0.6 6.8 ± 0.4 13.8 ± 1.3 30 ± 2 5.6 ± 0.7
G50 (mg/kWh) O2 8.0 ± 0.4 34.3 ± 1.3 56 ± 8 114 ± 10
EEO (kWh/m3) air 26.1 ± 1.7 12.2 ± 0.7 6.1 ± 0.3 3.90 ± 0.09 5.1 ± 0.2
EEO (kWh/m3) Ar 25.1 ± 0.7 16.2 ± 0.8 6.9 ± 0.4 6.3 ± 0.3 30 ± 3
EEO (kWh/m3) O2 44 ± 2 3.22 ± 0.08 1.7 ± 0.2 1.67 ± 0.12
Page 20
20
Figure 5. Removal kinetics in the reactor with standard settings for different feed gases.
3.2.6. Single-pass experiments
Most plasma reactors described in literature operate in batch mode, where the solution under
treatment is located inside the reactor during the complete treatment time. Such reactor configurations
are, however, unpractical for real-world applications where a large volume needs to be treated in a
Page 21
21
short time. In this line of thought, it is more attractive to use a reactor in single-pass operation, where
water is flowing through the system only once. Therefore, our reactor was modified to work in single-
pass mode and micropollutant removal is investigated for three different configurations:
a configuration where influent water exclusively flows through the plasma chamber (only
plasma);
a cascade configuration where influent water first flows through the plasma chamber and
subsequently flows through the ozonation chamber (plasma before ozone);
a cascade configuration where influent water first flows through the ozonation chamber and
subsequently flows through the plasma chamber (ozone before plasma).
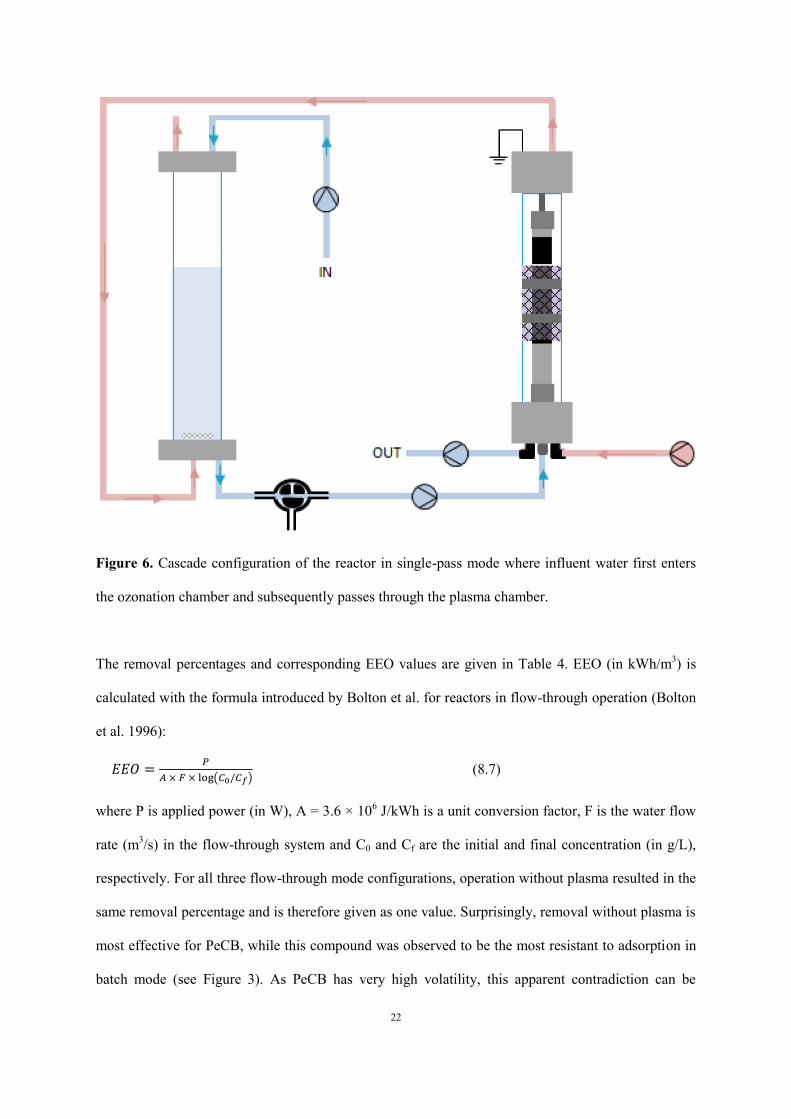
The latter is illustrated in Figure 6. To allow accurate comparison with the reactor in batch mode, all
experiments were conducted with the same standard settings enlisted in Table 1. Before each
experiment of the cascade configurations, the ozonation chamber was filled with the initial solution up
to the same height of 25.7 cm as used in batch mode. During plasma treatment, samples of the effluent
solution were taken after the same treatment times as in the batch mode experiments. All samples
were analysed with GC-MS to determine the time-averaged micropollutant concentration in the
effluent.
Page 22
22
Figure 6. Cascade configuration of the reactor in single-pass mode where influent water first enters
the ozonation chamber and subsequently passes through the plasma chamber.
The removal percentages and corresponding EEO values are given in Table 4. EEO (in kWh/m3) is
calculated with the formula introduced by Bolton et al. for reactors in flow-through operation (Bolton
et al. 1996):
𝐸𝐸𝑂 = 𝑃
𝐴 × 𝐹 × log(𝐶0/𝐶𝑓) (8.7)
where P is applied power (in W), A = 3.6 × 10⁶ J/kWh is a unit conversion factor, F is the water flow
rate (m3/s) in the flow-through system and C0 and Cf are the initial and final concentration (in g/L),
respectively. For all three flow-through mode configurations, operation without plasma resulted in the
same removal percentage and is therefore given as one value. Surprisingly, removal without plasma is
most effective for PeCB, while this compound was observed to be the most resistant to adsorption in
batch mode (see Figure 3). As PeCB has very high volatility, this apparent contradiction can be
Page 23
23
explained with air stripping in the plasma chamber.
Table 4. Removal percentage and electrical energy per order EEO for the reactor in single-pass mode
for the different configurations. In the “no plasma” experiments, neither plasma nor ozone was used.
For comparison, also the removal percentage at the hydraulic retention time 4.20 min and the EEO
value in batch mode are given, for the same standard settings.
α-HCH PeCB alachlor diuron isoproturon
rem
ov
al
(%)
no plasma 31.7 ± 1.2 75.7 ± 0.6 44.6 ± 0.5 60.9 ± 0.9 37.6 ± 1.4
only plasma 43.7 ± 1.5 79.0 ± 0.7 75.1 ± 0.4 79.3 ± 0.5
plasma before ozone 59 ± 2 82.6 ± 0.7 87 ± 2 90.5 ± 1.3 75.9 ± 0.4
ozone before plasma 64.8 ± 1.0 94.5 ± 0.6 97.0 ± 0.6 96.9 ± 0.7 91.6 ± 1.0
batch mode (4.20 min) 46.1 ± 1.9 72 ± 2 88.3 ± 1.2 96.2 ± 0.2 92.5 ± 0.8
EE
O
(kW
h/m
3
)
only plasma 30.1 ± 1.5 11.4 ± 0.3 11.6 ± 0.2 9.9 ± 0.2
plasma before ozone 18.4 ± 1.1 9.9 ± 0.4 8.0 ± 0.7 6.7 ± 0.4 11.5 ± 0.3
ozone before plasma 16.7 ± 0.7 6.2 ± 0.3 4.6 ± 0.3 4.6 ± 0.3 6.5 ± 0.3
batch mode (4.20 min) 26.1 ± 1.7 12.2 ± 0.8 6.1 ± 0.3 3.90 ± 0.09 5.1 ± 0.2
Using the hydraulic residence time of 4.20 min and the reaction rate constants from Table 2 for
standard settings in batch mode, the corresponding removal percentage in batch mode is calculated, as
given in Table 4. According to the resulting removal percentages, single pass mode is performing as
good as or better than batch mode for removal of the different compounds.
In Table 4, comparison of the reactor in absence of the ozonation chamber to the cascade
configuration from Figure 6, where plasma gas bubbling precedes treatment in the plasma chamber,
clearly shows that energy efficiency approximately doubles when the ozonation chamber is added to
the reactor. As should be noted, this cascade configuration performs considerably better for removal
of all micropollutants than the reverse cascade configuration. As the most likely reason, this is
because of more efficient ozonation of untreated solution as compared to plasma-treated solution. In
the plasma chamber, transfer of nitric oxides into the solution leads to the formation of NO2-, a known
O3 scavenger through the reaction
𝑂3 + 𝑁𝑂2− ⟶ 𝑂2 + 𝑁𝑂3
− (8.8)
with reported reaction rate of k = 1.6 – 5.0 × 10⁵ M
-1s
-1 (Damschen and Martin 1983, Garland et al.
1980, Hoigné et al. 1985, Penkett 1972). When the solution enters the ozonation chamber afterwards,
the aqueous NO2-, is mixed rapidly throughout the solution under influence of the bubbling, inhibiting
Page 24
24
the ozonation process. The transfer of nitric oxides into the solution by the bubbling process in the
ozonation chamber is, on the other hand, relatively small, as confirmed by the limited decrease in pH
(see Figure 2b). Therefore, ozonation has a stronger effect in the cascade configuration of Figure 6
than in the reverse setting. This scavenging mechanism has been reported before in water treatment
processes with air plasma (Lukes et al. 2014). Additionally, aqueous OH radicals introduced by means
of the bubbled plasma gas can be scavenged as well by reactive nitrogen species through the reactions
𝑂𝐻 ∙ +𝑁𝑂 ∙⟶ 𝐻+ + 𝑁𝑂2− (8.9)
𝑂𝐻 ∙ +𝐻𝑁𝑂3 ⟶ 𝐻2𝑂 + 𝑁𝑂3 (8.10)
𝑂𝐻 ∙ +𝑁𝑂2− ⟶ 𝑂𝐻− + 𝑁𝑂2 ∙ (8.11)
with reaction rates of k = 1.0 – 2 × 10¹⁰
M-1
s-1
(Seddon et al. 1973, Strehlow and Wagner 1982,
Treinin and Hayon 1970), k = 5.3 – 14 × 107 M
-1s
-1 (Jiang et al. 1992, Katsumura et al. 1991) and k =
6.0 – 14 × 105 M
-1s
-1 (Adams et al. 1965a, b, Barker et al. 1970, Buxton 1969, Løgager and Sehested
1993, Treinin and Hayon 1970), respectively. The NO2· radical formed in Equation 8.11 has a redox
potential of 1.04 V (Moniczewski et al. 2015, Squadrito and Pryor 2002) and is therefore significantly
less reactive than the OH radical reagent with a redox potential of 2.80 V.
Energy efficiency for micropollutant removal in the cascade configuration of Figure 6 is in the same
order of magnitude as in batch mode. As a negative effect, energy efficiency decreases in flow-
through mode with 22 ± 5 % for isoproturon and 15 ± 6 % for diuron. As a positive effect, energy
efficiency increases with 32 ± 10 % for alachlor, 56 ± 10 % for α-HCH and 96 ± 16 % for PeCB.
Since the most persistent compounds, α-HCH and PeCB, are removed significantly more effectively,
while the EEO increase for isoproturon is relatively small, these results speak in favor of the flow-
through system for general application. To our knowledge, this is the first time that a comparison in
energy efficiency of organic decomposition has been made between batch mode and single-pass mode
of the same reactor. These results seem to suggest that EEO values in batch mode are representative
for the energy efficiency of an identical reactor in flow-through mode, at least in order of magnitude.
Yet, it is uncertain whether this can be generalized for other reactor types as well.
Page 25
25
4. Conclusion
In this work, we have investigated a new type of plasma reactor for water treatment, in which
micropollutant decomposition by atmospheric dielectric barrier discharge (DBD) is combined with
adsorption on activated carbon textile and with extra bubbling of generated ozone. During treatment
in the reactor, solution conductivity gradually rises, while pH drops abruptly in the first minutes of
treatment, to slowly decrease further afterwards. Kinetic analysis for the removal of five pesticides led
to the following new insights:
Energy efficiency for the removal in standard conditions ranges over one order of magnitude,
from 3.9 to 26 kWh/m3, with increasing value in the order diuron < isoproturon < alachlor <
PeCB < α-HCH. The contribution of evaporation as well as adsorption to the removal process
is often significant, but strongly depends on compound properties.
As shown for isoproturon, the initial pH has a strong effect on the removal rate, which is
explained with a change in oxidation rates of ozonation and the peroxone process.
Addition of the salts NaH2PO4 and Na2SO4 does not influence the removal process, while
NaHCO3, as an OH radical scavenger, lowered the oxidation rate.
Investigation of the removal energy efficiency as a function of the initial micropollutant
concentration showed a strongly increasing trend of G50 and a slight increase in EEO for
higher concentrations, in agreement with results from other authors. Energy efficiency
displays limited changes and no clear trend under power variation at fixed duty cycle,
indicating that removal rate can be increased with little loss in efficiency.
Increasing duty cycle, on the other hand, results in remarkably lower energy efficiency. This
can be explained with stronger formation of nitrites and nitrates, which are known scavengers
of OH radicals or ozone. Also, this can be caused by shorter plasma off time and thus less
organic decomposition during the moments without power input or by O3 and H2O2 inhibition
due to plasma gas temperature increase.
Page 26
26
Generally, the oxidation process is enhanced when oxygen is used as feed gas, except for α-
HCH, most likely due to its strong resistance to ozonation. Argon, on the other hand,
performs worse than air for removal of all compounds.
Using the reactor in single-pass mode, where water flows through the treatment chambers
only once, enhanced the removal process of the most persistent compounds α-HCH and
PeCB, while it performed only slightly worse for diuron and isoproturon removal.
Comparison with single pass-mode experiments without the ozonation chamber proves that
energy efficiency approximately doubles with the addition of ozonation chamber.
Nonetheless, it is important to let the influent water flow through the ozonation chamber first
and only afterwards through the plasma chamber, since the reverse cascade configuration
gives consistently worse energy efficiency. This is explained with scavenging of ozone by
NO2- ions, which are introduced into the solution during direct plasma contact in the plasma
chamber.
Acknowledgements
The authors would like to thank Carbon Cloth Division for Zorflex samples and personally thank
Jack Taylor for fruitful discussion of active carbon water treatment processes.
References
Adams, G., Boag, J. and Michael, B. (1965a) Reactions of the hydroxyl radical. Part 2.—Determination of
absolute rate constants. Transactions of the Faraday Society 61, 1417-1424.
Adams, G., Boag, J. and Michael, B. (1965b) Spectroscopic studies of reactions of the OH radical in aqueous
solutions. Reaction of OH with the ferrocyanide ion. Transactions of the Faraday Society 61, 492-505.
Barker, G., Fowles, P. and Stringer, B. (1970) Pulse radiolytic induced transient electrical conductance in liquid
solutions. Part 2.—Radiolysis of aqueous solutions of NO–3, NO–2 and Fe (CN) 3–6. Transactions of the
Faraday Society 66, 1509-1519.
Bolton, J.R., Bircher, K.G., Tumas, W. and Tolman, C.A. (1996) Figures-of merit for the technical development
Page 27
27
and application of advanced oxidation processes. Journal of Advanced Oxidation Technologies 1, 13-17.
Buxton, G. (1969) Pulse radiolysis of aqueous solutions. Some rates of reaction of OH and O–and pH
dependence of the Yield of O–3. Transactions of the Faraday Society 65, 2150-2158.
Camel, V. and Bermond, A. (1998) The use of ozone and associated oxidation processes in drinking water
treatment. Water Research 32(11), 3208-3222.
Catalkaya, E.C. and Kargi, F. (2009) Dehalogenation, degradation and mineralization of diuron by peroxone
(peroxide/ozone) treatment. Journal of Environmental Science and Health, Part A 44(6), 630-638.
Cater, S.R., Stefan, M.I., Bolton, J.R. and Safarzadeh-Amiri, A. (2000) UV/H2O2 treatment of methyl tert-butyl
ether in contaminated waters. Environmental Science & Technology 34(4), 659-662.
Damschen, D.E. and Martin, L.R. (1983) Aqueous aerosol oxidation of nitrous acid by O 2, O 3 and H 2 O 2.
Atmospheric Environment (1967) 17(10), 2005-2011.
EC (2006) Directive 2006/118/EC of the European Parliament and of the Council of 12 December 2006 on the
protection of groundwater against pollution and deterioration, p. 26.
EPA, U.S. (2007) Atrazine, Toxicity and Exposure Assessment for Children’s Health (TEACH), Chemical
Summaries, p. 6.
Eriksson, M. (2005) Ozone chemistry in aqueous solution: ozone decomposition and stabilisation, Royal
Institute of Technology, Stockholm, Sweden.
Fouodjouo, M., Laminsi, S., Djepang, S.A., Tadom, D. and Brisset, J.-L. (2013) Non-Thermal Plasma Coupled
to TiO2 Applicable for the Removal of Paraquat from Aqueous Solutions. International Journal of Research in
Chemistry and Environment 3(1), 316-326.
Gao, L., Sun, L., Wan, S., Yu, Z. and Li, M. (2013) Degradation kinetics and mechanism of emerging
contaminants in water by dielectric barrier discharge non-thermal plasma: The case of 17β-Estradiol. Chemical
Engineering Journal 228, 790-798.
Garland, J.A., Elzerman, A.W. and Penkett, S.A. (1980) The mechanism for dry deposition of ozone to seawater
surfaces. Journal of Geophysical Research: Oceans 85(C12), 7488-7492.
Ghatak, H.R. (2014) Advanced oxidation processes for the treatment of biorecalcitrant organics in wastewater.
Critical Reviews in Environmental Science and Technology 44(11), 1167-1219.
Ghodbane, H., Nikiforov, A.Y., Hamdaoui, O., Surmont, P., Lynen, F., Willems, G. and Leys, C. (2014) Non-
thermal Plasma Degradation of Anthraquinonic Dye in Water: Oxidation Pathways and Effect of Natural
Matrices. Journal of Advanced Oxidation Technologies 17(2), 372-384.
Page 28
28
Giacomazzi, S. and Cochet, N. (2004) Environmental impact of diuron transformation: a review. Chemosphere
56(11), 1021-1032.
Haag, W.R. and Yao, C.D. (1992) Rate constants for reaction of hydroxyl radicals with several drinking water
contaminants. Environmental Science & Technology 26(5), 1005-1013.
Heidt, L.J. and Landi, V.R. (1967) Stabilization of ozone, United States Patent Office, 3,352,642.
Hijosa-Valsero, M., Molina, R., Montràs, A., Müller, M. and Bayona, J.M. (2014) Decontamination of
waterborne chemical pollutants by using atmospheric pressure nonthermal plasma: a review. Environmental
Technology Reviews 3(1), 71-91.
Hijosa-Valsero, M., Molina, R., Schikora, H., Müller, M. and Bayona, J.M. (2013) Removal of priority
pollutants from water by means of dielectric barrier discharge atmospheric plasma. Journal of Hazardous
Materials 262, 664-673.
Hoigné, J., Bader, H., Haag, W. and Staehelin, J. (1985) Rate constants of reactions of ozone with organic and
inorganic compounds in water—III. Inorganic compounds and radicals. Water Research 19(8), 993-1004.
Jiang, P.Y., Katsumura, Y., Ishigure, K. and Yoshida, Y. (1992) Reduction potential of the nitrate radical in
aqueous solution. Inorganic Chemistry 31(24), 5135-5136.
Kalra, S.S., Mohan, S., Sinha, A. and Singh, G. (2011) Advanced oxidation processes for treatment of textile
and dye wastewater: a review, pp. 271-275, IACSIT Press Singapore.
Katsumura, Y., Jiang, P., Nagaishi, R., Oishi, T., Ishigure, K. and Yoshida, Y. (1991) Pulse radiolysis study of
aqueous nitric acid solutions: formation mechanism, yield, and reactivity of NO3 radical. The Journal of
Physical Chemistry 95(11), 4435-4439.
Løgager, T. and Sehested, K. (1993) Formation and decay of peroxynitrous acid: a pulse radiolysis study. The
Journal of Physical Chemistry 97(25), 6664-6669.
Lukes, P., Dolezalova, E., Sisrova, I. and Clupek, M. (2014) Aqueous-phase chemistry and bactericidal effects
from an air discharge plasma in contact with water: evidence for the formation of peroxynitrite through a
pseudo-second-order post-discharge reaction of H2O2and HNO2. Plasma Sources Science and Technology
23(1), 015019.
Luo, Y., Guo, W., Ngo, H.H., Nghiem, L.D., Hai, F.I., Zhang, J., Liang, S. and Wang, X.C. (2014) A review on
the occurrence of micropollutants in the aquatic environment and their fate and removal during wastewater
treatment. Science of The Total Environment 473-474, 619-641.
Magureanu, M., Piroi, D., Mandache, N.B., David, V., Medvedovici, A. and Parvulescu, V.I. (2010)
Page 29
29
Degradation of pharmaceutical compound pentoxifylline in water by non-thermal plasma treatment. Water
Research 44(11), 3445-3453.
McDonogh, C.F. and Sanders, N.J. (1995) Peroxymonosulfuric acid formed by reaction of hydrogen peroxide
and sulfuric acid, United States Patents, US005429812A.
Milla, S., Depiereux, S. and Kestemont, P. (2011) The effects of estrogenic and androgenic endocrine disruptors
on the immune system of fish: a review. Ecotoxicology 20(2), 305-319.
Moniczewski, A., Gawlik, M., Smaga, I., Niedzielska, E., Krzek, J., Przegaliński, E., Pera, J. and Filip, M.
(2015) Oxidative stress as an etiological factor and a potential treatment target of psychiatric disorders. Part 1.
Chemical aspects and biological sources of oxidative stress in the brain. Pharmacological Reports 67(3), 560-
568.
Moreno-Castilla, C. (2004) Adsorption of organic molecules from aqueous solutions on carbon materials.
Carbon 42(1), 83-94.
Nakagawa, Y., Mitamura, S., Fujiwara, Y. and Nishitani, T. (2003) Decolorization of Rhodamine B in Water by
Pulsed High-Voltage Gas Discharge. Japanese Journal of Applied Physics 42(Part 1, No. 3), 1422-1428.
Ognier, S., Iya-sou, D., Fourmond, C. and Cavadias, S. (2009) Analysis of Mechanisms at the Plasma–Liquid
Interface in a Gas–Liquid Discharge Reactor Used for Treatment of Polluted Water. Plasma Chemistry and
Plasma Processing 29(4), 261-273.
Olszewski, P., Li, J., Liu, D. and Walsh, J. (2014) Optimizing the electrical excitation of an atmospheric
pressure plasma advanced oxidation process. Journal of Hazardous Materials 279, 60-66.
Oturan, M.A. and Aaron, J.-J. (2014) Advanced oxidation processes in water/wastewater treatment: principles
and applications. A review. Critical Reviews in Environmental Science and Technology 44(23), 2577-2641.
Penkett, S. (1972) Oxidation of SO2 and other atmospheric gases by ozone in aqueous solution. Nature
240(101), 105-106.
Rizzo, L., Manaia, C., Merlin, C., Schwartz, T., Dagot, C., Ploy, M., Michael, I. and Fatta-Kassinos, D. (2013)
Urban wastewater treatment plants as hotspots for antibiotic resistant bacteria and genes spread into the
environment: a review. Science of The Total Environment 447, 345-360.
Roche, P. and Prados, M. (1995) Removal of pesticides by use of ozone or hydrogen peroxide/ozone. Ozone:
Science & Engineering 17(6), 657-672.
Seddon, W., Fletcher, J. and Sopchyshyn, F. (1973) Pulse radiolysis of nitric oxide in aqueous solution.
Canadian Journal of Chemistry 51(7), 1123-1130.
Page 30
30
Spivey, J., Han, Y. and Dooley, K. (2015) Catalysis, Volume 27 of Specialist Periodical Reports, Royal Society
of Chemistry, ISBN 9781782620549.
Squadrito, G.L. and Pryor, W.A. (2002) Mapping the reaction of peroxynitrite with CO2: energetics, reactive
species, and biological implications. Chemical research in toxicology 15(7), 885-895.
Strehlow, H. and Wagner, I. (1982) Flash photolysis in aqueous nitrite solutions. Zeitschrift für Physikalische
Chemie 132(2), 151-160.
Treinin, A. and Hayon, E. (1970) Absorption spectra and reaction kinetics of NO2, N2O3, and N2O4 in aqueous
solution. Journal of the American Chemical Society 92(20), 5821-5828.
Vanraes, P., Willems, G., Daels, N., Van Hulle, S.W., De Clerck, K., Surmont, P., Lynen, F., Vandamme, J.,
Van Durme, J. and Nikiforov, A. (2015a) Decomposition of atrazine traces in water by combination of non-
thermal electrical discharge and adsorption on nanofiber membrane. Water Research 72, 361-371.
Vanraes, P., Willems, G., Nikiforov, A., Surmont, P., Lynen, F., Vandamme, J., Van Durme, J., Verheust, Y.P.,
Van Hulle, S.W.H., Dumoulin, A. and Leys, C. (2015b) Removal of atrazine in water by combination of
activated carbon and dielectric barrier discharge. Journal of Hazardous Materials 299, 647–655.
Verlicchi, P., Galletti, A., Petrovic, M. and Barceló, D. (2010) Hospital effluents as a source of emerging
pollutants: an overview of micropollutants and sustainable treatment options. Journal of Hydrology 389(3), 416-
428.
WHO (2008) World Health Organisation, Guidelines for drinking-water quality: recommendations, World
Health Organization.
Wohlers, J., Koh, I.-O., Thiemann, W. and Rotard, W. (2009) Application of an air ionization device using an
atmospheric pressure corona discharge process for water purification. Water, Air, and Soil Pollution 196(1-4),
101-113.
Yao, C.D. and Haag, W.R. (1991) Rate constants for direct reactions of ozone with several drinking water
contaminants. Water Research 25(7), 761-773.
Page 31
31
Appendix A – Supplementary literature data
Table A.1. Henry law constant H, reaction rate for direct ozone attack kO3, reaction rate for OH attack
kOH, water solubility, octanol water partition coefficient log POW and molar mass of all micropollutants
used in this work.
α-HCH PeCB alachlor diuron isoproturon
H (atm/M) 1.06 × 10⁻²
6.91 × 10⁻¹
7.14 × 10⁻⁵
5.10 × 10⁻⁷
1.22 × 10⁻⁷
kO3 (M-1
s-1
) 3.40 16.5 141
kOH (M-1
s-1
) 5 × 10⁹ 7.10 × 10
9 5.70 × 10
9
Solubility (mg/L) 1.5 1.0 242 42 65.0
Log POW 3.89 4.94 2.92 2.85 2.46
Molar mass (g/mol) 291 250 270 233 206
Table A.2. Reported influence of initial pollutant concentration C0 on the decomposition rate constant
for 25 different reactors or conditions.
Discharge type Reactor description Power type Compound C0 range
(mg/L) reference
Increasing degradation rate constant with decreasing C0
gas DBD
air DBD over mixed water bulk +pulsed 17β-Estradiol 0.1-0.9 [1]
O2 DBD coaxial falling water film reactor +
plasma gas bubbling -pulsed
methyl red 10-50 [2]
pentoxifylline 25-150 [3]
air coaxial whirlpool DBD reactor HF ±pulsed methyl orange 10-100 [4]
spray DBD single-pass DBD coaxial spray + falling water
film +pulsed rhodamine B 2.6-22 [5]
bubble DBD air DBD bubble discharge reactor
+ plasma gas bubbling AC
crystal violet 50-100 [6]
methylene blue 50-100 [7]
phenol 50-100 [8]
methyl orange 50-100 [9]
endosulfan 5-15 [10]
gas corona multi-needle over streaming water +pulsed methyl orange 40-80 [11]
corona wetted wall reactor with inner rod pulsed sulfadiazine 10-80 [12]
spray corona
single-pass corona multi-wire-to-plate spray
+ falling film reactor +pulsed
salicylic acid 50-100 [13]
lignin 80-600
single-pass air corona electrospray reactor +pulsed phenol 1-20 [14]
corona spray in multi-wire-to-plate with TiO2 +pulsed cycloferon 100-300 [15]
glow
glow discharge above water bulk with mixing +DC acid blue 25 5-50 [16, 17]
contact glow discharge electrolysis +DC brilliant red B 8-20
[18] acid flavine G 6-20
gliding arc non-thermal gliding arc over water bulk unknown paraquat 5-45 [19]
plasma gas
bubbling
plasma gas bubbling reactors with UV
irradiation through quartz barrier AC
phenol 60-200 [20]
coking waste 17-680 [21]
Orange II 10-100 [22]
100% relative humidity air DBD plasma gas
bubbling AC acid red 88 10-50 [23]
Page 32
32
Other observed influence of decreasing C0
gas DBD DBD over water bulk with radial flow AC nitenpyram 50-200 [24]
spray DBD single-pass DBD coaxial spray + falling water
film +pulsed rhodamine B 1.9-3.3 [5]
electrohydraulic plasma electrolysis DC ionic liquids 1-4 × 10⁴ [25]
Table A.3. Energy yield G50 and electrical energy per order EEO as a function of applied power for
four studies reported in literature, with reactors and operational conditions similar to ours. G50 and
EEO are calculated based on the available data in the corresponding report. Initial concentration is
given in the first column.
micropollutant Power (W) G50 (mg/kWh) EEO (kWh/m3) reference
23 mg/L 100 225 170
diuron 120 218 175 [26]
150 249 154
4.6 mg/L 90 25.4 301
2,4-dinitrophenol 120 27.0 283 [27]
150 23.5 325
100 mg/L 80 259 641
nitenpyram 140 187 889 [28]
200 165 1008
16.2 mg/L 120 269 100
3,4-dichloroaniline 135 332 81 [29]
150 327 82
References
[1] L. Gao, et al., "Degradation kinetics and mechanism of emerging contaminants in water by
dielectric barrier discharge non-thermal plasma: The case of 17β-Estradiol," Chemical
Engineering Journal, vol. 228, pp. 790-798, 2013.
[2] D. Piroi, et al., "Pulsed dielectric barrier discharge generated at the gas-liquid interface for the
degradation of the organic dye methyl red in aqueous solution," in Optimization of Electrical
and Electronic Equipment (OPTIM), 2010 12th International Conference on, 2010, pp. 1323-
1328.
[3] M. Magureanu, et al., "Degradation of pharmaceutical compound pentoxifylline in water by
non-thermal plasma treatment," Water Research, vol. 44, pp. 3445-3453, 2010.
[4] Y. Chen, et al., "A Discharge Reactor with Water-Gas Mixing for Methyl Orange Removal,"
International Journal of Plasma Environmental Science and Technology, 2008.
[5] Y. Nakagawa, et al., "Decolorization of Rhodamine B in Water by Pulsed High-Voltage Gas
Discharge," Japanese Journal of Applied Physics, vol. 42, pp. 1422-1428, 2003.
[6] P. M. K. Reddy and C. Subrahmanyam, "Green Approach for Wastewater Treatment—
Degradation and Mineralization of Aqueous Organic Pollutants by Discharge Plasma,"
Industrial & Engineering Chemistry Research, vol. 51, pp. 11097-11103, 2012.
[7] P. M. K. Reddy, et al., "Degradation and mineralization of methylene blue by dielectric
barrier discharge non-thermal plasma reactor," Chemical Engineering Journal, vol. 217, pp.
41-47, 2013.
[8] P. M. K. Reddy, et al., "Mineralization of Phenol in Water by Catalytic Non-Thermal Plasma
Reactor - An Eco-Friendly Approach for Wastewater Treatment," Plasma Processes and
Polymers, vol. 10, pp. 1010-1017, 2013.
[9] P. M. K. Reddy, et al., "Mineralization of aqueous organic pollutants using a catalytic plasma
Page 33
33
reactor," Indian Journal of Chemistry, vol. 53, pp. 499-503, 2014.
[10] P. M. K. Reddy, et al., "Catalytic non-thermal plasma reactor for mineralization of endosulfan
in aqueous medium: A green approach for the treatment of pesticide contaminated water,"
Chemical Engineering Journal, vol. 238, pp. 157-163, 2014.
[11] B. Jiang, et al., "Degradation of azo dye using non-thermal plasma advanced oxidation
process in a circulatory airtight reactor system," Chemical Engineering Journal, vol. 204-206,
pp. 32-39, 2012.
[12] S. Rong and Y. Sun, "Wetted-wall corona discharge induced degradation of sulfadiazine
antibiotics in aqueous solution," Journal of Chemical Technology & Biotechnology, vol. 89,
pp. 1351-1359, 2013.
[13] I. C. Panorel, "Pulsed corona discharge as an advanced oxidation process for the degradation
of organic compounds in water," Doctor Doctoral thesis, Acta Universitatis
Lappeenrantaensis 535, Lappeenranta University of Technology, Lappeenranta, Finland,
2013.
[14] M. Elsawah, et al., "Corona discharge with electrospraying system for phenol removal from
water," Plasma Science, IEEE Transactions on, vol. 40, pp. 29-34, 2012.
[15] P. Ajo, "Combination of pulsed corona discharge with TiO2 photocatalysis: verification of
hypothesis," Master, Faculty of Technology, Lappeenranta University of Technology,
Lappeenranta, 2013.
[16] H. Ghodbane, et al., "Degradation of AB25 dye in liquid medium by atmospheric pressure
non-thermal plasma and plasma combination with photocatalyst TiO2," Open Chemistry, vol.
13, 2015.
[17] H. Ghodbane, et al., "Non-thermal Plasma Degradation of Anthraquinonic Dye in Water:
Oxidation Pathways and Effect of Natural Matrices," Journal of Advanced Oxidation
Technologies, vol. 17, pp. 372-384, 2014.
[18] J. Gao, et al., "Plasma degradation of dyes in water with contact glow discharge electrolysis,"
Water Research, vol. 37, pp. 267-272, 2003.
[19] M. Fouodjouo, et al., "Non-Thermal Plasma Coupled to TiO2 Applicable for the Removal of
Paraquat from Aqueous Solutions," International Journal of Research in Chemistry and
Environment, vol. 3, pp. 316-326, 2013.
[20] L. Duan, et al., "Study on the factors influencing phenol degradation in water by dielectric
barrier discharge (DBD)," Journal of Physics: Conference Series, vol. 418, p. 012129, 2013.
[21] L. Duan, et al., "Enhanced biodegradability of coking wastewater by gas phase dielectric
barrier discharge plasma," Separation and Purification Technology, vol. 154, pp. 359-365,
2015.
[22] Y. S. Mok, et al., "Degradation of an azo dye Orange II using a gas phase dielectric barrier
discharge reactor submerged in water," Chemical Engineering Journal, vol. 142, pp. 56-64,
2008.
[23] Q. Tang, et al., "Degradation of Azo Dye Acid Red 88 by Gas Phase Dielectric Barrier
Discharges," Plasma Chemistry and Plasma Processing, vol. 29, pp. 291-305, 2009.
[24] S. P. Li, et al., "Degradation of nitenpyram pesticide in aqueous solution by low-temperature
plasma," Environmental Technology, vol. 34, pp. 1609-1616, 2013.
[25] J. Gao, et al., "Degradation of imidazolium-based ionic liquids in aqueous solution using
plasma electrolysis," Journal of Hazardous Materials, vol. 265, pp. 261-270, 2014.
[26] J. Feng, et al., "Degradation of diuron in aqueous solution by dielectric barrier discharge,"
Journal of Hazardous Materials, vol. 154, pp. 1081-1089, 2008.
[27] J. Zhang, et al., "Low-temperature plasma-induced degradation of aqueous 2, 4-
dinitrophenol," Journal of Hazardous Materials, vol. 154, pp. 506-512, 2008.
[28] S. Li, et al., "Degradation of nitenpyram pesticide in aqueous solution by low-temperature
plasma," Environmental Technology, vol. 34, pp. 1609-1616, 2013.
[29] J. Feng, et al., "Degradation of aqueous 3, 4-dichloroaniline by a novel dielectric barrier
discharge plasma reactor," Environmental Science and Pollution Research, vol. 22, pp. 4447-
4459, 2015.
Page 34
34
Appendix B – Supplementary statistical data
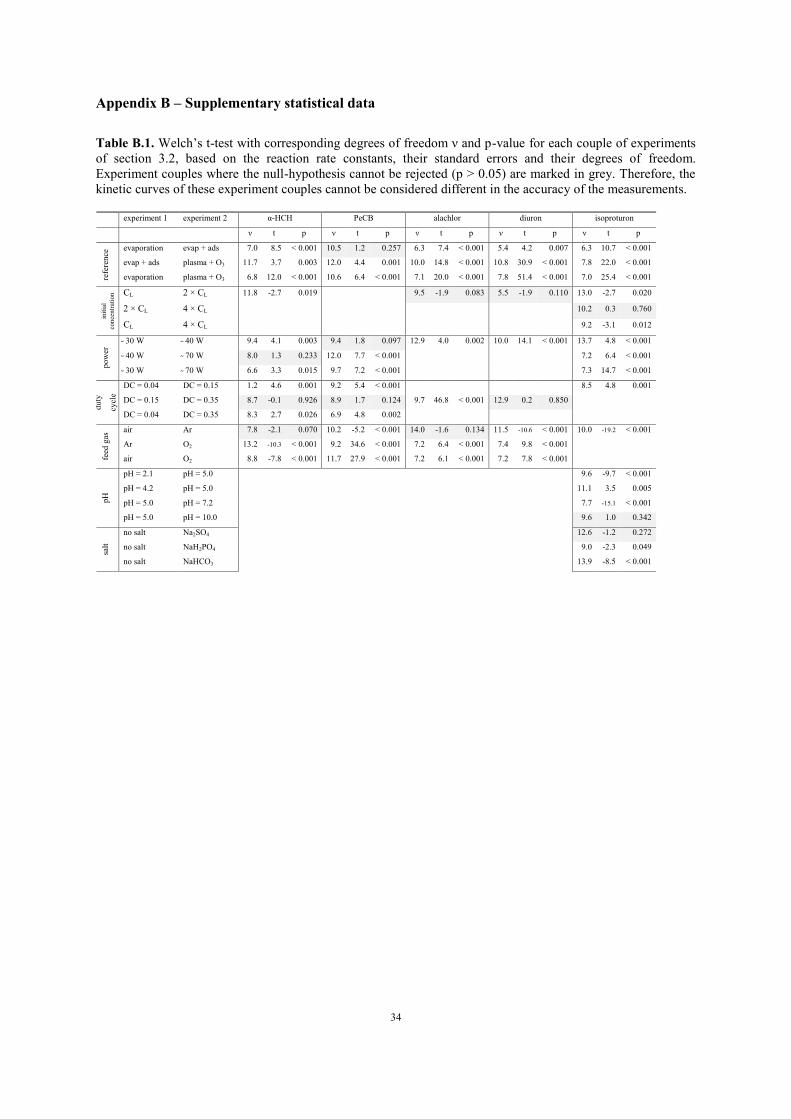
Table B.1. Welch’s t-test with corresponding degrees of freedom ν and p-value for each couple of experiments
of section 3.2, based on the reaction rate constants, their standard errors and their degrees of freedom.
Experiment couples where the null-hypothesis cannot be rejected (p > 0.05) are marked in grey. Therefore, the
kinetic curves of these experiment couples cannot be considered different in the accuracy of the measurements.
experiment 1 experiment 2 α-HCH PeCB alachlor diuron isoproturon
ν t p ν t p ν t p ν t p ν t p
refe
ren
ce evaporation evap + ads 7.0 8.5 < 0.001 10.5 1.2 0.257 6.3 7.4 < 0.001 5.4 4.2 0.007 6.3 10.7 < 0.001
evap + ads plasma + O3 11.7 3.7 0.003 12.0 4.4 0.001 10.0 14.8 < 0.001 10.8 30.9 < 0.001 7.8 22.0 < 0.001
evaporation plasma + O3 6.8 12.0 < 0.001 10.6 6.4 < 0.001 7.1 20.0 < 0.001 7.8 51.4 < 0.001 7.0 25.4 < 0.001
init
ial
con
centr
atio
n CL 2 × CL 11.8 -2.7 0.019 9.5 -1.9 0.083 5.5 -1.9 0.110 13.0 -2.7 0.020
2 × CL 4 × CL 10.2 0.3 0.760
CL 4 × CL 9.2 -3.1 0.012
po
wer
30 W 40 W 9.4 4.1 0.003 9.4 1.8 0.097 12.9 4.0 0.002 10.0 14.1 < 0.001 13.7 4.8 < 0.001
40 W 70 W 8.0 1.3 0.233 12.0 7.7 < 0.001 7.2 6.4 < 0.001
30 W 70 W 6.6 3.3 0.015 9.7 7.2 < 0.001 7.3 14.7 < 0.001
du
ty
cycl
e
DC = 0.04 DC = 0.15 1.2 4.6 0.001 9.2 5.4 < 0.001 8.5 4.8 0.001
DC = 0.15 DC = 0.35 8.7 -0.1 0.926 8.9 1.7 0.124 9.7 46.8 < 0.001 12.9 0.2 0.850
DC = 0.04 DC = 0.35 8.3 2.7 0.026 6.9 4.8 0.002
feed
gas
air Ar 7.8 -2.1 0.070 10.2 -5.2 < 0.001 14.0 -1.6 0.134 11.5 -10.6 < 0.001 10.0 -19.2 < 0.001
Ar O2 13.2 -10.3 < 0.001 9.2 34.6 < 0.001 7.2 6.4 < 0.001 7.4 9.8 < 0.001
air O2 8.8 -7.8 < 0.001 11.7 27.9 < 0.001 7.2 6.1 < 0.001 7.2 7.8 < 0.001
pH
pH = 2.1 pH = 5.0 9.6 -9.7 < 0.001
pH = 4.2 pH = 5.0 11.1 3.5 0.005
pH = 5.0 pH = 7.2 7.7 -15.1 < 0.001
pH = 5.0 pH = 10.0 9.6 1.0 0.342
salt
no salt Na2SO4 12.6 -1.2 0.272
no salt NaH2PO4 9.0 -2.3 0.049
no salt NaHCO3 13.9 -8.5 < 0.001
Page 35
35
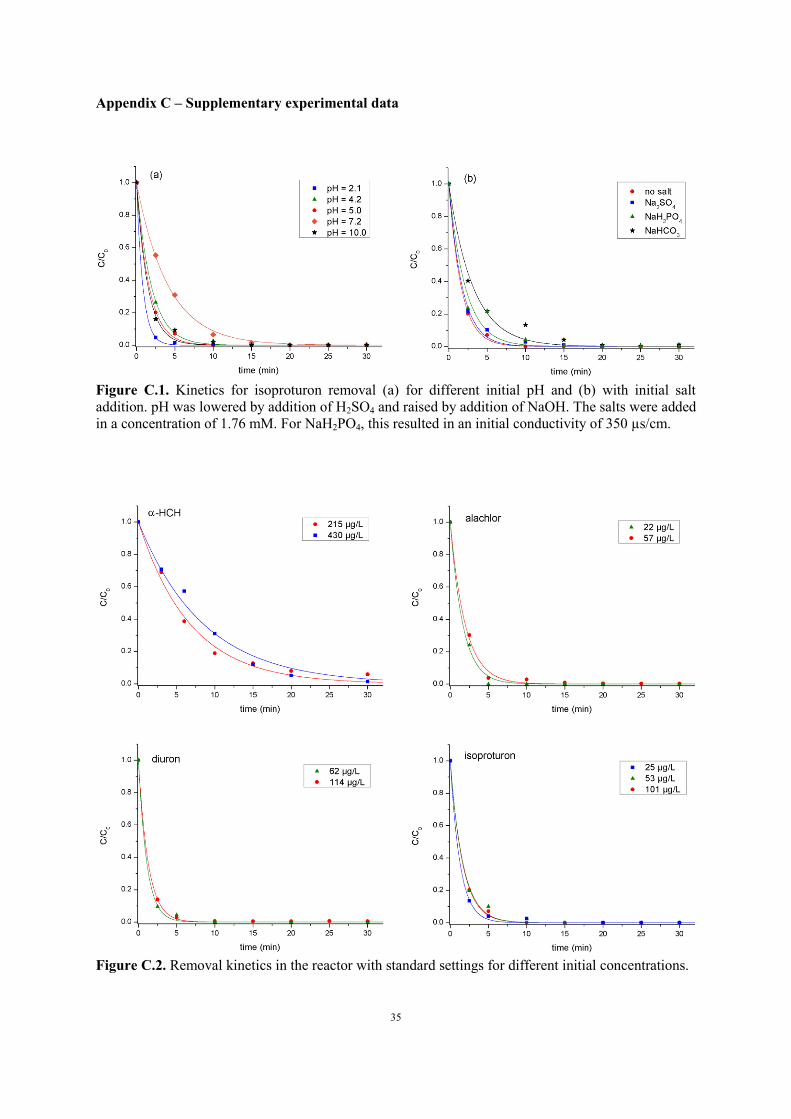
Appendix C – Supplementary experimental data
Figure C.1. Kinetics for isoproturon removal (a) for different initial pH and (b) with initial salt
addition. pH was lowered by addition of H2SO4 and raised by addition of NaOH. The salts were added
in a concentration of 1.76 mM. For NaH2PO4, this resulted in an initial conductivity of 350 µs/cm.
Figure C.2. Removal kinetics in the reactor with standard settings for different initial concentrations.
Page 36
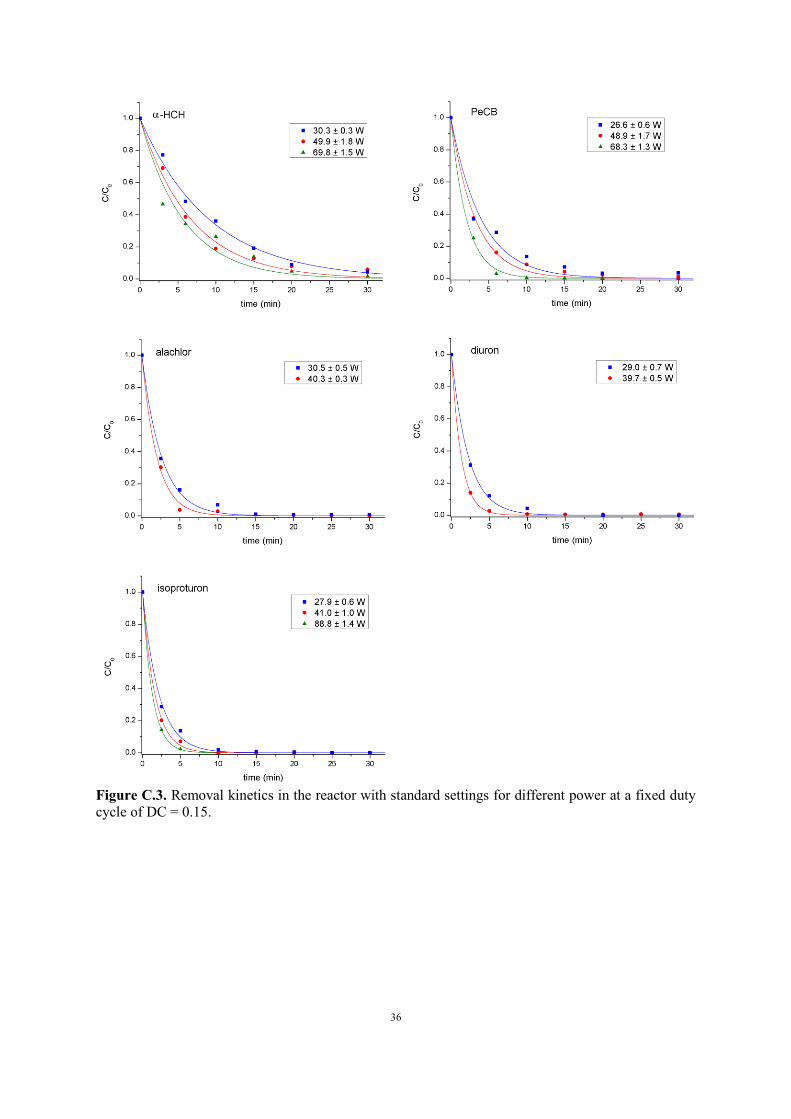
36
Figure C.3. Removal kinetics in the reactor with standard settings for different power at a fixed duty
cycle of DC = 0.15.
Page 37
37
Table C.1. Energy yield G50 and electrical energy per order EEO for the reactor in standard settings
with different initial concentrations. CL represents the lowest concentration used (see Figure 5), 2 × CL
represents the concentration that is approximately double as high and 4 × CL is the highest
concentration (if applicable).
α-HCH alachlor diuron isoproturon
G50 (mg/kWh) CL 13.7 ± 1.0 7.2 ± 0.7 30 ± 3 9.9 ± 0.7
G50 (mg/kWh) 2 × CL 21.8 ± 1.7 15.5 ± 1.3 49 ± 3 16.6 ± 1.5
G50 (mg/kWh) 4 × CL 33.0 ± 1.8
EEO (kWh/m3) CL 26.1 ± 1.7 5.0 ± 0.4 3.4 ± 0.3 4.1 ± 0.3
EEO (kWh/m3) 2 × CL 33 ± 2 6.1 ± 0.3 3.90 ± 0.09 5.3 ± 0.4
EEO (kWh/m3) 4 × CL 5.1 ± 0.2
Table C.2. Energy yield G50 and electrical energy per order EEO for the reactor in standard settings
with different applied power at a fixed duty cycle of DC = 0.15. 30 W, 40 W and 70 W represent
the minimal, standard and maximal applied power, respectively.
α-HCH PeCB alachlor diuron isoproturon
G50 (mg/kWh) 30 W 16.7 ± 0.9 13.0 ± 1.5 15.6 ± 1.3 38 ± 2 36 ± 2
G50 (mg/kWh) 40 W 13.7 ± 1.0 9.0 ± 0.6 15.5 ± 1.3 49 ± 3 33.0 ± 1.8
G50 (mg/kWh) 70 W 11.7 ± 1.4 10.1 ± 0.5 19.1 ± 0.6
EEO (kWh/m3) 30 W 21.4 ± 0.9 8.5 ± 1.0 6.1 ± 0.3 5.0 ± 0.2 4.6 ± 0.2
EEO (kWh/m3) 40 W 26.1 ± 1.7 12.2 ± 0.7 6.1 ± 0.3 3.90 ± 0.09 5.1 ± 0.2
EEO (kWh/m3) 70 W 31 ± 4 10.9 ± 0.4 8.79 ± 0.14
Table C.3. Energy yield G50 and electrical energy per order EEO for the reactor in standard settings
with different duty cycles.
α-HCH PeCB alachlor diuron isoproturon
G50 (mg/kWh) DC = 0.04 44 ± 5 33.3 ± 1.7 124 ± 10
G50 (mg/kWh) DC = 0.15 13.7 ± 1.0 9.0 ± 0.6 15.5 ± 1.3 49 ± 3 33.0 ± 1.8
G50 (mg/kWh) DC = 0.35 3.8 ± 0.5 4.2 ± 0.4 15.1 ± 1.1 13.4 ± 0.9
EEO (kWh/m3) DC = 0.04 8.1 ± 0.9 3.32 ± 0.13 1.35 ± 0.10
EEO (kWh/m3) DC = 0.15 26.1 ± 1.7 12.2 ± 0.7 6.1 ± 0.3 3.90 ± 0.09 5.1 ± 0.2
EEO (kWh/m3) DC = 0.35 94 ± 12 26 ± 2 6.29 ± 0.18 14.2 ± 0.5