22
Removing Dissolved Pollutants from Stormwater Runoff Andy Erickson, Research Fellow St. Anthony Falls Laboratory March 8, 2012

Removing Dissolved Pollutants from
Stormwater Runoff
Andy Erickson, Research Fellow
St. Anthony Falls Laboratory
March 8, 2012

http://stormwater.safl.umn.edu/
Outline
• Why should you care about
dissolved pollutants?
• Current treatment methods
• New treatment
technologies
• Field applications and
results
• Questions
http://stormwater.safl.umn.edu/
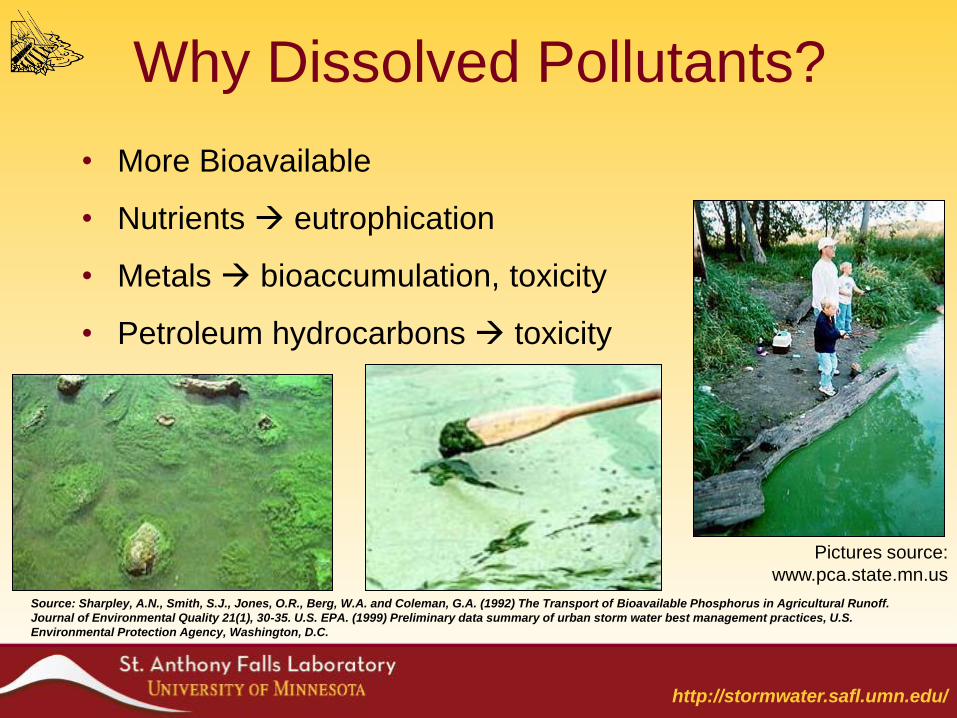
Why Dissolved Pollutants?
• More Bioavailable
• Nutrients eutrophication
• Metals bioaccumulation, toxicity
• Petroleum hydrocarbons toxicity
Pictures source:
www.pca.state.mn.us
Source: Sharpley, A.N., Smith, S.J., Jones, O.R., Berg, W.A. and Coleman, G.A. (1992) The Transport of Bioavailable Phosphorus in Agricultural Runoff.
Journal of Environmental Quality 21(1), 30-35. U.S. EPA. (1999) Preliminary data summary of urban storm water best management practices, U.S.
Environmental Protection Agency, Washington, D.C.
http://stormwater.safl.umn.edu/
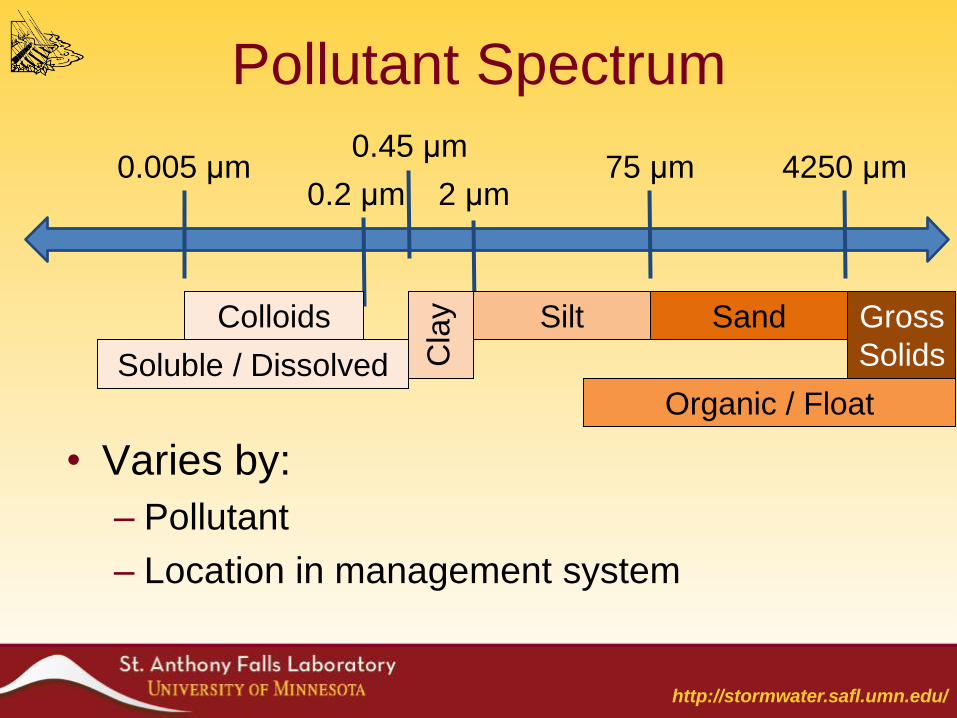
Pollutant Spectrum
• Varies by:
– Pollutant
– Location in management system
2 μm
0.45 μm 75 μm 4250 μm
0.2 μm 0.005 μm
Soluble / Dissolved
Colloids
Cla
y
Silt Sand Gross
Solids
Organic / Float
http://stormwater.safl.umn.edu/
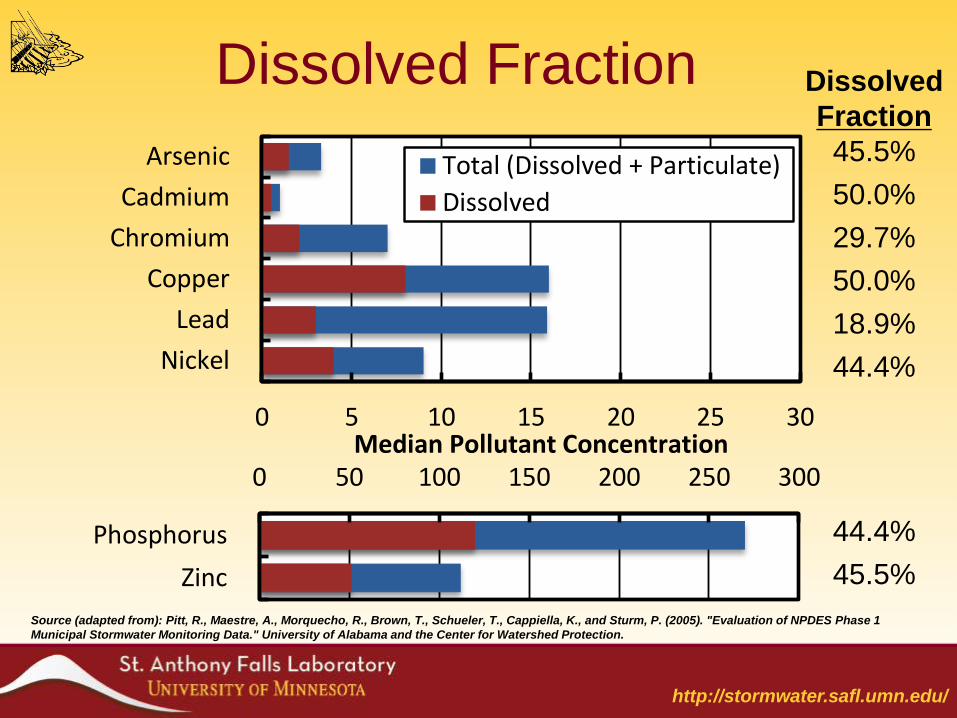
0 5 10 15 20 25 30
Arsenic
Cadmium
Chromium
Copper
Lead
Nickel
Median Pollutant Concentration
Total (Dissolved + Particulate)
Dissolved
0 50 100 150 200 250 300
Phosphorus
Zinc
Dissolved Fraction Dissolved
Fraction
45.5%
50.0%
29.7%
50.0%
18.9%
44.4%
44.4%
45.5%
Source (adapted from): Pitt, R., Maestre, A., Morquecho, R., Brown, T., Schueler, T., Cappiella, K., and Sturm, P. (2005). "Evaluation of NPDES Phase 1
Municipal Stormwater Monitoring Data." University of Alabama and the Center for Watershed Protection.
http://stormwater.safl.umn.edu/
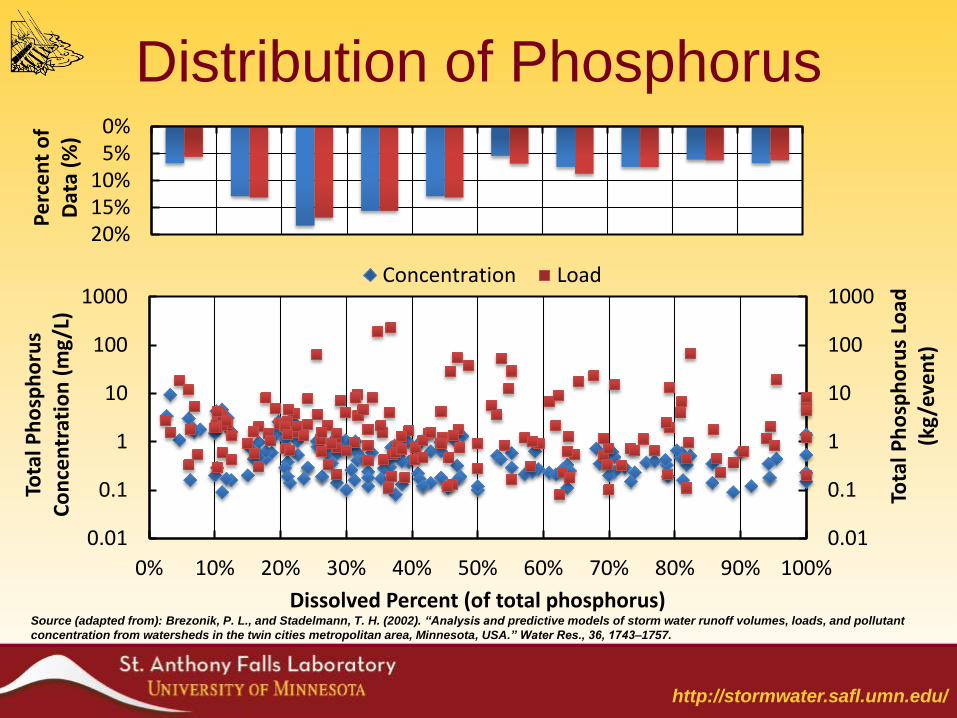
0.01
0.1
1
10
100
1000
0.01
0.1
1
10
100
1000
0% 10% 20% 30% 40% 50% 60% 70% 80% 90% 100%
Tota
l Ph
osp
ho
rus
Load
(k
g/e
ven
t)
Tota
l Ph
osp
ho
rus
Co
nce
ntr
atio
n (
mg/
L)
Dissolved Percent (of total phosphorus)
Concentration Load
0%5%
10%15%20%
Pe
rce
nt
of
Dat
a (%
)
Source (adapted from): Brezonik, P. L., and Stadelmann, T. H. (2002). “Analysis and predictive models of storm water runoff volumes, loads, and pollutant
concentration from watersheds in the twin cities metropolitan area, Minnesota, USA.” Water Res., 36, 1743–1757.
Distribution of Phosphorus

http://stormwater.safl.umn.edu/
Current Treatment Methods
• Pollution Prevention
– Target pollutants at the source
• Most stormwater treatment practices provide:
– Filtration (solids)
– Infiltration (solids, dissolved?)
– Sedimentation (solids)
– Biological or chemical (organics, dissolved?)
• Most urban watersheds need:
– 80+% capture of solids and dissolved pollutants
http://stormwater.safl.umn.edu/
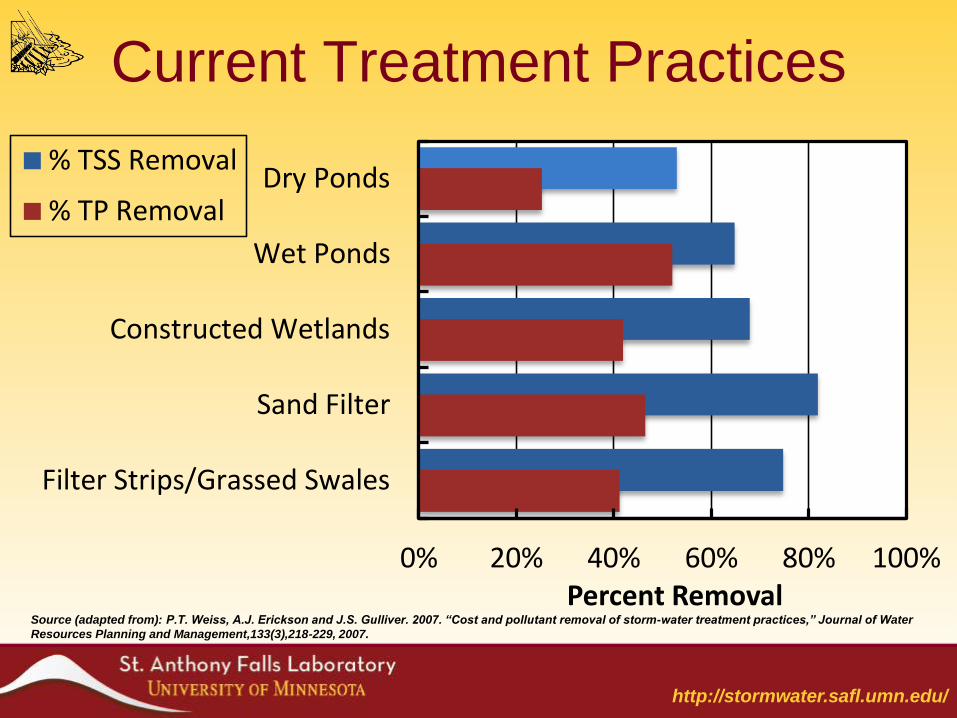
0% 20% 40% 60% 80% 100%
Dry Ponds
Wet Ponds
Constructed Wetlands
Sand Filter
Filter Strips/Grassed Swales
Percent Removal
% TSS Removal
% TP Removal
Current Treatment Practices
Source (adapted from): P.T. Weiss, A.J. Erickson and J.S. Gulliver. 2007. “Cost and pollutant removal of storm-water treatment practices,” Journal of Water
Resources Planning and Management,133(3),218-229, 2007.
http://stormwater.safl.umn.edu/
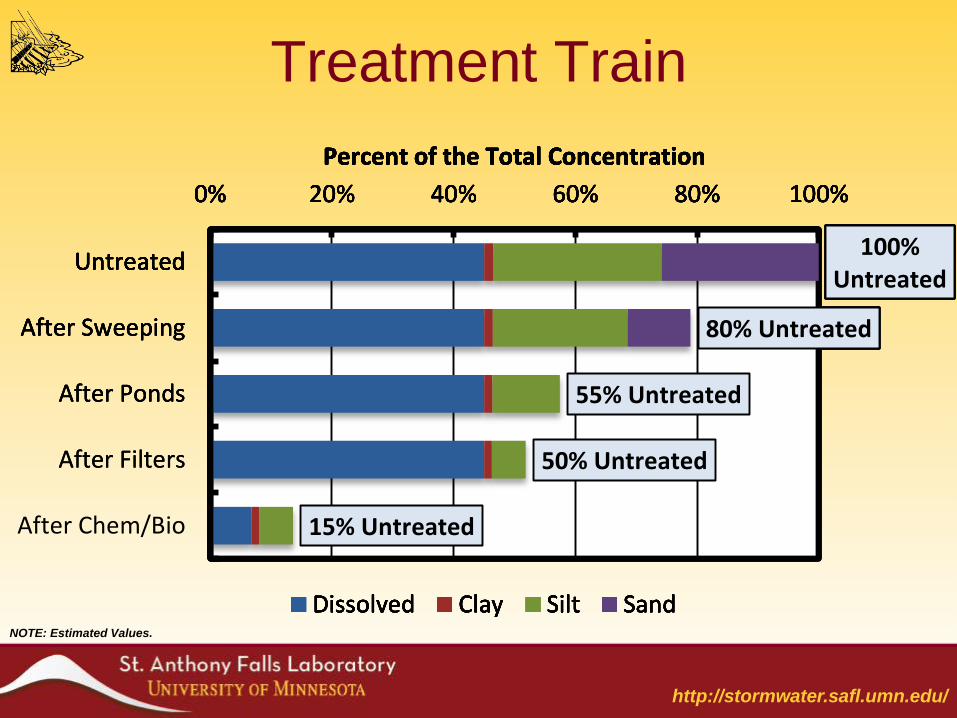
Treatment Train
NOTE: Estimated Values.
45% 2% 28% 25%
0% 20% 40% 60% 80% 100%
Untreated
Percent of the Total Concentration
Dissolved Clay Silt Sand
100% Untreated
0% 20% 40% 60% 80% 100%
Untreated
Percent of the Total Concentration
Dissolved Clay Silt Sand
100% Untreated
80% Untreated
0% 20% 40% 60% 80% 100%
Untreated
After Sweeping
Percent of the Total Concentration
Dissolved Clay Silt Sand
100% Untreated
80% Untreated
55% Untreated
0% 20% 40% 60% 80% 100%
Untreated
After Sweeping
After Ponds
Percent of the Total Concentration
Dissolved Clay Silt Sand
100% Untreated
80% Untreated
55% Untreated
50% Untreated
0% 20% 40% 60% 80% 100%
Untreated
After Sweeping
After Ponds
After Filters
Percent of the Total Concentration
Dissolved Clay Silt Sand
100% Untreated
80% Untreated
55% Untreated
50% Untreated
15% Untreated
0% 20% 40% 60% 80% 100%
Untreated
After Sweeping
After Ponds
After Filters
After Chem/Bio
Percent of the Total Concentration
Dissolved Clay Silt Sand
http://stormwater.safl.umn.edu/
Dissolved Pollutant Removal
Processes
• Vegetative processes: plant uptake and rhizospheric activity (microbes, etc.) that use and convert dissolved pollutants
• Sorption: surface sorption or complexation, ion exchange, etc. to capture dissolved pollutants
• Biodegradation: bacteria conversion of nitrates to nitrogen gas or petroleum hydrocarbons to carbon dioxide
http://stormwater.safl.umn.edu/
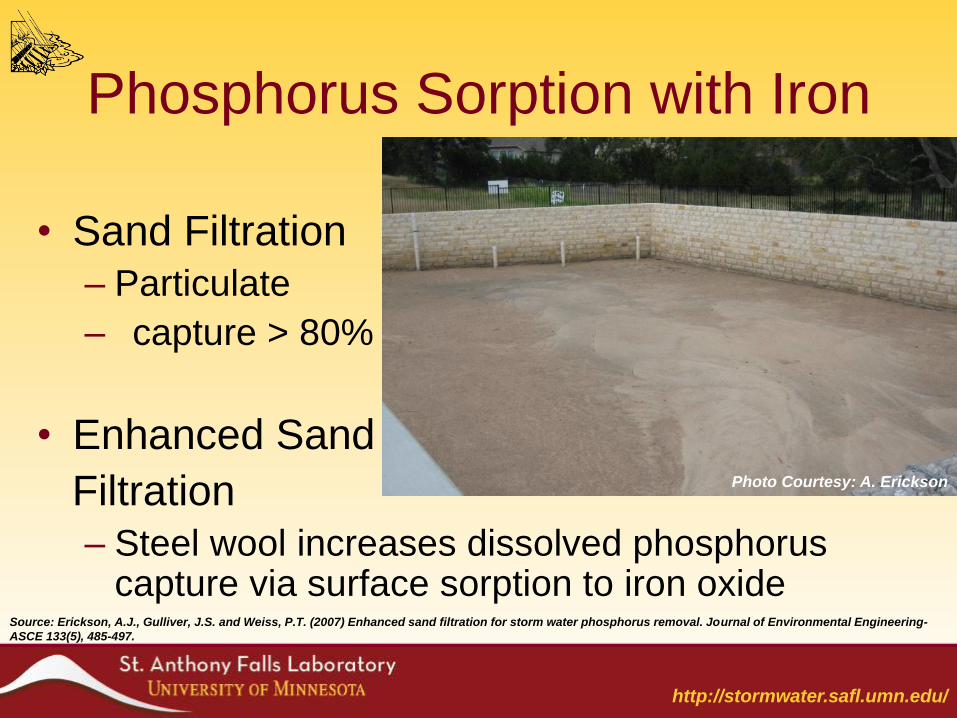
Phosphorus Sorption with Iron
• Sand Filtration
– Particulate
– capture > 80%
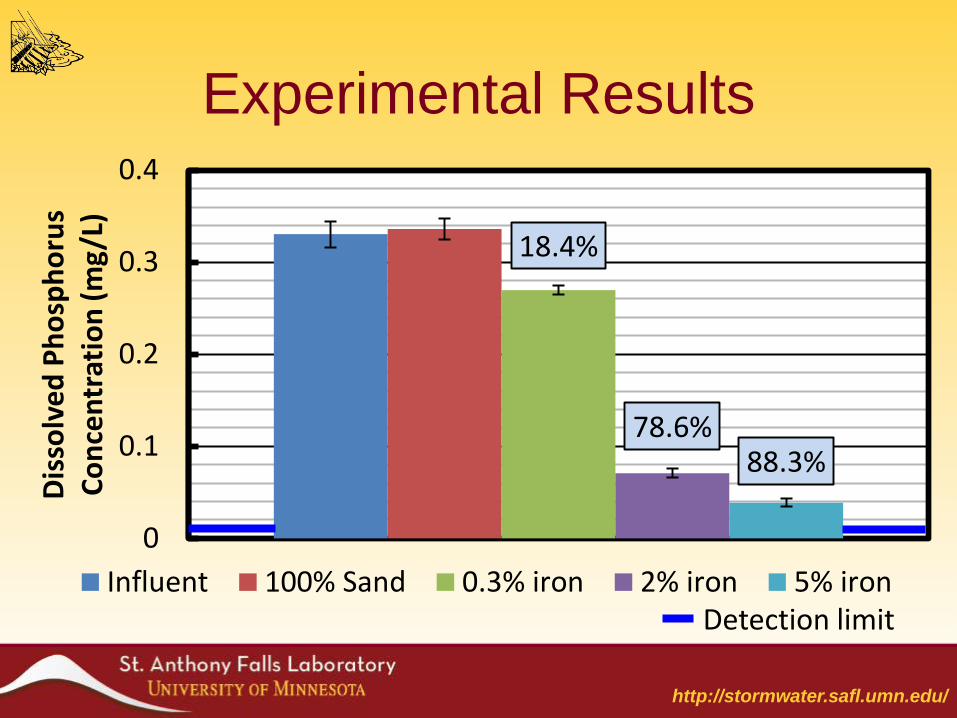
• Enhanced Sand
Filtration
– Steel wool increases dissolved phosphorus capture via surface sorption to iron oxide
Photo Courtesy: A. Erickson
Source: Erickson, A.J., Gulliver, J.S. and Weiss, P.T. (2007) Enhanced sand filtration for storm water phosphorus removal. Journal of Environmental Engineering-
ASCE 133(5), 485-497.
http://stormwater.safl.umn.edu/
18.4%
78.6%88.3%
0
0.1
0.2
0.3
0.4
Dis
solv
ed P
ho
sph
oru
s C
on
cen
trat
ion
(m
g/L)
Influent 100% Sand 0.3% iron 2% iron 5% iron
Experimental Results
Detection limit
http://stormwater.safl.umn.edu/
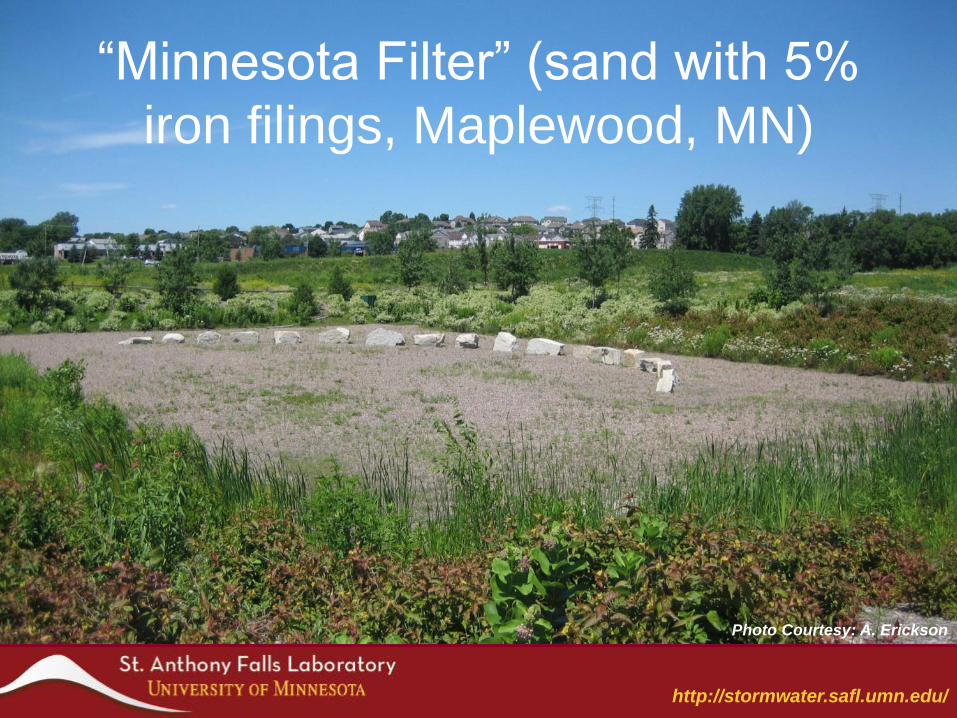
“Minnesota Filter” (sand with 5%
iron filings, Maplewood, MN)
Photo Courtesy: A. Erickson
http://stormwater.safl.umn.edu/
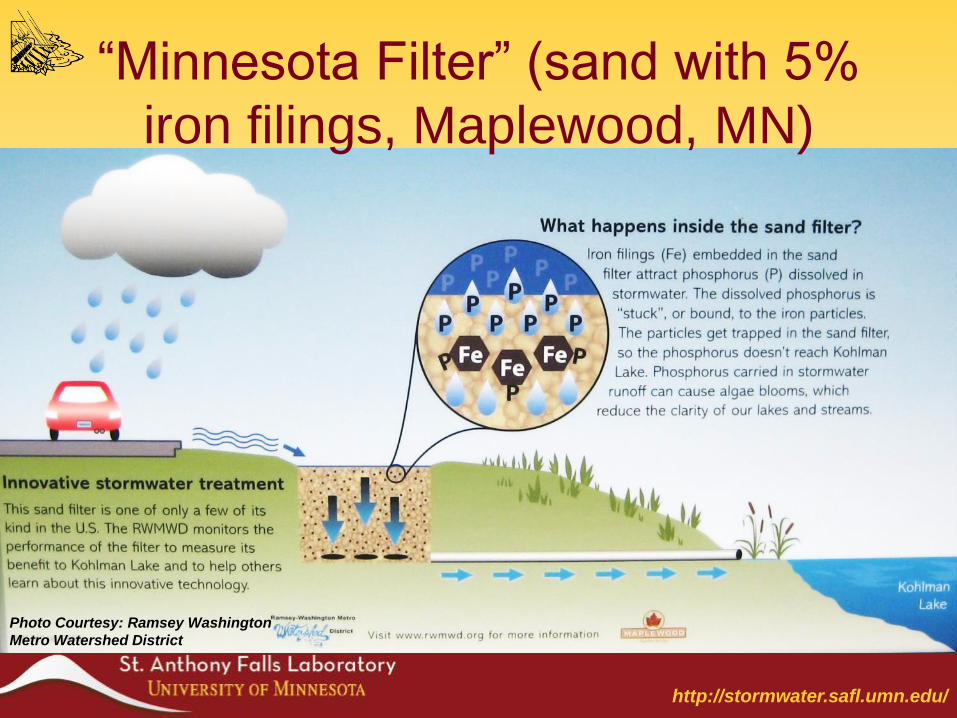
“Minnesota Filter” (sand with 5%
iron filings, Maplewood, MN)
Photo Courtesy: Ramsey Washington
Metro Watershed District
http://stormwater.safl.umn.edu/
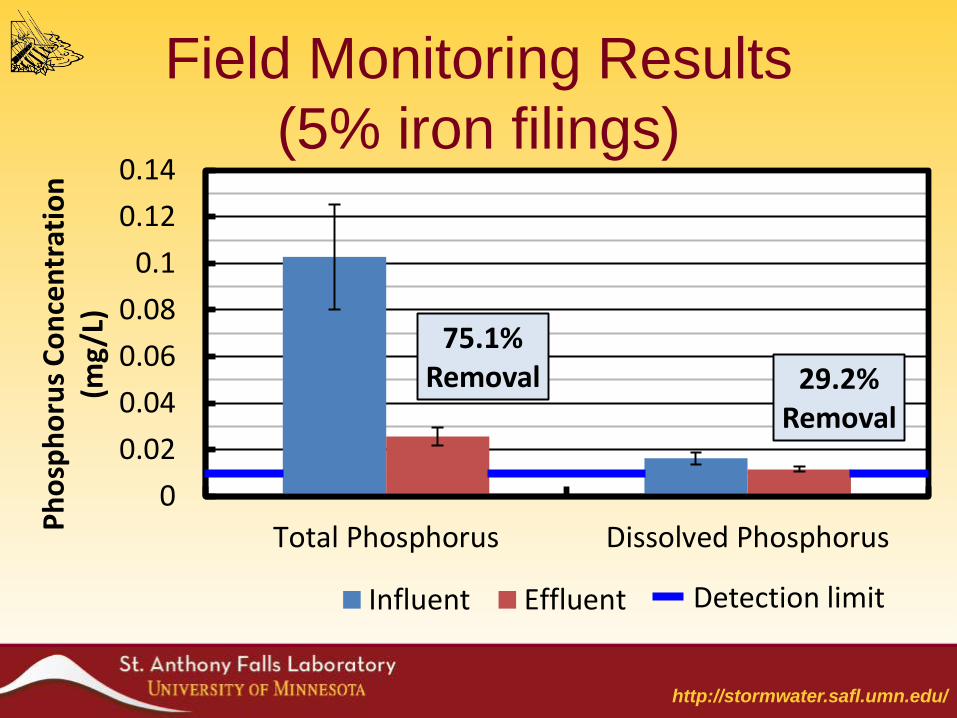
75.1% Removal 29.2%
Removal
0
0.02
0.04
0.06
0.08
0.1
0.12
0.14
Total Phosphorus Dissolved Phosphorus
Ph
osp
ho
rus
Co
nce
ntr
atio
n
(mg
/L)
Influent Effluent
Field Monitoring Results
(5% iron filings)
Detection limit
http://stormwater.safl.umn.edu/
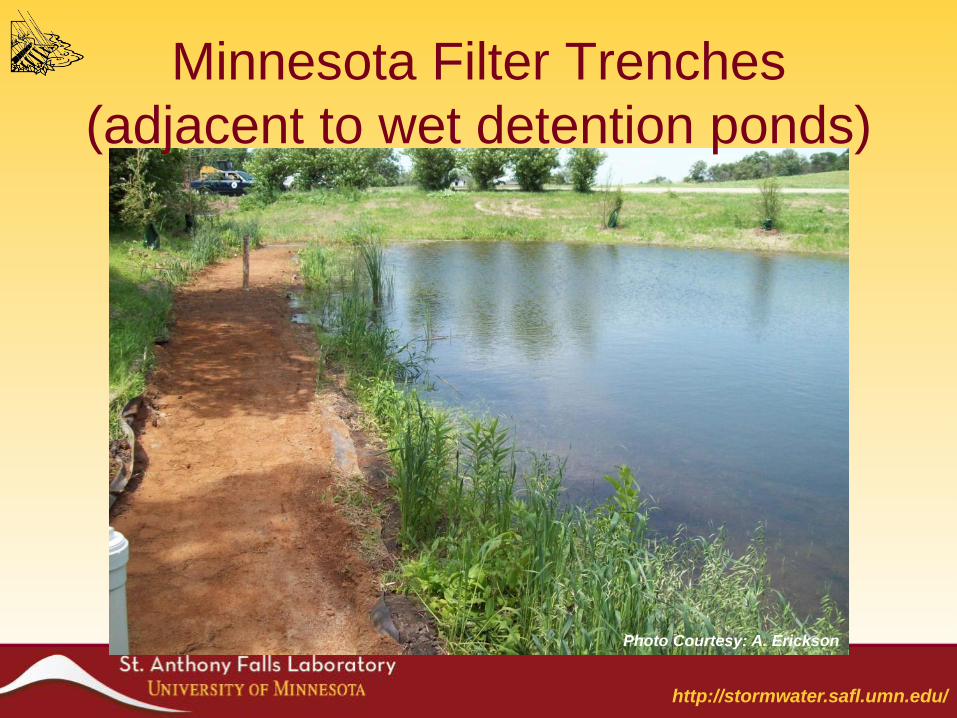
Minnesota Filter Trenches
(adjacent to wet detention ponds)
Photo Courtesy: A. Erickson
http://stormwater.safl.umn.edu/
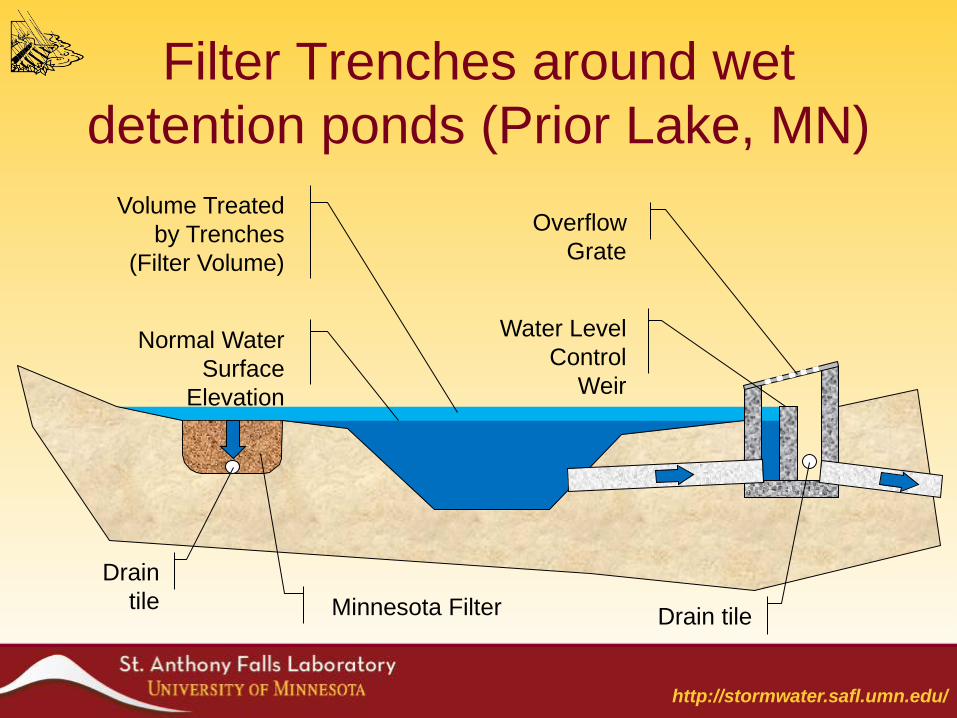
Filter Trenches around wet
detention ponds (Prior Lake, MN)
Normal Water
Surface
Elevation
Drain
tile Minnesota Filter
Water Level
Control
Weir
Overflow
Grate
Drain tile
Volume Treated
by Trenches
(Filter Volume)
http://stormwater.safl.umn.edu/
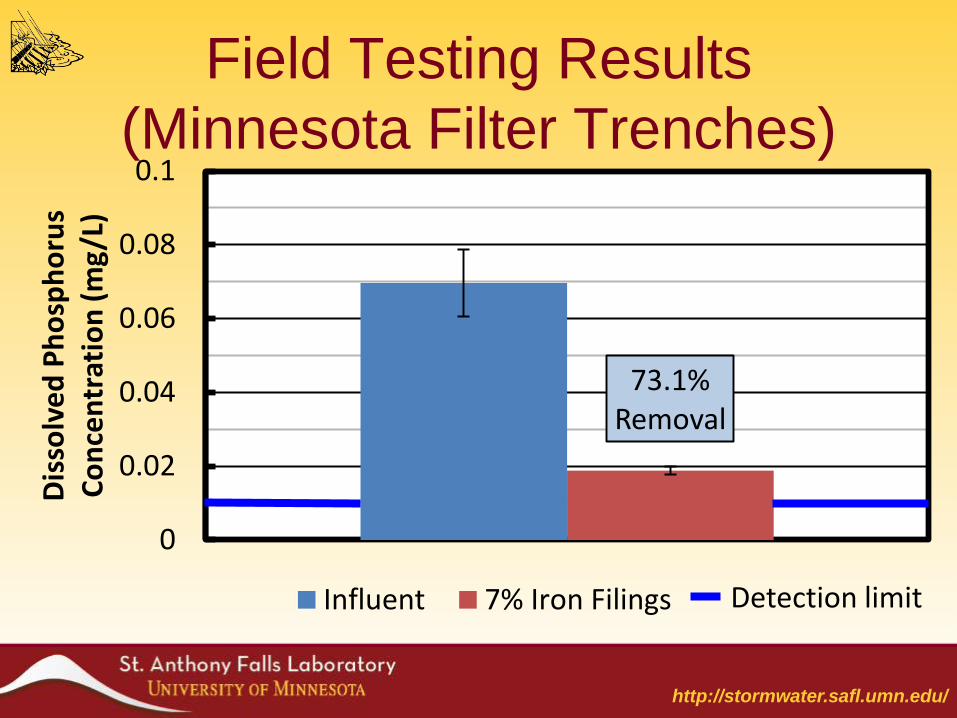
73.1% Removal
0
0.02
0.04
0.06
0.08
0.1
Dis
solv
ed
Ph
osp
ho
rus
Co
nce
ntr
atio
n (
mg
/L)
Influent 7% Iron Filings
Field Testing Results
(Minnesota Filter Trenches)
Detection limit
http://stormwater.safl.umn.edu/
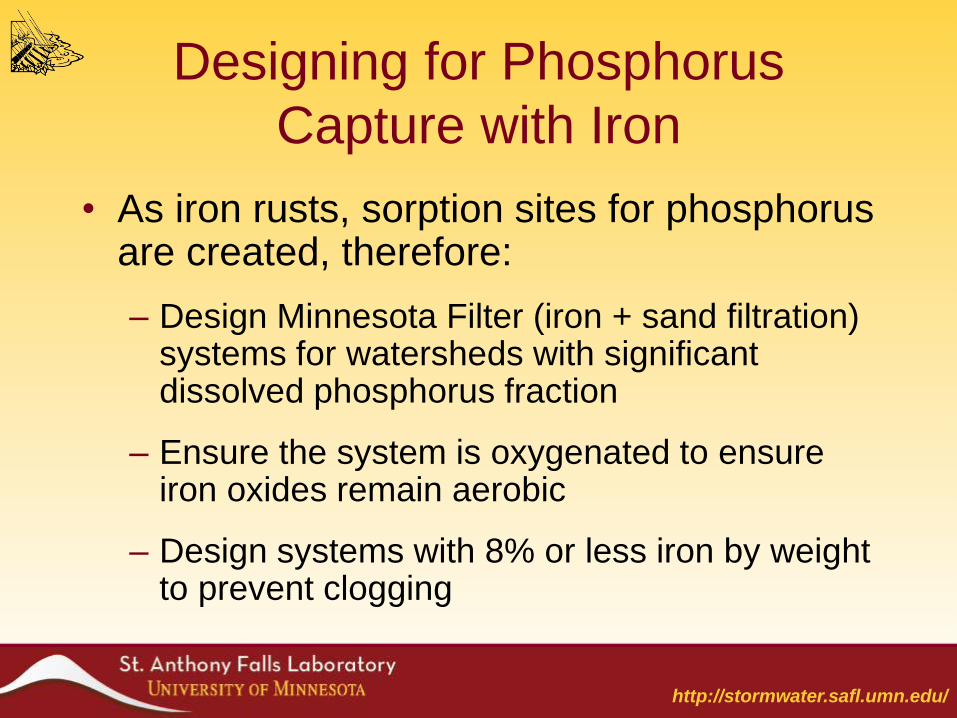
Designing for Phosphorus
Capture with Iron
• As iron rusts, sorption sites for phosphorus are created, therefore:
– Design Minnesota Filter (iron + sand filtration) systems for watersheds with significant dissolved phosphorus fraction
– Ensure the system is oxygenated to ensure iron oxides remain aerobic
– Design systems with 8% or less iron by weight to prevent clogging
http://stormwater.safl.umn.edu/
Conclusions
• Dissolved Stormwater Pollutants are important – Approx. 45% of total concentration is
dissolved
• Physical methods are not enough – Chemical and biological mechanisms can be
used to capture dissolved fractions
• There are field-tested solutions! – Minnesota Filter (iron-enhanced sand)
phosphorus

http://stormwater.safl.umn.edu/
Stormwater UPDATES Newsletter
Signup at http://stormwater.safl.umn.edu/

http://stormwater.safl.umn.edu/
Photo Courtesy: A. Erickson
For more information, contact:
Andy Erickson ([email protected])


