Removing PFAS from Drinking Water Jonathan Burkhardt a , David Hand b , Thomas Speth a a U.S. Environmental Protection Agency b Michigan Technological University Michigan AWWA Seminar March 25, 2019 Lansing, MI
Transcript
Removing PFAS from Drinking Water
Jonathan Burkhardta, David Handb, Thomas Spetha
a U.S. Environmental Protection Agencyb Michigan Technological University
Michigan AWWA SeminarMarch 25, 2019Lansing, MI
Disclaimer
The views expressed in this presentation are those of the individual authors and do not necessarily reflect the views and policies of the US EPA. Mention of trade names or commercial products does not constitute endorsement or recommendation for use
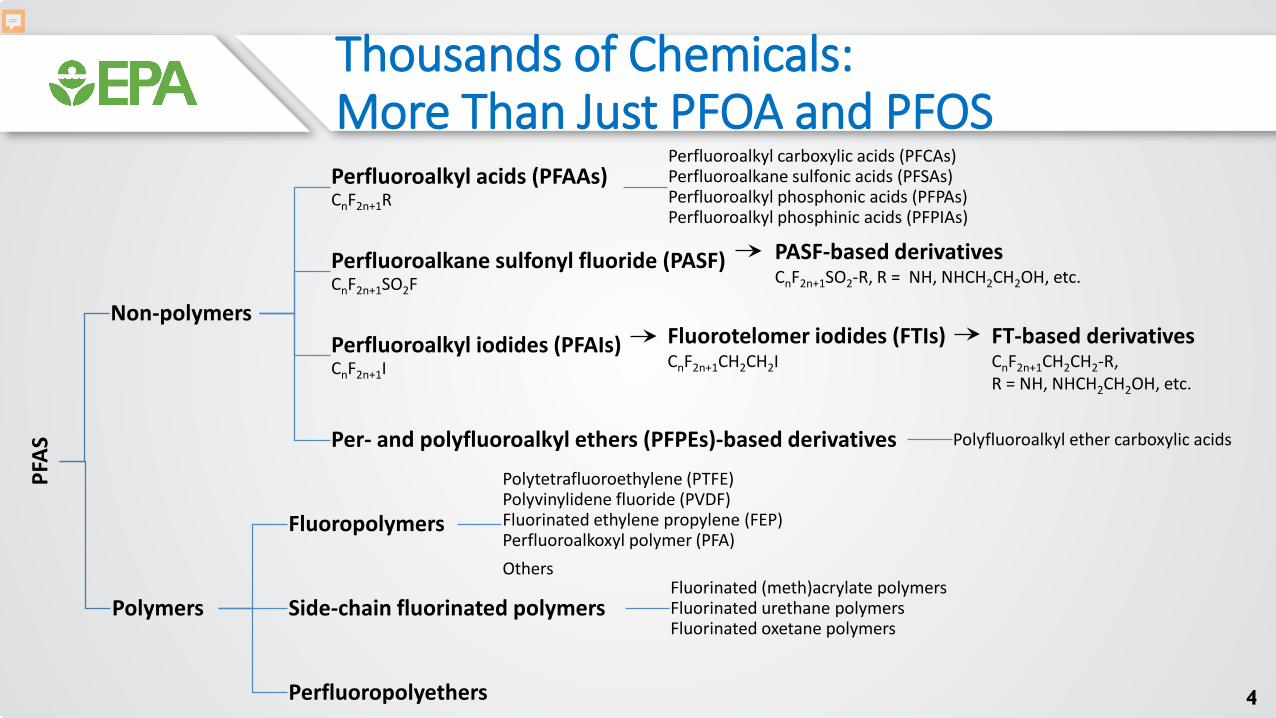
Per- and Polyfluoroalkyl Substances (PFAS)
A class of chemicals• Chains of carbon (C) atoms
surrounded by fluorine (F) atoms Water-repellent
(hydrophobic body) Stable C-F bond
• Some PFAS include oxygen, hydrogen, sulfur and/or nitrogen atoms, creating a polar end.
PFOA = perfluorooctanoic acid – PFCA PFOS = perfluorooctanesulfonate – conjugate base of PFSA “Per” = fully fluorinated “Poly” = many fluorines
Overview: EPA Drinking Water Research
Problem: Utilities lack treatment technology cost data for PFAS removalAction:
• Gather performance and cost data from available sources (DOD, utilities, industry, etc.)• Conduct EPA research on performance of treatment technologies including home
treatment systems• Update EPA’s Treatability Database and Unit Cost Models • Connect EPA’s Treatability Database to EPA’s Unit Cost Models for ease of operation• Model performance and cost, and then extrapolate to other scenarios
• Variable source waters• Variable PFAS concentrations in source water• Different reactivation/disposal options• Document secondary benefits• Address treatment impact on corrosion
• Evaluate reactivation of granular activated carbon Impact: Enable utilities to make informed decisions about cost-effective
treatment strategies for removing PFAS from drinking water5
Presenter
Presentation Notes
Read – similar to other talk
Research: Treatment
Publically Available Drinking-Water Treatability Database
6
• Interactive literature review database that contains over 65 regulated and unregulated contaminants and covers 34 treatment processes commonly employed or known to be effective (thousands of sources assembled on one site)
An example screen shot from the TDB. One can see that for a given contaminant (in this case PFOA – C8), one can click on the treatment technology to get specific data.
Effective Treatments Percent RemovalAnion Exchange Resin (IEX) 90 to 99 High Pressure Membranes 93 to 99Powdered Activated Carbon (PAC) 10 to 97 Granular Activated Carbon (GAC)
Extended Run Time 0 to 26 Designed for PFAS Removal > 89 to > 98
PAC Dose to Achieve50% Removal 16 mg/l90% Removal >50 mg/LDudley et al., 2015
- Effective- Effective- Effective for only select applications
- Ineffective - Effective
Presenter
Presentation Notes
You see the exact same trend for PFOS. Go over data quickly. Ion exchange is slightly more effective, as expected. Because of its data set, its effectiveness, and the general use of GAC to treat PFOA/PFOS; let’s concentrate on GAC. When designing a GAC system, one would concentrate on PFOA because it will break through the bed before PFOS.
Additional Data Needs: Validating Inputs
• Influent concentrations:• PFASs (both removal targets and other PFASs)• Other competing contaminants (sulfate, nitrate)• Influent water characteristics (TOC)
• Study scale (RSSCT, pilot, full-scale)• Type of GAC/resin tested• Definition of breakthrough associated with a given bed life value. For example, does
“breakthrough” mean:• Initial detection (and at what detection limit)• A specified target PFAS concentration (e.g., 70 ppt)• Percent breakthrough (e.g., 10% breakthrough/90% removal)
• Raw data (concentration vs time/bed volumes) are useful
Presenter
Presentation Notes
This slide lists data needs that are not explicit inputs to the WBS models, but are needed to select and justify the model inputs When reporting bed life to breakthrough, it’s important to specify what “breakthrough” means Also, raw data (concentration vs. time) are more useful than just reporting a single point (e.g., “breakthrough occurred at 10,000 bed volumes”) or showing a chart (which can require interpolation)
Additional Data Needs: Validating Cost Outputs
• As-built costs:• Installed equipment cost• System engineering and other indirect cost• Annual operating cost
• The more detail, the better:• Detailed breakdown of cost by line item• Total cost with list of categories included, for example:
o “Equipment includes vessels, piping, valves, instrumentation, concrete pad, buildings”o “Indirect includes engineering, permitting, pilot testing, site work, mobilization”o “Operating cost includes media replacement, labor, electricity”
• Total only
• Associated flow rates, vessel sizes, materials of construction for major components (e.g., stainless steel, fiberglass)
Presenter
Presentation Notes
EPA also needs as-built cost data to benchmark model results, preferably breaking out installed equipment from indirect and operating costs The more detail the better; the list here is in order of preference Design information associated with the costs is also needed
GAC Treatment Cost: PFOA
• Full Scale • 26 min EBCT• Lead-Lag configuration• F600 Calgon carbon• 1.5 m3/min flow• Full automation• POTW residual discharge• Off site regeneration• 70,000 bed volumes to
breakthrough for PFOA
12
Cost of treatment varies on a number of factors including system size
Average Flow (MGD)
0.001 0.01 0.1 1 10 100
Tota
l Cos
t ($/
100
0 ga
llons
trea
ted)
0.1
1.0
10.0
PFOA
Small Systems have higher cost per gallon or person
13
Cost Savings for Small Systems under 1 MGD
Specific Design Modifications for Smaller Systems within the Cost Model
(Considers flows under 1 MGD)
Construction issues (building) Residual handling flexibility Reduced spacing between vessels Smaller and no redundant vessels Reduced instrumentation No booster pumps No backwash pumps Reduced concrete pad thickness Reduced indirect costs
Presenter
Presentation Notes
Exhibit 3‑6. Variant Design Inputs and Assumptions for Small Systems Small System Design Modification For GAC, Ion exchange, Biotreatment, Air Stripping Laid out in specific design equation, input, component selection, critical design, or indirect assumption sheet Construction�Prefabricated pressure vessels instead of gravity Very small systems: 4th building type – pre-fabricated <500 500ft (can’t use it for Cl2) Residual handling flexibility Septic system option, in-ground septic tanks (adsorptive media and ion exchange) Reduced spacing between vessels and other equipment This assumption simulates skid placement of treatment vessels (and of pumps, if included in the design), resulting in reduced system footprint and, therefore, reduced costs for interconnecting piping, building structures, certain indirect costs and O&M. Example: service space is ½ diameter instead of 1 diameter. Smaller and no redundant vessels (but a minimum of two operating vessels) Small systems typically do not include redundant treatment vessels because they are designed to operate at reduced capacity during the brief periods when one vessel is not operating (e.g., during backwash). Example: Fluidized bed: Freeboard 4 foot instead of 7 foot for bed expansion Reduced instrumentation requirements Instrumentation required for small systems is limited to flow meters, high/low alarms, turbidity meters (in gravity systems) and sampling ports. Example: Simplified system controls for automated systems Package plants, when automated, typically are controlled by a single, pre-programmed operator interface unit mounted on the skid. Therefore, for small systems, the model uses this type of operator interface only and excludes the multiple programmable logic controllers, computer workstations, printers, operator interface software and plant intelligence software included for large, automated, custom-engineered systems. Example: No stand-alone office space instead of 100 ft2/employee. No PLC programming or data collection softwater No booster pumps Small GAC systems result in limited head loss and typically do not require additional booster pumps. No backwash pumps or tanks Small systems typically use existing pumps and water supplies and do not require separate backwash pumps or backwash water storage. Reduced concrete pad thickness Small capacity systems require less structural support. Example: 6 inch pad instead of 1 foot. Reduced indirect costs Package plants require less effort to design and install. Therefore, the model reduces or eliminates certain indirect costs (e.g., mobilization/demobilization, construction management) for small package plants (see Appendix D for complete details).
14
GAC Treatment Cost: PFOA, TCE, 11 DCA
Average Flow (MGD)
0.001 0.01 0.1 1 10 100
Tota
l Cos
t ($/
100
0 ga
llons
trea
ted)
0.1
1.0
10.0
PFOA CostTrichloroethene
1,1- Dichloroethane
Weaker adsorbing compounds have higher costs
GAC can cost-effectively remove PFOA/PFOS
EPA will be evaluating additional water qualities and designs
1.5 m3/min flow•F600 Calgon carbon•Lead-Lag configuration•26 min EBCT•Full Scale •
Full automation•POTW residual discharge•
•• 135,000, 70,000, and
11,000 bed volumes to breakthrough for TCE, PFOA, and 11DCA, respectively.
Off site regeneration
Presenter
Presentation Notes
To demonstrate this, the costs are compared to TCE (which has a similar Freundlich K value to PFOA). TCE is known to be cost effectively removed by GAC. 11DCA is also shown. 11DCA, like cis1,2 DCE, is known to be a contaminant that is on the boundary of cost effectiveness. From the plot you can see that the cost of PFOA treatment is less than 11 DCA. At low flows, costs becomes less sensitive to treatment capacity. TCE: 2,000 ug/g (L/ug)1/n PFOA: 1,600 ug/g (L/ug)1/n 11DCA: 65 ug/g (L/ug)1/n PFOS: 2,300 ug/g (L/ug)1/n
Modeling to Consistent Design Parameters
• Fitting Pilot-/Full-scale Data • Predicting Results for Consistent Design
• Allows for comparison across technologies by cost
• Allows for Predicting other Scenarios• Other designs: number of contactors,
contactor EBCTs, different treatment goals, etc.
• Other influent conditions: Changing concentrations of PFAS or background constituents, changing demand, etc.
Presenter
Presentation Notes
EPA also needs as-built cost data to benchmark model results, preferably breaking out installed equipment from indirect and operating costs The more detail the better; the list here is in order of preference Design information associated with the costs is also needed
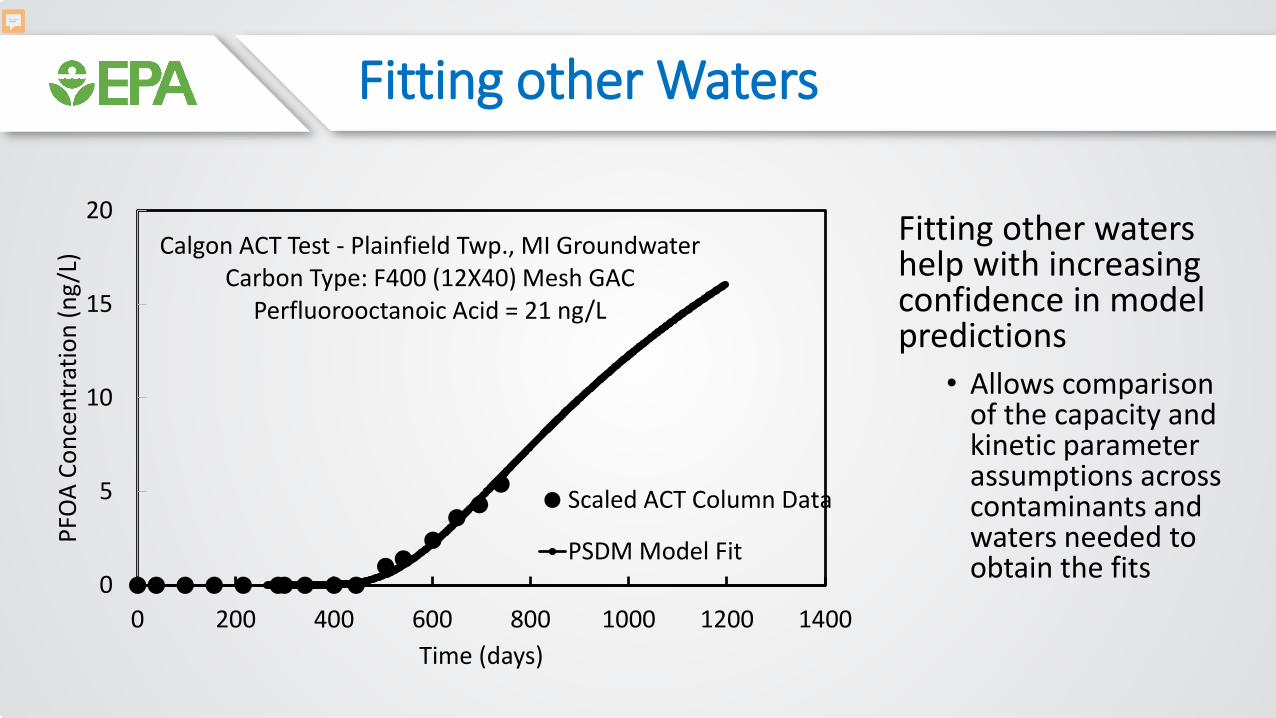
Fitting other Waters
Fitting other waters help with increasing confidence in model predictions
• Allows comparison of the capacity and kinetic parameter assumptions across contaminants and waters needed to obtain the fits0
5
10
15
20
0 200 400 600 800 1000 1200 1400
PFO
A Co
ncen
trat
ion
(ng/
L)
Time (days)
Calgon ACT Test - Plainfield Twp., MI GroundwaterCarbon Type: F400 (12X40) Mesh GAC
Perfluorooctanoic Acid = 21 ng/L
Scaled ACT Column Data
PSDM Model Fit
Presenter
Presentation Notes
EPA also needs as-built cost data to benchmark model results, preferably breaking out installed equipment from indirect and operating costs The more detail the better; the list here is in order of preference Design information associated with the costs is also needed
Fitting other Waters
Fitting other waters help with increasing confidence in model predictions
• Allows comparison of the capacity and kinetic parameter assumptions across contaminants and waters needed to obtain the fits
0
0.5
1
1.5
2
2.5
3
3.5
0 200 400 600 800 1000
PFO
S Co
ncen
trat
ion
(ng/
L)
Time (days)
Calgon ACT Test - Plainfield Twp., MI GroundwaterCarbon Type: F400 (12X40) Mesh GACPerfluorooctanesulfonic Acid = 18 ng/L
Scaled ACT Column Data
PFOS Model Fit
Presenter
Presentation Notes
EPA also needs as-built cost data to benchmark model results, preferably breaking out installed equipment from indirect and operating costs The more detail the better; the list here is in order of preference Design information associated with the costs is also needed
Predictions Allow for Design Evaluation
Example: EBCT Choice• Can evaluate EBCT for
various PFAS for different conditions such as influent concentration, effluent goal, etc.
0
50
100
150
200
250
0 5 10 15 20
Spec
ific
Thro
ughp
ut (m
^3/k
g)
EBCT (minutes)
Relationship Between Specific Throughput and EBCT
PFOA
PFOS
PFBS
PFHpA
PFHxA
PFPeA
PFBA
Co = 10 ng/L, Cto = 2 ng/L
Presenter
Presentation Notes
EPA also needs as-built cost data to benchmark model results, preferably breaking out installed equipment from indirect and operating costs The more detail the better; the list here is in order of preference Design information associated with the costs is also needed
Predictions Allow for Design Evaluation
Example: EBCT Choice• Can evaluate EBCT for
various PFAS for different conditions such as influent concentration, effluent goal, etc.
0
20
40
60
80
100
120
0 5 10 15 20
Spec
ific
Thro
ughp
ut (m
^3/k
g)
EBCT (minutes)
Relationship Between Specific Throughput and EBCT
PFOA
PFOS
PFBS
PFHpA
PFHxA
PFPeA
PFBA
Co = 100 ng/L, Cto = 2 ng/L
Presenter
Presentation Notes
EPA also needs as-built cost data to benchmark model results, preferably breaking out installed equipment from indirect and operating costs The more detail the better; the list here is in order of preference Design information associated with the costs is also needed
Work Breakdown Structure Approach?
• A treatment technology is broken down into discrete components that can be measured for the purpose of estimating costs. The components include specific equipment (e.g., tanks, vessels, pipes, and instruments) and other identifiable cost elements such as annual expenditures on labor, chemicals, and energy.
# For POU/POE search: EPA small system compliance helphttp://water.epa.gov/type/drink/pws/smallsystems/compliancehelp.cfm
Presenter
Presentation Notes
There are 37 different cost models – some for main treatment processes and others for add-on pre- and post-treatment processes. Most of the models exist in draft form and several of the main treatment process models have undergone peer review. Multi-state bubble aeration, packed tower aeration, and GAC models have been uploaded to EPA’s website. The anion exchange, biological treatment, and non-treatment models are finished and are waiting to be uploaded. Here is the link. You can find it by Googling EPA WBS.
EPA will be evaluating additional water qualities and designs
• Full Scale • 26 min EBCT• Lead-Lag configuration• F600 Calgon carbon• 1.5 m3/min flow• Full automation• POTW residual discharge• Off site regeneration• 135,000, 70,000, and
11,000 bed volumes to breakthrough for TCE, PFOA, and 11DCA, respectively.
Presenter
Presentation Notes
To demonstrate this, the costs are compared to TCE (which has a similar Freundlich K value to PFOA). TCE is known to be cost effectively removed by GAC. 11DCA is also shown. 11DCA, like cis1,2 DCE, is known to be a contaminant that is on the boundary of cost effectiveness. From the plot you can see that the cost of PFOA treatment is less than 11 DCA. At low flows, costs becomes less sensitive to treatment capacity. TCE: 2,000 ug/g (L/ug)1/n PFOA: 1,600 ug/g (L/ug)1/n 11DCA: 65 ug/g (L/ug)1/n PFOS: 2,300 ug/g (L/ug)1/n
Costs for Additional PFAS
• Pilot Scale Performance Data
• 20 min EBCT• F400 Calgon carbon• Full automation• POTW residual discharge• Off site regeneration• 31,000, 7,100, and 5,560
bed volumes to breakthrough for PFOA, Gen-X, and 11-DCA, respectively.
Average Flow (MGD)0.01 0.1 1 10 100
Tota
l Ann
ualiz
ed C
ost (
$/yr
)
104
105
106
107
108
PFOA1,1-Dichloroethane
GAC can economically remove PFOA and PFOS
Presenter
Presentation Notes
Here are results from several example scenarios comparing different PFAS compounds Bed life assumptions for the two short chain compounds and Gen X are from Cape Fear Pilot data. The short chain PFCA is PFPeA (C5), the short chain PFS is PFBS (C4-S) Bed life assumptions for PFOA and PFOS are adapted from RSSCT tests published in JAWWA They all correspond to using 2 vessels in series with a total 20 minute EBCT (10 minutes per vessel), changing the GAC in the lead vessel (and lag becoming lead) when 10% breakthrough occurs from the lag vessel (i.e., maintaining 90% removal) The discontinuity at 1 MGD results from the shift from package plants for small systems to fully engineered processes for larger systems The jump between 0.6 and 0.8 MGD results from adding spent backwash holding tanks for larger systems
Cost for Additional PFAS
• Pilot Scale Performance Data
• 20 min EBCT• F400 Calgon carbon• Full automation• POTW residual discharge• Off site regeneration• 31,000, 7,100, and 5,560
bed volumes to breakthrough for PFOA, Gen-X, and 11-DCA, respectively.
Average Flow (MGD)0.01 0.1 1 10 100
Tota
l Ann
ualiz
ed C
ost (
$/yr
)
104
105
106
107
108
PFOA1,1-DichloroethaneGen-X
Weaker adsorbing compounds like Gen-X have higher costs
GAC can economically remove PFOA and PFOS
Presenter
Presentation Notes
Here are results from several example scenarios comparing different PFAS compounds Bed life assumptions for the two short chain compounds and Gen X are from Cape Fear Pilot data. The short chain PFCA is PFPeA (C5), the short chain PFS is PFBS (C4-S) Bed life assumptions for PFOA and PFOS are adapted from RSSCT tests published in JAWWA They all correspond to using 2 vessels in series with a total 20 minute EBCT (10 minutes per vessel), changing the GAC in the lead vessel (and lag becoming lead) when 10% breakthrough occurs from the lag vessel (i.e., maintaining 90% removal) The discontinuity at 1 MGD results from the shift from package plants for small systems to fully engineered processes for larger systems The jump between 0.6 and 0.8 MGD results from adding spent backwash holding tanks for larger systems
Cost for Additional PFASCompounds will have a range of costs depending on water quality and other factors
• Pilot Scale Performance Data
• 20 min EBCT• F400 Calgon carbon• Full automation• POTW residual discharge• Off site regeneration• 31,000, 7,100, and 5,560
bed volumes to breakthrough for PFOA, Gen-X, and 11-DCA, respectively.
Average Flow (MGD)0.01 0.1 1 10 100
Tota
l Ann
ualiz
ed C
ost (
$/yr
)
104
105
106
107
108
PFOA1,1-DichloroethaneGen-X
Presenter
Presentation Notes
Here are results from several example scenarios comparing different PFAS compounds Bed life assumptions for the two short chain compounds and Gen X are from Cape Fear Pilot data. The short chain PFCA is PFPeA (C5), the short chain PFS is PFBS (C4-S) Bed life assumptions for PFOA and PFOS are adapted from RSSCT tests published in JAWWA They all correspond to using 2 vessels in series with a total 20 minute EBCT (10 minutes per vessel), changing the GAC in the lead vessel (and lag becoming lead) when 10% breakthrough occurs from the lag vessel (i.e., maintaining 90% removal) The discontinuity at 1 MGD results from the shift from package plants for small systems to fully engineered processes for larger systems The jump between 0.6 and 0.8 MGD results from adding spent backwash holding tanks for larger systems
28
Advantages of Select TreatmentsGranular Activated Carbon Most studied technology(GAC) Will remove 100% of the contaminants, for a time
Good capacity for some PFASWill remove a significant number of disinfection byproduct precursorsWill help with maintaining disinfectant residualsWill remove many co-contaminants Likely positive impact on corrosion (lead, copper, iron)
Anion Exchange Resin Will remove 100% of the contaminants, for a time(PFAS selective) High capacity for some PFAS
Smaller beds compared to GAC Can remove select co-contaminants
High Pressure Membranes High PFAS rejection Will remove many co-contaminantsWill remove a significant number of disinfection byproduct precursorsWill help with maintaining disinfectant residuals
Presenter
Presentation Notes
Advantages of the treatments
29
Issues to Consider
Granular Activated Carbon GAC run time for short-chained PFAS (shorter run time)(GAC) Potential overshoot of poor adsorbing PFAS if not designed correctly
Reactivation/removal frequencyDisposal or reactivation of spent carbon
EPA is evaluating these issues to document where and when they will be an issue
Disposal of resin Unclear secondary benefits
(PFAS selective) Overshoot of poor adsorbing PFAS if not designed correctlyAnion Exchange Resin Run time for select PFAS (shorter run time)
Membrane foulingHigh Pressure Membranes Capital and operations costs
Corrosion controlLack of options for concentrate stream treatment or disposal
Presenter
Presentation Notes
Potential problems with the technologies
30
Drinking Water Goals
For utilities that have PFAS in their source water at concentrations of health concernEliminate source of PFAS to the source water1)
2) Either choose a new source of water or choose a technology, design, and operational scheme that will reduce PFAS to safe levels at the lowest possible cost in a robust, reliable, and sustainable manner that avoids unintended consequences
Issues to address (not inclusive)1) Capital and operating costs are affordable2) Staff can handle operational scheme over the long term3) Technology can operate long term under a reasonable maintenance program4)
Any waste stream generated can be treated or disposed in a sustainable and cost-effective manner over the long term
Technology and treatment train can handle source water quality changes5)
Presenter
Presentation Notes
. Overall Goals for DW treatment
Avoiding Unintended Consequences
31
Choice of technology, design, and operations can lead to… 1) Negative impacts on the performance of the rest of the treatment system for other parameters
(e.g., decreased control of particulates/pathogens, taste & odor compounds, other source water contaminants)
2) Negative impacts on the distribution system (e.g., increased lead, copper, or iron corrosion; disinfection residual maintenance difficulties)
EPA is conducting research on optimizing PFAS treatment
Presenter
Presentation Notes
Unintended consequences
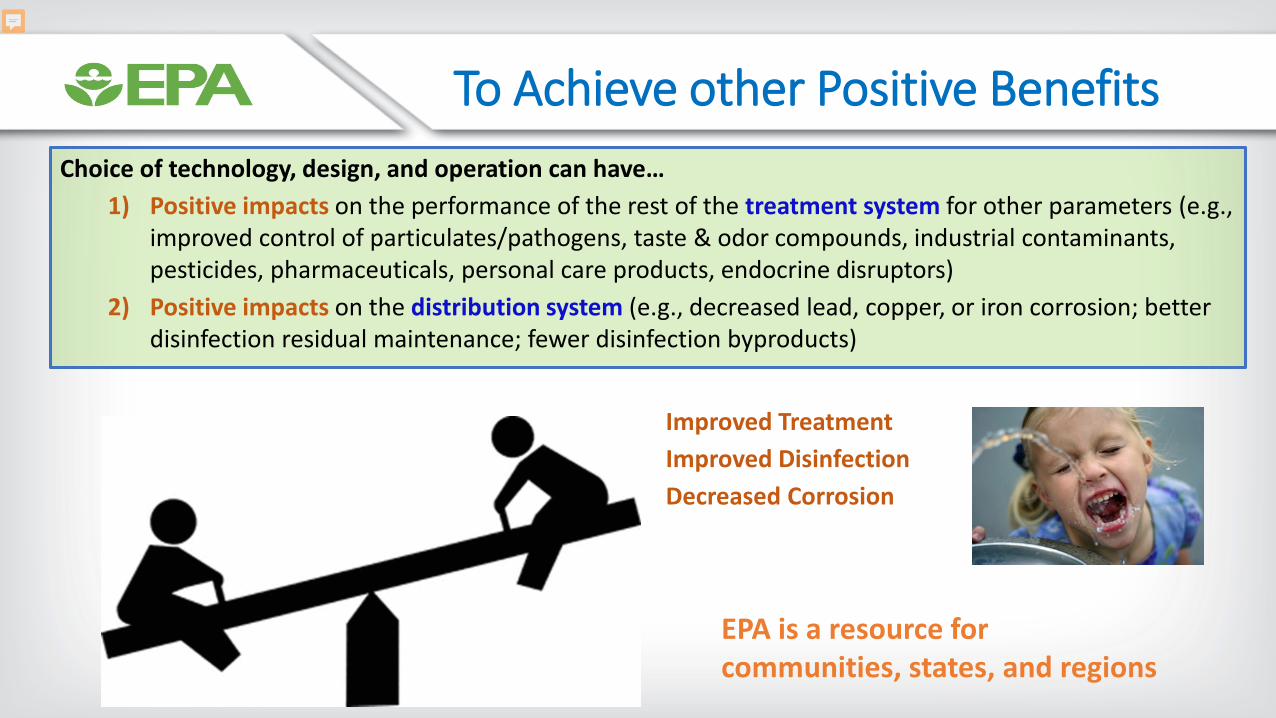
To Achieve other Positive BenefitsChoice of technology, design, and operation can have…
1) Positive impacts on the performance of the rest of the treatment system for other parameters (e.g., improved control of particulates/pathogens, taste & odor compounds, industrial contaminants, pesticides, pharmaceuticals, personal care products, endocrine disruptors)
2) Positive impacts on the distribution system (e.g., decreased lead, copper, or iron corrosion; better disinfection residual maintenance; fewer disinfection byproducts)