J. Int. Environmental Application & Science, Vol. 7 (1): 114-127 (2012) 114 Renewable Energies and Their Subsidies in Turkey and some EU countries- Germany as a Special Example Durmuş Kaya 1,∗ , Fatma Çanka Kılıç 2 1 Karabük University, Department of Energy and Environment Technology, Karabük, Turkey; 2 Kocaeli University, Kocaeli MYO, Department of Air Conditioning and Refrigeration Technology, Kocaeli, Turkey Received November 28, 2011; Accepted February 08, 2012 Abstract: With the technological developments and growing population in today’s world, energy need is increasing rapidly. Addition to this, depending energy importation, environmental pollution, global warming and high production costs of fossil fuels are forced nations to find new effective solutions such energy problems. Therefore, it is necessary to product clean and miscellaneous energies for economic growth, sustainable development and environmental enhancement. Renewable energy resources are the real solutions for these objectives. They let us to generate clean, inexpensive and abundant energy. This point on, countries are gathering their scientists, decision makers, business leaders, environmentalists, and all participants to improve existing productions and develop new technologies. Also, the governments give huge amounts of incentives for renewable energy productions to have clean energies and attract new investments. In this study, the importance of renewable energy usage, recent incentives, renewable energy policies in Turkey and some EU countries are investigated, generally. Germany has been chosen and examined as a special example. It is aimed to make contribution of future developments for these clean energies in Turkey. In this regard, some barriers and recommendations are submitted. Keywords: Renewable energy, Renewable energy resources, Renewable energy policies, Renewable energy incentives, Turkey, EU, Germany ∗ Corresponding: e-mail: [email protected]; Tel: +90 370 433 20 21, Fax: +90 370 433 32 90
Renewable Energies and Their Subsidies in Turkey and some EU countries-Germany as a Special Example
Durmuş Kaya1,∗, Fatma Çanka Kılıç2
1Karabük University, Department of Energy and Environment Technology, Karabük, Turkey; 2Kocaeli
University, Kocaeli MYO, Department of Air Conditioning and Refrigeration Technology, Kocaeli, Turkey
Received November 28, 2011; Accepted February 08, 2012 Abstract: With the technological developments and growing population in today’s world, energy need is increasing rapidly. Addition to this, depending energy importation, environmental pollution, global warming and high production costs of fossil fuels are forced nations to find new effective solutions such energy problems. Therefore, it is necessary to product clean and miscellaneous energies for economic growth, sustainable development and environmental enhancement. Renewable energy resources are the real solutions for these objectives. They let us to generate clean, inexpensive and abundant energy. This point on, countries are gathering their scientists, decision makers, business leaders, environmentalists, and all participants to improve existing productions and develop new technologies. Also, the governments give huge amounts of incentives for renewable energy productions to have clean energies and attract new investments. In this study, the importance of renewable energy usage, recent incentives, renewable energy policies in Turkey and some EU countries are investigated, generally. Germany has been chosen and examined as a special example. It is aimed to make contribution of future developments for these clean energies in Turkey. In this regard, some barriers and recommendations are submitted. Keywords: Renewable energy, Renewable energy resources, Renewable energy policies, Renewable energy incentives, Turkey, EU, Germany
Introduction Turkey is the 17th largest economy of the World (IEA Turkey, 2009). Turkey’s economy has
been developing strongly for the last decade. This fast industrialization, growing demand and urbanization require more energy production. The demand for electric energy in Turkey expected to be 580 billion kWh by the year 2020 (Bilgen et al., 2008).Turkey mostly uses imported energy which costs very high for its economy. Thus, different types of renewable energies are seen as effective solutions for Turkey’s energy problems and its sustainable development. Turkey has many renewable energy sources for extensive energy production and use. The country’s main renewable energy resources are hydroelectric, solar, wind, biomass, and geothermal energy (Çanka Kılıç, 2011).While hydro power accounts for most of the total renewable energy supply in Turkey; biomass increasingly has a good share in last few years. As for solar, geothermal and wind energy, they are expected to increase for near future (IEA Turkey, 2009).
Turkey is dependable primary energy consumes, such as oil, lignite, hard coal, and natural gas. This dependency is around 72% of total energy, at the end of 2009. Oil and natural gas have the biggest shares of imported energy. Total net imports in 2008 were 70.57 Mtoe, and it is expected as 151.76 Mtoe in 2020. Also total energy supply in 2008 was 98.55 TPES (total primary energy supply) and it is expected as 217.75 TPES in 2020 (IEA Turkey, 2009).
These numbers can demonstrate that Turkey must reduce the numbers of the energy importation bills. For this, it requires inexpensive, permanent, reliable and sustainable energy solutions like renewable energies. Also, Turkey should improve energy policies, strategies, and programs. To take right steps for the country’s clean energy development, there is also a point to pay importance as acquisition of knowledge in renewable energies and their technologies (Çiçek, 2009).
Turkey needs important investments in renewable energies, particularly in the electricity generation. This requirement is not only for its people’s welfare, but also for the continuation of its rapid economic growth. To attract new investments, energy production from renewable energies is supported by the government. At the end of 2010, the Turkish Government has enacted a new law that designs the new incentives for renewable energy productions (TOJ, 2010). With this new law, Turkey plans to increase energy production from alternative energy sources and make more emphasize to energy plans which are effective and applicable ones (Çanka Kılıç et al., 2007).
In this study, the evaluation of renewable energy and the importance of renewable energy use, the new incentives for renewable energy production, the renewable energy policies in Turkey and some EU countries are investigated and compared. Germany is examined as an example in the renewable energy production and their usage. In this regard, some barriers and recommendations are submitted for better understanding about the importance of the topic. Current and next energy status of Turkey
In Turkey, electricity is mostly produced in thermal power plants (TPPs) by consuming coal, lignite, natural gas, fuel oil. The production of electricity from renewable has small amount. As for nuclear power, it is new and very limited. But, Russia and Turkey signed a $20 billion agreement in May 2010 for the construction of a four-reactor power plant near the coastal city of Mersin (in Akkuyu). Although there are too many opposite ideas and environmental organizations’ reactions to nuclear energy, Turkey wants to launch the nuclear power industry to diversify its energy mix and supply its soaring demand (Rferl.org, 2011). The demand for electricity is rising at a ratio of 8-10% annually in Turkey. That means, Turkey will need extra 5 billion US Dollars per year for investment of power generation, transmission and distribution by the year 2020. The Turkish Government encourages domestic and foreign private sectors to carry out the country’s power generation projects on a built operate transfer basis (Demirbaş et al., 2004).
For having the general point of view, it can be seen present and future total energy production and consumption in Turkey, in Table 1.a) and b), in turn. As it is shown in the tables, the total energy productions in Turkey are expected to be 58.20 Mtoe and 71.68 Mtoe by the years 2020 and 2030, respectively. On the other hand, total energy consumptions are expected to be 279.18 Mtoe and 463.24 Mtoe by the years 2020 and 2030, respectively. Turkey has large coal reserves and hopes to multiply their use over the next decade to provide electricity. Also, Turkey has been reforming tariffs in energy to increase energy production and competitions in energy since 2001 (Koyun, 2007).
Table 1. (a) Present and future (estimated) total energy production in Turkey (Mtoe) (Koyun, 2007) Energy Sources 1990 2000 2005 2010 2020 2030 Coal and Lignite 12.41 13.29 20.69 26.15 32.36 35.13 Oil 3.61 2.73 1.66 1.13 0.49 0.17 N. Gas 0.18 0.53 0.16 0.17 0.14 0.10 Com. Renewables and Wastes* 7.21 6.56 5.33 4.42 3.93 3.75 Nuclear - - - - 7.30 14.60 Hydropower 1.99 2.66 4.16 5.34 10.00 10.00 Geothermal 0.43 0.68 0.70 0.98 1.71 3.64 Solar/Wind/Other 0.03 0.27 0.22 1.05 2.27 4.28 Total energy production 25.86 26.71 34.12 39.22 58.20 71.68
*Comprises solid biomass, biogas, industrial waste and municipal waste. Table 1. (b) Present and future (estimated) total energy consumption in Turkey (Mtoe) (Koyun, 2007)
Energy Sources 1990 2000 2005 2010 2020 2030 Coal and Lignite 16.94 23.32 35.46 39.70 107.57 198.34 Oil 23.61 31.08 40.01 51.17 71.89 102.38 N. Gas 2.86 12.63 42.21 49.58 74.51 126.25 Com. Renewables and Wastes* 7.21 6.56 5.33 4.42 3.93 3.75 Nuclear - - - - 7.30 14.60 Hydropower 1.99 2.66 4.16 5.34 10.00 10.00 Geothermal 0.43 0.68 1.89 0.97 1.71 3.64 Solar/Wind/Other 0.03 0.27 0.22 1.05 2.27 4.28 Total energy consumption 53.01 77.49 129.63 152.22 279.18 463.24 *Comprises solid biomass, biogas, industrial waste and municipal waste.
Table 2 (Çanka Kılıç, 2011) shows renewable energy potential in Turkey; including energy type,
usage purpose, natural capacity, technical and economical values. Renewable sources represent the second-largest domestic energy source after coal in Turkey. As aforementioned, main renewable energy resources in Turkey are: hydro, biomass, wind, geothermal and solar. Hydropower has the biggest part of all. The Ministry of Energy and Natural Resources has declared recently that while Turkey’s installed power of the hydraulic power in 2002 was 12241 MW, it has now reached the number 16937 MW as of at the end of October 2011, with the increase of 39%. Total installed power capacity of the power plants that commissioned to produce electricity from renewable energy sources is 1554 MW and hydraulic power share of this amount is 1211,3 MW at the end of October 2011 (MENR, 2011).
Table 2. Renewable energy potential in Turkey (Çanka Kılıç, 2011)
Energy type Usage purpose Natural capacity Technical Economical Solar energy Electric (billion kWh)
Thermal (Mtoe) 977.000 80.000
6.105 500
305 25
Hydropower Electric (billion kWh) 430 215 124.5 400 110 50
- 180 - Wind Direct energy-land Direct energy-off shore Wave energy
Electric (billion kWh) Electric (billion kWh) (billion kWh) 150 18 -
Geothermal energy Electric (109 kWh) Thermal (Mtoe)
- 31.500
- 7.500
1.4 2.843
Biomass energy Total (Mtoe) 120 50 32 Turkey’s renewable energy potential can be seen as a great opportunity from an economic,
environmental and national security perspective (Çanka Kılıç, March 2011). Turkey’s dependency on foreign resources for heating and electricity should be lessened. Developing and using domestic alternative energy resources enhances the country’s geopolitical safety. Moreover, renewable energy resources encourage economic growth (Greenbuildest, 2010).
One of the rising renewable energy supplies in Turkey is biomass. Total renewable energy supply declined from 1990 to 2004, due to a decrease in biomass supply (Özyurt, 2010). But it has been taken some important steps in biomass and biogas production. For example, in Kocaeli, Metropolitan Municipality, TÜBİTAK MRC as a researcher institution and four universities have
began the project “Biogas generation from vegetal and animal wastes and usage in integrated energy generation facilities”, established in Izaydas area. The construction of the facility was started on April 14th, 2007 and now is commissioned in 2011 to begin biogas production (Biyogaz, 2011).
In recent years, the composition of renewable energy supply has changed with the wind power increases its market share. For example, Installed power of wind power was almost unavailable in 2002, which was 18.9 MW, now it has reached to 1600 MW, and also the wind electrical energy production is 325 MW as of at the end of October 2011 in Turkey (MENR, 2011).
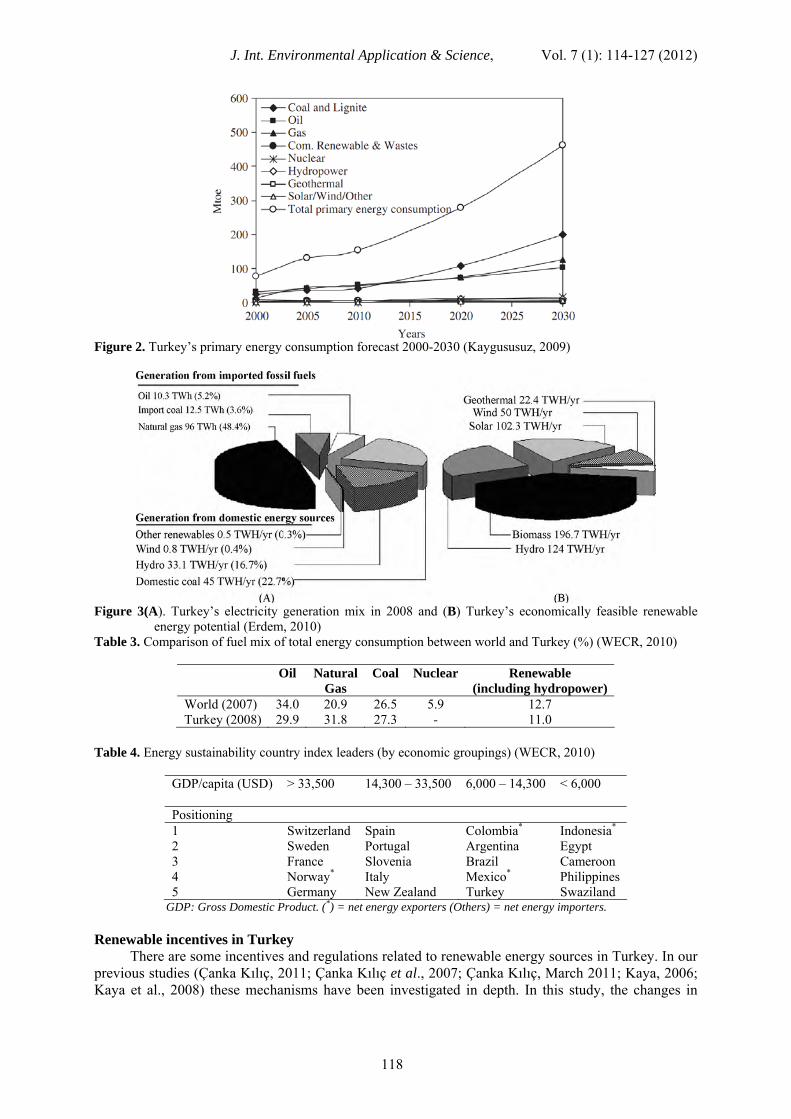
Turkey is one of the leading countries in terms of potential for geothermal energy applications, but it has been relatively late for this renewable energy production and use, compared to the rest of the world. Yet, it is seen some important improvements in geothermal sector in the last few years, for example electricity generation from geothermal resources in Turkey is expecting to reach 550 MW (4 Billion kWh/year) by the year 2013 (Haklıdır, 2008). Turkey’s main geothermal areas are in Marmara and Aegean regions especially in Denizli, Yalova, Aydın, Çanakkale, Bursa, Kütahya, Balıkesir, Manisa and İzmir. Turkey’s primary energy production forecast 2000-2030 (Kaygususuz, 2009). As to give another perspective of energy in Turkey, Figure 1 shows domestic energy production forecast 2000-2030 [16]. The government forecasts both oil and gas production to decline owing to depletion of resources but coal production (mainly lignite) and renewable energy production to increase (see also Figure 2). It can also be seen in Table 3, the largest share of the country’s total energy consumption comes from natural gas (31.8%), followed by oil (29.9%) and coal (27.3%). Renewable energy sources (with the exception of hydro) are currently small fractions of Turkey’s energy supply (Erdem, 2010). Figures 3 (A) and (B) shows Turkey’s electricity generation mix in 2008 and economically feasible renewable energy potential, respectively.
Turkey has progressed greatly in all areas of energy policy since the 2005 and there are obvious signs of a better future balance in energy policy goals (IEA Turkey, 2009). Energy sustainability country index leaders by economic groupings can be seen in Table 4 (WECR, 2010). Turkey has a powerhouse economy as growing at over 5% yearly. Considering geographic advantages, Turkey is perfectly positioned to benefit from renewables in a strong rate that would drive the country’s very fast development in renewable energy production. Also, with the help and encouragement of grant aids programs in Turkey (Demirbaş, 2011) energy from renewable resources is supported by regional development agencies. Moreover, the country is well positioned to supply The European Grid.
Figure 1. Turkey’s primary energy production forecast 2000-2030 (Kaygususuz, 2009)
2 Sweden Portugal Argentina Egypt 3 France Slovenia Brazil Cameroon 4 Norway* Italy Mexico* Philippines 5 Germany New Zealand Turkey Swaziland
GDP: Gross Domestic Product. (*) = net energy exporters (Others) = net energy importers. Renewable incentives in Turkey
There are some incentives and regulations related to renewable energy sources in Turkey. In our previous studies (Çanka Kılıç, 2011; Çanka Kılıç et al., 2007; Çanka Kılıç, March 2011; Kaya, 2006; Kaya et al., 2008) these mechanisms have been investigated in depth. In this study, the changes in
incentives according to the law of energy production from renewable have been examined. The detail of this regulation is given below in the sub topic. Incentives for renewable energy in Turkey
At the end of 2010 Turkish Grand National Assembly (TBMM) passed a new renewable energy bill determining regulations and feed-in tariffs in the renewable energy sector (Çanka Kılıç, 2011). Under the law, producers of renewable energy who started operation between May 18, 2005 and December 31, 2015 is guaranteed power purchase prices for a period of ten years. Wind and hydroelectric power is bought at USD 0.073 per kilowatt-hour (kWh), the price for geothermal energy is defined at USD 0.105 per kilowatt-hour (kWh), and biomass, including landfill gas, and solar energy is purchased at USD 0.133 per kilowatt-hour (kWh). Yet, the law limits the solar power capacity eligible for support to 600 MW until December 31, 2013 and entitles the Council of Ministers to determine the capacity after that. According to this new law, the renewable energy production incentives can be seen in Table 5 (TOJ, 2010).
The Council of Ministers is also authorized to determine new purchase prices, which should not exceed the current prices, for facilities established after December 31, 2015. Renewable energy producers that got their operation license before December 31, 2015 are entitled to receive additional subsidy ranging from USD 0.004 to USD 0.035 per kWh for a period of five years if they use locally-produced equipment and technology for their plants, which can be seen in Table 6 (TOJ, 2010). License procedures will be handled by the Energy Market Regulatory Authority (EPDK) in cooperation with the Energy Ministry, Interior Ministry and the State Waterworks Authority (DSI).
Table 5. Renewable energy (Law No:6094) subsidies (TOJ, 2010) The plant type of the generation of energy from renewable resources
The prices that will be applied (USD cent/kWh)
A hydroelectric power plant 7.3 A wind power plant (A wind farm) 7.3 A Geothermal energy plant 10.5 A biomass supplier (including landfill gas ) 13.3 A solar energy plant 13.3
Table 6. Additional support amounts for companies with facilitates that use locally produced equipments and
components (TOJ, 2010) Plant Type Locally produced equipments and components Domestic contribution
supplement (USD cent/kWh)
1.Turbine 1.3 A- Hydroelectric power plant 2.Generator and power electronics 1.0
1.Propeller 0.8 2. Generator and power electronics 1.0 3. Turbine Tower 0.6
B- A wind power plant (A wind farm)
4. Rotor and all mechanical components in the nasel group (the exception of payments made for propeller group with generators and power electronics.)
1.3
1.Integration of PV panels and manufacture of the structural mechanics of the solar PV panels
0.8
2.PV modules 1.3 3. Cells that make up PV modules 3.5 4.Inverter 0.6
C- Facilities of photovoltaic solar panels
5 Beam materials that focusing solar energy on the solar PV module
0.5
1.Radiation pick-up tube 2.4 D-The plants that based on concentrated solar 2.Reflective surface plate 0.6
3.Solar Tracking System 0.6 4.The mechanical parts of the thermal energy storage system
1.3
5.Mechanical parts of the steam production system by collecting the solar beam on the tower
2.4
6. Sterling engine 1.3
power
7. The panel integration and structural mechanics of the solar panel
0.6
1. Fluidized-bed steam boiler 0.8 2. Liquid or gas-fired steam boiler 0.4 3. Gasification and gas cleaning group 0.6 4. Steam or gas turbine 2.0 5. Internal combustion engine, or Stirling engine 0.9 6. Generator and power electronics 0.5
E- Facilities that based on biomass energy
7. Cogeneration system 0.4 1. Steam or gas turbine 1.3 2. Generator and power electronics 0.7
F- Facilities that based on geothermal energy
3. Steam injector or a vacuum compressor 0.7 Renewable energy subsidies in EU
Governments’ energy policies play important roles to augment investments in renewable energies (IEA Turkey, 2008). Increasing incentives, notably feed-in tariffs, direct subsidies, and tax credits can make the risk/revenue view of renewable energy investments more attractive. The proceeds from carbon and energy taxes or from phasing out fossil fuel subsidies could be used to uphold such incentives. As far as project financing is concerned, public finance mechanisms, which can range from simple grants to complex conditional funding structures, can be deployed to support R&D, technology transfer, and skill building. These can complement private capital, particularly in developing countries, or broaden the market for renewable energies. Thus, governments have increasingly been taking action; for early 2010, for example, 85 countries have set national targets for renewable energy, more than half of which are in developing countries like Turkey (UNEP GEP, 2011).
The European Commission in it’s the Directive on renewable energy has set ambitious targets
for all Member States, such that the EU will reach a 20% share of energy from renewable sources by 2020 and a 10% share of renewable energy specifically in the transport sector (EC, 2011). The 2005 share (measured in terms of gross final energy consumption) was 8.5% (9.2% in 2006), and the EU 2020 target is 20% (EC, 2011). In all European countries, production of electricity from renewable resources is supported. In many countries minimum price system is used widely, which requires an electricity utility to purchase a portion of its electricity requirement, called as green energy, at a minimum price defined. Legally defined minimum prices change according to the country; some of them can be seen in Table 7 (Erdoğdu, 2009).
Table 7. Minimum price of renewable electricity in some European countries (Eurocent/kWh) (Erdoğdu, 2009)
Country Price (Eurocent/kWh) Netherlands 9.6-9.9 France 8.4 Austria 7.8 Portugal 7.5-7.9 Greece 6.4 Spain 6.3-7.5 Germany 6.2-8.5 Turkey* 5.0-5.5
* Turkey has changed the prices by new law at the end of in 2010, which is given in Table 5 and Table 6. Renewable Energy Policies, Targets and Subsidies in Germany
Germany has the big importance in Europe on generating renewable energies. The country’s technology has developed rapidly since 1990 largely as a result of energy policies adopted by the German government and the European Union. Germany generates 12.5% of its electricity from
renewable sources (Saidur et al., 2010). Germany is the world’s second largest user of wind power closely after the USA, with an installed capacity of 23,903MW at the end of 2008, just ahead of Spain which had an installed capacity of 16,740MW. Moreover 20,301 wind turbines are located in the German federal area and the country has plans to build more wind turbines.
Germany has supported and encouraged strongly for development of renewable energies and their integration into the existing network for the last two decades. This is particularly the case for wind energy, where Germany had 20.7 GW on shore wind capacities in 2006; in addition about 7 GW are expected to be constructed offshore until 2015 and also a long-term goal of 30 GW offshore is considered for 2030. Currently, the technicalities of the integration of the offshore wind energy are being studied by industry and the government.
Recent data highlights Germany’s success in meeting its goals for renewable energy production. It can be seen in Fig. 4, Germany’s trends in new capacity installed annually for electricity generation from renewable energies for the period 2000–2020 and 2030 (Saidur et al., 2010).
Figure 4. Trends in new capacity installed annually for electricity generation from renewable energies for the
period 2000–2020 and 2030 (Saidur et al., 2010)
The Renewable Energy Sources Act (EEG) has been amended and will start to apply on January the 1st 2012. It arranges a minimum requirement of not less than 35 percent of renewable energy in electricity supply by 2020, not less than 50 percent by 2030 and not less than 65 percent by 2040 and not less than 80 percent by 2050 (Boewe et al., 2011). Nevertheless, the law literally arranges an objective of between 35 and 40 percent of supply in the next ten years. This is in accordance with a set of specifications of Ministry of Environment in 2010. With this new law, Germany has revealed a more striking goal than in the previous law (Boewe et al., 2011).
EEG 2012, comprises a vast number of hydropower renewable energy sources, covering wave energy, tidal energy, salt gradient and flow energy, solar energy, geothermal energy, and wind energy. In addition, the act also directs energy from biomass, including biogas, bio-methane, landfill gas, sewage treatment gas, biodegradable municipal and industrial waste.
Furthermore, the EEG assures that 100 percent of the energy produced from such renewable sources will be fed to public grids at a guaranteed minimum price. The EEG accommodates a particular coverage plan with regard to these energy sources. It provides for the priority procure, transmission and distribution and payment for the whole available amount of electricity generated from renewable energy sources and from mine gas electricity by the grid system operators. The EEG also enforces an equalization plan on Germany’s energy consumers by means of revisions in most of the citizens’ energy feed-in tariffs. Most of these tariffs are dependent on a so named “degression”. That is the tariff to be paid for the next two decades depends on the year in which the facility starts operating. The later this start-up happens, the lower feed in tariff will be apply for the whole two decades. Degressions will have a huge effect on the gainfulness of any energy generation investment. As an example, an onshore wind establishment that begins operating in 2012 will receive 9.41 ct/kWh, while the same establishment beginning operation in 2015 will receive only 8.53 ct/kWh. Offshore
wind parks that function by 2017 will get 15 ct/kWh for a first period of 12 years. Those that start operating in 2019, nevertheless, will get only 12.97 ct/kWh.
There are other tariff elements, such as technology bonus and repowering bonus in EEG 2012. The whole system of feed-in tariffs is quite complex and dependent on many factors that necessitate a determined expertise to comprehend. EEG 2012, encourages early investment to attain its legislative targets: the sooner an operation stars the energy production the more operator will gain the next to decades. As important key procurements of the EEG 2012: • Increasing biomass tariffs nearly 30 percent from €0.11/kWh ($0.16/kWh) to €0.14/kWh
($0.20/kWh) for facilities less than 150 kW in size. • Rising geothermal tariffs more than 50 percent from €0.16/kWh ($0.22/kWh) for small projects to
€0.25/kWh ($0.36/kWh) for entire projects. • Rising offshore wind tariffs 15 percent from €0.13/kWh ($0.19/kWh) to €0.15/kWh ($0.21/kWh). • Rising the "starter" bonus for offshore wind almost 25 percent from €0.15/kWh ($0.21/kWh) to
€0.19/kWh ($0.27/kWh). • Preserving the 2011 degression for solar photovoltaics (solar PV) into 2012. • Preserving the tariffs for wind energy on land, comprising the repowering bonus.
Many measures has been endorsed as part of the energy package by the Federal Cabinet, among which an act amending provisions of energy business legislation, an act on measures to speed up the expansion of the electricity grid and others (IEA IRENA, 2011).
The feed-in tariff arrangement for onshore wind abides unaltered. The first tariff of EUR Cent 8.93/kilowatt-hour (kWh) will be reduced every year for new installations by 1.5 percent, in contrast to one percent in the EEG 2009. Rather than curtailing the payment of the system service bonus, fixed at EUR cent 0.48/kWh for the year 2012, to the end of 2013, it will be paid until end of 2014 for new and until end of 2015 for current plants.
The repowering bonus which is a support the replacement of old turbines by new ones, of EUR Cent 0.5/kWh is limited to wind turbines that were put into operation before the year 2002. For offshore wind, the opening tariff abides at EUR Cent 15/kWh. The tariff for new turbines will not be reduced before the year 2018 (instead of 2015 at the beginning), with a then 7% annual rate of degression (5% at the beginning).
To speed up repayment of investment in offshore wind farms an arbitrary feed-in tariff model was acquainted, which offers an first tariff of EUR Cent 19 /kWh paid for 8 years (standard model: EUR cent 15/kWh for 12 years). Many further corroborating measures outside the EEG are taken to encourage offshore wind energy, among others a committed loan program of the KfW bank.
The tariff form for hydropower is purified and accommodated. First of all, the distinctness between new and modernized plants is forsaken and the feed-in tariff will be paid for two decades and the first remuneration will reduce by one percent yearly. Initial tariffs for hydropower are: EUR Cent 12.7/kWh for a capacity up to 500 kilowatt, EUR Cent 8.3/kWh for up to 2 megawatt (MW), EUR Cent 6.3 ct/kWh for up to 5 MW, EUR Cent 5.5 ct/kWh for up to 10 MW, EUR Cent 5.3 ct/kWh for up to 20 MW, EUR Cent 4.2 ct/kWh for up to 50 MW and EUR Cent 3.4 ct/kWh for over 50 MW.
Comparing to 2009 EEG, the tariffs for biogas have been reduced by 10 to 15 per cent, typically. It should be emphasized that biogas facilities only qualify for remuneration if they consent to basic requirements that at least 60 per cent of the heat produced is used, or the plant is operated using 60 per cent or more of slurry, or the electricity is sold directly. Moreover, electricity from biogas may not be based on more than 60 per cent of maize and grain. The tariff form for biogas is also purified and accommodated, like, having 4 capacity-oriented categories (basic tariff from EUR Cent 6 to 14.3/kWh). Further remuneration is paid depending on the type of biomass used as fuel (from EUR Cent 2.5 to 8/kWh). Small plants on farms that deploy at least 80 per cent slurry receive a remuneration of 25 ct/kWh. Besides, there is a special tariff for waste biomass fermentation facilities. A bonus of EUR Cent 1 to 3/kWh is paid for processing and feed-in of bio-methane. The initial basic tariff reduces by two percent per year, while the fuel-related tariff does not change.
Tariffs for geothermal plants rise from EUR Cent 23 to 25/kWh; initial tariffs reduce by 5 percent annually from 2018. The bonus for use of petro-thermal technology rises from EUR Cent 4 to
5/kWh. The tariff form of the EEG 2009 for photovoltaic plants is unchanged. The tariff may be reduced twice a year depending on the capacity newly built in the previous period: on 1 January tariffs reduce between 1.5 per cent and 24 per cent (basic degression rate of 9 per cent for an additional capacity installed between 2,500 and 3,500 MW). A part of the decrease (0 to 15 per cent) can be predated on 1 July, if capacity expansion exceeds defined threshold values.
Until end of the year 2013, the specific tariff for electricity consumed within the building or site of generation remains unchanged. New free-standing plants on alteration areas in natural reserves and national parks are not eligible for remuneration. To develop grid integration of PV facilities over 100 kW underlie feed-in management, for plants over 30 kW a simplified feed-in management will apply. Smaller plants may also take part in the latter, or alternatively may feed in a maximum of 70 per cent of their installed power. Feed-in tariffs for renewable energy plants according to EEG 2012 in Germany are given in Table 8 (Gipe, 2011). The analysis of current situation in Turkey, EU and Germany’s applications-as an example-
There are many support mechanisms for dissemination of renewable energy usage in Turkey, but the most important and distinctive one has been enacted at the end of December, 2010, which has been given in this study, previously, as Law on Utilization of Renewable Energy Resources for the Purpose of Generating Electrical Energy (TOJ, 2010). This law has long been waited. It has taken so much effort to be realized with some crucial modifications. For example, the most critical change in the tariff is the purchase price. The earlier version was “Euro cents” has changed into “Dollar cents” per kWh as unit prices, but the amount has almost remained the same. This is the main determining factor for the trend of future developments.
Incentive mechanisms and applications in Turkey, EU and Germany are presented above. The following conclusions can be inferred if these two sections are examined carefully, * It can be seen that the unit purchase price of electricity which is generated from renewable energy
sources (RES) are low when compared to EU countries. For example, while purchase price of biogas is approximately 10 EURO cent/kWh in Turkey, it can reach to 20 EURO cent/kWh in Germany, 29 EURO cent/kWh in Italy, 25 EURO cent/kWh in England. This effects affordability of the facility installation and can make difficult to find investment financing.
* The highest tariff purchase in Turkey is 13.3 Dollar cent/kWh (9 Euro cents/kWh), applied to the biomass and the sun. It is 8.5-20.00 Euro cent/kWh for biomass and 40-60.16 Euro cent/kWh for the sun in Germany.
Table 8. Feed-in tariffs for renewable energy plants according to EEG 2012 in Germany (Gipe, 2011)
Tariff Digression Tariff DigressionTechnology category and
Installed Power Years €/kWh Technology category and
Source: http://www.wind-works.org/FeedLaws/TableofRenewableTariffsorFeed-InTariffsWorldwide.html * The implementation of procurement schedule of biomass energy in Turkey is higher than other
resources. The reason is that biomass production facilities have higher local installation potential than other facilities. Moreover, the incentives for biogas mean the indirect incentives for agricultural sector.
* This law in Turkey assures purchase guarantee only for the use of electricity, not for the heat, but in Germany CHP (Combined Heat and Power) applications that using renewable energy resources have additional bonus.
* While guaranteed purchase of electricity in Turkey is 10 years, this period is usually 20 years in EU countries.
* Using domestic products for the installation of the facility is encouraged by this law in Turkey. Renewable energy producers that got their operation license before 31 December 2015 are entitled to receive additional subsidy ranging from USD 0.004 to 0.035 per kWh for a period of five years if they use locally-produced mechanical, electromechanical and other equipment and technology for their plants. This is called “local contribution”.
* The law also limits the total production of licensed solar energy companies to 600MW annually until 31 December 2013, and then authorizes the cabinet to determine the limits afterwards in Turkey.
* The law in Turkey, purchase amounts for the renewable energies are determined by the resource, but the size of plants is not taken into account. In Germany, the small plants have higher incentives. Thus, it is aimed to increase employment.
* Also, there is no distinction made within the resources in Turkey. The situation in Germany is different. For example in Germany, using waste beside the energy vegetables for biogas requires to take additional bonus.
* Although intense discussion has been made for the last decade to disseminate the usage of renewable energy resources in Turkey, there is not much progress can be seen especially in the employment of renewable energies. But, considering the employment in this sector in Germany, the numbers are quite high. For example in 2006 Germany has reached the employment of 235 000 in renewable energy sector, which was 160 500 in 2004 (Kratzat et al., 2007).
* When comparing Germany with Turkey about the number of energy plants and energy production from renewable energy resources, it can be seen that Turkey is by far behind Germany. For example, there are 20 biogas plants in Turkey, while the number is more than 4000 in Germany and they are in operation effectively. This is good number for Germany, considering its future developments in energy production.
* The effect of the use of renewable energy resources is so important to reduce greenhouse gas emissions. According to year 2006 figures in Germany, 101.5 million ton greenhouse gas reduction has been provided from renewable energy facilities. Turkey’s contribution to the reduction of greenhouse gases will be increased only with the expansion of the use of renewable energy resources (FMENCNS, 2009).
* While the Turkish Parliament has approved a new renewable energy law that sets short-term standards, leave much about the renewable energy sector’s long term prospects in the hands of nation’s cabinet.
* It can also be thought that Turkey has great wind and solar energy potential, still needs important improvements.
Conclusion In this study, the evaluation of renewable energy and the importance of renewable energy use, the incentives and subsidies, the renewable energy policies in Turkey and some EU countries are investigated and compared. Germany is examined as an example whit regard to renewable energies, their usage and incentive mechanisms. With this study, the following items were identified or accomplished: 1) Turkey is an energy-importing country. In order to be less dependent on other countries, Turkey
needs to use its sustainable sources. From this point of view, renewable power is a very attractive choice, since it is economical, sustainable, environmental friendly and a familiar energy source in Turkey. Furthermore, Turkey has several advantages for the use of renewable energy in terms of its geographical location. Although there has been an important progress last year in RES exploitation, there are still some barriers such as economic, lack of legislative and regulatory framework and poor infrastructure.
2) According to 2009 year’s statistics Turkey in the tenth position among the 28 IEA countries, for comparison, renewable energy sources account for more than 40% of TPES in Norway which is basically hydropower, and around 1/3 in New Zealand and Sweden. Allowing for the electricity generation, in 2009, renewable sources provided 37.8 TWh of electricity, or 19.6% of the total power generation in Turkey, which is the 12th highest portion among the 28 IEA countries. Hydropower accounted for 95% (35.9 TWh) of this total and wind power for 4% (1.5 TWh). The remaining 1% came from biomass (0.3 TWh) and geothermal energy (0.5 TWh). Hydropower generation varies according to rainfall. The government outlines an overall target for renewable sources to provide at least 30% of electricity generation by the year 2023, in its Electricity Market and Security of Supply Strategy, approved on 18 May 2009 (IEA Turkey, 2009), (Camadan et al. 2011).
3) As for heat, firewood is the largest source of heat from renewable sources in Turkey (Çanka Kılıç, June 2011). In 2008, 5.0 Mtoe of firewood was used for heating in rural areas. Other forms of biomass are negligible. The second-largest source of heat from renewable sources is geothermal, 0.9 Mtoe of which was used in 2008.
4) Turkey’s greenhouse gas emissions are growing rapidly, and the energy sector is the major contributor, the government is therefore focusing on clean energy development, such as from domestic renewable resources. Incentives and the feed in tariffs have led to more investment in renewable energy generation and increased share of renewables in the electricity mix. It can be well known by all the sectors that the incentives can make the influence on starting renewable energies
more rapid than any other policies. By enacting this new law, Turkey offers guarantied prices for power generated from renewable resources and pays more if the producers use locally-made equipment (Çanka Kılıç, 2011).
5) Current levels of investment in renewable energy are still below what is needed to. The major barriers and policy responses may be grouped as:
a) Risks and incentives associated with renewable energy investments, including fiscal policy instruments,
b) Relative costs of renewable energy projects and financing, c) Electricity infrastructure and regulations, d) Sustainability criteria.
6) To achieve the required returns, incentive mechanisms such as feed-in tariffs need to be guaranteed for 15-20 years instead of 10 years.
7) Subsidies need to be judiciously designed and applied. Subsidies will most likely need to be adjusted over time in order to be efficient, and such changes are likely to be opposed by businesses or consumers who benefit from them. Such support also needs to take into account requirements of international agreements, in particular the rules and regulations of the World Trade Organization.
8) EU policy and legislation relevant to renewable energy resources should be more researched and summarized. These policies are believed to be the most developed in the world for this topic, and they serve as a solid base for development of recommendations for Turkish energy policy.
9) The importance of the role of the government in formulating and implementing favourable policies for renewable energy resources exploitation is stressed. It is also important for efficiency and effectiveness that communication and mechanisms for coordination/cooperation between ministries (i.e. energy, agricultural, and environmental) be improved. Successful policymaking and implementation can lead to an ultimately important outcome.
10) Since the private sector has the capacity to mobilize needed funds, development of incentives would motivate the private sector to become more involved in the advancement of renewable energy.
Renewable incentives are very encouraging factors for Turkey to produce more renewable energy, considering the Germany’s success in renewable energies; it should be taken as an example. Disclaimer Although some date taken from governmental document, this paper is not necessarily representative of the views of the government. References Bilgen S, Keles S, Kaygusuz A, Sarı A, Kaygusuz K. (2008) Global warming and renewable energy
sources for sustainable development: A case study in Turkey. Renewable & Sust., Energy Reviews 12, 372–396.
Camadan, E., Erten, İ. E, (2011) An evaluation of the transitional Turkish electricity balancing and settlement market: Lessons for the future. Renewable & Sust. Energy Reviews 15, 1325–1334.
Çanka Kiliç F, (2011) Recent renewable energy developments, studies, incentives in Turkey. Energy Education Science and Technology Part A: Energy Science and Research, 28, 37-54.
Çanka Kılıç F, (2011) Türkiye’deki Yenilenebilir Enerjilerde Mevcut Durum ve Teşviklerindeki Son Gelişmeler. Current renewable energy situation and renewable subsidies in Turkey. March 2011. TMMOB (Turkish Union of Chambers of Mechanical Engineers and Architects) Mühendis ve Makina Dergisi, 52, 103-115.
Çanka Kiliç F, Kaya D, (2007) Energy production, consumption, policies, and recent developments in Turkey. Renewable and Sustainable Energy Reviews. 11: 1312-1320.
Çanka Kılıç, F. (2011) Biyogaz, önemi, genel durumu ve Türkiye’deki yeri. General outlook of biogas, the importance of its usage and biogas in Turkey. June 2011. TMMOB (Turkish Union of Chambers of Mechanical Engineers and Architects) Mühendis ve Makina Dergisi, 52, 94-106.
Çiçek Bezir N, Öztürk M, Özek N, (2009) Renewable energy market conditions and barriers in Turkey. Renewable and Sustainable Energy Reviews, 13, 1428-1436.
Demirbaş A, (2011) Energy issues in energy education. Energy Education Science and Technology Part A; 27:209-220.
Demirbaş A, (2011) High quality water supply for the production of algae. Energy Education Science and Technology Part A; 27:467-476.
Demirbaş A, Bakıs R, (2004) Energy from Renewable Sources in Turkey: Status and Future Direction. Energy Sources, Part A: Recovery, Utilization, and Environmental Effects, 26, 473-484.
Erdem ZB, (2010) The contribution of renewable resources in meeting Turkey’s energy-related challenges. Renewable and Sustainable Energy Reviews 14, 2710–2722.
Erdoğdu E, (2009) On the wind energy in Turkey Renewable and Sustainable Energy Reviews 13 1361–1371.
Federal Ministry for the Environment, (2009) Nature Conservation and Nuclear Safety, Renewable Energy Sources in Figures, National and International Development, June 2009.
Haklıdır FST, (2008) Türkiye’deki jeotermal alanlar ve bu alanlardaki farklı güncel uygulamalara bakış. VII. Ulusal Temiz Enerji Sempozyumu, UTES’ 2008, (Sf. 645-650), 17-19 Aralık 2008, İstanbul.
2011. IEA (International Energy Agency). In support of the G8 Plan of action, Deploying Renewables:
Principles for effective policies. IEA Publications, 9, Rue de la Fédération, 75739 Paris Cedex 15, Printed in France By Stedi Media, (61 2008 06 1P1) ISBN: 978-92-64-04220-9-2008.
IEA, International Energy Agency. (2010) Energy policies of IEA countries, Turkey 2009 Review, IEA Publications, 9, Rue de la Fédération, 75739 Paris Cedex 15, printed in France by Soregraph, July 2010, (61 2009 06 1P1) ISBN : 978-92-64-06041-8.
Kaya D, (2006) Renewable Energy policies in Turkey. Renewable and Sustainable Energy Reviews, 10, 152-163.
Kaya D, Çanka Kılıç, F, Baban A, Dikeç S, (2008) Administrative, institutional and legislative issues on agricultural waste exploitation in Turkey. Renewable and Sustainable Energy Reviews, 12, 417-436.
Kaygusuz K, (2009) Energy and environmental issues relating to green house gas emissions for sustainable development in Turkey Renewable and Sustainable Energy Reviews 13, 253–270.
Koyun A, (2007) Energy Efficiency and Renewable Energy, Turkey-National Study’s Summary. Mediterranean and National Strategies for Sustainable Development, Energy and Climate Change, Yildiz Technical University, Plan Bleu, Regional Activity Centre, Sophia Antipolis.
Kratzat M, Lehr U, (2007) Federal Ministry for the Environment, Nature Conservation and Nuclear Safety, International workshop “Renewable Energy: Employment Effects” –Models, Discussion and Results-.
Ozyurt O, (2010) Energy issues and renewables for sustainable development in Turkey. Renewable and Sustainable Energy Reviews 14 2976–2985.
Pursuing sustainability (2010) Assessment of country energy and climate policies World Energy Council Report.
Renewable energy opportunities in Turkey, 09 November 2010. Accessible in February, 22nd, 2011. Saidur R, Islam MR, Rahim NA, Solangi KH, (2010) A review on global wind energy policy
Renewable and Sustainable Energy Reviews 14 1744–1762. The Presentation of The Ministry's Budget for The Year 2012 at The Plenary Session of The Turkish
Grand National Assembly (TBMM), Republic of Turkey, Ministry of Energy and Natural Resources, December 2011.
The Republic of Turkey, (2010) Turkish Official Journal, No: 6094. 29th December 2010, Ankara. UNEP Green Economy Report, (2011) Part II, Chapter 1, Renewable energy Invest in energy and
resource efficiency, United Nations Environment Program.