IOB Study Renewable Energy: Access and Impact| IOB Study | no. 376 | Renewable Energy: Access and Impact| IOB Study | no. 376 | Renewable Energy: Access a Renewable Energy: Access and Impact A systematic literature review of the impact on livelihoods of interventions providing access to renewable energy in developing countries
Transcript
Renewable Energy: Access and Im
pactIO
B Study | no. 376
IOB Study
Renewable Energy: Access and Impact| IOB Study | no. 376 | Renewable Energy: Access and Impact| IOB Study | no. 376 | Renewable Energy: Access and
Renewable Energy: Access and ImpactA systematic literature review of the impact on livelihoods of interventions providing access to renewable energy in developing countries
Renewable Energy: Access and Impact| IOB Study | no. 376 | Renewable Energy: Access and Impact| IOB Study | no. 376 | Renewable Energy: Access and
March 2013
IOB Study
Renewable Energy: Access and ImpactA systematic literature review of the impact on livelihoods of interventions providing access to renewable energy in developing countries
Renewable Energy: Access and Impact
| 3 |
PrefaceEnergy and energy-related subjects fill the news headlines daily. The crude oil price is a driving indicator at international financial markets and impinges upon the world economy. Fossil fuel derivates enable the world’s population to heat their houses, to have electricity and to drive their vehicles. But the use of fossil fuels also causes contamination and this threatens the same welfare it brings as energy source. Energy affects all aspects of develop-ment – social, economic and environmental – including livelihoods, access to water, agricultural productivity, health, population levels, education, and gender-related issues (UNDP, 2012).
Over decades, Dutch development cooperation dealt with energy in a two-pronged approach: on the one hand, investments in energy infrastructure were supported through either financing with the World Bank or through subvented financing mechanisms to the private sector operated by the Dutch Development Bank FMO. On the other hand, small local activities were supported by development projects, mostly implemented by non-governmental organisations.
The Conference ‘Energy for Development’ (2004) hosted by the Dutch Minister for Development Cooperation and the State Secretary for Environment – with support from the World Bank, UNDP and the World Business Council for Sustainable Development – marked an important change. At the conference emerging energy policy lines were presented together with an inventory of energy options, funding modalities and potential partners/stakeholders. The Netherlands expressed its keen interest to support financially affordable and socially acceptable techniques for the provision of modern and clean energy services to ten million persons by 2015.
Since 2008, the support to renewable energy and development cooperation is implemented through the ‘Promoting Renewable Energy Programme’, which encompasses a wide range of programmes, projects and specialised funds to provide access to renewable energy sources. Nowadays, the Dutch policy considers climate as major component of what is called ‘global public goods’, while renewable energy is seen in its relation to climate change.
The Policy and Operations Evaluation Department (IOB) of the Dutch Ministry of Foreign Affairs has scheduled an evaluation of the renewable energy and development policy in general, and the Promoting Renewable Energy Programme in particular. This evaluation, to be published in 2014, encompasses quantitative impact studies executed in Burkina Faso, Rwanda and Indonesia. This systematic literature review is meant to underpin the evaluation process.
The literature review presented in this report enquired in a systematic manner what is actually known about the kind of relations and associations between (renewable) energy and aspects of socio-economic development. The review focuses on the impact of the different forms of (renewable) energy supply, in particular in rural areas and the urban periphery in developing countries. It is a systematic review in the sense that it uses
| 4 |
Preface
transparent selection and appraisal procedures to identify, evaluate and synthesize the results of relevant empirical evaluative studies. The review enables to package the available evidence in an accessible way and focuses on the quality of the literature, by carefully separating ‘evidence’ from ‘interesting cases’. The initial search produced 558 titles of articles and reports, of which 66 studies qualified – based on pre-established selection criteria – to be included in the review.
This review does not draw generic conclusions about interventions or specific forms of renewable energy sources. Rather, by presenting the information in a disaggregated manner, the review calls for attention to the importance of the context in which interventions take place. In addition, on various topics the subject seems to be either under-researched or research has been conducted in a limited number of countries only. Nevertheless, IOB hopes that this review contributes to the knowledge base on the impact of the use of renewable energy, while the findings serve as benchmark for its own impact studies.
IOB inspector Rita Tesselaar is responsible for the policy review and the related impact studies. The systematic literature review has been conducted by Willem Cornelissen (senior researcher ERBS B.V., Erasmus University Rotterdam) and Jolijn Engelbertink (IOB researcher). The authors are grateful for the constructive comments and contributions received from Frank van der Vleuten (Ministry of Foreign Affairs – Department of Environment, Water, Climate and Energy), Pieter van Beukering and Bianca van der Kroon (IVM–VU University Amsterdam). IOB colleagues Piet de Lange and Ferko Bodnár peer reviewed the report. IOB remains responsible for the content of the report.
Prof. dr. Ruerd Ruben
Director Policy and Operations Evaluation Department (IOB)Ministry of Foreign Affairs, The Netherlands
Renewable Energy: Access and Impact
| 5 |
Table of ContentsPreface 3List of Tables and Figures 7Acronyms and abbreviations 8
Executive summary 10
1 Background of the review 20
2 Objective and research questions 242.1 Objective of the review 252.2 Concepts used 252.3 Research questions 26
3 Overview of the methods of the review 323.1 Systematic review 333.2 Inclusion and exclusion criteria 333.3 Search strategy 353.4 Attribution of effects 39
4 Overview of selected literature 424.1 Short description of included interventions 434.2 Quantity and Quality 474.3 Concluding remarks 50
5 Adoption and Access 525.1 The energy ladder 535.2 Adoption 565.3 Concluding remarks 68
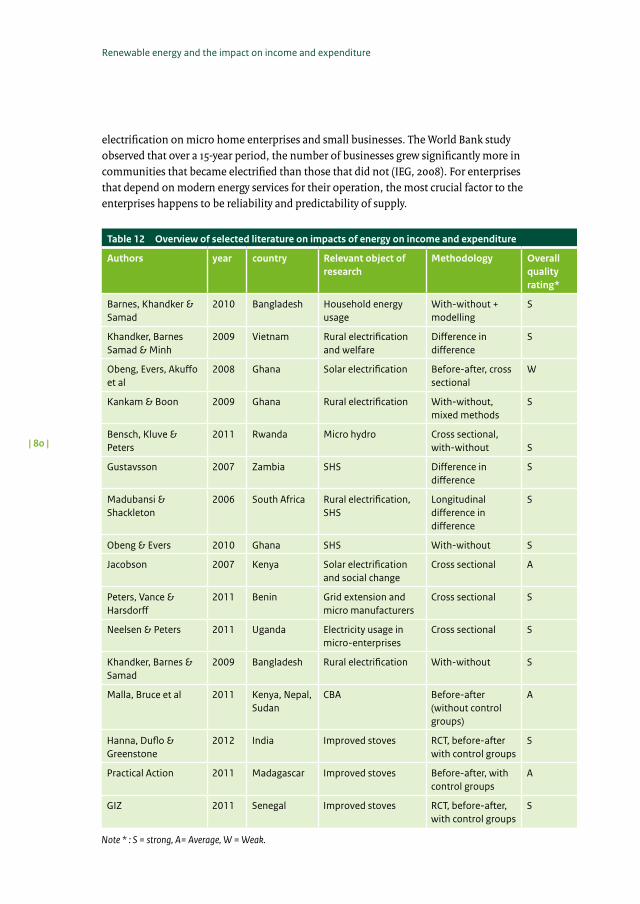
6 Renewable energy and the impact on income and expenditure 706.1 The consumptive use 716.2 The productive use 766.3 Concluding remarks 81
7 Renewable energy and the impact on health 827.1 Improved stoves and indoor air pollution 837.2 Biogas and Health 887.3 Electricity and health 887.4 Concluding remarks 91
| 6 |
Contents
8 Renewable energy and social variables 928.1 Socio-economic differentiation 938.2 Time savings 948.3 Safety 998.4 Study hours and school performance 1008.5 Communication (mobile telephone, television and internet use) 1038.6 Concluding remarks 106
9 Renewable energy and CO2 emissions 1089.1. Improved stoves and fuelwood savings 1109.2 Improved stoves and reduction of CO2 emissions 1139.3 Biogas and reduction of CO2 emissions 1149.4 Renewable electricity and reduction of CO2 emissions 1149.5 Generating carbon credits 1169.6 Concluding remarks 118
10 Sustainability and the private sector 12010.1 Energy markets 12110.2 Barriers to private sector development for energy markets 12510.3 Sustainability at household level 12710.4 Efficiency of delivery modalities 12810.5 Concluding remarks 132
Annexes 134Annex 1 About IOB 135Annex 2 References 137Annex 3 Abbreviated Terms of Reference Systematic Literature Review 146
Renewable Energy: Access and Impact
| 7 |
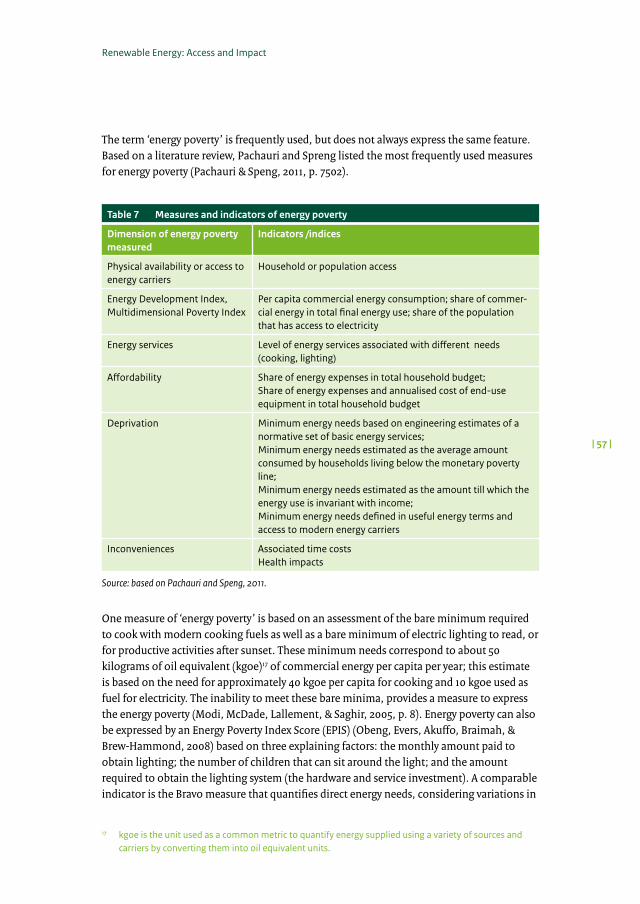
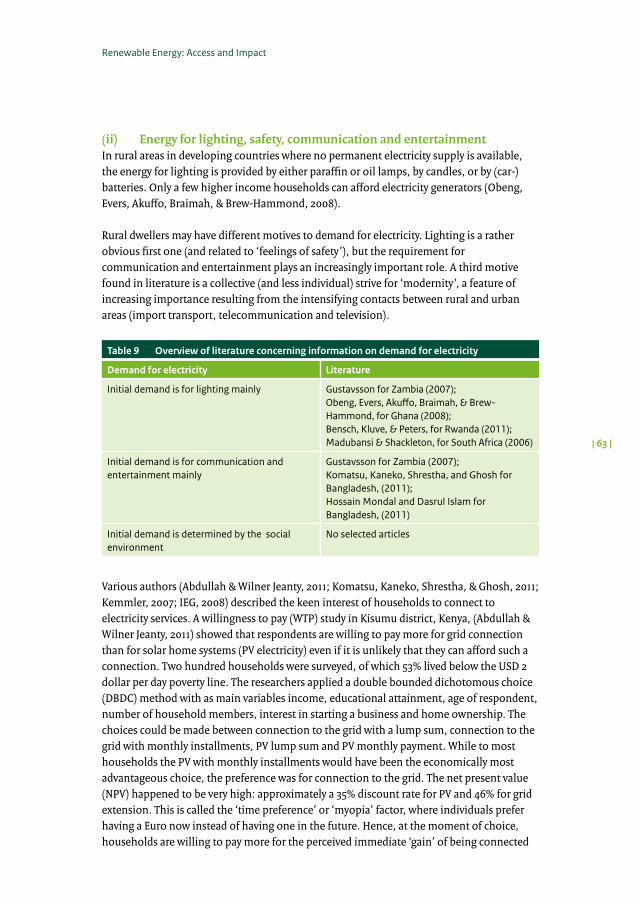
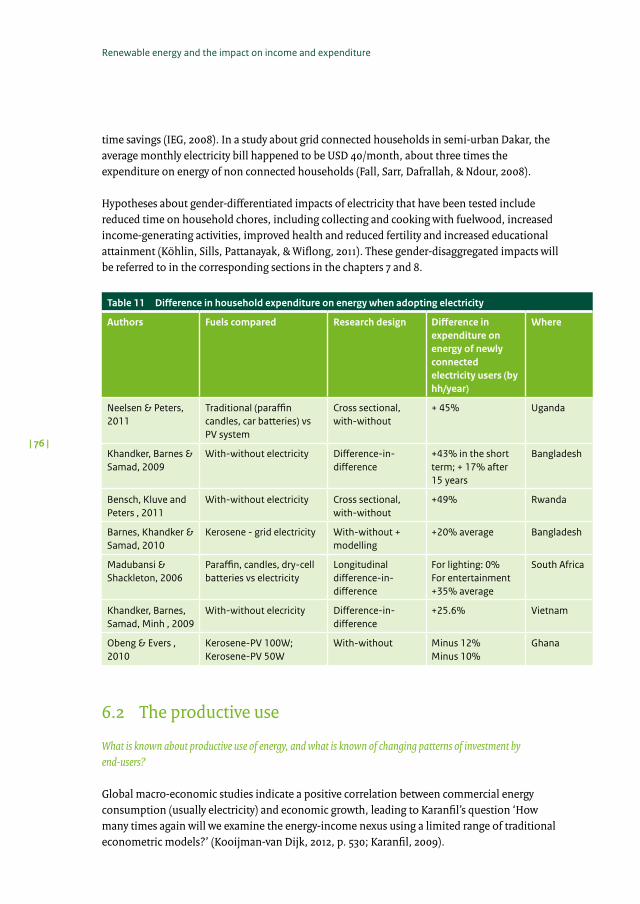
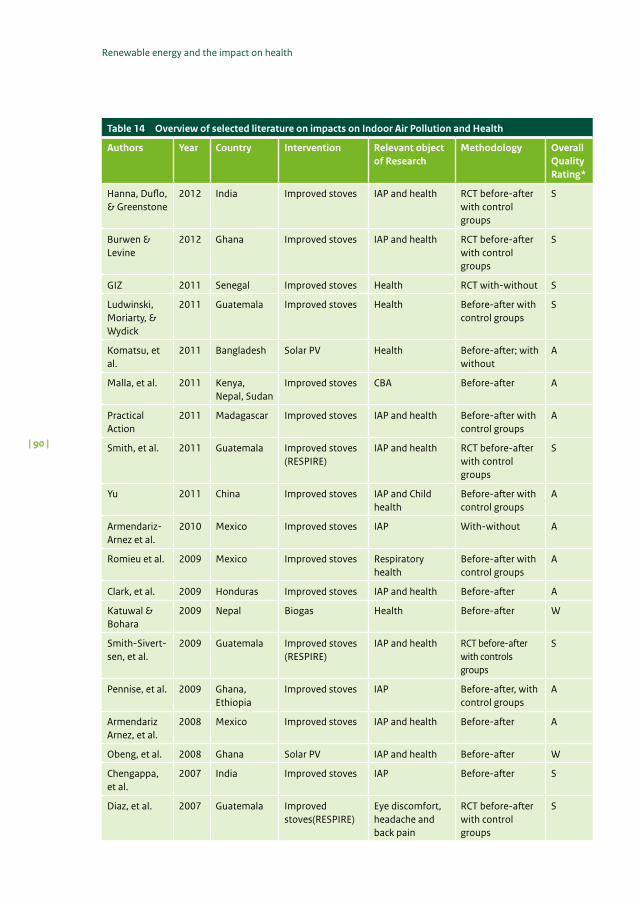
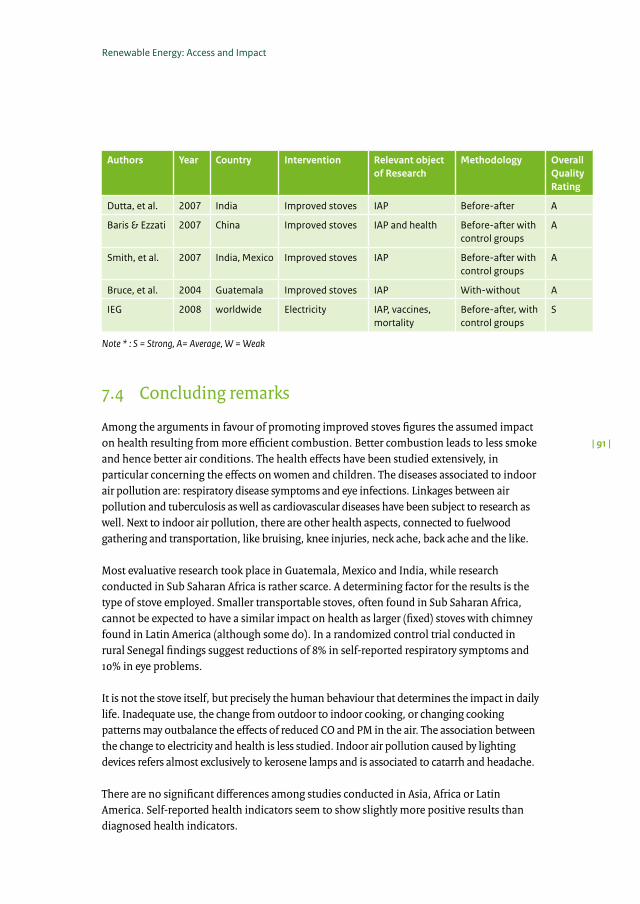
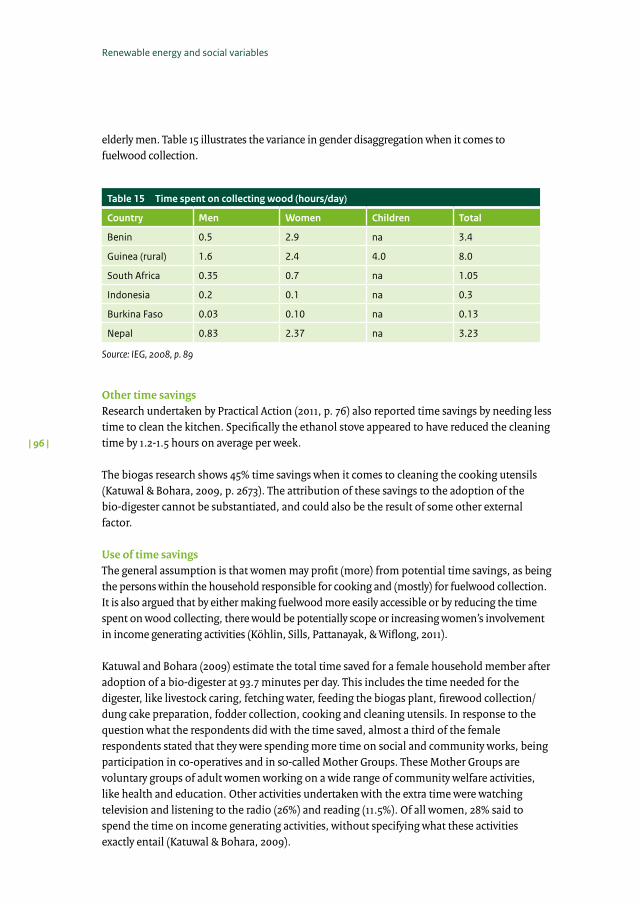
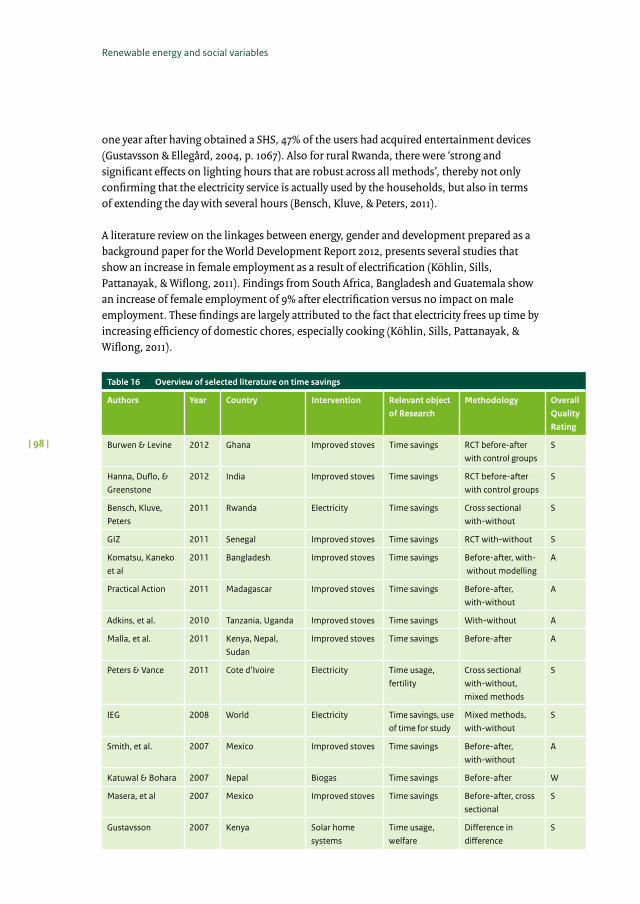
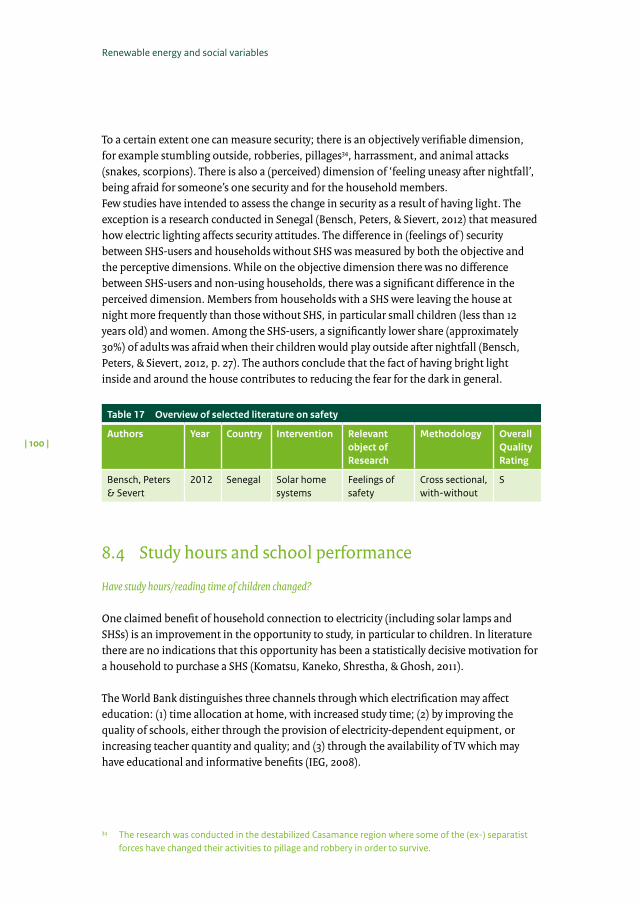
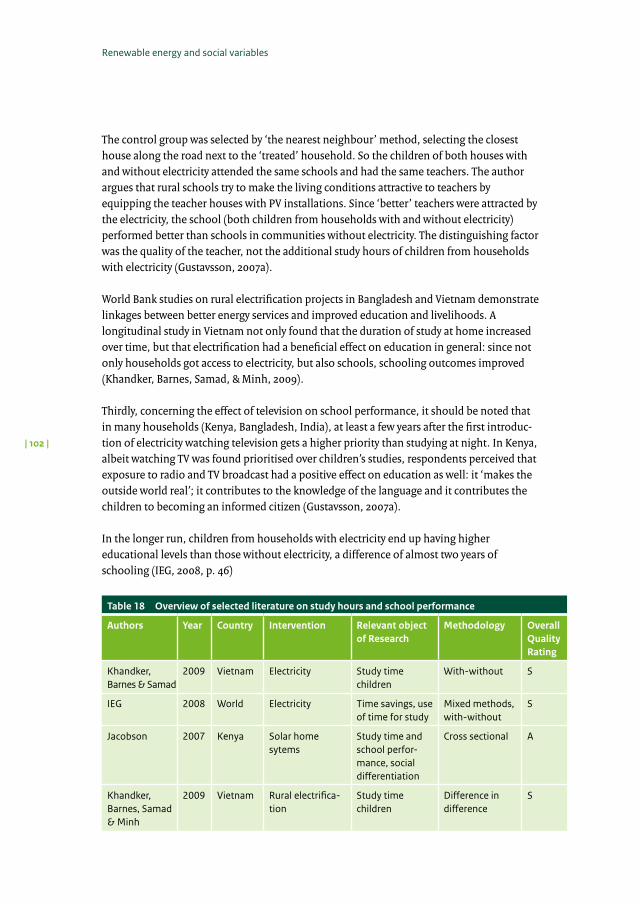
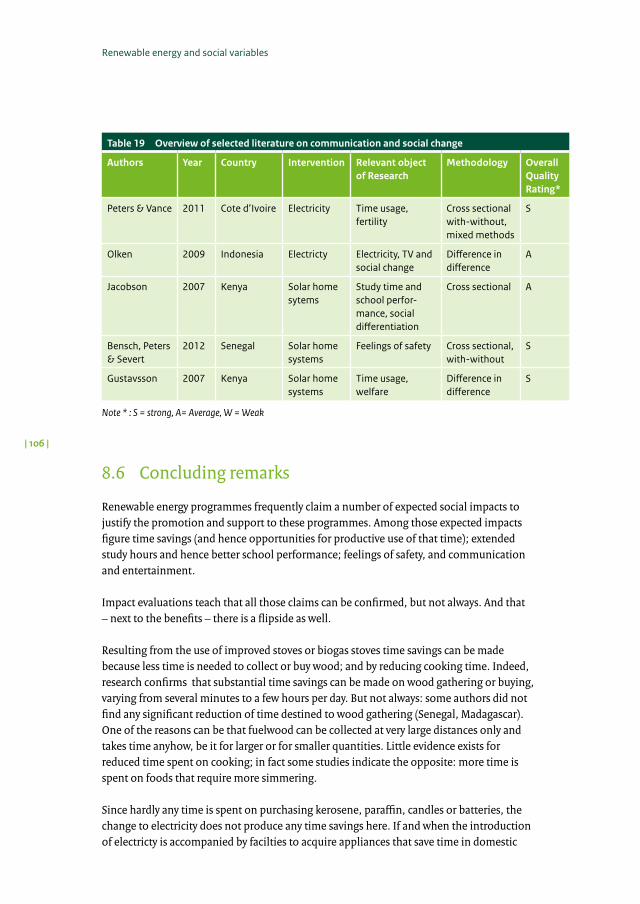
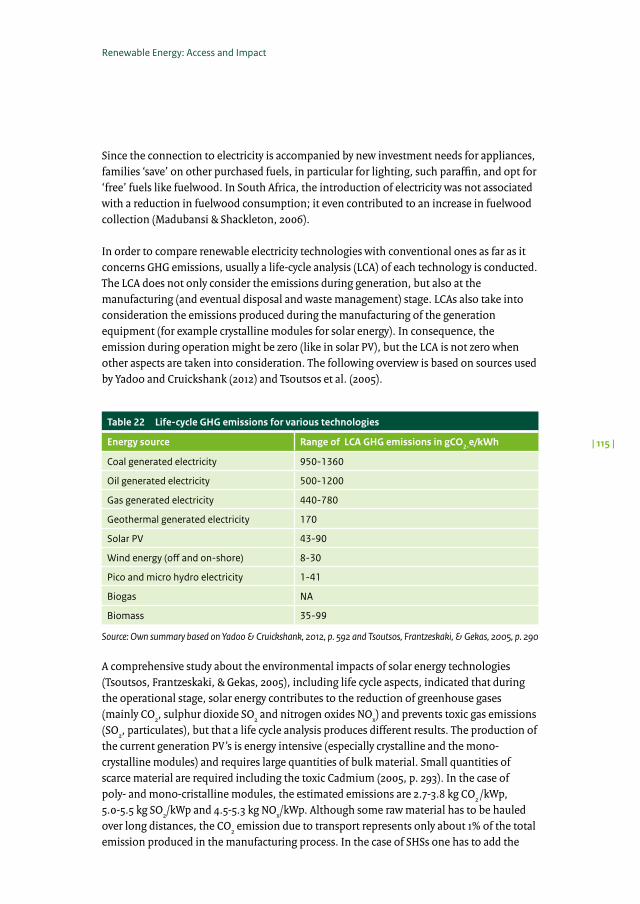
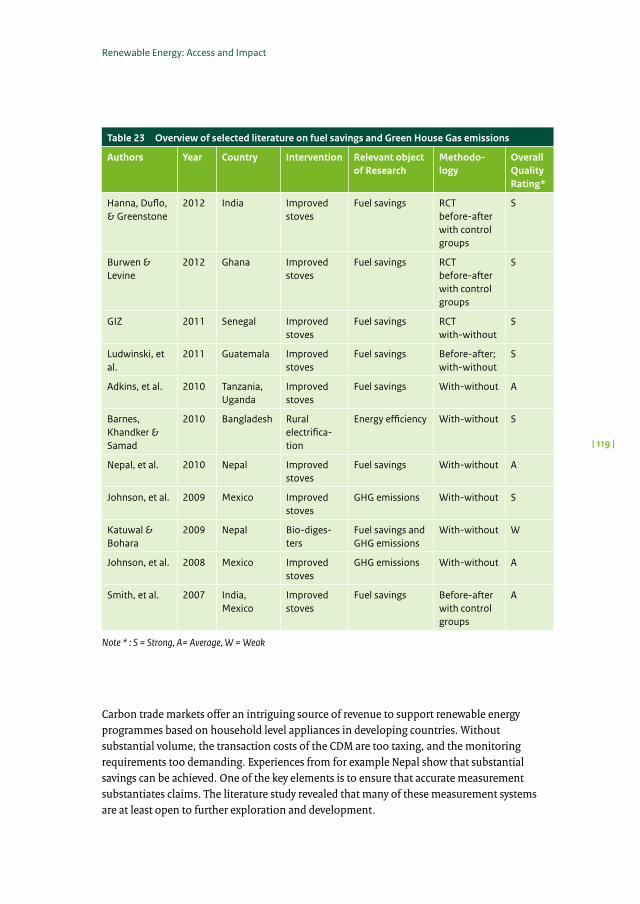
List of Tables and FiguresTablesTable 1 Overview of sources and portals consulted during the literature review 37Table 2 Categories of Classification of articles 38Table 3 Overview of methods applied in selected articles and reports 40Table 4 Improved stove categories as dealt with in selected literature 44Table 5 Sources of electricity as dealt with in selected literature 46Table 6 Quality of literature by source of energy 48Table 7 Measures and indicators of energy poverty 57Table 8 Energy options and services at the household and community levels 59Table 9 Overview of literature concerning information on demand for electricity 63Table 10 Cost savings for cooking energy expenditures 73Table 11 Difference in household expenditure on energy when adopting electricity 76Table 12 Overview of selected literature on impacts of energy on income and expenditure 80Table 13 Levels of CO and PM2.5 measured after improved stove intervention 85Table 14 Overview of selected literature on impacts on Indoor Air Pollution and Health 90Table 15 Time spent on collecting wood (hours/day) 96Table 16 Overview of selected literature on time savings 98Table 17 Overview of selected literature on safety 100Table 18 Overview of selected literature on study hours and school performance 102Table 19 Overview of selected literature on communication and social change 106Table 20 Stove testing methods 110Table 21 Fuelwood savings 112Table 22 Life-cycle GHG emissions for various technologies 115Table 23 Overview of selected literature on fuel savings and Green House Gas emissions 119Table 24 Five institutional models for electricity delivery 129
FiguresFigure 1 Steps in literature selection 12Figure 2 Expected impacts of renewable energy interventions 13Figure 3 Simplified results chain for thermal energy 27Figure 4 Simplified results chain for rural electrification 27Figure 5 Sources and number of studies found after key word search, snowballing and
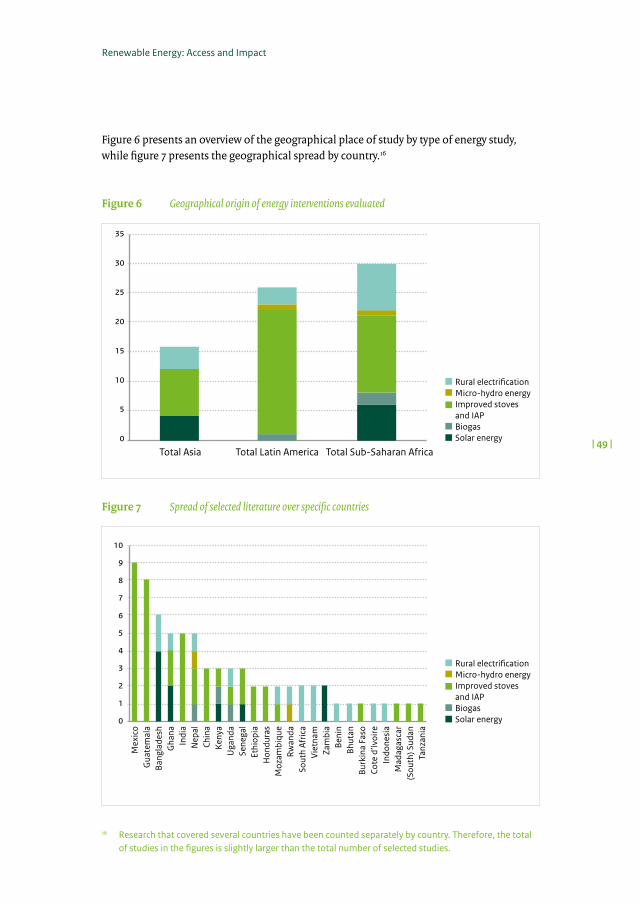
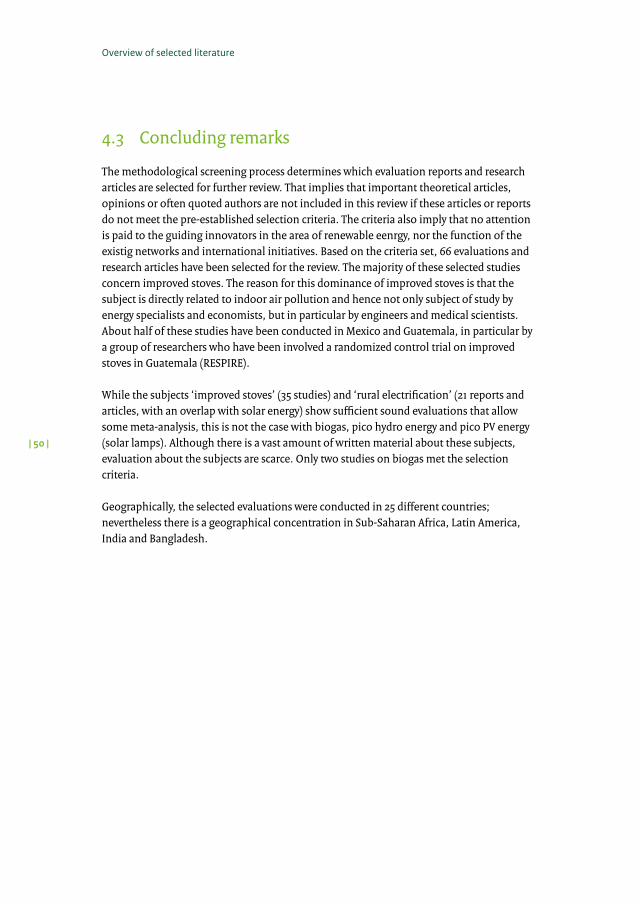
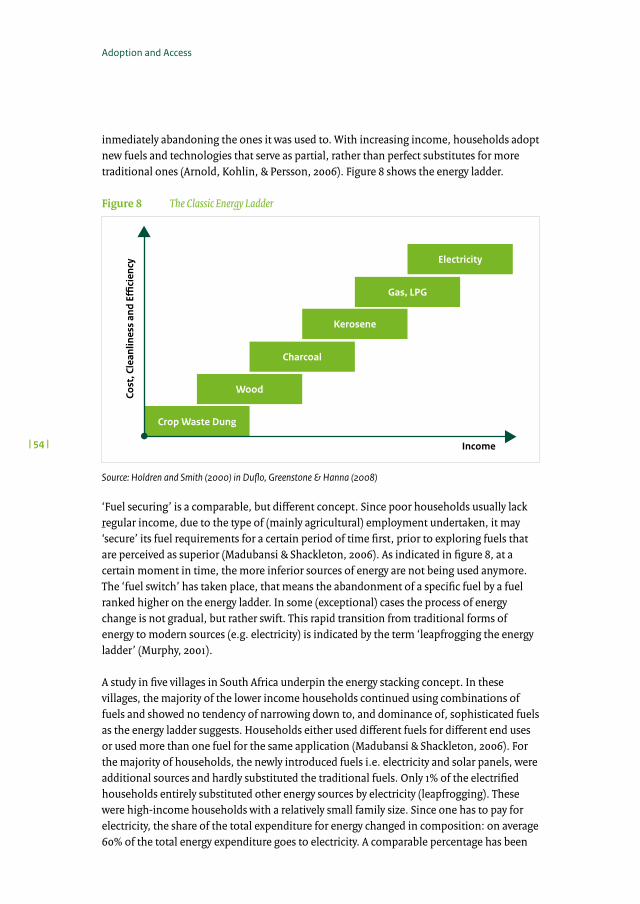
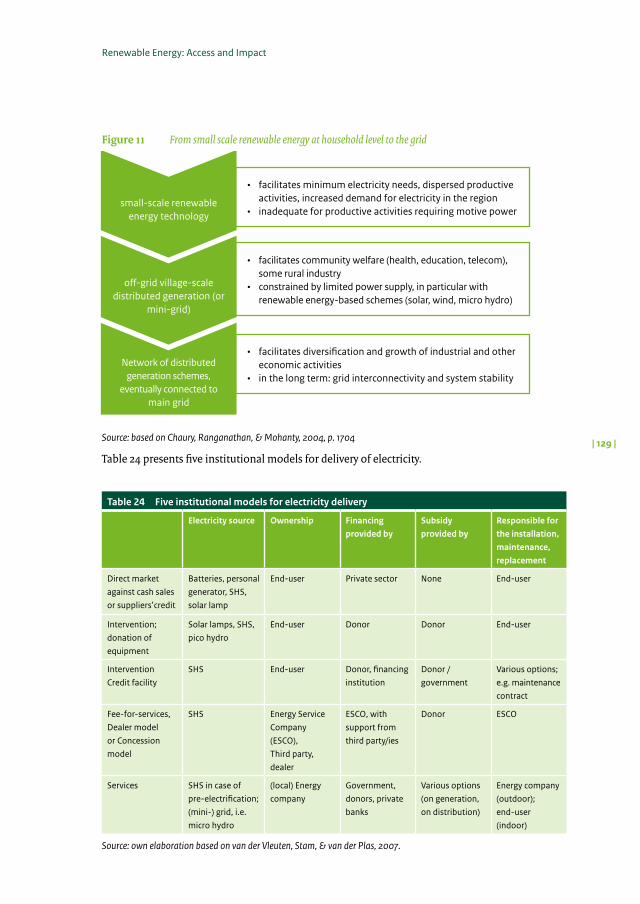
first screening on title and abstract 38Figure 6 Geographical origin of energy interventions evaluated 49Figure 7 Spread of selected literature over specific countries 49Figure 8 The Classic Energy Ladder 54Figure 9 Share energy expenditures of household monthly income in Bangladesh 74Figure 10 Global Warming commitments, estimated for daily stove use in Mexico 113Figure 11 From small scale renewable energy at household level to the grid 129
| 8 |
Acronyms and abbreviations
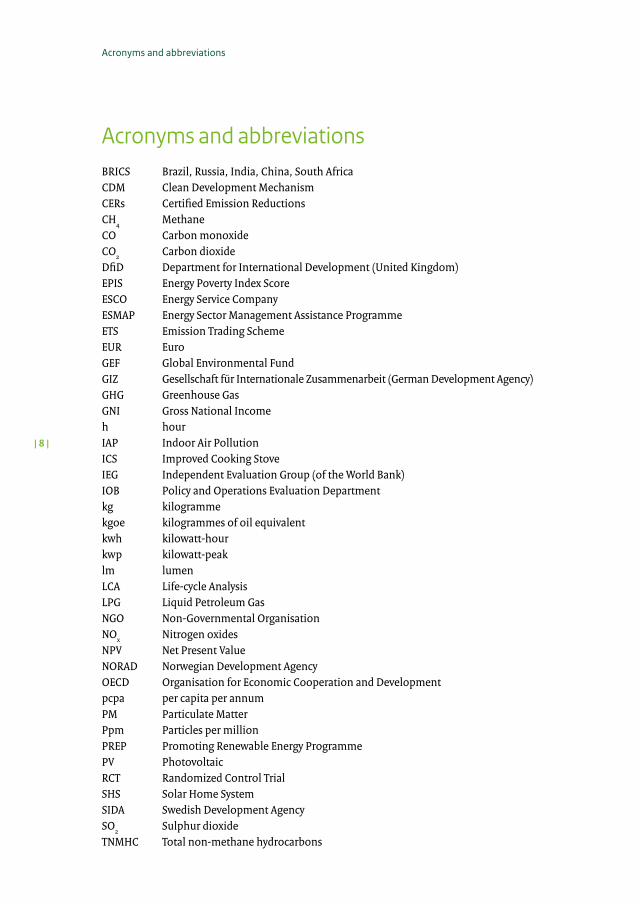
Acronyms and abbreviationsBRICS Brazil, Russia, India, China, South AfricaCDM Clean Development MechanismCERs Certified Emission ReductionsCH4 MethaneCO Carbon monoxideCO2 Carbon dioxideDfiD Department for International Development (United Kingdom)EPIS Energy Poverty Index ScoreESCO Energy Service CompanyESMAP Energy Sector Management Assistance ProgrammeETS Emission Trading SchemeEUR EuroGEF Global Environmental FundGIZ Gesellschaft für Internationale Zusammenarbeit (German Development Agency)GHG Greenhouse GasGNI Gross National Incomeh hourIAP Indoor Air PollutionICS Improved Cooking StoveIEG Independent Evaluation Group (of the World Bank)IOB Policy and Operations Evaluation Departmentkg kilogrammekgoe kilogrammes of oil equivalentkwh kilowatt-hourkwp kilowatt-peaklm lumenLCA Life-cycle AnalysisLPG Liquid Petroleum GasNGO Non-Governmental OrganisationNOx Nitrogen oxidesNPV Net Present ValueNORAD Norwegian Development AgencyOECD Organisation for Economic Cooperation and Developmentpcpa per capita per annumPM Particulate MatterPpm Particles per millionPREP Promoting Renewable Energy ProgrammePV PhotovoltaicRCT Randomized Control TrialSHS Solar Home SystemSIDA Swedish Development AgencySO2 Sulphur dioxideTNMHC Total non-methane hydrocarbons
Renewable Energy: Access and Impact
| 9 |
ToR Terms of ReferenceUNDP United Nations Development ProgrammeUNEP United Nations Energy ProgrammeUNFCCC United Nations Framework Convention on Climate ChangeUNIDO United Nations Industrial Development OrganisationUSD United States DollarsV VoltVER Voluntary Emission ReductionsW WattWh Watt-hourWp Watt-peakWHO World Health OrganizationWTP Willingness to Pay
Executive summary
Renewable Energy: Access and Impact
| 11 |
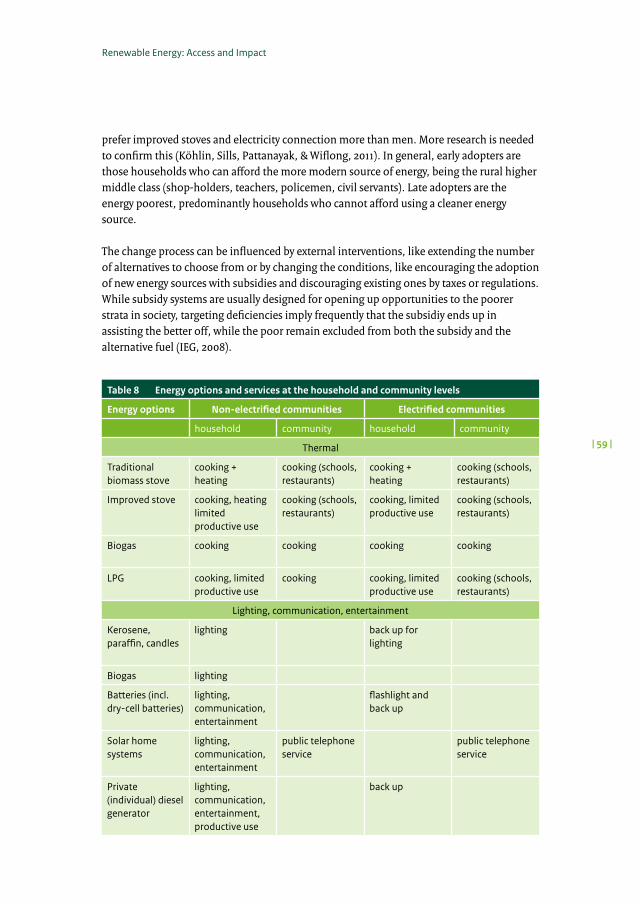
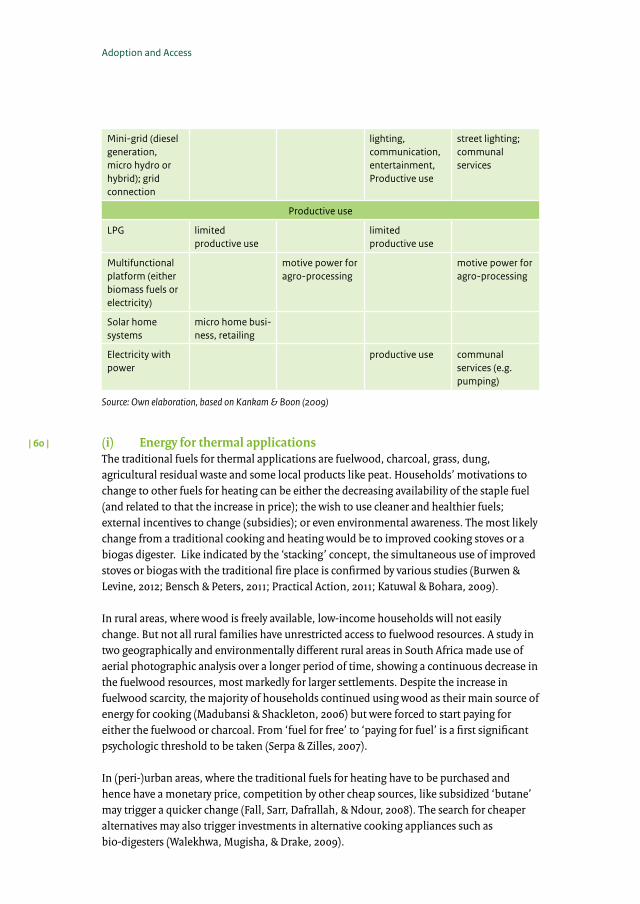
The Policy and Operations Evaluation Department (IOB) of the Dutch Ministry of Foreign Affairs has scheduled for 2014 an evaluation of its renewable energy and development policy. The evaluation over the period 2004-2013 serves to account for the policy and to draw lessons for the future. The evaluation will encompass, next to a review of the policy itself, quantitative impact studies in Burkina Faso, Rwanda and Indonesia. The systematic literature review presented in this report is meant to inform the evaluation process.In rural societies and urban peripheries in developing countries, the choice for energy carriers is usually determined by the options provided by the natural environment (i.e. fuelwood, charcoal, grass, dung, agricultural residuals, and in particular areas: vegetable oils, peat, or bee-wax). Changes in energy-use patterns from biomass fuels to technologically more sophisticated fuels are usually indicated by the term ‘energy ladder’. In general, if either income increases, or traditional fuels become scarce, households adopt new fuels and technologies that serve as partial, rather than perfect substitutes for the traditional ones. A distinction frequently made for energy is by its three forms of usage: energy for thermal applications (space heating, cooking, and water heating); energy for lighting, safety, communication and entertainment; and energy for productive use. The changes in energy for thermal applications (for example the adoption of an improved cooking stove) come –usually– prior to changes for lighting. Concerning the adoption of electricity, the process is comparable and called the ‘electricity ladder’ (i.e. from dry cell batteries through car batteries to PV energy and finally connection to the electricity grid).
The objective of the systematic literature review is to provide a comprehensive overview of evaluative literature and reports regarding the impact of (renewable) energy interventions on the livelihoods of end-users, being on individuals (m/f ), households, public facilities and small enterprises in rural areas and the urban periphery in developing and middle income countries. These interventions refer to the use of improved cooking stoves, biogas digesters, solar home systems (including solar lamps), and hydro powered mini-grids. This review neither encompasses the impact on macro variables, like the energy market in general, macro-economic effects like economic growth, or the effects on the climate, nor the ‘greening of the grid’. Hence no findings about these subjects are presented. The results of the review serve both policy makers and practitioners of renewable energy interventions to be acquainted with “what works and why”.
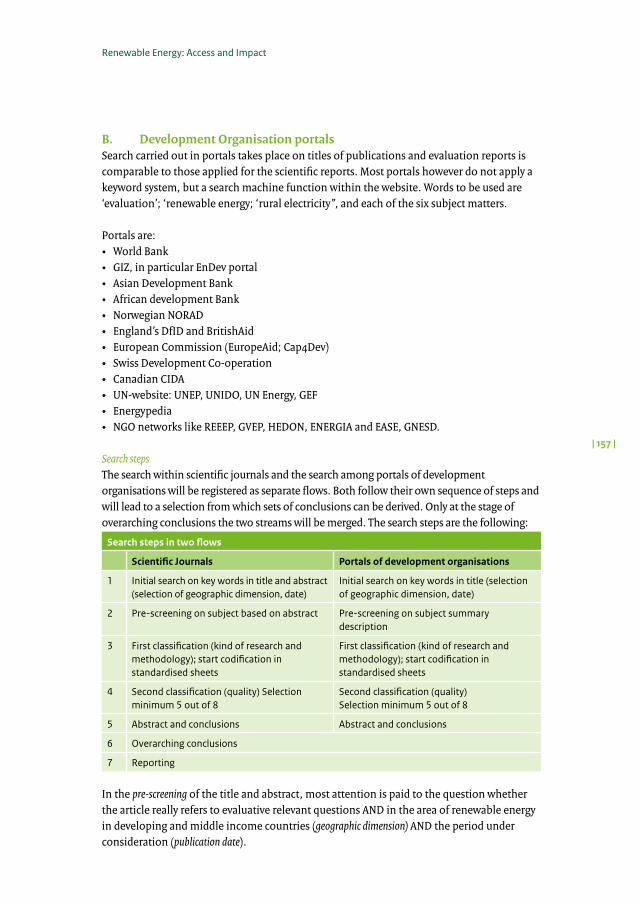
Methodologically, the systematic review applied the ‘realist evaluation approach’, a variant of the Campbell Collaboration protocol. Based on pre-set criteria, the analytical process encompassed search, pre-screening and selection steps applied to scientific articles and evaluation reports by international development agencies. The main criterion for inclusion of evaluation reports and scientific articles was whether the evaluative conclusions were derived at by making use of a convincing counterfactual analysis in such a way that attribution of results to the intervention can be determined.
| 12 |
Executive summary
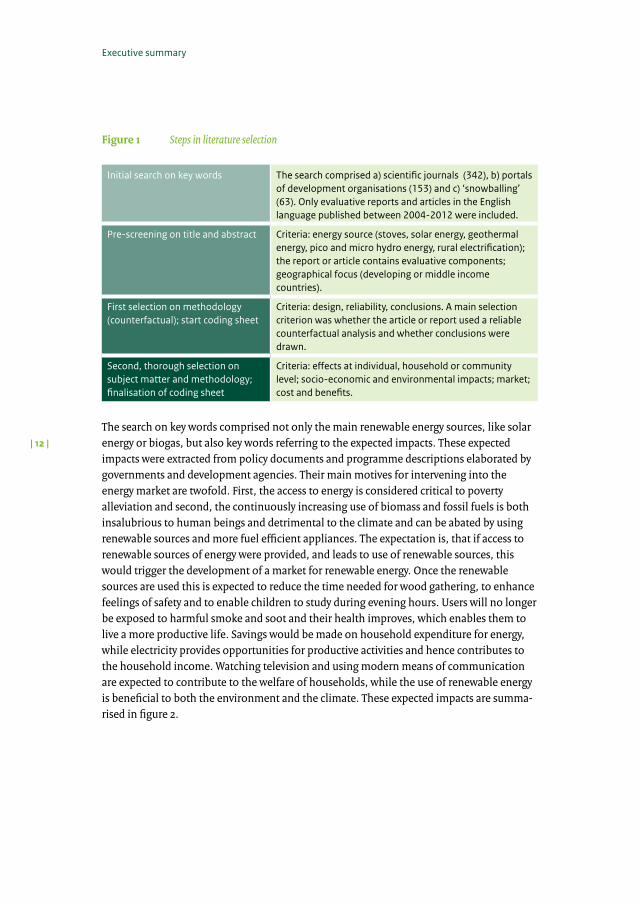
Figure 1 Steps in literature selection
Initial search on key words The search comprised a) scientific journals (342), b) portals of development organisations (153) and c) ‘snowballing’ (63). Only evaluative reports and articles in the English language published between 2004-2012 were included.
Pre-screening on title and abstract Criteria: energy source (stoves, solar energy, geothermal energy, pico and micro hydro energy, rural electrification); the report or article contains evaluative components; geographical focus (developing or middle income countries).
First selection on methodology (counterfactual); start coding sheet
Criteria: design, reliability, conclusions. A main selection criterion was whether the article or report used a reliable counterfactual analysis and whether conclusions were drawn.
Second, thorough selection on subject matter and methodology; finalisation of coding sheet
Criteria: effects at individual, household or community level; socio-economic and environmental impacts; market; cost and benefits.
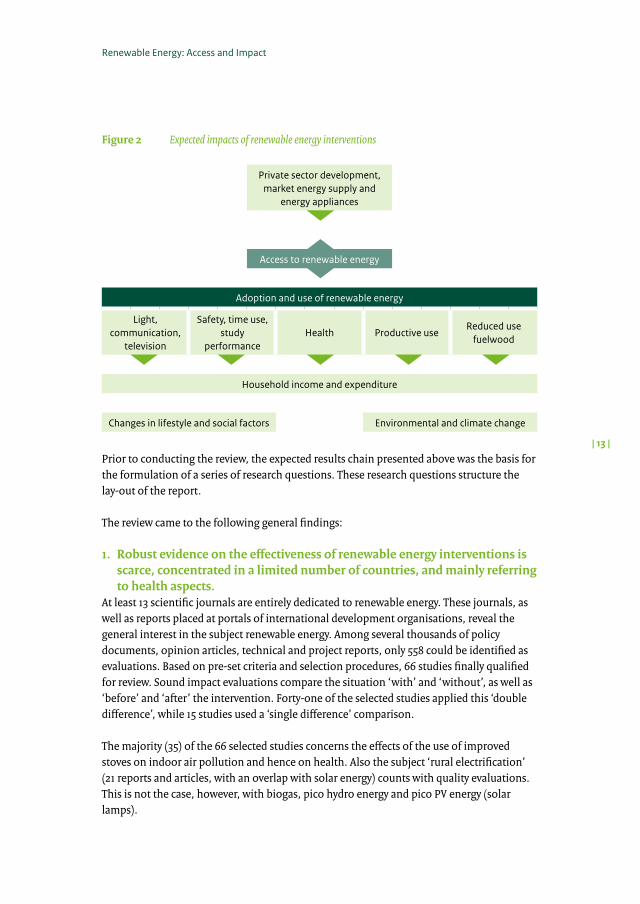
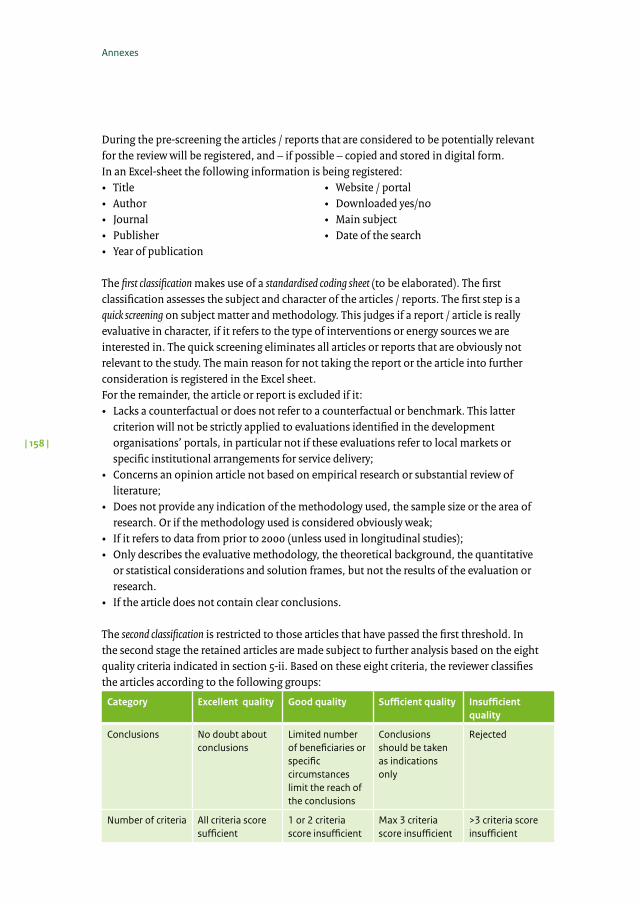
The search on key words comprised not only the main renewable energy sources, like solar energy or biogas, but also key words referring to the expected impacts. These expected impacts were extracted from policy documents and programme descriptions elaborated by governments and development agencies. Their main motives for intervening into the energy market are twofold. First, the access to energy is considered critical to poverty alleviation and second, the continuously increasing use of biomass and fossil fuels is both insalubrious to human beings and detrimental to the climate and can be abated by using renewable sources and more fuel efficient appliances. The expectation is, that if access to renewable sources of energy were provided, and leads to use of renewable sources, this would trigger the development of a market for renewable energy. Once the renewable sources are used this is expected to reduce the time needed for wood gathering, to enhance feelings of safety and to enable children to study during evening hours. Users will no longer be exposed to harmful smoke and soot and their health improves, which enables them to live a more productive life. Savings would be made on household expenditure for energy, while electricity provides opportunities for productive activities and hence contributes to the household income. Watching television and using modern means of communication are expected to contribute to the welfare of households, while the use of renewable energy is beneficial to both the environment and the climate. These expected impacts are summa-rised in figure 2.
Renewable Energy: Access and Impact
| 13 |
Figure 2 Expected impacts of renewable energy interventions
Private sector development, market energy supply and
energy appliances
Access to renewable energy
Adoption and use of renewable energy
Light, communication,
television
Safety, time use, study
performanceHealth Productive use
Reduced use fuelwood
Household income and expenditure
Changes in lifestyle and social factors Environmental and climate change
Prior to conducting the review, the expected results chain presented above was the basis for the formulation of a series of research questions. These research questions structure the lay-out of the report.
The review came to the following general findings:
1. Robust evidence on the effectiveness of renewable energy interventions is scarce, concentrated in a limited number of countries, and mainly referring to health aspects.
At least 13 scientific journals are entirely dedicated to renewable energy. These journals, as well as reports placed at portals of international development organisations, reveal the general interest in the subject renewable energy. Among several thousands of policy documents, opinion articles, technical and project reports, only 558 could be identified as evaluations. Based on pre-set criteria and selection procedures, 66 studies finally qualified for review. Sound impact evaluations compare the situation ‘with’ and ‘without’, as well as ‘before’ and ‘after’ the intervention. Forty-one of the selected studies applied this ‘double difference’, while 15 studies used a ‘single difference’ comparison.
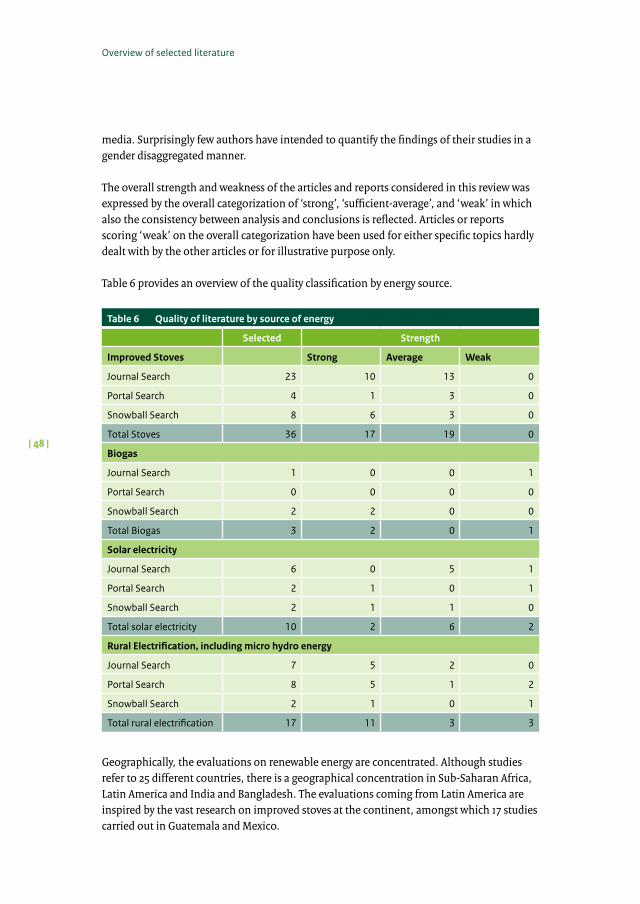
The majority (35) of the 66 selected studies concerns the effects of the use of improved stoves on indoor air pollution and hence on health. Also the subject ‘rural electrification’ (21 reports and articles, with an overlap with solar energy) counts with quality evaluations. This is not the case, however, with biogas, pico hydro energy and pico PV energy (solar lamps).
| 14 |
Executive summary
Geographically, the selected evaluations happen to concentrate in a limited number of countries only: Bangladesh, Guatemala, India, Kenya, Mexico, Rwanda, South Africa and Zambia.
2. There are flaws in the current knowledge concerning the impacts of renewable energy in developing countries. This challenges future impact-oriented research.
The review has detected various omissions or flaws in the evaluative knowledge concerning renewable energy in developing countries. There is ample need for sound evaluative research about the impact of biogas systems, pico-PV systems and pico-hydro systems. Since observed impacts of renewable energy interventions are divergent and context specific –they vary among countries and even within them – there are ample opportunities for comparative evaluative research.
Some expected benefits of renewable energy interventions refer explicitly to women, such as feelings of security, time savings in fuelwood gathering, and health. However, apart from studies about health aspects, the selected evaluations hardly report gender disaggregated data.
Apart from one World Bank report (2008) no evaluation was found concerning impacts on the development of the private sector in the energy market. Longitudinal impact research on renewable energy sources is exceptional. These studies could contribute to a better understanding of the changing impacts of energy interventions over time.
3. Households in rural areas cope with uncertainties by rather adding sources of energy or energy related appliances, to the ones they have got already, instead of replacing one source for another.
Access to a new fuel does not automatically imply that households are either connected to the source (electricity), or use it (stoves) and continue to use it over time. In communities with electricity for over 10 years, between 15 and 20 % of the households remain without connection (IEG, 2008).
Changing energy is not necessarily a linear process, as suggested by the term ‘energy ladder’, but households may ‘step back and forth’ on the ladder. Households do not immediately switch from one fuel to another, but they add a new source on top of the energy sources familiar to them. This is called ‘energy stacking’: new fuels and technologies serve as partial, rather than perfect substitutes for the existing ones. Different fuels can be used simultaneously for different purposes. Only over time some sources (usually the most inferior ones, like dung) are abandoned and permanently replaced by another source (this is called ‘fuel switch’).
Households that use various fuels and technologies simultaneously are better equipped to cope with external shocks, such as temporary fuel scarcity, price increases, lack of supplies or deterioration of family income, but also with traditions and taste preferences. The simultaneous use of both new and traditional fuels and technologies has a bearing on the observed impacts of renewable energy use at household level.
Renewable Energy: Access and Impact
| 15 |
Studies conducted in India, Mexico, Bangladesh and South Africa showed that even in areas where wood is freely available, the inferior fuels are abandoned first when income rises (South Africa) or where the use of dung is stigmatized (Mexico). The adoption of a new form of energy is not a rational economic behaviour only, but sociocultural considerations are equally important, like the feeling of modernity, the aspiration for an urban lifestyle or just convenience. Also collective choice plays a role in adopting a new energy source.
4. The impact of interventions in energy sources and devices is determined by human behaviour rather than by technological design features.
Renewable energy innovations usually show positive results in terms of combustion efficiency and reduced emissions under controlled conditions. Quantitative evaluations reveal that the potential benefits that are expected to result from these findings, such as money and time savings, are frequently offset by human behaviour. This applies to improved stoves, where changes in cooking behaviour may annihilate the gains in energy consumption (called the ‘rebound effect’) as well as to solar home systems, where additional possibilities to the user (for example watching television) balance out the savings made in the use of traditional fuels. The studies reviewed indicate that impacts may either increase (due to changes in lifestyle) or diminish over time (due to lack of usage).
5. Energy use and income associate, in a two-way direction of causality. The higher middle income ‘early adopters’ of energy innovations incur into higher expenditure in the short term. But it pays off, since over time their income increases relatively more than that of ‘late’ or ‘none’ adopting households.
Higher middle income strata in the rural areas (civil servants, shop owners) are the first ones to adopt new energy sources and appliances. Late adopters are the energy poorest, predominantly households who cannot afford using a cleaner energy source. One study indicates that female decision makers are more likely to opt for cleaner energy (Köhlin et al., 2011). Usually the use of a new source implies incurring into higher costs for the investment and often the operating costs.
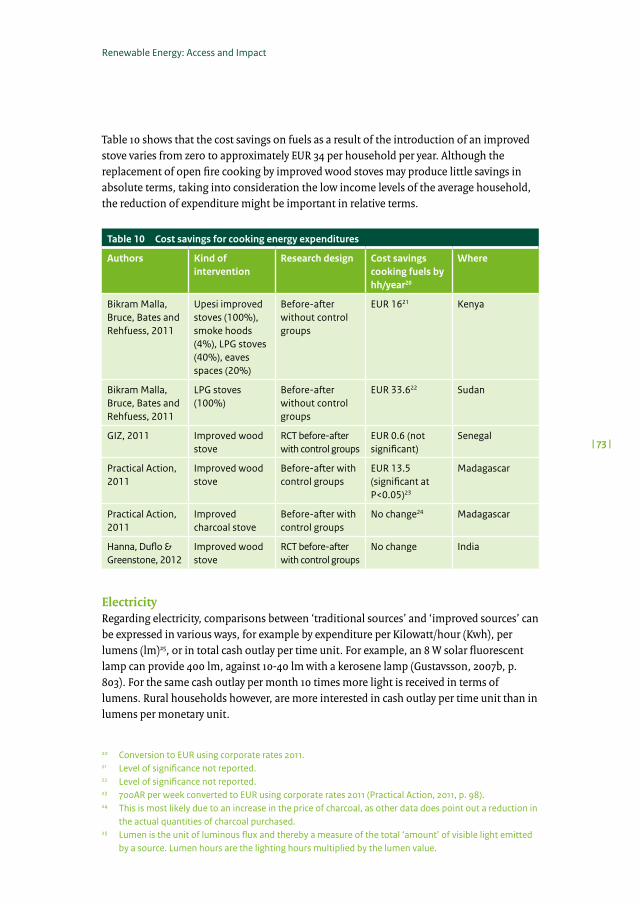
Direct income generation from improved systems for heating is restricted to applications like food preparation, drying agricultural produce, tea and tobacco curing, and brick making. Savings in fuelwood consumption translates directly in reduced expenditure for energy. In the case of improved stoves for domestic use only, two out of four studies showed savings of EUR 13-45 in Kenya, Sudan and Madagascar per household per year, which is –relative to the household income – significant. The other studies indicate that the replacement of open fire cooking by improved wood stoves produces little or no savings in terms of money due to the rebound effect (a change in cooking behaviour that leads to higher energy consumption, for example by having hot water throughout the day). Another reason can be that wood is gathered for free (and the opportunity cost of time is perceived to be – close to – zero).
| 16 |
Executive summary
Direct income generation from PV installations is restricted to micro home enterprises making use of extended working hours after nightfall. Six out of seven studies report minor impacts of PV use for productive income. For domestic use, the shift from kerosene, paraffin and candles to PV electricity implies a reduction of 10-12% in expenditure for lighting. In practice, however, electricity enables households to use appliances they did not use before, and hence the household energy expenditure increases by 20 to 50% (Benin, Rwanda, Kenya, Zambia and South Africa). A longitudinal study in South Africa indicated that energy expenditure increases consistently, but since the income of electricity users increases more than income of non-users, the relative share of expenditure on energy decreases over time.
The claim that clean energy is central to poverty reduction in developing countries cannot be corroborated, since the poor are either excluded from the direct benefits or they are late adopters. Extension of the electrification grid favours the non-poor in the short run, but gradually distribution becomes more equitable as electrification coverage expands over time. An indirect income aspect in the long term is shown by studies in Bangladesh, Benin, Ghana, South Africa, India and Vietnam. Research over a 17-year period in India showed that the per capita expenditure on energy had increased substantially for all income brackets, but relatively more for connected households. But the higher expenditures were affordable thanks to relatively higher incomes. Households with access to electricity were better off within each bracket. A longitudinal study in Vietnam came to a comparable conclusion: household income of connected families increases relatively more over time. Radio, television and mobile phones all need electricity leading to higher energy expenditure, but these devices expand the family’s horizon in life and contribute to commercial activities, leading to higher income.
6. Both improved stoves and (renewable) electricity have a positive impact on health.
Efficient combustion of improved stoves leads to less smoke and hence less indoor air pollution. The health effects, in particular on women and children have been evaluated from different professional angles, but mainly by medical research institutes. There is paramount evidence that respiratory disease (both acute and chronic) symptoms and eye infections are directly associated to indoor air pollution and improved stoves have a significant positive impact on health. In practice however, a determining factor is the type of stove employed. Transportable stoves used in the open air do not have a similar impact as fixed stoves with a chimney. The majority of research on indoor air pollution effects has been conducted in Guatemala, Mexico and India. There are no significant differences reported among studies conducted in Asia or Latin America. Only few solid impact evaluations on improved stoves in Africa have been conducted, also since the improved stoves are portable, smaller in size and often without a chimney, hence less health impacts are to be expected.
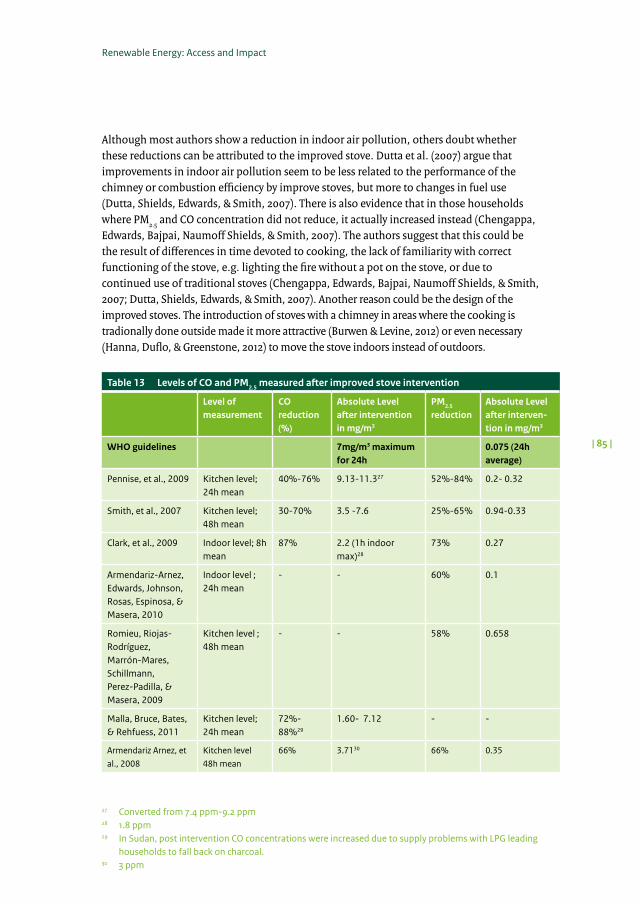
Nearly all studies indicate that measured kitchen levels of carbon monoxide (CO) and particulate matter (PM) reduce significantly when improved stoves are being used. The cooking behaviour is a critical factor. In India for example, the potential health impacts
Renewable Energy: Access and Impact
| 17 |
were off-set by the fact that the improved stove was equipped with a chimney: this appealed to move the stove indoors instead of the traditional outdoor cooking. Programmes aimed at only changing cooking behaviour (hence without the hardware), hardly produced any impact, as shown by research in China and Madagascar. Other health aspects related to fuelwood gathering and transportation have been researched as well, like bruising, knee injuries, neck ache, and back ache (Parikh, 2011).
The association between the change to electricity and health is less studied. Two studies assessed the importance of electricity for the ‘cold chain’ for vaccines. Indoor air pollution caused by lighting devices refers almost exclusively to kerosene lamps. Four studies report that indoor smoke and soot from the combustion of kerosene is related to catarrh and headache. One study (IEG, 2008) registered even harmful mental development of children. In the short run, the impact of PV-electricity on health is minor only, since households initially continue to use traditional lamps next to electricity.
7. Whether the introduction of improved stoves or PV-electricity leads to time savings is uncertain.
Improved stoves may save time to its users by either a reduction of the time needed for gathering or buying wood or dung; or by reducing the time needed for cooking; or both. Two out of six evaluations found substantial time savings in wood gathering or buying, varying from several minutes to a few hours per day. However, one of the studies indicates that if fuelwood is gathered at very large distances, the time needed hardly changes, but smaller quantities were carried per trip. If fuelwood was mainly purchased, the time savings are negligible. Four out of six studies indicate reduced cooking time, but mainly based on perceptions. If objectively verified, cooking time savings are not evident, since other dishes might be prepared that needs more simmering (Hanna et al, 2012).
Three studies indicate that since fuels for lighting are usually available from local retailers (kerosene, candles), the time spent on buying fuels for lighting hardly changes when households get access to PV or grid electricity.
8. The impact of new energy sources or appliances (in particular electricity) evolves over time, leading to changes in human behaviour and gradually affecting social factors.
Improved stoves and biogas digesters may lead to changes in cooking behaviour and consumption patterns. Programmes introducing electricity claim that light contributes to feelings of safety, enables children to study at night and the adults to produce more. In addition, electricity is needed to make use of modern communication and entertainment appliances. Evaluations indicate that all these assumptions can be confirmed, but not everywhere and not always. Connection to electricity has an important impact on time management at household level: shifting domestic tasks to evening hours; increasing time spent on reading or doing home business; and watching television. The additional time available compared to traditional lighting fluctuates between one and three hours per day.
| 18 |
Executive summary
Only one study (Bensch et al., 2012), conducted in Senegal, has quantitatively assessed how electric lighting affects feelings of security. The study concludes that having bright light inside and around the house contributes to reduce fear for the dark in general.Eight out of 10 evaluations indicate that in households with electricity, children do study more at home and both school enrolment and number of years at school completed increased. The other two studies indicate that PV power is mainly used for watching television. The better school performance however, was not significantly associated to additional study hours at home, but to the connection of the schools to electricity, enabling the school to attract better teachers and to offer better education. Also watching television leads to better school performance.
Seven evaluations indicate that the primary story to tell about the impact of electricity is not lighting, but communication: television, mobile phones and the internet. Mobile phone communication is predominantly rural-urban and a high 35% of all calls are explicitly related to commercial activities of any sort (studies in Zambia and Kenya). Communication has triggered the desire for education, it opens up new markets for local business, and appeals young people to adopt an urban lifestyle. The urban lifestyle encompasses a lower fertility; less acceptance of domestic violence (South Africa, Indonesia, Zambia); increased school enrolment of girls; and increased female participation in the labour force. Social research in Indonesia (Olken, 2009) found that the expansion of television can also lead to a deterioration of community organisation and the loss of social capital in the rural areas.
9. Market variables determine whether access to energy triggers productive activities.
The productive use of thermal energy (stoves) has hardly been researched, except studies about energy intensive agricultural processing (like tea and tobacco leaf curing). Eight evaluations indicate that direct income generation from PV installations is restricted to micro home enterprises making use of extended working hours after nightfall. The percentage of home industry out of the total number of households varies from close to zero to over 30% (Kenya, India). However, the additional earnings are modest, due to market limitations in the rural environment (distance, lack of purchasing power). The economic viability of using PV light by micro home enterprises in Bangladesh was assessed by applying cost-benefit analyses per enterprise, showing that these productive activities contribute mainly to reduce the pay-back period for the investment in the solar installation (Hossain Mondal, 2010).
Electricity may contribute to income generation and employment if higher voltage services are delivered, hence from (mini-) grids. A study in 10 African countries showed that immediately after electrification had arrived, the number of newly established enterprises increased substantially. However, many of these initiatives were discontinued soon afterwards, due to undefined and isolated markets, lack of infrastructure and low purchasing power within the rural areas. Longitudinal studies indicate that after a decade, even in countries with a high level of micro home enterprises like Vietnam, the use of electricity for productive purposes stabilizes at approximately 10 % of the households. 10. The impact on the environment is at best modest.
Renewable Energy: Access and Impact
| 19 |
There is no international standard for a stove to be labelled as ‘improved’. A commonly used threshold is that it should be 40% more fuel efficient as compared to a three-stone stove. Improved stoves and biogas installations do reduce firewood consumption in laboratory settings. At household level, it is crucial how the appliance is actually being used. Depending on measurement systems, savings in real kitchen use are 20-40%, for both simple portable stoves and larger fixed ones alike.
Whether real benefits in CO2 emissions can be registered, depends on the household’s cooking behaviour. If more cooking time is used, the fuelwood consumption may remain the same as under the traditional system. Improved stoves might be so fuel efficient that they can compete with ‘modern’ ethanol or LPG gas stoves, and hence households step back and retake using firewood (Arnold et al, 2006).
Most impact is expected from improved stoves, and usually evaluations assess the impact on the environment by using models. Evaluations using geographic measurement systems are rare (Mexico, Guatemala, South Africa). A study in South Africa measured the impact from rural electrification by using a satellite monitoring system, indicating that the introduction of both PV and grid electricity had no verifiable effect on slowing down deforestation. Environmental impact assessments of energy devices, like solar energy, are usually based on the operational life only. This overestimates the environmental benefits. The all-encompassing ‘life cycle analysis’ measures the environmental impact of energy sources and appliances in general and the emission aspects in particular. While during the operational life the emission might be zero, this is not necessarily the case when taking the entire life cycle into consideration (for example the manufacturing of crystalline modules for solar panels is energy intensive and requires large quantities of bulk material).
1
Background of the review
Renewable Energy: Access and Impact
| 21 |
The Secretary-General of the United Nations has called for universal access to modern energy (i.e. electricity and clean cooking facilities) by 2030. An estimate by the International Energy Agency (IEA) indicates that well over 1.3 billion people are lacking access to electricity, of which some 600 million are living in Africa. About 40% of the global population relies on traditional use of biomass for cooking (i.e three-stone fires and unimproved stoves). In all countries, the majority of people who rely on biomass for thermal energy and who lack access to electricity live in rural areas. The achievement of the Millennium Development Goals is thought to be dependent on the access to (renewable) energy and for that reason the United Nations had proclaimed the year 2012 the International Year of Sustainable Energy for All. Since the global investment to achieve that goal would be equal to 3% of all investments in the energy sector made, the Secretary-General called the “problem of ensuring universal energy access surmountable” (UNDP, 2012, p. 64).
In 1992, world leaders met at the Earth Summit in Rio de Janeiro. They agreed on a road map for sustainable development of the global society. Important elements to achieve a sustainable future are economic development and investment, while reducing greenhouse gas emissions, increasing resource efficiency and improving human well-being and social inclusion. New renewable technologies such as photovoltaic and biofuels were introduced, developed and adopted. In 2012, investments in renewable energy have almost reached the level of investments in power generation based on fossil fuels. Globally, the investments in green energy have passed USD 250 billion per year (Frankfurt School; UNEP Collaborating Centre for Climate and Sustainable Energy, 2012). Increasingly, clean energy is provided to people around the globe. However, in various of the poorest countries, a large fraction of the population is unable to access modern energy services and relies on biomass or dung as fuel for cooking and heating; and on kerosene wick lamps, batteries and candles for lighting. The largest concentrations of the ‘energy poor’ – that means those people who are both poor and who lack access to modern forms of energy – are found in sub-Saharan Africa and South Asia (Modi, McDade, Lallement, & Saghir, 2005).
Inspired by the Earth Summit 1992, access of the poor to energy has been part of the development cooperation by the Netherlands. The Ministry of Foreign Affairs’ standing policy on environment and renewable energy dates July 2008, but is subject to modification (2012). According to the 2008 policy, it is the ministry’s goal that investments in (renewable) energy contribute to poverty reduction1 and to mitigate the negative effects of energy use on the climate.2 The goal mentioned is to be achieved by supporting governments in developing countries to develop and implement – in cooperation with private and public organisations – ‘good and coherent’ policies with regards to renewable energy. The Dutch approach is to build on to active channels of implementation (i.e. World Bank, Gesellschaft für Internationale Zusammenarbeit - GIZ), using existing capacity and knowledge, while enabling development countries’ governments to strengthen its own capacities. The specific support is offered to four interlinked activities:
1 The access to energy does not directly lead to, but is precondition to the attainment of most Millennium Development Goals.
2 Ministry of Foreign Affairs, Environment and Water Department (DMW), 2008, Beleidsnotitie milieu en hernieuwbare energie in ontwikkelingssamenwerking, July 2008.
| 22 |
Background of the review
1. Direct investments in the production of, and access to, renewable energy in priority countries and regions;
2. Improvement of the sustainability of production of biomass for energy purposes;3. Influencing policy of partners responsible for investment in renewable energy;4. Development of capacity and knowledge in developing countries with regards to
renewable energy.
Implementation of this policy is enabled by a budget input of EUR 500 million for renewable energy in developing countries through the “Promoting Renewable Energy Programme” (PREP, 2008). The geographical focus of the PREP programme is on Sub-Saharan Africa and in particular on the post-conflict region around the Great Lakes, and on Indonesia.
The Policy and Operations Evaluation Department (IOB) of the Ministry of Foreign Affairs has scheduled an evaluation of this policy by 2014. The evaluation will encompass, next to a review of the policy itself, quantitative impact studies in Burkina Faso, Rwanda and Indonesia. The central research question of the impact studies is “what have been the effects on living conditions of target groups – positive or negative, intended or unintended – of the energy and development cooperation programmes and projects supported by the Netherlands and how sustainable are the achieved results”3.
The policy evaluation is underpinned by a systematic literature review, presented in this report. The review encompasses existing quantitative and qualitative effect studies, as well as thematic evaluations in the area of renewable energy in developing countries (for Terms of Reference, see Annex 3).
The report is structured as follows: after a presentation of the main objective and research questions of the review (chapter 2) and the method applied for the review (chapter 3), a general overview is presented of the quality of the literature studied (chapter 4). Chapter 5 starts with conceptual framework of the energy ladder and energy stacking and subsequently presents the findings regarding adoption of renewable forms of (modern) energy. The next chapters deal with different forms of impact, being the impact on income and expenditure of households (chapter 6), on health (chapter 7), on social variables (chapter 8) and on the environment, in particular CO2 emission (chapter 9). Chapter 10 deals with the private sector development and sustainability of impacts in relation to the institutional environment.
3 Terms of Reference (ToR), September 2009.
Renewable Energy: Access and Impact
| 23 |
Objective and research questions
2
Renewable Energy: Access and Impact
| 25 |
2.1 Objective of the review
This report presents a systematic review of literature and reports about the access to – and the use of – (renewable) energy at the household and community level in developing countries. It aims at providing a comprehensive information source on findings in the literature regarding the impact of energy on the livelihood of end-users. It may assist in providing insight in ‘what works where and why’ to both policy makers and practitioners of renewable energy interventions in developing (and middle income) countries. The objective of this review is to obtain an overview of existing effect studies and thematic evaluations in the area of renewable energy use at individual, household, community and/or District level in developing and middle-come countries.
The following types of energy sources or carriers have been included in the review: biogas digesters; improved cooking stoves; solar energy (solar home systems, and solar lamps); grid distributed energy supply generated by renewable resources in rural areas and the urban periphery; hydro-power energy (mini and pico hydro power installations) for individual use or off-grid application; and locally produced biofuels used at household or community level.
2.2 Concepts used
The review uses the following definitions:
• Renewable energy: ‘any naturally occurring, theoretically inexhaustible source of energy, as biomass, solar, wind, tidal, wave, geothermal, and that is not derived from fossil or nuclear fuel’.4
• Sustainable energy: ‘long-term availability of energy services, avoiding negative economic, social and environmental impacts’ (International Energy Agency, 2011).
• Access to energy is defined either from a demand or a consumption perspective to include energy services that improve living conditions (e.g. electricity for lighting and fuel for cooking) and enables social services and economic production (e.g. cooling of medicines, communication, manufacturing).5 This is related to the concept of basic energy services that are required by people to fulfill their basic needs (nutrition, safe drinking water, housing, social services, access of information, and participation in social life). Having not fulfilled these basic needs as a result of the lack of energy, this is sometimes called ‘energy poverty’.
• Access to modern energy: ‘a household having reliable and affordable access to clean cooking facilities and a first connection to electricity for at least 250 kWh per year (rural areas)’ (International Energy Agency, 2011, pp. 12, box 1).
4 Modified from the definition used by Sabine Häusler, Marcel Spijkerman and Wouter Zant in Baseline Data Collection For Impact Evaluation of Netherlands Supported Energy Programs. A preparatory desk study. SEOR, September 2008.
5 SEOR, 2008, Accountable in Silence. Evaluation Dutch/German Partnership ‘Energising Development’ report to Environment and Water Department (DMW), Ministry of Foreign Affairs, the Netherlands. Chapter 1.1.
| 26 |
Objective and research questions
• Interventions: projects, programmes and policies by government, international and national non-governmental organisations, international financing organisations and international agencies.
• Energy market: encompasses the activities by commercial energy providers and distributors aimed at the household and/or community level. Next to the energy market exists an
• Energy appliances market, which encompasses the activities by commercial manufacturers, distributors and retailers aimed at selling energy appliances (be it solar equipment, electrical equipment, cooking stoves or biogas burners) to households and other consumers.
2.3 Research questions
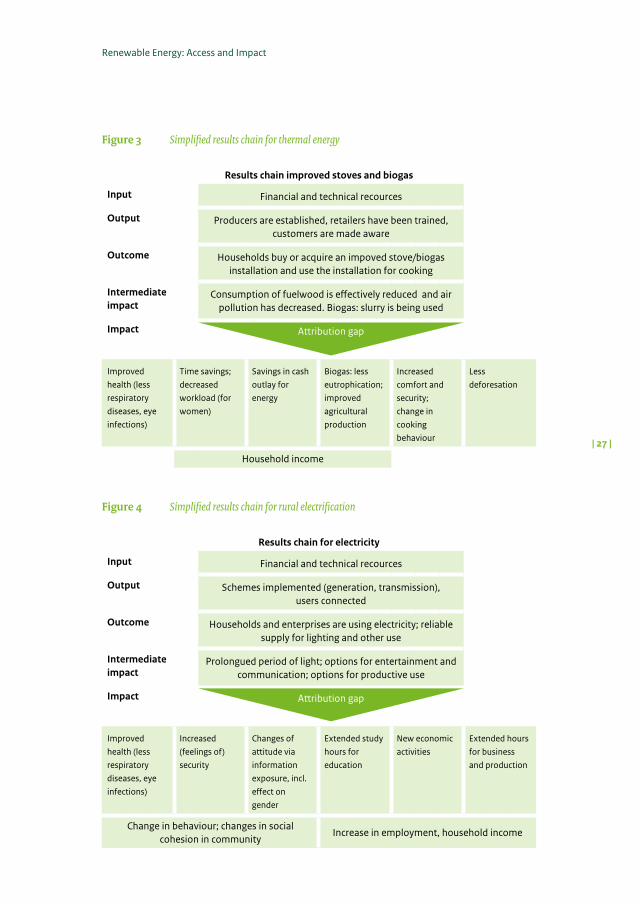
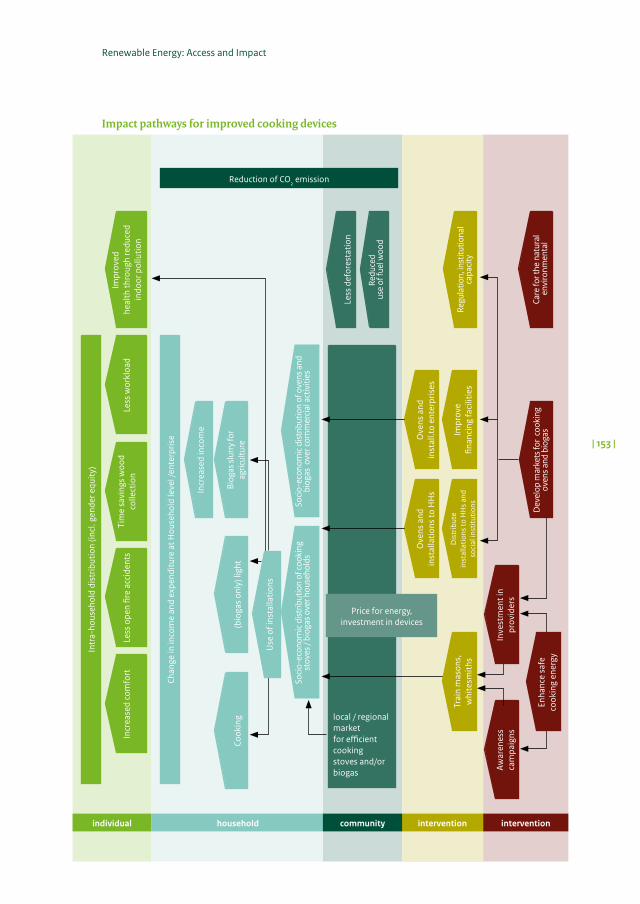
The research questions have been derived from the results chain of interventions in renewable energy. A results chain summarizes what kind of output is supposed to be produced by the input (usually financial means, technical knowledge, legal frameworks). And subsequently what kind of outcome and impact can be expected resulting from the output. The steps in this results chain follow the reasons for justification used for the intervention itself. For renewable energy a basic distinction has to be made between energy for heating (thermal energy) and energy for lighting and power (mostly electricity). For thermal energy, this review is restricted to improved stoves and biogas installations. Interventions by means of these two devices have several features in common: both aim at an effective reduction of firewood consumption, as well as the related reduction of indoor air pollution in the cooking environment. For both interventions the impact impinges on dimensions of poverty, like health, income, female empowerment and the natural environment. For biogas, there is the additional impact resulting from the use of the waste product (‘slurry’) as organic fertilizer in agricultural production. Figure 3 presents a simplified results chain for thermal energy. A more elaborate results chain is presented in Annex 3.
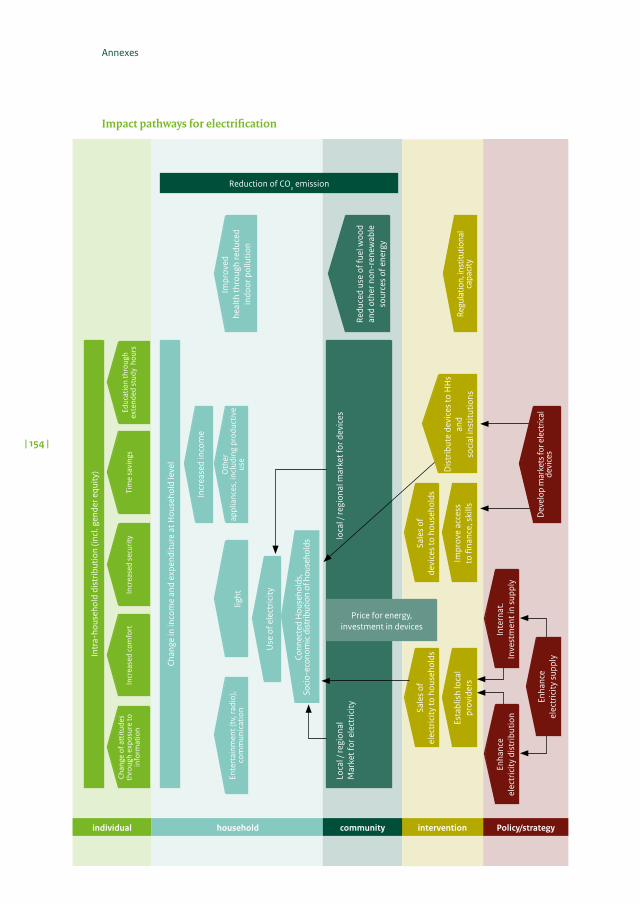
The renewable energy sources for electricity encompass pico6- and micro hydro electricity generation and solar energy. The results chain for lighting (electricity) is characterized by variations in application opportunities: lighting, entertainment and communications are expected results for both high and low power electricity, while productive use depends – to a large extent – on power. If the use is for lighting only, the impact can be compared to the traditional sources of light, such as kerosene or paraffin lamps, candles and the like. Entertainment and communication applications are predominantly additional, since these are hardly replacing existing applications. Figure 4 presents a simplified results chain for rural electricification. A more elaborate results chain is presented in Annex 3.
6 Pico hydro installations are small devices that generate electricity for one single household or one single application (a small water pump, for example).
Renewable Energy: Access and Impact
| 27 |
Figure 3 Simplified results chain for thermal energy
Results chain improved stoves and biogas
Input Financial and technical recources
Output Producers are established, retailers have been trained, customers are made aware
Outcome Households buy or acquire an impoved stove/biogas installation and use the installation for cooking
Intermediate impact
Consumption of fuelwood is effectively reduced and air pollution has decreased. Biogas: slurry is being used
Impact Attribution gap
Improved health (less respiratory diseases, eye infections)
Time savings; decreased workload (for women)
Savings in cash outlay for energy
Biogas: less eutrophication; improved agricultural production
Increased comfort and security; change in cooking behaviour
Less deforesation
Household income
Figure 4 Simplified results chain for rural electrification
Outcome Households and enterprises are using electricity; reliable supply for lighting and other use
Intermediate impact
Prolongued period of light; options for entertainment and communication; options for productive use
Impact Attribution gap
Improved health (less respiratory diseases, eye infections)
Increased (feelings of) security
Changes of attitude via information exposure, incl. effect on gender
Extended study hours for education
New economic activities
Extended hours for business and production
Change in behaviour; changes in social cohesion in community
Increase in employment, household income
| 28 |
Objective and research questions
The review deals with the outcomes, intermediate impacts and impacts of four renewable energy sources and appliances: • improvedcookingstoves;• biogasdigesters;• solarhomesystemsandsolarlamps;and,• microhydro-powerenergy.
Other forms of energy generation for individual use or off-grid application, like LPG for cooking; diesel fuelled mini-grids for electrification; wind energy and the like have not been excluded, but were not explicitly included in the search. The review refers to articles and reports concerning energy supply in rural areas (in the first place) and the urban periphery in developing countries.
The review refers to the impact on affected individuals (m/f ), households, public facilities and small enterprises. The ‘greening’ of the electricity grid has not been subject of review. The impact on macro variables, such as climate change7 or deforestation at national or international level, has not been subject of explicit search neither.
The research questions that will be addressed are:
1. What is known (and not) about the direct and indirect links between access to (renewable) energy, use of renewable energy, income and expenditure and poverty reduction, focusing on:
• theadoptionrate(numberofindividuals[m/f ],households,communities)ofrenewable energy technology and energy-related products and/or services as compared to non-renewable sources;
• whatisknownaboutchangingpatternsofinvestmentbyend-users(toadoptforrenewable energy for their development)
7 The effects on the climate are core to the policies of the Government of The Netherlands that promote the use of renewable energy. The subject however, merits a separate systematic literature review.
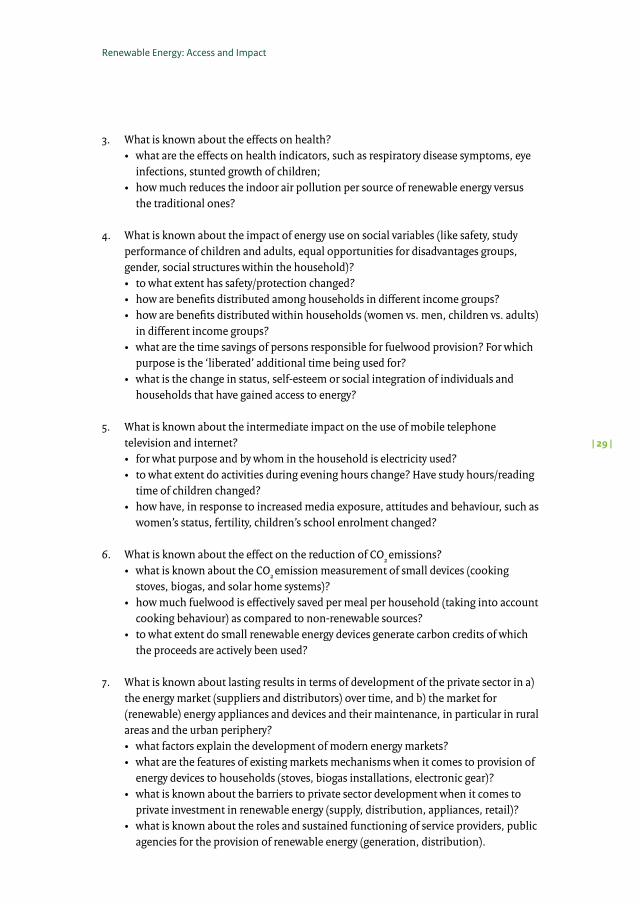
infections, stunted growth of children; • howmuchreducestheindoorairpollutionpersourceofrenewableenergyversus
thetraditionalones?
4. What is known about the impact of energy use on social variables (like safety, study performance of children and adults, equal opportunities for disadvantages groups, gender,socialstructureswithinthehousehold)?
7. What is known about lasting results in terms of development of the private sector in a) the energy market (suppliers and distributors) over time, and b) the market for (renewable) energy appliances and devices and their maintenance, in particular in rural areasandtheurbanperiphery?
agencies for the provision of renewable energy (generation, distribution).
| 30 |
Objective and research questions
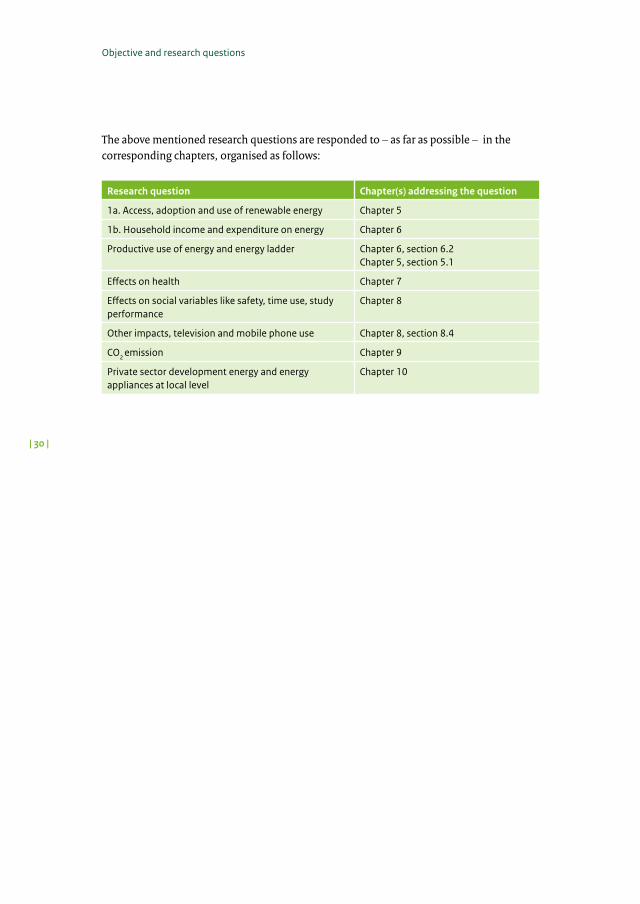
The above mentioned research questions are responded to – as far as possible – in the corresponding chapters, organised as follows:
Research question Chapter(s) addressing the question
1a. Access, adoption and use of renewable energy Chapter 5
1b. Household income and expenditure on energy Chapter 6
Productive use of energy and energy ladder Chapter 6, section 6.2Chapter 5, section 5.1
Effects on health Chapter 7
Effects on social variables like safety, time use, study performance
Chapter 8
Other impacts, television and mobile phone use Chapter 8, section 8.4
CO2 emission Chapter 9
Private sector development energy and energy appliances at local level
Chapter 10
Renewable Energy: Access and Impact
| 31 |
3
Overview of the methods of the review
Renewable Energy: Access and Impact
| 33 |
3.1 Systematic review
Within the context of IOB evaluative research, the function of systematic reviews is to become acquainted with the evidence concerning the effectivity of the Dutch policies and intervention approaches. To IOB’s own research findings, the literature review serves as a benchmark based on international experiences and hence helps to assess whether IOB’s findings can be either generalised or should be considered as entirely determined by the specific context of the interventions evaluated.
For this systematic review, the ‘realist evaluation approach’ (Knaap, Leeuw, Bogaerts, & Nijssen, 2008) has been applied. This approach is a variant of the systematic review as defined by the Campbell Collaboration protocol (C2 protocol)8 and better equipped to take context factors into consideration (and hence to address ‘how, where and why’ questions).
A systematic review uses transparent procedures (determined in advance) to find, evaluate and synthesize the results of relevant research. Systematic reviews help to package evidence in an accessible way and focus on the quality of literature, by separating the ‘evidence’ from the ‘interesting cases’.
The realist evaluation approach is based on the guidelines and procedures mentioned in the protocol of the Campbell Collaboration. Campbell Collaboration is a researcher network that produces and supports systematic reviews. Key components of this protocol are:• clearcriteriaforinclusion/exclusionsetinadvance;• anexplicitsearchstrategy;• systematiccodingandanalysisofincludedstudies;• meta-analysisofthefindings(wherepossible).
The realist approach deviates from the Campbell Collaboration protocol by applying a first ‘quick screening’ on methodology of the literature and by allowing for more context specific factors9 in the results (see for details Annex 3).
3.2 Inclusion and exclusion criteria
The review used two types of selection criteria: criteria related to the evaluation subject and criteria related to the evaluation quality.
8 Guiding Principles for The Methods Groups of The Campbell Collaboration (2002). www.campbellcol-laboration.org.
9 The Campbell Collaboration prescribes that all literature classification and codification should be done independently by two researchers. Due to time and budget restrictions most of the articles and reports were reviewed by a single researcher only.
| 34 |
Overview of the methods of the review
Criteria related to the evaluation subjectThe unit of analysis are the relevant reports and documents concerning the effects and impact of intervention in renewable energy. The effects concern affected individuals (m/f ), households, public facilities and small enterprises in communities in developing and middle income countries. This implied a geographic restriction: only research carried out at either world-wide level and/or concerning developing (GNI/pcpa below USD 1006) and middle-income (GNI/pcpa between USD 1006 and 3975) countries in Africa, Latin America and Asia has been included. Studies that refer explicitly to higher income countries such as European countries, North America or Oceania have been excluded.
The intervention logics for different sources of renewable energy determine the subject matter criteria:a) Forms of renewable energy that is (mainly) used for cooking, combustion and heating
(fuel-efficient cooking stoves, biogas, and locally produced and used biofuels10). b) Forms of renewable energy that bring electricity at household or community level:
solar energy (solar home systems and solar lamps); geothermal energy and hydro-energy (micro and pico-energy).
Since the results of the review findings will be used as a reference point or benchmark for evaluative research to be conducted by IOB, the review applied a publication date restriction, based on the start of the Dutch policy on renewable energy (2004). This implies that only reports and articles published during the period 2004-2012 have been included. Research based on data that exclusively date back to years prior to 2000 have been excluded as well, unless these formed part of longitudinal time series. The review also applied a language restriction: only reports in the English language were taken into consideration.
Criteria related to the evaluation qualityA main quality selective criterion is that the presented results can be attributed to the intervention by a plausible counterfactual analysis. Preferably this is done by using either econometric models, application of multivariate analysis or by using rigorous methods (difference-in-difference; randomized controlled trial, cross-sectional analysis). The minimum criterion applied was that the observed results should have been contrasted with a counterfactual ( ‘before-after’ or ‘with-without’ comparison).
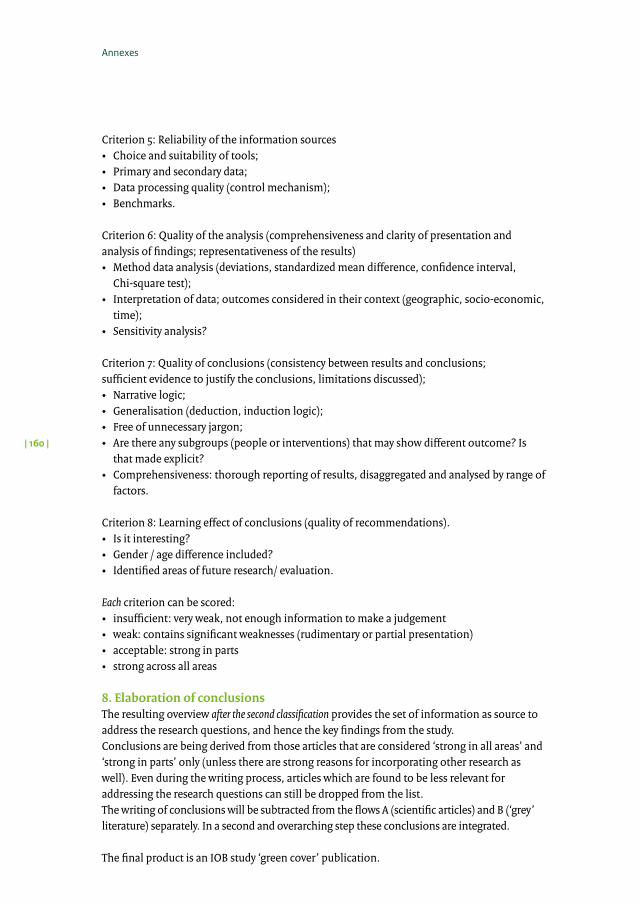
For assessing the quality of evaluations, eight criteria11 have been be applied: 1. a theoretical basis and a clear definition of research questions; 2. a clear definition and demarcation of the evaluation object; 3. a suitable evaluation/research design; 4. a clear evaluation/research methodology; 5. reliability of the information sources; 6. quality of the analysis (comprehensiveness of presentation; representativeness of
the results);
10 The impact of biofuels to generate electricity is considered as electricity supply at household level.11 Based on: IOB Evaluation policy and guidelines for evaluation. October 2009.
Renewable Energy: Access and Impact
| 35 |
7. quality of conclusions (consistency between results and conclusions; limitations discussed);
8. Learning effect of conclusions (quality of recommendations).
The assessment method is explained in Annex 3, section 7.
3.3 Search strategy
The review started with the search for evaluations and studies regarding renewable energy. The search consisted of two different entries:A. Scientific Journals and Web of ScienceB. Development organisations portals
At a later stage so-called ‘snowballing’ was applied, being the identification of in-text references of relevance that were not identified during the search process.
Scientific Journals The first entry was on-line libraries and search engines aggregating academic research and published journals. The journals were accessed through the inter-university database of e-journals linked to publisher’s websites (Web of Science). In a few cases use was made of general search machines like GoogleScholar. An inventory of scientific journals with either ‘sustainable energy’ or ‘renewable energy’ in the title produced 13 names. Broadening the inventory to the word ‘energy’ only produced 26 different names of journals. These coincide to a large extent with the 2012 ‘Thomas Reuters’ Journal Citation Reports in the category ‘Energy and Fuels’. Part of these journals, however, are devoted (mainly) to the energy or electricity sector in Europe, the United States, Japan, Australia and other industrialized countries or to technical topics only. Articles concerning the research about the relation between energy and socio-economic features are mainly found in four journals: Energy Economics; Energy for Sustainable Development; Renewable and Sustainable Energy Reviews (ranking 15 in Thomas Reuters’ citation list) and Energy Policy (ranking 7 in the Thomas Reuters list). This coincides with comparable literature reviews like the one conducted by Karanfil (Karanfil, 2009): next to Energy Policy (57 articles), the Energy for Sustainable Development (87 articles) contained most articles that matched the subject of search. Full search based on titles and abstracts has led to articles identified in 92 different journals. While the journal Energy for Sustainable development delivered 12 articles that were selected for this review, none of the other 91 journals produced more than 3 articles that have been selected on quality in this review.
Portals of Development OrganisationsAn effort was made to identify suitable ‘grey’ literature, being evaluation reports available from development organisations and institutions websites, together with portals of donor governments. The main reason for including the grey literature is that these evaluations
| 36 |
Overview of the methods of the review
refer more specifically to identifiable interventions and provided more specific information about project design, costs, and context factors. The disadvantage is that these documents are usually not ‘peer reviewed’. In the review methodology, the ‘grey literature’ was treated in the same way as academic articles and several were definitely not of a methodologically inferior quality. Some ‘grey literature’, received high methodological scores, and has been included in the list of selected (admitted) literature. Selected references at the end of the chapter show the overall quality of the report or article; annex 2 lists all references used.
Search procedure
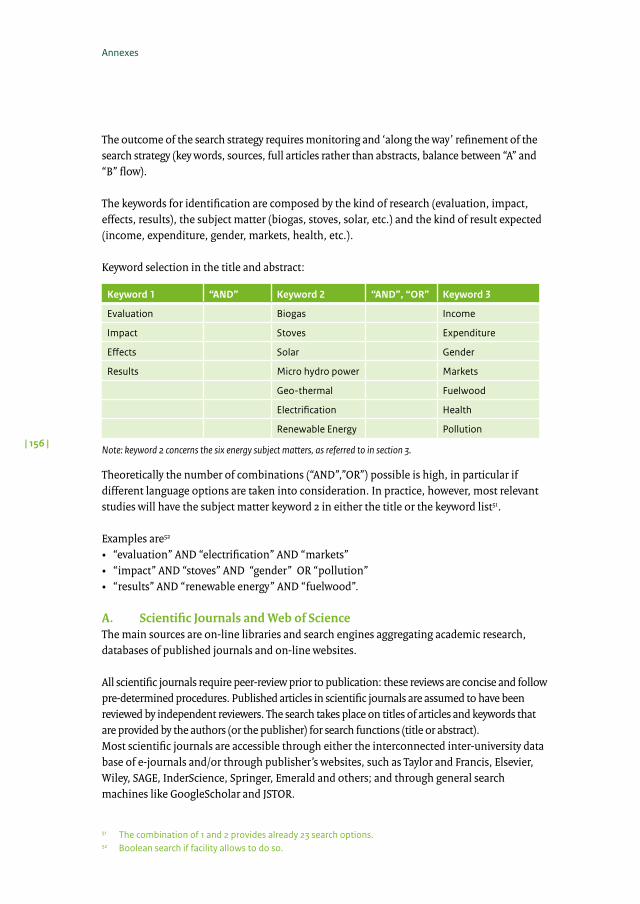
Step 1: keyword searcha) For the scientific journals use was made of the keyword options in title and topic
Series 1: ‘evaluation’ (OR ‘impact’ OR ‘effects’) AND ‘renewable energy’ (OR ‘stoves’ OR ‘solar’ OR ‘micro hydro’ OR ‘geothermal’ OR ‘electrification’ OR ‘biogas’) AND ‘income’ (OR ‘expenditure’ OR ‘gender’ OR ‘markets’ OR ‘fuelwood’ OR ‘health’ OR ‘pollution’)12
Series 2: ‘renewable energy’ (OR ‘stoves’ OR ‘solar’ OR ‘micro hydro’ OR ‘geothermal’ OR ‘electrification’ OR ‘biogas’) AND ‘income’ (OR ‘expenditure’ OR ‘gender’ OR ‘markets’ OR ‘fuelwood’ OR ‘health’ OR ‘pollution’)
b) For the portals of the development organisations the search options are usually limited to a ‘find’ function within the website and advanced (Boolean) search options were not available.
Keywords used were: ‘evaluation’ (OR ‘impact’ OR ‘effects’) AND ‘renewable energy’ (OR ‘stoves’ OR ‘solar’ OR ‘micro hydro’ OR ‘geothermal’ OR ‘electrification’ OR ‘biogas’).
Step 2: Screening of the title and the abstract onlyThe main question addressed here is if the article seems to be an evaluation and if the subject corresponds to the evaluation subject, the geographic restriction, the publication date restriction. Obviously some reports did not qualify at first sight and were excluded. The remainder articles and reports were included and registered in the data base.
Step 3: quick-screening on methodology appliedThe main question addressed was whether the article or the report was an evaluation indeed, (and not for example an opinion article), and if positive, if it used a reliable counterfactual analysis (e.g a ‘with-without’ analysis). A registration in a coding sheet was made of (i) the kind of energy source subject to research or evaluation (ii) the kind of evaluation method applied (iii) the geographical focus of the study or subject; (iv) the quality of the evaluation design and the sampling and (v) whether the report contained explicit conclusions.
12 Since the 147 combinations produced 114 titles only, in the second series the key words ‘evaluation’, or ‘impact’ or ‘effects’ were left out.
Renewable Energy: Access and Impact
| 37 |
The qualifications on these topics could be either ‘strong’, ‘acceptable’, ‘weak’ or ‘insuffi-cient’. For example, regarding the geographical focus, a study dealing with renewable energy in a developing or middle-income country was classified as ‘strong’; in a BRICS-country as ‘average’; worldwide as ‘weak’ and Europe, USA, Canada etc as ‘insufficient’.• Reportsorarticlesthatdidnotuseacounterfactualanalysiswereexcluded.Infact,many
articles and reports fell short on this point.• ReportsqualifiedasInsufficient(notanevaluation,geographicalfocus,noclear
conclusions; data used are all prior to the year 2000; if the article has the methodology or the theoretical background as subject, but not the evaluative results of energy use) were excluded.
• Reportsthatscoredsufficientonthecriteriaweremaintainedforthe‘allcriteria’analysis.All these reports have been downloaded and electronically stored.
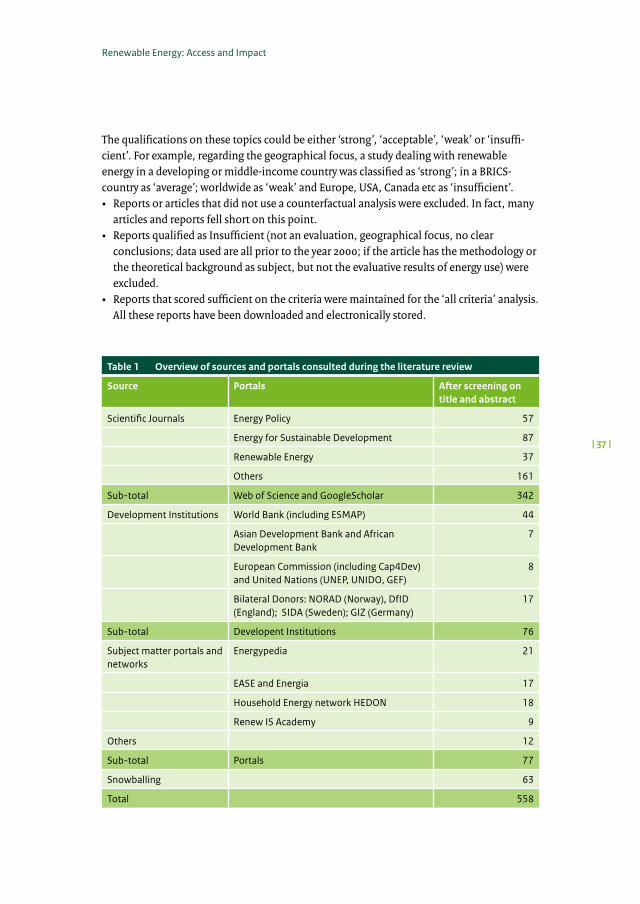
Table 1 Overview of sources and portals consulted during the literature review
Source Portals After screening on title and abstract
Scientific Journals Energy Policy 57
Energy for Sustainable Development 87
Renewable Energy 37
Others 161
Sub-total Web of Science and GoogleScholar 342
Development Institutions World Bank (including ESMAP) 44
Asian Development Bank and African Development Bank
7
European Commission (including Cap4Dev) and United Nations (UNEP, UNIDO, GEF)
Step 4: All criteria analysis The second classification is an extension of the quick screening. The articles and reports that passed the first threshold were made subject to further analysis based on the eight quality criteria indicated above. The analysis was registered in the coding sheet. Based on the analysis, the articles were classified according to the following groups:
Table 2 Categories of Classification of articles
Category Excellent quality Good quality Sufficient quality Insufficient quality
Conclusions No doubt about conclusions
Limited number of beneficiaries or specific circumstances limit the reach of the conclusions
Conclusions should be taken as indications only
Rejected
Number of criteria
All criteria score sufficient
1 or 2 criteria score insufficient
Max 3 criteria score insufficient
More than 3 criteria score insufficient
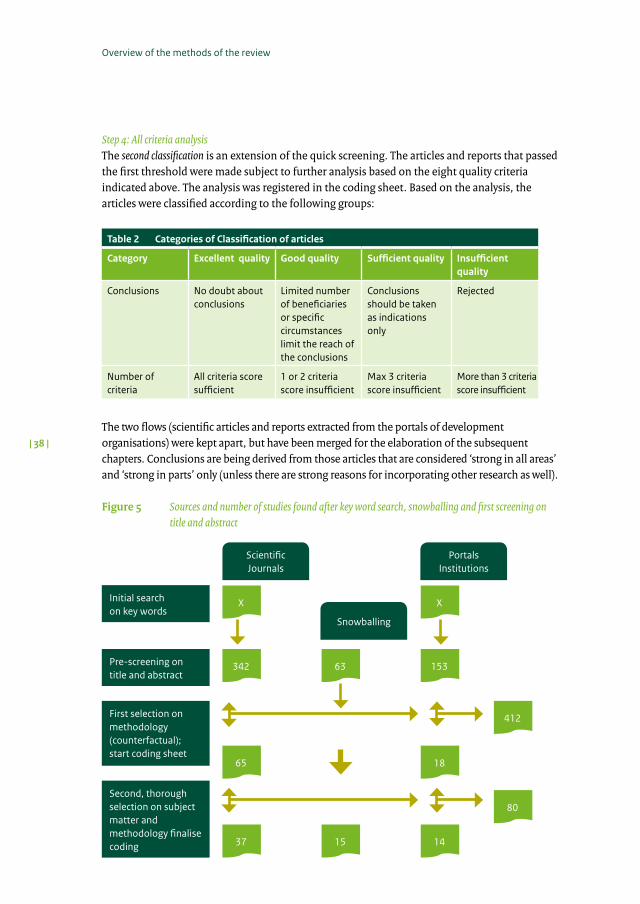
The two flows (scientific articles and reports extracted from the portals of development organisations) were kept apart, but have been merged for the elaboration of the subsequent chapters. Conclusions are being derived from those articles that are considered ‘strong in all areas’ and ‘strong in parts’ only (unless there are strong reasons for incorporating other research as well).
Figure 5 Sources and number of studies found after key word search, snowballing and first screening on title and abstract
Initial search on key words
Scientific Journals
Portals Institutions
Snowballing
Pre-screening on title and abstract
First selection on methodology (counterfactual); start coding sheet
Second, thorough selection on subject matter and methodology finalise coding
342 15363
65 18
412
80
37 1415
X X
Renewable Energy: Access and Impact
| 39 |
As indicated in figure 5, in the first selection 412 reports and articles were disregarded for further consideration. The main reasons for rejection were: • Thereport/articledidnothaveanyevaluationofinterventionsasprinciplesubject,but
either explained a policy or approach, or provided technical information, or contained a cost-benefit assessment for future investment, a forecasting of future energy use or expressed an opinion (184 cases);
• Thereport/articledidnotdealwithdevelopingormiddleincomecountries,butwithEuropean countries, the United States of America, Canada, Japan or other industrialized countries (49 cases);
• Thearticleorreportbasicallydealtwithadifferentsubject(forexampleoutdoorairpollution) or dealt with energy from an exclusively technical perspective (for example solar absorption capacity) (39 cases);
In the second selection, the remaining 146 reports were assessed against the eight quality criteria exposed in 3.2. Eighty reports and articles did not score on at least five of the eight criteria and were rejected. Most of these evaluations were rejected since they lacked a counterfactual (38 cases), and/or used very small sample sizes. Sixty-six (66) reports and articles were selected.
3.4 Attribution of effects
Whether observed changes can be attributed to a particular intervention requires a convincing counterfactual analysis. The counterfactual allows to indicate what would have happened if the intervention would not have taken place. This is ideally done by comparing targeted and non-targeted households or communities, or by more complex models based on multivariate analyses of a population in which individuals participated to various degrees in the intervention. Models are often used to evaluate country-level interventions.
Reports found in the portals of international organisations and institutions (like the World Bank and the United Nations) usually refer to specific external interventions; those who have been affected by the intervention are the so-mentioned ‘treated’ group, while those who were not affected by the intervention are the ‘non-treated’ ones. In scientific articles, the direct effect of specific interventions is less often referred to and instead research focusses on the difference between those who ‘have’ and those who ‘do not have’ a certain service or facility, like electricity. Although ‘treated by a specific intervention’ is – from an evaluative perspective – not the same as ‘those who have’ a certain feature (for example a specific characteristic of the target group, and difference in self-selection) both types of research objects have been accepted in this review. For all studies this review required that the assessment of effects was based on a solid counterfactual. Energy, both thermal and lighting and communication are influenced by an array of developments in society. The importance of a counterfactual can easily be understood in the case of renewable energy interventions. New products are entering the market, for example solar-powered equipment and in many areas the shortage of fuelwood obliges the rural population to look
| 40 |
Overview of the methods of the review
for alternatives for cooking their food or heating their water. One may not assume that ‘non treated’ groups would continue their lives without any change and without any adoption of alternatives when it comes to energy supply. All reports (for example by development agencies) lacking such a comparison have – for that reason – been excluded from this review.
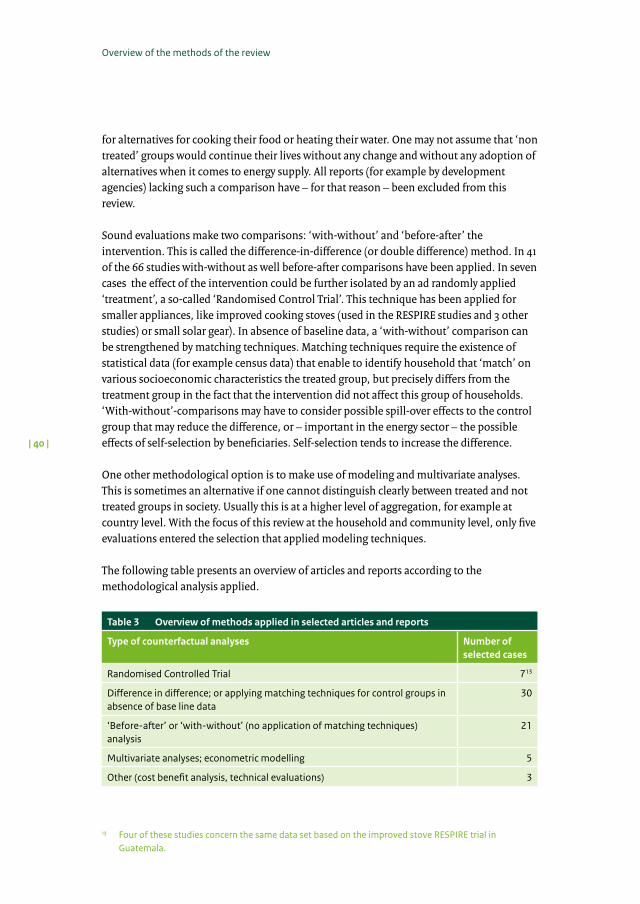
Sound evaluations make two comparisons: ‘with-without’ and ‘before-after’ the intervention. This is called the difference-in-difference (or double difference) method. In 41 of the 66 studies with-without as well before-after comparisons have been applied. In seven cases the effect of the intervention could be further isolated by an ad randomly applied ‘treatment’, a so-called ‘Randomised Control Trial’. This technique has been applied for smaller appliances, like improved cooking stoves (used in the RESPIRE studies and 3 other studies) or small solar gear). In absence of baseline data, a ‘with-without’ comparison can be strengthened by matching techniques. Matching techniques require the existence of statistical data (for example census data) that enable to identify household that ‘match’ on various socioeconomic characteristics the treated group, but precisely differs from the treatment group in the fact that the intervention did not affect this group of households. ‘With-without’-comparisons may have to consider possible spill-over effects to the control group that may reduce the difference, or – important in the energy sector – the possible effects of self-selection by beneficiaries. Self-selection tends to increase the difference.
One other methodological option is to make use of modeling and multivariate analyses. This is sometimes an alternative if one cannot distinguish clearly between treated and not treated groups in society. Usually this is at a higher level of aggregation, for example at country level. With the focus of this review at the household and community level, only five evaluations entered the selection that applied modeling techniques.
The following table presents an overview of articles and reports according to the methodological analysis applied.
Table 3 Overview of methods applied in selected articles and reports
Type of counterfactual analyses Number of selected cases
Randomised Controlled Trial 713
Difference in difference; or applying matching techniques for control groups in absence of base line data
30
‘Before-after’ or ‘with-without’ (no application of matching techniques) analysis
21
Multivariate analyses; econometric modelling 5
Other (cost benefit analysis, technical evaluations) 3
13 Four of these studies concern the same data set based on the improved stove RESPIRE trial in Guatemala.
Renewable Energy: Access and Impact
| 41 |
4
Overview of selected literature
Renewable Energy: Access and Impact
| 43 |
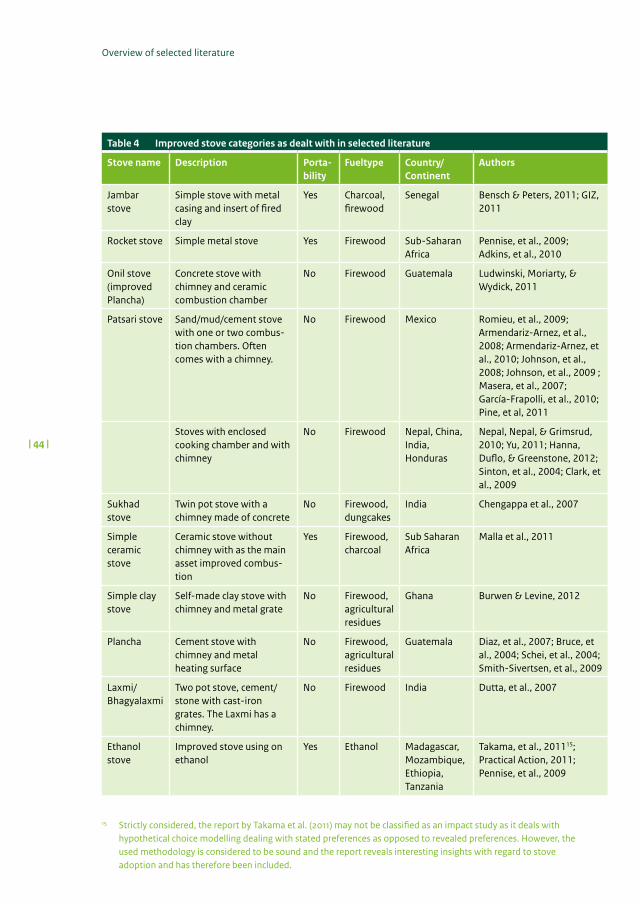
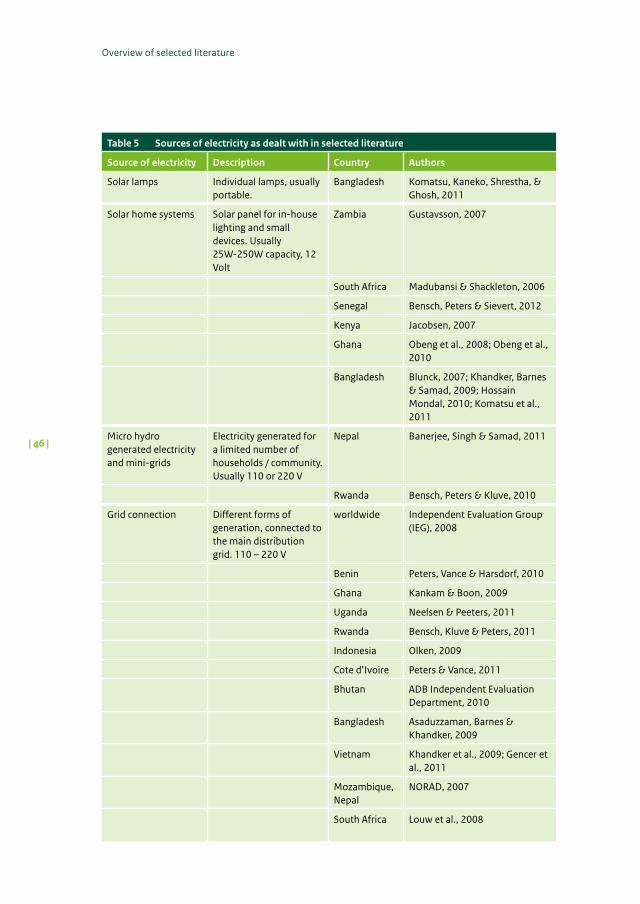
The screening procedure mentioned above has resulted in a total number of 66 articles and reports that serve as the main source of information for this review. These articles and reports comply with the predetermined requisites described in the previous chapter and cover three sources of renewable energy: improved stoves, biogas and electricity (subdivided intoruralelectrificationbasedon[mini-]gridsupply,microhydroelectrificationandsolarenergy). Literature specifically concerning household impacts of geothermal energy was not found.
This chapter starts with a short description of the interventions that are subject of the studies and evaluations, showing the result chains that encompass the different dimensions of impact that each of these interventions aim to achieve. The subsequent sections elaborate on several general characteristics in terms of quality and geographical coverage of the selected studies.
4.1 Short description of included interventions
Thermal energy: improved stoves and biogasInternationally, there is no standard or technical agreement about what should be understood by an ‘improved’ stove. In general, an improved stove reduces the amount of biomass needed to cook a meal, as well as reduces the quantity or composition of smoke that is produced by the use of the stove. In absence of clear international standards, the GIZ-Netherlands Energizing Development Programme, applies as broad guideline that an improved stove should reduce the use of biomass with at least 40% in a field test, as compared to a three-stone stove (Owsianowski & Barry, 2008). The Global Alliance on Clean Cookstoves, a public-private initiative promoting the use of clean cooking technology, distinguishes between four different indicators of ‘improved’: fuel use, total emissions, indoor emissions and safety, but no general set of standards exists.14
The types of stoves included in this review differ substantially in physical characteristics and performance. Stoves distributed in Latin America as improved stoves are entirely different from the ones in Sub-Saharan Africa. Table 4 provides an overview of the types of stoves included in the present review. Improved stoves using ethanol have been included, since certain impacts are comparable to the wood-burning stoves. Three of the 35 studies included concern ethanol stoves, all three used in Sub-Saharan Africa.
14 http://www.cleancookstoves.org/our-work/priorities/promote-standards.html. Accessed on 21-11-2012.
| 44 |
Overview of selected literature
Table 4 Improved stove categories as dealt with in selected literature
Stove name Description Porta-bility
Fueltype Country/Continent
Authors
Jambar stove
Simple stove with metal casing and insert of fired clay
Yes Charcoal, firewood
Senegal Bensch & Peters, 2011; GIZ, 2011
Rocket stove Simple metal stove Yes Firewood Sub-Saharan Africa
Pennise, et al., 2009; Adkins, et al., 2010
Onil stove (improved Plancha)
Concrete stove with chimney and ceramic combustion chamber
No Firewood Guatemala Ludwinski, Moriarty, & Wydick, 2011
Patsari stove Sand/mud/cement stove with one or two combus-tion chambers. Often comes with a chimney.
No Firewood Mexico Romieu, et al., 2009; Armendariz-Arnez, et al., 2008; Armendariz-Arnez, et al., 2010; Johnson, et al., 2008; Johnson, et al., 2009 ; Masera, et al., 2007; García-Frapolli, et al., 2010; Pine, et al, 2011
Stoves with enclosed cooking chamber and with chimney
No Firewood Nepal, China, India, Honduras
Nepal, Nepal, & Grimsrud, 2010; Yu, 2011; Hanna, Duflo, & Greenstone, 2012; Sinton, et al., 2004; Clark, et al., 2009
Sukhad stove
Twin pot stove with a chimney made of concrete
No Firewood, dungcakes
India Chengappa et al., 2007
Simple ceramic stove
Ceramic stove without chimney with as the main asset improved combus-tion
Yes Firewood, charcoal
Sub Saharan Africa
Malla et al., 2011
Simple clay stove
Self-made clay stove with chimney and metal grate
No Firewood, agricultural residues
Ghana Burwen & Levine, 2012
Plancha Cement stove with chimney and metal heating surface
No Firewood, agricultural residues
Guatemala Diaz, et al., 2007; Bruce, et al., 2004; Schei, et al., 2004; Smith-Sivertsen, et al., 2009
Laxmi/Bhagyalaxmi
Two pot stove, cement/stone with cast-iron grates. The Laxmi has a chimney.
No Firewood India Dutta, et al., 2007
Ethanol stove
Improved stove using on ethanol
Yes Ethanol Madagascar, Mozambique, Ethiopia, Tanzania
Takama, et al., 201115; Practical Action, 2011; Pennise, et al., 2009
15 Strictly considered, the report by Takama et al. (2011) may not be classified as an impact study as it deals with hypothetical choice modelling dealing with stated preferences as opposed to revealed preferences. However, the used methodology is considered to be sound and the report reveals interesting insights with regard to stove adoption and has therefore been included.
Renewable Energy: Access and Impact
| 45 |
Although this review does not elaborate on the technical merits of the different stoves, it must be noted that the potential benefits depend on the technical features of the stove. For example, not all stoves are designed to generate health effects, in particular not the smaller transportable stoves often found in Sub Saharan Africa. Hence, impacts on health can be expected to be substantially less as compared to the larger (fixed) stoves with chimney as found in Latin America.
Biogas can be used as an energy source for cooking and lighting. The amount of energy (biogas) that a biogas digester produces depends on the size of the digester, which can be large enough to serve entire schools, jails or other institutions. The bio-digesters regarded in this review are of a smaller scale, having a capacity of 4, 6, 8 or 12 m3 and are intended to provide gas at a household level. In most cases the digesters are used for cooking, and to a lesser extent for lighting.
Energy for lighting: electricityElectricity free areas hardly exist in the world. Dry-cell batteries are used almost everywhere for flashlights or transistor radios, while households may ‘store’ some electricity in car batteries, for example for charging cell phones. Also relatively cheap pico-photovoltaic equipment is penetrating rural areas all over the world, usually attached to small electrical appliances like torches, clocks or cell phone chargers. But the volume and power of electricity required for daily lighting and entertainment cannot be provided by pico-PV only, but requires either a solar home system (SHS), or communal facilities, like micro hydro electricity generation, and/or mini-grids that are powered by either a single source (hydro or solar, for example) or combination of sources (i.e. hybrid solar-diesel).
| 46 |
Overview of selected literature
Table 5 Sources of electricity as dealt with in selected literature
Vietnam Khandker et al., 2009; Gencer et al., 2011
Mozambique, Nepal
NORAD, 2007
South Africa Louw et al., 2008
Renewable Energy: Access and Impact
| 47 |
4.2 Quantity and Quality
The screening procedure on methodology and content led to a total of 66 selected studies. A majority of 35 studies refers to improved stoves. The reason is that stoves are most directly related to indoor air pollution and hence to smoke related diseases. A substantial part of the literature is not conducted by energy technical scientists or economists, but by medical scientists. The literature on rural electrification mostly deals with either solar energy (11 reports and articles) or rural electrification in general (21 reports and articles, with an overlap to solar energy).
Of the 35 articles concerning stove interventions, 17 are related to studies conducted in Mexico and Guatemala, in particular by a group of researchers who have been involved a randomized control trial study on improved stoves in Guatemala (RESPIRE). The list of studies show a substantial amount of overlap in contributing authors: in 15 cases the same authors feature more than once on this subject. In the literature and reports concerning rural electrification, the concentration is less extreme, but not absent. One author features 6 times in combination with others.
In contrast, independent high-standard research on the impact of biogas digesters at household level is – apparently – very scarce. There is no lack of articles about biogas (in the first review round 51 articles on biogas were identified), but few solid evaluations have been conducted over time, of which only two are considered as of average or good quality.
Notwithstanding the array of journals dealing with energy in general and renewable energy in particular, the number of rigorous impact studies is small. No solid evaluations were found on pico-hydro and/or pico-solar electricity generation, notwithstanding specialized websites and an array of project descriptions and narratives. An unexpected flaw was found in the area of micro hydro energy generation. Although part of the findings are ‘hidden’ in the literature about rural electrification in general, few reports and articles are directly dealing with the impact of micro hydro electricity generation. Only two articles explicitly covering the impact of energy coming from a micro hydro energy source, were selected to be included in the review. No articles about pico hydro generation (intensively applied in Vietnam, for example) could be identified.
Although the literature on improved stoves counts most solid articles, the literature on rural electrification is equally sound. There are two sets of reports and articles: two third of the studies researched the impact of solar home systems in countries like Bangladesh, Ghana, Kenya and Zambia, while another group of studies deals with electricity supply to remote rural areas, focusing on the costs and benefits, usually from the perspective of the energy supplier or distributor.
In line with the results chain (figure 3 and 4) attention was paid to certain types of expected impacts, like the savings in time, the impact on feelings of safety, in particular by women and children; study performance by young children and the frequency of use of the modern
| 48 |
Overview of selected literature
media. Surprisingly few authors have intended to quantify the findings of their studies in a gender disaggregated manner.
The overall strength and weakness of the articles and reports considered in this review was expressed by the overall categorization of ‘strong’, ‘sufficient-average’, and ‘weak’ in which also the consistency between analysis and conclusions is reflected. Articles or reports scoring ‘weak’ on the overall categorization have been used for either specific topics hardly dealt with by the other articles or for illustrative purpose only.
Table 6 provides an overview of the quality classification by energy source.
Table 6 Quality of literature by source of energy
Selected Strength
Improved Stoves Strong Average Weak
Journal Search 23 10 13 0
Portal Search 4 1 3 0
Snowball Search 8 6 3 0
Total Stoves 36 17 19 0
Biogas
Journal Search 1 0 0 1
Portal Search 0 0 0 0
Snowball Search 2 2 0 0
Total Biogas 3 2 0 1
Solar electricity
Journal Search 6 0 5 1
Portal Search 2 1 0 1
Snowball Search 2 1 1 0
Total solar electricity 10 2 6 2
Rural Electrification, including micro hydro energy
Journal Search 7 5 2 0
Portal Search 8 5 1 2
Snowball Search 2 1 0 1
Total rural electrification 17 11 3 3
Geographically, the evaluations on renewable energy are concentrated. Although studies refer to 25 different countries, there is a geographical concentration in Sub-Saharan Africa, Latin America and India and Bangladesh. The evaluations coming from Latin America are inspired by the vast research on improved stoves at the continent, amongst which 17 studies carried out in Guatemala and Mexico.
Renewable Energy: Access and Impact
| 49 |
Figure 6 presents an overview of the geographical place of study by type of energy study, while figure 7 presents the geographical spread by country.16
Figure 6 Geographical origin of energy interventions evaluated
Figure 7 Spread of selected literature over specific countries
16 Research that covered several countries have been counted separately by country. Therefore, the total of studies in the figures is slightly larger than the total number of selected studies.
35
30
25
20
15
10
5
0Total Asia Total Latin America Total Sub-Saharan Africa
Rural electri�cationMicro-hydro energyImproved stoves and IAPBiogasSolar energy
10
9
8
7
6
5
4
3
2
1
0
Mex
ico
Gua
tem
ala
Bang
lade
shG
hana
Indi
aN
epal
Chin
aKe
nya
Uga
nda
Sene
gal
Ethi
opia
Hon
dura
sM
ozam
biqu
eRw
anda
Sout
h Af
rica
Viet
nam
Zam
bia
Beni
nBh
utan
Burk
ina
Faso
Cote
d’lv
oire
Indo
nesi
aM
adag
asca
r(S
outh
) Sud
anTa
nzan
ia
Rural electri�cationMicro-hydro energyImproved stoves and IAPBiogasSolar energy
| 50 |
Overview of selected literature
4.3 Concluding remarks
The methodological screening process determines which evaluation reports and research articles are selected for further review. That implies that important theoretical articles, opinions or often quoted authors are not included in this review if these articles or reports do not meet the pre-established selection criteria. The criteria also imply that no attention is paid to the guiding innovators in the area of renewable eenrgy, nor the function of the existig networks and international initiatives. Based on the criteria set, 66 evaluations and research articles have been selected for the review. The majority of these selected studies concern improved stoves. The reason for this dominance of improved stoves is that the subject is directly related to indoor air pollution and hence not only subject of study by energy specialists and economists, but in particular by engineers and medical scientists. About half of these studies have been conducted in Mexico and Guatemala, in particular by a group of researchers who have been involved a randomized control trial on improved stoves in Guatemala (RESPIRE).
While the subjects ‘improved stoves’ (35 studies) and ‘rural electrification’ (21 reports and articles, with an overlap with solar energy) show sufficient sound evaluations that allow some meta-analysis, this is not the case with biogas, pico hydro energy and pico PV energy (solar lamps). Although there is a vast amount of written material about these subjects, evaluation about the subjects are scarce. Only two studies on biogas met the selection criteria.
Geographically, the selected evaluations were conducted in 25 different countries; nevertheless there is a geographical concentration in Sub-Saharan Africa, Latin America, India and Bangladesh.
Renewable Energy: Access and Impact
| 51 |
Adoption and Access
5
Renewable Energy: Access and Impact
| 53 |
What is known about the relation between access to (renewable) energy, the adoption (and use) of it, and poverty reduction?
Over time, a household may either add energy sources or appliances to the ones it is used to, or replace one by another. The determinants of this change, as well as the process of change, are subject to research in both developing and developed countries. The concept ‘energy ladder’ is being used in almost all studies.
5.1 The energy ladder
Historically, a household’s choice for energy carriers was limited to – and determined by – the options given by the natural environment. Nowadays, this still applies to rural areas in many developing and middle-income countries. Most of these energy sources are biomass-based (fuelwood, charcoal, grass, dung, agricultural residuals) or are extracted from the natural environment (peat, vegetable oils, bee-wax). Changes in energy-use patterns usually ‘take the form of a gradual decline of biomass fuels, from exclusive use for all purposes by a large number of households, towards reduced use by a smaller number of households for fewer purposes, with the reverse trend for technologically more sophisticated fuels’ (Madubansi & Shackleton, 2006, p. 4082). Whether households in rural areas change –or not – their energy sources depends on various factors, but in the first place on the options open to the household, implying the ability to make choices (Pachauri, Mueller, Kemmler, & Spreng, 2004). Usually, in urban areas more energy options exist than in rural areas, such as LPG and grid electricity. The price of the fuel is among the major determinants for the household’s decision on fuel use. Government may influence the citizen’s choice by applying subsidies and taxes on different types of fuel. Subsidy on LPG gas is common in many countries.
The commonly used hypothesis about changes in energy use is the so-mentioned ‘energy ladder’, where biomass fuels – such as dung – are at the bottom of the ladder and grid electricity at the top. The concept refers to a gradual shift from low-quality fuels, such as biomass, to more convenient, versatile and cleaner fuels such as paraffin, gas and electricity. The upwards move can only be made if new opportunities have become within the reach of the potential user; that means have become physically accessible or financially affordable. The motivation for change is not exclusively given by economic considerations. More expensive technologies are commonly perceived to imply higher status. Hence, a household does not move up the energy ladder motivated by higher efficiency only, but also to demonstrate an increase in its socio-economic status.
In practice, primitive fuels (firewood, dung, crop waste), transitional fuels (charcoal, kerosene, paraffin) and modern fuels (electricity, LPG) are not used in a lineair sequence as household income and socio-economic status develop, but are used simultaneously for different purposes. Households may move back and forth on the energy ladder (the movement is not unidirectional). The pattern of simultaneous use of different energy sources is known as ‘energy stacking’: a household adds energy sources over time, without
| 54 |
Adoption and Access
inmediately abandoning the ones it was used to. With increasing income, households adopt new fuels and technologies that serve as partial, rather than perfect substitutes for more traditional ones (Arnold, Kohlin, & Persson, 2006). Figure 8 shows the energy ladder.
Figure 8 The Classic Energy Ladder
Source: Holdren and Smith (2000) in Duflo, Greenstone & Hanna (2008)
‘Fuel securing’ is a comparable, but different concept. Since poor households usually lack regular income, due to the type of (mainly agricultural) employment undertaken, it may ‘secure’ its fuel requirements for a certain period of time first, prior to exploring fuels that are perceived as superior (Madubansi & Shackleton, 2006). As indicated in figure 8, at a certain moment in time, the more inferior sources of energy are not being used anymore. The ‘fuel switch’ has taken place, that means the abandonment of a specific fuel by a fuel ranked higher on the energy ladder. In some (exceptional) cases the process of energy change is not gradual, but rather swift. This rapid transition from traditional forms of energy to modern sources (e.g. electricity) is indicated by the term ‘leapfrogging the energy ladder’ (Murphy, 2001).
A study in five villages in South Africa underpin the energy stacking concept. In these villages, the majority of the lower income households continued using combinations of fuels and showed no tendency of narrowing down to, and dominance of, sophisticated fuels as the energy ladder suggests. Households either used different fuels for different end uses or used more than one fuel for the same application (Madubansi & Shackleton, 2006). For the majority of households, the newly introduced fuels i.e. electricity and solar panels, were additional sources and hardly substituted the traditional fuels. Only 1% of the electrified households entirely substituted other energy sources by electricity (leapfrogging). These were high-income households with a relatively small family size. Since one has to pay for electricity, the share of the total expenditure for energy changed in composition: on average 60% of the total energy expenditure goes to electricity. A comparable percentage has been
Income
Cost
, Cle
anlin
ess
and
E�ci
ency
Crop Waste Dung
Wood
Charcoal
Kerosene
Gas, LPG
Electricity
Renewable Energy: Access and Impact
| 55 |
registered for India (Chaury, Ranganathan, & Mohanty, 2004). Since electricity is accompa-nied by new investment needs for appliances, families save on other purchased fuels, in particular for lighting, such as paraffin, and opt for ‘free fuels’ like fuelwood. Although the percentage of families that collect fuelwood has decreased a few percent, in 2002 still 94% of all households surveyed either collected or purchased fuelwood (Madubansi & Shackleton, 2006, p. 4088).
Comparable to the energy ladder, an ‘electricity ladder’ is used as conceptual frame as well, starting with standard dry-cell batteries used for radio and flashlight; subsequently, car batteries used to run a small black and white TV set or to charge cell-phones; small solar equipment, either for one device (like a solar lamp) or for more devices (solar home system); generators or local mini-grids at household level; community level supply (generators, micro hydro) and finally the connection to the electricity grid (van der Vleuten, Stam, & van der Plas, 2007).
Critiques of the energy ladder state that reality is more complex than a simple transitional theory, since the pattern is driven by more factors than increasing income. Studies on fuel switch found statistically relevant associations (next to income) with declining fuelwood reserves, differences in availability, degree of urbanization, and industrialization (van Ruijven, et al., 2008). But an array of other factors play a role as well, such as household size and composition, the wish to be considered as ‘modern’ or just preserve culture (taste preference, for example) and traditions (Serpa & Zilles, 2007).
What is known about ‘energy losers’ or those who ‘step back on the energy ladder’?
Changes in energy-use patterns in rural areas, with a relatively poor population, cannot be generalized and are not a straight path as suggested by the model. If household income deteriorates (temporarily), or subsidy on particular fuels reduced one may ‘step back’ on the energy ladder. In practice, households move back and forth on the electricity ladder.
Subsidies disturb the logics of the energy ladder. In many countries LPG is a subsidized fuel for cooking that may easily replace the traditional fuelwood stove in rural and semi-urban areas. A quantitative study by Fall et al. (2008) on the main barriers to modern energy access in peri-urban Dakar illustrates the impact of subsidies. LPG was heavily subsidized in the past contributing to the rapid adoption of ‘butane’ (85% of the urban population uses gas). The product is widely available and for household cooking purposes small cylinders of 2.75 kg and 6 kg have been introduced in the market. These small cylinders also reach the rural areas. When the subsidy was gradually phased out by government in order to attenuate the impact of the oil market prices on public finances and to transfer the cost to the customers, consumers switched back to charcoal and fuelwood. The higher combustion efficiency and cleaner burning of improved fuelwood stoves competed with LPG and lured households back from LPG to fuelwood (Ouedraogo, 2006, p. 3787). In consequence, the objective of the improved stove (reducing the wood extraction from the natural environment) was largely balanced out by the increase in the number of users.
| 56 |
Adoption and Access
In rural areas, households consider electricity also as only one among various sources of energy. Most research among households registered a high willingness to pay for electricity. Once a community is electrified, the households can only make use of it if they invest in lighting gear and modern appliances like refrigerators, radios and television sets. The ability to pay for the new energy source as well as the ownership of appliances that go with it, is strongly related to income. In consequence, also in electrified villages, the usage of electricity is hampered by factors, like income, prohibitive connection fees and (lack of ) appliance ownership (Louw, Conradie, Howells, & Dekenah, 2008). ‘In communities with electricity for more than 10 years, between 15 and 20 % of the households remain without connection’, since these households cannot afford it (IEG, 2008, p. 23).
Households may take one or two steps too far, implying that investments are made for energy they do not (fully) utilize. For example, small businesses may decide to invest in electrical equipment immediately after the arrival of electricity without having properly thought about the consequences in terms of productivity or capacity to sell their products at the local market. After the energy switch, these small firms run their business at higher costs without having improved either their productivity or their turnover (Peters, Vance, & Harsdorff, 2011). With higher costs and a constant return, these investors are known as ‘energy-losers’.
5.2 Adoption
Individuals differ in their level of ‘innovativeness’ when it comes to adopting novel products. While some like to experiment, others are risk adverse. Information, promotion, credit facilities and other marketing instruments are important for dissemination and hence speeding up the adoption of new technologies. This applies to energy innovation alike (Hogart, 2012).
In rural areas, the households might be deprived from forms of energy available in the major cities, hence their options to choose from are limited. Deprivation can be thought of in terms of constraints on people’s choices to access certain material goods, assets, capabilities, freedoms and opportunities, hence also energy (Pachauri, Mueller, Kemmler, & Spreng, 2004). The deprivation from making choices related to energy can be expressed at various levels of the energy supply line: • primaryenergy:theenergyembodiedinnaturalresourcessuchascoal,crudeoil,sunlight,that
have been mined but not have undergone any conversion or transformation;• end-useenergy:theenergycontentofprimaryenergythatissuppliedtotheconsumer,for
example electricity at the meter; • energyforactualuse:forexampletheenergyusedforahotmeal,awell-litroomorahot
shower. The deprivation from energy choice can take several forms, such as (i) inability to afford the energy source that comes at a higher price (for being further away or having a different generation form); (ii) the obligation to pay for services that are either incomplete, or of less quality than elsewhere (for example, use of less Kwh than minimum tariff for rural areas) or (iii) being deprived from the appliances that enable a household to make use of the energy carrier (Chaury, Ranganathan, & Mohanty, 2004).
Renewable Energy: Access and Impact
| 57 |
The term ‘energy poverty’ is frequently used, but does not always express the same feature. Based on a literature review, Pachauri and Spreng listed the most frequently used measures for energy poverty (Pachauri & Speng, 2011, p. 7502).
Table 7 Measures and indicators of energy poverty
Dimension of energy poverty measured
Indicators /indices
Physical availability or access to energy carriers
Household or population access
Energy Development Index, Multidimensional Poverty Index
Per capita commercial energy consumption; share of commer-cial energy in total final energy use; share of the population that has access to electricity
Energy services Level of energy services associated with different needs (cooking, lighting)
Affordability Share of energy expenses in total household budget;Share of energy expenses and annualised cost of end-use equipment in total household budget
Deprivation Minimum energy needs based on engineering estimates of a normative set of basic energy services;Minimum energy needs estimated as the average amount consumed by households living below the monetary poverty line;Minimum energy needs estimated as the amount till which the energy use is invariant with income;Minimum energy needs defined in useful energy terms and access to modern energy carriers
Inconveniences Associated time costsHealth impacts
Source: based on Pachauri and Speng, 2011.
One measure of ‘energy poverty’ is based on an assessment of the bare minimum required to cook with modern cooking fuels as well as a bare minimum of electric lighting to read, or for productive activities after sunset. These minimum needs correspond to about 50 kilograms of oil equivalent (kgoe)17 of commercial energy per capita per year; this estimate is based on the need for approximately 40 kgoe per capita for cooking and 10 kgoe used as fuel for electricity. The inability to meet these bare minima, provides a measure to express the energy poverty (Modi, McDade, Lallement, & Saghir, 2005, p. 8). Energy poverty can also be expressed by an Energy Poverty Index Score (EPIS) (Obeng, Evers, Akuffo, Braimah, & Brew-Hammond, 2008) based on three explaining factors: the monthly amount paid to obtain lighting; the number of children that can sit around the light; and the amount required to obtain the lighting system (the hardware and service investment). A comparable indicator is the Bravo measure that quantifies direct energy needs, considering variations in
17 kgoe is the unit used as a common metric to quantify energy supplied using a variety of sources and carriers by converting them into oil equivalent units.
| 58 |
Adoption and Access
energy sources and their efficiencies, urban and rural areas and climate conditions (Barnes, Khandker, & Samad, 2010). Based on EPIS-score, a study in rural Ghana found that a majority of about 80% of the households in non-electrified villages fell into the categories ‘energy poor’ and ‘energy poorest’. While the ‘energy poor’ groups use kerosene as lighting and have no access to television or electric entertainment, the 20% of the households in non-electrified villages that are not energy poor use either car batteries, solar home systems or small generators that enable them to watch television and to use table lamps (Obeng, Evers, Akuffo, Braimah, & Brew-Hammond, 2008).
The term deprivation is also used in the assessment of the Multidimensional Poverty Index, that consists of three dimensions (education, health and standard of living) based on 10 indicators of poverty, amongst them ‘cooking fuel’ and ‘electricity’ (Alkire & Santos, 2010).18 As suggested by the Multidimensional Poverty Index, both the access to clean fuels and to electricity is an end in itself (a direct development indicator), rather than a means to achieve other development indicators like the Millennium Development Goals (Bensch, Kluve, & Peters, 2011).
Few quantitative studies have been conducted to determine which factors affect energy choice decisions (Louw, Conradie, Howells, & Dekenah, 2008) or how adoption patterns evolve over time regarding the usage of new energy forms. For the analysis of the energy transition process from traditional towards modern forms of energy, these studies (Madubansi & Shackleton, 2006; Fall, Sarr, Dafrallah, & Ndour, 2008) distinguish between:
(i) energy for thermal applications (space heating, cooking, water heating);(ii) energy for lighting, safety, communication and entertainment; and (iii) productive use
These three categories are not mutually exclusive, since energy for heating can be used for lighting as well (for example biogas) or even for productive purposes, such as the drying of agricultural produce, tobacco leaves scuring or the burning of bricks. But in general, energy for productive purposes is in the form of electricity delivered in a constant flow and of sufficient power to drive equipment and machinery. Table 8 presents the energy options to the household.
Whether a household really adopts a new source of energy depends on series of variables; Takama et al. grouped these variables into ‘product specific attributes’ (like price, operational costs, convenience, cleanliness) and ‘socio-economic attributes’ (like age, income, gender, household composition, educational level) (2011, p. 9). But the selection of only tangible variables may lead to an ‘objectification’ (Serpa & Zilles, 2007, p. 79) of the decision making, which is doubtful, since various individual characteristics play a role as well, such as desires and expectations in life; the interest in adoption a new lifestyle; or – on the contrary – the respect for existing traditions and culture (for example, the female role in relation to the care for the fire and hence the symbolic values of fire). There are indications that female decision makers are more likely to opt for modern energy, since women may
18 The Multidimensional Poverty Index (MPI) builds on the UNDP’s Human Development Index and measures the combination of deprivations that each household experiences on 10 indicators.
Renewable Energy: Access and Impact
| 59 |
prefer improved stoves and electricity connection more than men. More research is needed to confirm this (Köhlin, Sills, Pattanayak, & Wiflong, 2011). In general, early adopters are those households who can afford the more modern source of energy, being the rural higher middle class (shop-holders, teachers, policemen, civil servants). Late adopters are the energy poorest, predominantly households who cannot afford using a cleaner energy source.
The change process can be influenced by external interventions, like extending the number of alternatives to choose from or by changing the conditions, like encouraging the adoption of new energy sources with subsidies and discouraging existing ones by taxes or regulations. While subsidy systems are usually designed for opening up opportunities to the poorer strata in society, targeting deficiencies imply frequently that the subsidiy ends up in assisting the better off, while the poor remain excluded from both the subsidy and the alternative fuel (IEG, 2008).
Table 8 Energy options and services at the household and community levels
Energy options Non-electrified communities Electrified communities
household community household community
Thermal
Traditional biomass stove
cooking + heating
cooking (schools, restaurants)
cooking + heating
cooking (schools, restaurants)
Improved stove cooking, heating limited productive use
cooking (schools, restaurants)
cooking, limited productive use
cooking (schools, restaurants)
Biogas cooking cooking cooking cooking
LPG cooking, limited productive use
cooking cooking, limited productive use
cooking (schools, restaurants)
Lighting, communication, entertainment
Kerosene, paraffin, candles
lighting back up for lighting
Biogas lighting
Batteries (incl. dry-cell batteries)
lighting, communication, entertainment
flashlight and back up
Solar home systems
lighting, communication,entertainment
public telephone service
public telephone service
Private (individual) diesel generator
lighting, communication, entertainment,productive use
back up
| 60 |
Adoption and Access
Mini-grid (diesel generation, micro hydro or hybrid); grid connection
lighting, communication, entertainment,Productive use
street lighting; communal services
Productive use
LPG limited productive use
limited productive use
Multifunctional platform (either biomass fuels or electricity)
motive power for agro-processing
motive power for agro-processing
Solar home systems
micro home busi-ness, retailing
Electricity with power
productive use communal services (e.g. pumping)
Source: Own elaboration, based on Kankam & Boon (2009)
(i) Energy for thermal applicationsThe traditional fuels for thermal applications are fuelwood, charcoal, grass, dung, agricultural residual waste and some local products like peat. Households’ motivations to change to other fuels for heating can be either the decreasing availability of the staple fuel (and related to that the increase in price); the wish to use cleaner and healthier fuels; external incentives to change (subsidies); or even environmental awareness. The most likely change from a traditional cooking and heating would be to improved cooking stoves or a biogas digester. Like indicated by the ‘stacking’ concept, the simultaneous use of improved stoves or biogas with the traditional fire place is confirmed by various studies (Burwen & Levine, 2012; Bensch & Peters, 2011; Practical Action, 2011; Katuwal & Bohara, 2009).
In rural areas, where wood is freely available, low-income households will not easily change. But not all rural families have unrestricted access to fuelwood resources. A study in two geographically and environmentally different rural areas in South Africa made use of aerial photographic analysis over a longer period of time, showing a continuous decrease in the fuelwood resources, most markedly for larger settlements. Despite the increase in fuelwood scarcity, the majority of households continued using wood as their main source of energy for cooking (Madubansi & Shackleton, 2006) but were forced to start paying for either the fuelwood or charcoal. From ‘fuel for free’ to ‘paying for fuel’ is a first significant psychologic threshold to be taken (Serpa & Zilles, 2007).
In (peri-)urban areas, where the traditional fuels for heating have to be purchased and hence have a monetary price, competition by other cheap sources, like subsidized ‘butane’ may trigger a quicker change (Fall, Sarr, Dafrallah, & Ndour, 2008). The search for cheaper alternatives may also trigger investments in alternative cooking appliances such as bio-digesters (Walekhwa, Mugisha, & Drake, 2009).
Renewable Energy: Access and Impact
| 61 |
For thermal applications, the ‘leapfrogging’ from a traditional form of energy (e.g. fuelwood and charcoal) to electricity is highly exceptional. In most developing countries, cooking is not done on electricity and if so, this is restricted to the highest income strata. In Zimbabwe only 1% of the newly electrified households completely substituted all energy sources with electricity. These were high-income households with relatively small family sizes (Madubansi & Shackleton, 2006).
Even when the first threshold for change has been taken (to start paying for fuel), the change from a three-stone fire to a cooking device (a stove) is a second hurdle. This is called the ‘the stove barrier’ and applies to all stoves, be it one that uses fuelwood, charcoal, kerosene or LPG. When in addition, new pots and pans have to be purchased, poor households cannot easily afford to turn existing cooking equipment into sunk costs as price for changing the fuel source (Louw, Conradie, Howells, & Dekenah, 2008).
The adoption of improved cooking stoves depends on various variables. Research conducted in Mexico about the adoption of the Patsari stoves, identified variables like the number of adults in the household; whether family members suffer from smoke related symptoms; whether women work primarily at home; the use of lower quality biomass fuels and the use of an elevated stove (‘fogon’) (Pine, Edwards, Masera, Schilmann, Marrón-Mares, & Riojas-Rodríguez, 2011, p. 182). Adoption is also influenced by real or perceived convenience: field testing of improved stoves in Tanzania and Uganda showed that cooks had a strong dislike for stoves that involved a longer cooking time or had an inconvenient design or size, even if they led to significant fuelwood savings (Adkins, Tyler, Wang, Siriri, & Modi, 2010). Ethnographic research among migrants in Guatemala, showed that although 98% of the households owned a LPG stove, 77% of the households continued to cook on wood due to reasons of taste preferences and easier use during prolonged cooking (Taylor, Moran-Taylor, Castellanos, & Elías, 2011). Also social factors play a role in adoption: research from urban stove usage in Senegal stresses the importance of personal relations in whether or not a household decides to adopt an improved stove. If a neighbor or friend has purchased an improved stoves, this influences the likelihood of buying an improved stove themselves (Bensch & Peters, 2011).
Economic analysis carried out in Tanzania, Ethiopia and Uganda by the Stockholm Environment Institute showed that ‘product-specific characteristics’ such as usage costs, level of safety (in terms of explosions) influence the purchase of ethanol stove (Takama, et al., 2011). Whether or not adoption of improved stoves has been successful can only be known over the medium time (since over the long term a new technology may have taken over, or households might resort to traditional technologies again). A study in Mexico showed an adoption curve with an initial acceptance of approximately 40% of the households after introduction, increasing towards 70% in a 4-month period and decreasing with 17% after a 10 month period (Pine, Edwards, Masera, Schilmann, Marrón-Mares, & Riojas-Rodríguez, 2011, p. 179). Also other authors refer to a decline in usage, as time progresses (Burwen & Levine, 2012; Hanna, Duflo, & Greenstone, 2012). This implies that not all adopters are satisfied with the new device, or are not able to maintain it over time.
| 62 |
Adoption and Access
Another fuel for thermal purposes is biogas. Research on biogas adoption in Eastern Uganda and Kenya suggests that adoption hardly depends on the technical aspects of the digester, but on specific socio-economic characteristics of the household (Mwirigi, Makenzi, & Ochola, 2009; Walekhwa, Mugisha, & Drake, 2009). The research in Uganda shows that aspects like decreasing age of head of household; increasing household income; and increasing number of cattle owned are positively correlated with biogas adoption (Walekhwa, Mugisha, & Drake, 2009). This finding is not surprising taking into account that a household should have enough cattle and capital to purchase a bio-digester and hence pertains to the relatively wealthier strata in society. In Kenya the socio-economic characteristics significantly influenced the decision to adopt the biogas technology, but the technical features of the digesters played a role as well (Mwirigi, Makenzi, & Ochola, 2009).
Cooking on biogas in Rwanda
Renewable Energy: Access and Impact
| 63 |
(ii) Energy for lighting, safety, communication and entertainmentIn rural areas in developing countries where no permanent electricity supply is available, the energy for lighting is provided by either paraffin or oil lamps, by candles, or by (car-) batteries. Only a few higher income households can afford electricity generators (Obeng, Evers, Akuffo, Braimah, & Brew-Hammond, 2008).
Rural dwellers may have different motives to demand for electricity. Lighting is a rather obvious first one (and related to ‘feelings of safety’), but the requirement for communication and entertainment plays an increasingly important role. A third motive found in literature is a collective (and less individual) strive for ‘modernity’, a feature of increasing importance resulting from the intensifying contacts between rural and urban areas (import transport, telecommunication and television).
Table 9 Overview of literature concerning information on demand for electricity
Demand for electricity Literature
Initial demand is for lighting mainly Gustavsson for Zambia (2007);Obeng, Evers, Akuffo, Braimah, & Brew- Hammond, for Ghana (2008); Bensch, Kluve, & Peters, for Rwanda (2011);Madubansi & Shackleton, for South Africa (2006)
Initial demand is for communication and entertainment mainly
Gustavsson for Zambia (2007); Komatsu, Kaneko, Shrestha, and Ghosh for Bangladesh, (2011);Hossain Mondal and Dasrul Islam for Bangladesh, (2011)
Initial demand is determined by the social environment
No selected articles
Various authors (Abdullah & Wilner Jeanty, 2011; Komatsu, Kaneko, Shrestha, & Ghosh, 2011; Kemmler, 2007; IEG, 2008) described the keen interest of households to connect to electricity services. A willingness to pay (WTP) study in Kisumu district, Kenya, (Abdullah & Wilner Jeanty, 2011) showed that respondents are willing to pay more for grid connection than for solar home systems (PV electricity) even if it is unlikely that they can afford such a connection. Two hundred households were surveyed, of which 53% lived below the USD 2 dollar per day poverty line. The researchers applied a double bounded dichotomous choice (DBDC) method with as main variables income, educational attainment, age of respondent, number of household members, interest in starting a business and home ownership. The choices could be made between connection to the grid with a lump sum, connection to the grid with monthly installments, PV lump sum and PV monthly payment. While to most households the PV with monthly installments would have been the economically most advantageous choice, the preference was for connection to the grid. The net present value (NPV) happened to be very high: approximately a 35% discount rate for PV and 46% for grid extension. This is called the ‘time preference’ or ‘myopia’ factor, where individuals prefer having a Euro now instead of having one in the future. Hence, at the moment of choice, households are willing to pay more for the perceived immediate ‘gain’ of being connected
| 64 |
Adoption and Access
to the grid, but once connected they cannot always afford to sustain their connection (Abdullah & Wilner Jeanty, 2011, p. 2980). The evaluation of 120 rural electrification projects that have counted with funding from the World Bank, concluded a comparable high WTP for grid electricity and less WTP for off grid electricity (IEG, 2008).
Electricity for lighting The high initial willingness to pay, but decreasing connection rate afterwards was also found in South Africa. A research on the electricity consumption behaviour during the first five years of connection to the grid, mini-grid or off-grid supply showed a connection rate of 66% of the households in electrified areas. It was found that electricity consumption by low-income households is below 50 kWh/month, while throughout South Africa the average consumption is 132kWh/month. Louw et al. (2008) conclude that income levels do play a role prior to connection, but once connected, households see electricity as being ‘just there’. It was found that the demand for electricity was income inelastic. In other words, for a percentage change in income, there was little change in the number of units of electricity consumed on a monthly basis. The cross-price elasticity of demand relating to paraffin was inelastic as well. This indicates that whilst demand for electricity will increase if paraffin prices increases, the change will only be small. This is largely due to the convenience of purchasing paraffin as it is available from local shops and the mix of energy fuels used by the household (Louw, Conradie, Howells, & Dekenah, 2008). This does not entirely coincide with findings by Madubansi and Shackleton, also for South Africa, who registered a gradual change of the total expenditure for energy towards electricity at the expense of other fuels. Since the electricity has got to be paid and the use of that energy source is accompanied by new investment needs for appliances, families tend to ‘save’ on other purchased fuels, in particular for lighting, such paraffin, and opt for ‘free’ fuels like fuelwood for cooking and heating. The researchers surveyed the monthly consumption of fuelwood in five villages over a prolonged period of time and concluded that the total fuelwood consumption remained the same (Madubansi & Shackleton, 2006).
Photovoltaic (PV) technology is among the first renewable energy technologies available to rural areas that are not connected to the grid. The introduction of the PV technology has known a strong donor-pushed strategy in many developing countries in terms of Research & Development support, fiscal and financial incentives (Chaury & Chandra Kandpal, 2010). The funding organisations (governments and international donors), ngo-sector, microfinance institutions, local energy enterprises and communities have all contributed towards innovations in institutional and financing mechanisms for dissemination of PV systems. In line with the findings by Abdullah & Wilner Jeanty (2011), the income in relation to the cost aspect seems to be more determining in the case of solar home systems (SHS) as to grid electricity. A rigorous impact analysis of the use of SHS in rural areas in Bangladesh indicated that the likelihood of having a SHS increases with income; in fact each percent (1%) of additional income increased the number of solar home systems with 0.26% (Komatsu, Kaneko, Shrestha, & Ghosh, 2011, p. 286). Two primary constraints to the use of electricity have been identified by Gaunt (2003, quoted by Louw, Conradie, Howells, & Dekenah, 2008, p. 2817), being the initial cost of obtaining access to electricity, for example buying a SHS, plus the costs of obtaining the appliances to utilise the service (wiring, lamps,
Renewable Energy: Access and Impact
| 65 |
switches) that encompasses a redundancy cost: the existing household infrastructure and appliances have usually been purchased and designed around the lack of electrical services. Low-income households cannot easily afford to turn existing equipment into sunk costs. Louw et al. (2008) made the same observation about cooking devices (see previous section). The second constraint is the continued costs of electricity consumption, including repair and maintenance, which is higher to the end-user in the case of solar home systems (replacement of batteries) than in the case of grid electricity (Chaury & Chandra Kandpal, 2010).
A study by Bensch et al. (2011) on micro hydro electricity generation surveyed 537 households in 15 villages in Rwanda. A distinction was made between ‘access to electricity’ and ‘connection to electricity’. Access to electricity was referring to the fact that the micro hydro generation brought electricity to the community, and that in principle each household in the village could make use of the electricity service, while connection to electricity refers to the household decision to actually connect to the grid. All villagers may have access, but not all make use of the electricity available, for example due to high connection fees or service payments. Also the IEG evaluation indicates that if access to electricity is provided ‘connection cannot be taken for granted’ (IEG, 2008, p. xiii). On average connected households paid about USD 200 for the connection. For 91% of the household heads lighting was considered the main advantage of electricity. Households traditionally use kerosene lamps made of used tins, and hurricane lamps. Candles are rather a back-up source of lighting. Bensch et al. concluded a strong and significant effect on lighting hours confirming that the service was actually used by the households (Bensch, Kluve, & Peters, 2011, p. 585).
Also a study by Fall et al. (2008) for Dakar, Senegal points into the same direction. Dakar has among the highest electrification rates of Africa, with 90% of the capital being electrified. The costs to a household are high, with an average electricity bill of USD 40 per month. In the peri-urban areas 25% of the households are illegally connected for lighting, generally via a direct neighbour. In part this is due to the high costs of the service, but a more important reason is that these families cannot become legally connected since they do not have the proper tenancy papers as is often the case in loosely organized neighborhoods in the urban periphery. Of the illegally connected households over half (52%) do pay a fee to the legally connected household. The paradox is that the illegally connected poor pay relatively more for electricity than the legally connected ones (Fall, Sarr, Dafrallah, & Ndour, 2008).
Electricity for communication and entertainment mainlyThe demand for electricity is not only based on the wish to have light, but also, or even more, on the wish for communication and entertainment (Gustavsson, 2007a; Hossain Mondal and Sadrul Islam, 2011; Jacobson, 2007; Komatsu, Kaneko, Shrestha, and Ghosh, 2011). If solar home systems are commercially (at non subsidized prices) purchased in the rural areas of Bangladesh these are financially not viable if used for lighting alone, since the net present value (NPV) over a 30 year period is negative and hence traditional kerosene lighting happens to be cheaper (disregarding the value of CO2 effects). The NPV soon turns positive, if a value is attached to communication and entertainment (Hossain Mondal &
| 66 |
Adoption and Access
Sadrul Islam, 2011). In Bangladesh the PV dissemination depends to a large extent on Non-Governmental Organisations (NGOs) and credit intermediaries, like Grameen Shakti and BRAC. Hence, the market price is often below the cost, nevertheless the cash outlay required from the household remains substantial. Income versus price is not the only determining factor for acquiring a SHS: households having children and/or elderly are concerned for indoor air pollution, while also the total energy consumption matters: households that consume large quantities of kerosene are considered more likely to adopt SHS since they can reduce the costs incurred for fuel. Ownership of rechargeable batteries (149 out of the 304 households sampled) showed a statistically significant tendency to adopt SHS: these households do have electrical appliances like radio or TV. Of the 304 households in the sample with SHS, 220 households had mobile phones prior to the installation, that they used to charge at the market or with friends/family elsewhere (Komatsu, Kaneko, Shrestha, & Ghosh, 2011, p. 289).
Gustavsson (2007a) and Jacobson (2007) found for rural areas in Zambia and Kenya that most SHS are part of a development intervention that formally aim at lighting, since watching karate movies or soap operas are not convenient project justifications to donors (Gustavsson, 2007a, p. 1292). In Kenya, solar systems are four times more likely to be marketed to power television than as a means to power lights (Jacobson, 2007). But those customers of commercially acquired SHS are not the poorest strata in society: it are not the local farmers, but teachers, policemen, civil servants and health workers. While farming is the main occupation in the rural areas, almost no farmers – as main occupation – were found in the treatment group, although almost all households do farm as well as a side activity. In a comparable study in a Zambian district, Gustavsson (2007a) found that over 40% of the households that got an SHS acquired equipment for entertainment within one year and another 20% improved the quality of the appliances they have got.
A substantial take up of electric lighting is of significance to a community: electric lighting leads to a change in life and transforms the society. A study on welfare impacts of electrification in Vietnam registered a rapid expansion of grid electricity. In the period between 2002 and 2008 the percentage of connected households increased from 26% to almost 80%, while the share of households that did not have any form of electricity decreased from 55% to 12% over the same period. The study reveals that households use grid electricity mostly for lighting, followed by watching TV (Khandker, Barnes, Samad, & Minh, 2009, p. 10).
The demand is determined by the social environmentThe previous paragraphs dealt with the motivations behind the demand for electricity: lighting, communication and entertainment. These motivations are based on household characteristics like income, composition, or educational level of the decision makers. However, decisions are not always made at the household level. The decision for connection to the grid might be made collectively, or by persons representing the community or neighbourhood. Here collective vision on modernity, the future of the village and new lifestyle play a significant role. For India, Kemmler researched that aspect. In his study the determining factor was whether neighbours had electricity or not: the community electrification proved to be a crucial factor for access of the individual household: the more neighbours opt for connection, the more likely that the household gets connected as well. The per capita
Renewable Energy: Access and Impact
| 67 |
expenditure showed only a relatively small effect on the household’s decision to have electricity (Kemmler, 2007, p. 19). Whether households remain connected depends on the perceived benefits that are related to the supply characteristics (permanency of the supply, no black-out; need for repair and maintenance), because these are important for home business, as well as agricultural productivity, being the ability to use electric equipment, such as pump-sets.
(iii) Energy for productive activities
What factors determine the productive use of renewable sources of energy by households or small enterprises?
Energy development programmes and projects are justified by – amongst others – the assumed positive impact on productive activities and hence on employment and income generation. Productive use of energy can best be defined as ‘any use that helps generate income for the end-user’ (Obeng & Evers, 2010, p. 227). However, the distinction between consumptive and productive use is far from being clear-cut; for example, to which extent can preparing extra food for sales on top of the food prepared for own consumption be consideredas‘productiveactivity’?Orischargingasmallentrancefeetoneighbourswhocometowatchtelevisionaproductiveactivity?Apartfromthesemicrohomebusinesses,theterm ‘productive use’ refers to activities like pumping water for agriculture, agro-processing (drying, curing, cooking), information and communication services, and small manufacturing enterprises. In practice, electricity extension programmes aim at residential connections: more than 95% of connections are residential (IEG, 2008, p. 31). This is different from off grid micro hydro generation, that may have predominantly productive objectives, for example for processing agicultural produce.
When ‘modern electricity’ (hence with sufficient power to propel machinery) is supplied, the opportunities for productive use change entirely. A study among 10 African countries showed that immediately after electricity arrives in an area, the number of newly established enterprises increases substantially. But many initiatives were discontinued soon afterwards, amongst others as a result of the ‘myopia factor’ mentioned earlier. But also the reliability of the electricity supply is a determining factor, since frequent and prolonged outages may harm the production process. Undefined and isolated markets are another impediment (Arnold, Matto, & Narciso, 2008).
Micro-enterprises starting new activities face various barriers, amongst them a market able to generate sufficient demand for the product, credit facilities to pre-finance the production, an infrastructure that enables to transport the supplies and final products and an institutional and policy context that is favorable for private sector development. Access to energy is neither the only nor even necessarily the most important factor influencing micro-enterprise development. In an impact study of grid extension in rural areas in Benin, these ‘other factors’ have been explored, such as the ‘insular nature’ of many small businesses; the ‘constrained rural markets’; the lack of electrical equipment that enables a producer to make use of the power. Most benefits are reaped by newly established enterprises whose business depends on the availability of electricity and not so much by enterprises that try to
| 68 |
Adoption and Access
incorporate electricity in their usual way of operations (Peters, Vance, & Harsdorff, 2011). Whether businesses are legally established or not is less important from an energy perspective: informal businesses pay for both connection fees and services fees comparable to those paid by households (Fall, Sarr, Dafrallah, & Ndour, 2008).
The impact on income of productive use is elaborated in section 6.2.
5.3 Concluding remarks
The process of a gradual decline of biomass fuels, through intermediate sources like paraffin towards technologically more sophisticated energy sources like gas and electricty is conceptually depicted as ‘the energy ladder’. The literature review indicates that this is not a unidirectional process as often suggested. Households may move back and forth on the energy ladder and usually ‘stack’ fuel sources, adopting new fuels and technologies that serve as partial substitutes for the existing ones. Only after years, a fuel switch may take place, implying an abandonment of the traditional energy source.
The choice for energy sources or carriers in rural societies in developing countries is usually restricted to – and determined by – the natural environment. The introduction of (rene-wable) new sources might be done by either private actors in the market or by government intervention (and supported by NGOs). Not all options are equally accessable and not all options are delivered at the same price. Whether a household adopts a certain energy source depends on the availability in the first place and the affordability (price) in the second place. But the decision to adopt a new energy source is not only an economic one, but also considerations of convenience plays a role, as do perceptions of modernity and lifestyle. These latter aspects have hardly been rigorously researched.
There is a common understanding in literature that programmes and subsidy schemes might be designed to favor the poorer strata in society, but the first adopters are those households who can afford the more modern source of energy, being the rural higher middle class. The decision to embark upon a new energy source is not always taken by the individual household, but by either collective decision or by decision made by the social network of the household. And this collective decision is often based on aspirations and desires rather than on rational economic analysis. While higher and middle income groups can afford to live with the group’s decision, the poor can often not and have to step back. In communities connected to the electricity grid, between 20-30% of the households remain unconnected after a certain period of time. Late adopters are often the poor who cannot afford the change towards superior fuels.
The adoption and use of electricity is motivated by the demand for lighting in the first place. Lighting is related to extended hours for domestic tasks and linked to ‘feelings of safety’. Increasingly, the main motivation is the comfort and convenience of communication (mobile phones, internet) and entertainment (television). This is not only for leisure, but also for education and business. The claim that electricity automatically enhances the
Renewable Energy: Access and Impact
| 69 |
productive capacity should be handled with caution. Most PV systems lack power to propel machinery, a reason why the productive capacity is restricted to additional lighting hours for home based businesses. A substantial contribution of electricity to employment and income generation can be expected from connection to the grid only.
Renewable energy and the impact on income and expenditure
6
Renewable Energy: Access and Impact
| 71 |
What is known about the direct and indirect links between the use of (renewable) energy, income and expenditure?
The 2002 Johannesburg Summit explicitly stated that access to energy services is an essential element of sustainable development. The relation between energy and poverty goes both ways (Pachauri, Mueller, Kemmler, & Spreng, 2004). On the one hand, high levels of poverty are reflected in low levels of energy use at household level, a lack of access to cleaner commercial fuels, lack of fuel efficient equipment and electricity; and a high dependence on biomass, which is mostly burned in inefficient and polluting stoves. Increasing household income is usually accompanied by more modern energy consumption. On the other hand, the provision of clean and reliable energy happens to be important for poverty alleviation, since it can make a difference for welfare and to income. This two-way relation is confirmed by Karanfil, who conducted a review of 22 scientific articles concerning the relation between energy consumption, economic growth and income growth. He concluded that energy consumption and income – economic growth clearly associate, but that about the direction of causality “contradictory results are being reported” (Karanfil, 2009, p. 1193).
In the following sections a distinction is made between the financial impact in terms of the resulting costs or benefits of having adopted a new fuel, and the financial impact of changes in productive use of the energy source.
6.1 The consumptive use
What are the changes in household expenditures for lighting and cooking energy, and where are the savings used for? What are the effects among socio-economic groups (income brackets)?
A change of energy source has an effect on the household’s expenditure. This may imply either savings on traditional fuels or additional expenditure to obtain cleaner fuels. This is apparently an easy comparison, but in practice happens to be complex. This complexity arrives from various factors. First, the modern source might be heavily subsidised; second, the nominal price paid for energy is not equal to the ‘net price’, that means the price per unit energy effectively used. It is often the case that poorer households use the most expensive fuels in terms of the price per unit useful energy, also since poorer household use less efficient devices. Third, the expenditure does not only refer to the operational cost of using a certain fuel, but should also include the amortized capital costs of the equipment and appliances needed for each energy source (Pachauri, Mueller, Kemmler, & Spreng, 2004).
Cooking and heatingHousehold cooking energy entails both biomass energy (firewood, husk or cow dung) and non biomass fuels like kerosene, LPG, and exceptionally electricity. Fuelwood can be either collected (no cash outlay, but time investment) or bought (little time investment, but an expenditure). In most rural areas, fuelwood is being collected (usually by women, elderly
| 72 |
Renewable energy and the impact on income and expenditure
men and children), in (peri-) urban areas, fuelwood is being traded and purchased by the household. In India, for example, the time component for wood gathering is very significant and varies from less than one hour to more than five hours per day per household (Pachauri, Mueller, Kemmler, & Spreng, 2004, p. 2088). Fuelwood is sometimes replaced by charcoal, a product mostly sold in cities. In order to assess changes in expenditure as result of improved stoves, some researchers add a monetary value to the time investment for wood gathering: the opportunity cost of labour. Some studies include the time costs or transaction costs for acquiring fuels; others do not and refer to cash outlay only. Another research technique has been that the researchers provided the household with the fuelwood in order to reduce the influence of external factors in their endeavor to determine impact of improved stoves. In that case, one can say something about savings in wood consumption, but can estimate only the impact on expenditure.
A cost-benefit analysis conducted on the basis of survey data among 464 households in Kenya, Sudan and Nepal studied a range of potential benefits related to different interventions such as LPG stoves, simple improved ceramic stoves and smoke hoods (Malla, Bruce, Bates, & Rehfuess, 2011). The authors concluded that in Kenya savings on purchased firewood could add up to over USD 20 per household per year, while in Sudan savings amounted to USD 46 per household per year. In Nepal all firewood was collected, whereby the reduction in the use of firewood led to savings in time but not in cash outlay (Malla, Bruce, Bates, & Rehfuess, 2011). The high cost savings in Sudan are based on the replacement of open-fire cooking by LPG stoves, in Kenya the adopted interventions were a mix of improved stoves, smoke hoods, LPG stoves and so-called Eaves spaces19 (Malla, Bruce, Bates, & Rehfuess, 2011, p. 7520).
Research in which open fire cooking is replaced by cooking on improved wood stoves, shows less cost savings or no savings at all. Comparing fuel expenditures related to improved wood, charcoal and ethanol stoves in Madagascar showed that improved wood stoves led to fuelwood savings of EUR 13.5 per household per year. For charcoal stoves no significant change in fuel expenditures was measured and for the ethanol stoves an increase in fuel expenditures was measured (Practical Action, 2011). Comparably, other studies found no significant effects on cooking expenditures after the introduction of an improved stove or showed an increase in fuel expenditures (GIZ, 2011; Hanna, Duflo, & Greenstone, 2012).
This finding has two major explanations: first, when wood is collected and no monetary value is attached to time, a reduction of the time spent on wood gathering has no impact on expenditure. Second, households compensate the savings as a result of more efficient combustion of fuelwood by cooking more, or by cooking over a longer period of time: the rebound effect. The most frequently reported change in cooking behaviour is that an improved stove allows to have a kettle of warm water the entire day, while previously warm water was available only a few hours daily.
19 Long narrow spaces between the top of the wall and the thatch, usually located directly above stove.
Renewable Energy: Access and Impact
| 73 |
Table 10 shows that the cost savings on fuels as a result of the introduction of an improved stove varies from zero to approximately EUR 34 per household per year. Although the replacement of open fire cooking by improved wood stoves may produce little savings in absolute terms, taking into consideration the low income levels of the average household, the reduction of expenditure might be important in relative terms.
Table 10 Cost savings for cooking energy expenditures
Authors Kind of intervention
Research design Cost savings cooking fuels by hh/year20
ElectricityRegarding electricity, comparisons between ‘traditional sources’ and ‘improved sources’ can be expressed in various ways, for example by expenditure per Kilowatt/hour (Kwh), per lumens (lm)25, or in total cash outlay per time unit. For example, an 8 W solar fluorescent lamp can provide 400 lm, against 10-40 lm with a kerosene lamp (Gustavsson, 2007b, p. 803). For the same cash outlay per month 10 times more light is received in terms of lumens. Rural households however, are more interested in cash outlay per time unit than in lumens per monetary unit.
20 Conversion to EUR using corporate rates 2011.21 Level of significance not reported.22 Level of significance not reported.23 700AR per week converted to EUR using corporate rates 2011 (Practical Action, 2011, p. 98).24 This is most likely due to an increase in the price of charcoal, as other data does point out a reduction in
the actual quantities of charcoal purchased.25 Lumen is the unit of luminous flux and thereby a measure of the total ‘amount’ of visible light emitted
by a source. Lumen hours are the lighting hours multiplied by the lumen value.
| 74 |
Renewable energy and the impact on income and expenditure
Various impact evaluations raise the question of household expenditure on energy (see Table 11). The comparison ‘before’ and ‘after’ is rather complex in the case of electricity, since electricity allows to embark upon uses that did not exist before. While kerosene and candles may be compared to electric light, electricity is also used for communication, entertainment and convenience in life, for which no energy was spent in absence of electricity.
It is widely recognised that ‘the larger share of benefits of rural electrification is captured by non poor’ (IEG, 2008). The rural poor are less likely to have grid connections for two reasons. First, electricity companies need a return on investment and set criteria (about distance, population density) for the communities to be connected. For some Asian countries this was estimated to be a maximum distance of 11 km and a minimum number of paying consumers of 45 households (IEG, 2008, p. 22). Second, within the electrified communities exist households that cannot afford to be connected or cannot afford to pay for the electricity consumption. In consequence the ‘further away’ and more sparsely populated areas will depend on off grid electricity supply, like solar home systems.
In rural Bangladesh the impact of electricity on income and expenditure was measured by exploring elasticities between income and expenditures for thermal energy and electricity. It was found that as a household’s income goes up, the share of biomass expenditure goes down and eventually becomes steady, while the share for kerosene goes down with increasing income. Since electricity use is income related as well, the share of electricity rises from zero percent at lowest income to above 20% for the highest income levels (see Figure 9).
Figure 9 Share energy expenditures of household monthly income in Bangladesh
Source: Barnes, Khandker & Samad, 2010, p. 18
100
80
60
40
20
0
Household monthly income (Tk. x 100)
Biomass
Electricity
Kerosene
100500
Renewable Energy: Access and Impact
| 75 |
Barnes et al. (2010) found a statistically significant relation between expenditure on energy on the one hand and non-energy expenditure and income at the other hand. A 10% increase in energy expenditure leads to a non-energy expenditure of 0.4% and an increase in total income of 0.3%. This suggests that having electricity is important for the overall economic development of the household.
In an effort to measure costs for ‘lighting only’ (so excluding the use of electricity for other purposes) Obeng et al. (2008) showed for rural Ghana a positive correlation between solar home systems and the decrease in expenditure for kerosene, candles and dry-cell batteries. Of all households with solar PV, 21% experienced savings in monthly expenditures of approximately 10% for lighting. Studies in eastern Zambia came to comparable findings, since users of (solar) electricity spent 53% more on lighting than users of traditional fuels, but this was due to the fact that households with PV were spending more anyhow, and did not spend more compared to the period prior to the installation of solar systems (Gustavsson, 2007). In Zambia, the solar electricity users were a special subgroup in the rural society (teachers, civil servants and shop owners). The study in five rural villages in South Africa concluded that in nominal terms the average energy expenditure after electrification increased consistently over an 11 year period, but since income increased as well, the proportion of monthly income spent on energy for lighting declined from 14.8% to 9.5% over the same period (Madubansi & Shackleton, 2006, p. 4086). And if the expenditure on electricity increased this was mainly due to new – additional – uses like watching tv. While the authors do not explain why the relative expenditure on energy reduced, Khandker et al. (2009) do so in the case of Vietnam. The study shows that the income of long time electricity users happens to increase faster than the income of non users. The gain in total income attributable to electrification was as much as 30%. This increase in income was sustained for as long as 8 years, after which benefits leveled off.
Since solar home systems are less appropriate to power household appliances like refrigerators, the electricity consumption pattern is different in the case of ‘power installations’, like micro hydro mini-grids. In a study of micro hydro installations in Rwanda, the energy expenditure per working-age adult changed substantially. In the first place, since energy consumption in ‘electrified’ villages was already higher than in the control group of non-electrified villages; and second, once connected, households increased their energy use substantially and hence expenditures for energy increased accordingly. In villages with access to electricity, household connected spent on average 87% more on energy per adult equivalent as compared to household that are not connected. Since the not connected households are the poorer ones, with less spending anyhow, the electricity users were also compared to ‘matching’ households in villages without access to electricity. As compared to these households, the expenditures were 49% higher. Apparently, take-up of new services and more intensive lighting usage overcompensate the efficiency increase after the switch from traditional sources to electricity (Bensch, Kluve, & Peters, 2011).
This coincides with findings by the World Bank’s ESMAP that highlight lower costs by unaltered use, but also indicate higher use of household appliances (lighting, radio, TV), that are compensated by improved returns on education, home business productivity, and
| 76 |
Renewable energy and the impact on income and expenditure
time savings (IEG, 2008). In a study about grid connected households in semi-urban Dakar, the average monthly electricity bill happened to be USD 40/month, about three times the expenditure on energy of non connected households (Fall, Sarr, Dafrallah, & Ndour, 2008).
Hypotheses about gender-differentiated impacts of electricity that have been tested include reduced time on household chores, including collecting and cooking with fuelwood, increased income-generating activities, improved health and reduced fertility and increased educational attainment (Köhlin, Sills, Pattanayak, & Wiflong, 2011). These gender-disaggregated impacts will be referred to in the corresponding sections in the chapters 7 and 8.
Table 11 Difference in household expenditure on energy when adopting electricity
Authors Fuels compared Research design Difference in expenditure on energy of newly connected electricity users (by hh/year)
Where
Neelsen & Peters, 2011
Traditional (paraffin candles, car batteries) vs PV system
Paraffin, candles, dry-cell batteries vs electricity
Longitudinal difference-in- difference
For lighting: 0%For entertainment +35% average
South Africa
Khandker, Barnes, Samad, Minh , 2009
With-without elecricity Difference-in- difference
+25.6% Vietnam
Obeng & Evers , 2010
Kerosene-PV 100W;Kerosene-PV 50W
With-without Minus 12%Minus 10%
Ghana
6.2 The productive use
What is known about productive use of energy, and what is known of changing patterns of investment by end-users?
Global macro-economic studies indicate a positive correlation between commercial energy consumption (usually electricity) and economic growth, leading to Karanfil’s question ‘How many times again will we examine the energy-income nexus using a limited range of traditional econometricmodels?’(Kooijman-vanDijk,2012,p.530;Karanfil,2009).
Renewable Energy: Access and Impact
| 77 |
Energy programmes assume that productive use of energy justifies the investments in rural areas. Access to energy (mainly electricity) would enable income generation not only because one could work after dark, but also because more efficient electric machinery and equipment can be used for manufacturing, hence leading to an increased productivity. The increase in income in turn triggers more investment and a growing demand for electricity (van Ruijven, et al., 2008). Contrary to that general assumption, impact studies underline that access to energy alone is insufficient for the start-up and development of micro-enterprises in rural areas in developing countries (Brew-Hammond, 2010). In addition, experiences from the past are weak predictors for the impact of future connection, since (i) access to energy was mainly gained by those households and enterprises that did have purchasing power; (ii) electricity was delivered at the main rural centra and along the main roads. In these main centres the marketing conditions are better than those in the remote areas where electricity is still lacking (Kooijman-van Dijk, 2012).
Thermal energyThermal energy in rural areas is used for a few productive applications only, like cooking in restaurants, heating water in bath houses, and drying of agricultural products at household level. Industrial use of thermal energy can be found for drying tea, curing tobacco, brewing beer, or brick burning. A UNDP study (2012) elaborates on the importance of energy for tea curing: the tea sector requires both thermal and electrical energy. Thermal energy is required for the withering and drying process; meanwhile, electricity is primarily used for operating fans, to power motors for the cutting, tearing and curling process and vibrating sieves to sort and grade tea. Tea processing is energy-intensive, requiring up to 12 kWh/kg (as compared to 6.3 kWh/kg for steel processing). The literature selected in this review does not count with evaluations of productive use of thermal energy in a rural environment.
Beer brewery in Bukina Faso, using both traditional open fire and improved stoves
| 78 |
Renewable energy and the impact on income and expenditure
PV-energy for lightingIn the case of low voltage electricity at household level, the line between consumptive and productive use cannot always be clearly drawn. The economic viability of micro home enterprises in Bangladesh was assessed by applying cost-benefit analyses to these activities, amongst them a part-time tailor; a grocery shop; a mobile phone charging station, and a repair shop. The conclusion was that these micro productive activities were mainly contributing to reduce the pay-back period of the initial investment made for acquiring the solar installation (Hossain Mondal, 2010). In the case of low voltage electricity supply (SHS) only some 5-15% of households use the newly arrived electricity for productive purposes. In a study in Rwanda, 8% of the connected households (after a minimum of 4 years) developed a novel activity that required electricity, such as commerce, milling, or sewing (Bensch, Kluve, & Peters, 2011). For Senegal, a comparable low percentage was found. Only 12.5% of the peri-urban businesses (of which 85% is informal and not registered) use electricity for productive purposes (mainly cooling of products + ice making) (Fall, Sarr, Dafrallah, & Ndour, 2008). Also for Northern Ghana and the Indian Himalaya it was concluded that low voltage electricity tends to have little impact on productivity and job creation due to the absence of other infrastructure and markets (Kankam & Boon, 2009; Kooijman-van Dijk, 2012).
However, not all studies produce the same results: for Kenya, the percentage productive use was considerably higher: 32% of electrified households reported using light for income generating or work-related activities, such as school teachers who grade papers, farmer and small business owners doing administration, but few activities directly depended upon electricity (shopholders, teachers, tailors) (Jacobson, 2007; Barnes, Khandker, & Samad, 2010). In rural Ghana, public solar PV electrification projects have been installed with a fee-for-services system. In case of fee-for-services, there has been more contribution to rural micro-enterprise development, since the end-user is not (directly) paying for the investment in the SHS and pays only for the service. A survey among eight rural communities in five different regions showed that electricity indeed served to expand the economic activities of micro-enterprises beyond daylight hours. For grocery shops there was a statistically relevant association between solar light, extra working hours and additional income of USD 5-12/month. While comparable benefits were found among tailors, drinking bars and repair shops, it was concluded that ‘only in grocery enterprises with solar PV that extended their working hours after sunset, the additional income values provide convincing evidence’ (Obeng & Evers, 2010).
Additional activities as a result of extended opening hours has a limit of some three hours. Obeng and Evers (2010, p. 226) mention a side effect to the poorest population: night vendors, especially women, selling items such as bread and beverage, fruits, porridge, groundnuts etc. choose their place of sales in front of a shop with electricity and benefit from the (free) light. Jacobson (2007) indicated for Kenya that ‘the role of solar electricity in supporting economic activities is modest, but not insignificant’. Given the distribution of ownership of solar systems, nearly all of the productivity gains are captured by rural middle class families.
Over time, electricity produces indirect impacts on income. Longitudinal studies by Khandker et.al. (2009) in Vietnam and Bangladesh showed a higher (non-farm) income
Renewable Energy: Access and Impact
| 79 |
increase in households with electricity as compared to households lacking electricity. In a multi-wave difference-in-difference study in Vietnam it was found that it pays off to be an early adopter of electricity. The higher income associated to electricity enabled an additional expendi-ture of 25.6% per capita as compared to late adopters (Khandker, Barnes, & Samad, 2009).
For ‘real’ productive use (small equipment and machines), more power is required than supplied by a solar system. This voltage can only be delivered by larger (mini-) grid systems.
Connection to the gridConnection to the grid does not guarantee a high uptake for productive use, but at least the voltage enables the potential productive use of electricity. It is this potential that lures existing micro enterprises to invest in connection to the grid whenever an area becomes electrified. A study in 10 African countries showed that immediately after electrification arrives in an area, the number of newly established enterprises increases substantially, but that many of these initiatives were discontinued soon afterwards (Arnold, Matto, & Narciso, 2008).For rural Benin, the impact of grid extension on 276 small enterprises was measured by comparing them to non-connected firms selected through propensity score matching. In rural Benin some 40% of the population works at least part time in non-farming businesses. Firms created after electrification, amongst them some highly dependent on electricity for their operations, exhibited profits that are considerably higher than non-connected firms. Amongst the already existing firms, hardly or no effect of being connected to the grid on profits could be detected (Peters, Vance, & Harsdorff, 2011). The reason for not having improved profits is the lack of access to equipment and machinery and the fact that they have been able to cope without electricity in the past. On top, the establishment of new firms, that do make use of electricity, crowd out the existing ones. The electricity-reliant manufacturers established after electrification had a superior performance relative to manufacturers in non-electrified villages. On average, the installation of grid electricity led to an 8% increase in rural per capita income over a 5-year period in Benin (Peters, Vance, & Harsdorff, 2011).
A study of rural electrification in Southern Uganda explored the impact on fishing communities near Lake Victoria and did not find any significant difference between communities with or without access to electricity. No evidence was found for an expansionary effect of electrification on either firm profits or worker remuneration. The average monthly expenditure on energy in the non-access areas was 38% higher than in the access areas: the grid electricity happened to be cheaper in nominal terms. Access to the grid also led to a shift in the composition of the capital stock towards more electricity using machinery and equipment. However, the availability of electrical equipment did not trigger an expansion in manufacturing activities. A spin-off of grid electricity was the increase in demand for products of small enterprises as a result of people moving into the electrified communities from surrounding non-electrified areas (Neelsen & Peters, 2011).
Even in a country with a high level of micro home enterprises the use of electricity in rural areas is predominantly for lighting, since only 9% of connected rural households in Vietnam use electricity for productive purposes (Khandker, Barnes, Samad, & Minh, 2009). Nevertheless, measured over a longer period of time, there is a positive impact of rural
| 80 |
Renewable energy and the impact on income and expenditure
electrification on micro home enterprises and small businesses. The World Bank study observed that over a 15-year period, the number of businesses grew significantly more in communities that became electrified than those that did not (IEG, 2008). For enterprises that depend on modern energy services for their operation, the most crucial factor to the enterprises happens to be reliability and predictability of supply.
Table 12 Overview of selected literature on impacts of energy on income and expenditure
Authors year country Relevant object of research
Methodology Overall quality rating*
Barnes, Khandker & Samad
2010 Bangladesh Household energy usage
With-without + modelling
S
Khandker, Barnes Samad & Minh
2009 Vietnam Rural electrification and welfare
Difference in difference
S
Obeng, Evers, Akuffo et al
2008 Ghana Solar electrification Before-after, cross sectional
2011 Rwanda Micro hydro Cross sectional, with-without S
Gustavsson 2007 Zambia SHS Difference in difference
S
Madubansi & Shackleton
2006 South Africa Rural electrification, SHS
Longitudinal difference in difference
S
Obeng & Evers 2010 Ghana SHS With-without S
Jacobson 2007 Kenya Solar electrification and social change
Cross sectional A
Peters, Vance & Harsdorff
2011 Benin Grid extension and micro manufacturers
Cross sectional S
Neelsen & Peters 2011 Uganda Electricity usage in micro-enterprises
Cross sectional S
Khandker, Barnes & Samad
2009 Bangladesh Rural electrification With-without S
Malla, Bruce et al 2011 Kenya, Nepal, Sudan
CBA Before-after (without control groups)
A
Hanna, Duflo & Greenstone
2012 India Improved stoves RCT, before-after with control groups
S
Practical Action 2011 Madagascar Improved stoves Before-after, with control groups
A
GIZ 2011 Senegal Improved stoves RCT, before-after, with control groups
S
Note * : S = strong, A= Average, W = Weak.
Renewable Energy: Access and Impact
| 81 |
6.3 Concluding remarks
Energy use and income associate, in a two-way direction of causality. While in rural areas the ‘better off’ part of the population (civil servants, shop holders, for example) are the first ones to either opt for improved stoves or electricity or both, in the short run this may imply incurring into higher expenditure and not in increasing incomes. Improved stove programmes assume – by definition – that the higher combustion efficiency leads to less firewood consumption and hence to savings to the household, be it either in time or in money. Indeed, cost-benefit analyses in Kenya, Sudan and Nepal showed savings of USD 20-45 per household per year, which is – relative to the household income – a significant amount. Most researchers however, found that improved wood stoves contribute little to savings since in rural areas wood is collected (and users consider their opportunity costs of time to be zero) and the savings earned are compensated by changes in cooking behaviour: the rebound effect.
Although higher combustion efficiency of thermal energy should have an impact on the profitability of rural processing and manufacturing activities, like drying of agricultural produce and brick making, no rigorous impact studies have been identified on that subject.
The shift from kerosene, paraffin and candles to PV electricity does imply a reduction of 10-12% in expenditure for lighting. In practice however, electricity enables households to use appliances they did not use before, and – once acquired the appliances – the energy consuption increases and household expenditure increases as well, between 20 and 50%. Direct income generation from PV installations is mainly restricted to micro home enterprises that make use of extended working hours after nightfall. The additional earnings of the micro home enterprises are modest and are mainly used to reduce the pay back period of the investment made in the installation. In case of fee-for-services, these small extra earnings contribute to the household’s spending capacity. A real contribution to income generation and employment can only be expected from electricity with a higher voltage, hence from (mini-) grids. Existing enterprises are keen in investing in electricity, but may end up being energy losers, since electricity is just an add-on to the existing production system and does not alter the market conditions. It are the newly established firms, highly dependent on electricity for their operations that benefit most and who do generate income and employment.
Over a longer period of time the causality direction between energy – in particular electricity – and income clearly points towards a positive correlation based on making use of electricity. A study about energy use in rural areas in India indicated that over a 17-year period the per capita expenditure on energy over all income brackets had increased substantially, with wide differences across groups, but that average income levels of households had increased as well. Over all socio-economic groups the relative expenditure for energy had hardly changed. Households switched fuel towards cleaner ones, without changing substantially the average expenditure for energy as share of household income. A longitudinal study in Vietnam showed that it pays off to be an early adopter of electricity. While in both connected and unconnected households the family income had increased over time, the household income of connected families had increased more. The study argues that this share is so constant over time, that the income-energy cost ratio could be considered a sound indicator for household welfare.
Renewable energy and the impact on health
7
Renewable Energy: Access and Impact
| 83 |
What are the effects on health indicators, such as respiratory disease symptoms, eye infections, stunted growth of children; and does indoor air pollution reduce if renewable energy sources are used instead of traditional ones?
7.1 Improved stoves and indoor air pollution The majority of selected literature regarding the impact of improved stoves concerns health effects related to the exposure to smoke. Over the last decades the health effects of indoor air pollution (IAP), in particular concerning women and children, have been subject of extensive research. Women and children are assumed to be the most vulnerable to indoor air pollution due to their proximity to the cooking area. Often quoted are the WHO and UNDP, that both estimated that traditional cooking fuels account for nearly 2 million deaths annually (2009), a figure that has recently been updated to over 3.5 million deaths annually (2010 Global Burden of Disease Study, 2012)
The diseases associated to indoor air pollution and hence linked to stoves are: respiratory disease symptoms (ALRI- Acute Lower Respiratory Infections (pneumonia); COPD- Chronic Obstructive Pulmonary Disease), eye infections and stunted growth of children. Linkages between indoor air pollution and tuberculosis and cardiovascular diseases have been subject to research as well, although these findings have not been included here (Kan, Chiang, Enarson, Chen, & al., 2011; McCracken, Smith, Stone, Díaz, Arana, & Schwartz, 2011).
A WHO meta analysis of 25 studies by Dherani et al. (2008) concluded that cooking with biomass – as compared to cooking with clean fuels or improved stoves – increases the risk of pneumonia with 80%. Improved stoves may contribute to reduce health hazards of cooking in two different manners. First, by the reduction of indoor air pollution as a result of a better smoke management. Either less smoke is produced thanks to a better combustion or the smoke is deviated through a chimney, or both. Also a shift to biogas as fuel may contribute to health gains by decreasing the smoke generated by cooking. Second, the health hazards might be reduced by changes in cooking behaviour (for example cooking outside instead of inside the house), or indirectly by using the savings from reduced fuelwood consumption for healthcare.
The majority of the research has been conducted in either Latin America (RESPIRE trial in Guatemala and research in Mexico) and Asia (mainly India). Rigorous impact research on health effects in Sub-Saharan Africa is underrepresented. Impact studies generate different results when it comes to health effects of improved stoves, partly due to the fact that the type of stove employed determines the effects that can be expected. Not all stoves have been designed with potential health effects in mind, especially the smaller transportable stoves frequently used in Sub-Saharan Africa do not count with chimneys and hence cannot be expected to be as effective as large (fixed) ones with a chimney, as found in Latin America (‘patsari’-stove).
Measuring health effects requires medical knowledge, reason why authors of the research on indoor air pollution are predominantly physicians. In the research they make use of objectively verifiable measurement, like a spirometer, or apply lung tests. Studies implemented by non physicians work with perception and recall data (survey), and base their findings on the respondents perceptions about health.
| 84 |
Renewable energy and the impact on health
Parikh (2011) went beyond the indoor air pollution health aspects. He explored the inter-linkages between energy use, health and gender in the Himalayan State of Himachal Pradesh in India. It brings out a gender-differentiated and age-differentiated image of hardships and health impact on the use of traditional biofuels. The study follows the entire chain of fuelwood collection, transportation, processing and combustion, where women act as gatherers, processors, carriers, and cooks. The work is mainly managed by women, although older men help in collecting dung cakes, grasses and fuelwood. Young men happened to be responsible for ‘clean fuels’, like LPG and electricity. The health hazards of biomass fuel do not only refer to indoor air pollution, “but encompass bruising, headache, neck ache, back ache, knee problems and encounters with wild animals and snakes” as well (Parikh, 2011, pp. 7587-89).
How much reduces the indoor air pollution per source of renewable energy versus the traditional ones?
An array of studies exists on indoor air pollution, the measurement of pollution by various sources (amongst them stoves) and the association to health hazards.
Indoor air pollution is usually expressed in terms of Carbon Monoxide (CO) as well as in particulate matter (PM)26. The World Health Organisation Air Quality Guidelines (WHO, 2006) set a benchmark of 0.035 mg/m3 for annual average concentrations of particulate matter, and 0.075mg/m3 for 24 hour concentrations (Interim Target I PM2.5). Note that the results reported below exceed these levels by far. Even if one takes into account the fact that ‘kitchen levels’ are not breathed all day and may be less hazardous than general outdoor air pollution, levels are well above what is considered to be healthy for human beings. Measurement of indoor CO levels shows a closer adherence to the WHO recommended level of a maximum of 7mg/m3 for 24 hours (WHO, 2010).
Next to the ‘kitchen levels’ of indoor air pollution measurement, exist the ‘personal exposure levels’, referring to the level of actual exposure to these air pollutants. These personal exposure level may differ substantially from the kitchen levels as these are influenced by human behaviour. This is further elaborated in the next section.
All authors listed in table 13 concluded that significant gains in indoor air pollution can be observed of improved stoves as compared to the open fire place. The table presents an overview of gains in terms of measured kitchen levels of CO and PM2.5. These are the highest in the case of stoves with a chimney (e.g. Armendariz-Arnez, Edwards, Johnson, Rosas, Espinosa, & Masera, 2010; Dutta, Shields, Edwards, & Smith, 2007; Roden, Bond, Conway, Pinel, MacCarty, & Still, 2009). However, also stoves lacking a chimney achieve substantial reducti-ons in indoor air pollution (Pennise, et al., 2009; Malla, Bruce, Bates, & Rehfuess, 2011). Also Bruce et al. (2004) showed that mean values of particulate matter (PM3.5) were significantly less for ‘planchas’ and for gas/other stoves than for open fires, although also these measures were well above international standards (Bruce, et al., 2004). Furthermore, the higher the pollution levels at baseline level, the more substantial gains can be made by improved stoves (Masera, et al., 2007; Dutta, Shields, Edwards, & Smith, 2007).
26 Particulate matter can be measured at different diameters. PM2.5 – referring to particles with a diameter of 2.5 micrometers or less – is the most commonly used particle size in literature, although PM10 or PM3.5 is also used. The smaller particle fractions are those thought to be most associated with adverse health impacts (Armendariz-Arnez, Edwards, Johnson, Rosas, Espinosa, & Masera, 2010).
Renewable Energy: Access and Impact
| 85 |
Although most authors show a reduction in indoor air pollution, others doubt whether these reductions can be attributed to the improved stove. Dutta et al. (2007) argue that improvements in indoor air pollution seem to be less related to the performance of the chimney or combustion efficiency by improve stoves, but more to changes in fuel use (Dutta, Shields, Edwards, & Smith, 2007). There is also evidence that in those households where PM2.5 and CO concentration did not reduce, it actually increased instead (Chengappa, Edwards, Bajpai, Naumoff Shields, & Smith, 2007). The authors suggest that this could be the result of differences in time devoted to cooking, the lack of familiarity with correct functioning of the stove, e.g. lighting the fire without a pot on the stove, or due to continued use of traditional stoves (Chengappa, Edwards, Bajpai, Naumoff Shields, & Smith, 2007; Dutta, Shields, Edwards, & Smith, 2007). Another reason could be the design of the improved stoves. The introduction of stoves with a chimney in areas where the cooking is tradionally done outside made it more attractive (Burwen & Levine, 2012) or even necessary (Hanna, Duflo, & Greenstone, 2012) to move the stove indoors instead of outdoors.
Table 13 Levels of CO and PM2.5 measured after improved stove intervention
Level of measurement
CO reduction (%)
Absolute Level after intervention in mg/m3
PM2.5
reductionAbsolute Level after interven-tion in mg/m3
27 Converted from 7.4 ppm-9.2 ppm28 1.8 ppm29 In Sudan, post intervention CO concentrations were increased due to supply problems with LPG leading
households to fall back on charcoal.30 3 ppm
| 86 |
Renewable energy and the impact on health
Effects of behavioural interventionsApart from the effect of owning an improved stove, the critical factors are the way in which households actually use these stoves and their cooking behaviour. Incorrect or increased usage of the stove can undermine reductions in indoor air pollution. But also a stove emitting less smoke could appeal women and children to move closer to the stove, or moving the stove from outside to inside the kitchen. The culturally determined aspect of the place of the stove (indoor or outdoor, separate from the living space, or just in the center of it) is of influence on the impact on health. For example, the insulation of improved stoves implies that less heat is radiated to warm the house; households may burn an additional open fire to get the house heated. Evidence as to whether or not behavioural interventions alone can lead to positive results in terms of reducing indoor air pollution is not unanimous. In an analysis based on World Bank and Government of China data on indoor air pollution and children’s health, Yu (2011) emphasizes that behavioural interventions seem to have an important effect in the reduction of respiratory illnesses both by reducing IAP levels as exposure to it (p. 513). Better stove use practice by simply using shorter wood or closing the lid quickly after adding fuel could have a significant impact in reducing high levels of IAP (Yu, 2011). On the other hand, Baris and Ezzati (2007), show for China that no measurable IAP benefits could be measured resulting from health education and behavioural interventions alone. The interventions did have some effects in changing stove use habits, but the results had more statistical significance for those groups that not only received the information, but the hardware (the stove) as well. The findings suggest that behavioural interventions alone are insufficient to change behaviour, since people’s cooking and heating behaviours may be hardly affected by concerns about long-term health outcomes (Jin et al 2005 in Baris & Ezzati, 2007). Research conducted in Madagascar shows that although almost a third of the households having received health awareness training undertook action to avoid smoke exposure, a quarter of the households in the control group had done the same, suggesting that improved behaviour is not necessarily the result of the awareness training (Practical Action, 2011).
What are the effects on health?One of the challenges in the measurement of impact on health is to ensure that the observed changes in health effects are indeed attributable to the improved stove. For example, it could be that households owning an improved stove, are already more inclined to be healthier due to other (unobserved) factors of influence; this is the so-called selection bias. In order to tackle that problem there are various methodological techniques, amongst them the experiment in the form of a randomised trial. A frequently quoted study con-cerning health effects related to indoor air pollution is the RESPIRE study conducted in Guatemala. This study, started in October 2002, applied a randomized experiment in which planchas, improved stoves with chimney, were randomly distributed among households with children less than four months or with pregnant women. These households were followed until the infants were 18 months of age (Diaz, et al., 2007). Assessments of respiratory symptoms and lung function and individual measurements of CO exposure were done at the moment of the baseline study and subsequently every 6 months up to 18 months.
Renewable Energy: Access and Impact
| 87 |
The RESPIRE study produced predominantly positive results: in the follow-up stage a substantial reduction in risk for respiratory symptoms was measured. Furthermore, women in the treatment group reported a reduction of sore eyes during cooking as a result of the improved stove installed; also children experienced reductions in crying and of sore eyes (Diaz, et al., 2007). The RESPIRE data is not positive across all health indicators. For example, it found no significant association between the stove intervention and heart rate variability, no effects on lung function or a reduction in the prevalence of physician-diag-nosed pneumonia for children younger than 18 months (Smith-Sivertsen, et al., 2009; Smith, et al., 2011).
A different field experiment on improved stoves in Guatemala by Ludwinski et al. (2011), conducted among 351 households, also found indications of reductions in indoor air related health problems, with a significant reduction in self-reported respiratory symptoms by 48.6% among women and 63.3% among children (Ludwinski, Moriarty, & Wydick, 2011, p. 657). The studied stoves also had a significant impact on children, yielding a reduction of 0.92 days of coughing over a period of 21 days (Ludwinski, Moriarty, & Wydick, 2011, p. 369). Effects on other health symptoms (eye irritation, back pain and feelings of general fatigue) were not significant, although the coefficient estimates pointed to the likelihood of health improvements in these areas.
Findings from Mexico show that women who reported using an improved stove had significantly lower risk of respiratory symptoms, eye discomfort, headache and back pain (Romieu, Riojas-Rodríguez, Marrón-Mares, Schillmann, Perez-Padilla, & Masera, 2009).
Solid impact evaluation on improved stoves in Africa is scarce, also since the improved stoves have a simpler design, are portable and smaller in size, often without a chimney. In a randomized control trial conducted in rural Senegal findings suggest positive health effects for women responsible for cooking by showing reductions of 8% in self-reported respiratory symptoms and eye problems by 10% (GIZ, 2011, p. 6). An elaborate study carried out in Madagascar comparing ethanol stoves, improved wood and improved charcoal stoves at different moments in time with open fire, found that the ethanol stoves and improved charcoal stoves led to substantial and significant reductions in headaches and eye irritation amongst women in both of the surveyed regions. In only one of the two regions the improved wood stoves showed reductions in headache and eye irritation (Practical Action, 2011).
Although the majority of studies do indicate positive health effects as a result of the implementation of improved stoves, not all studies reach the same conclusion. In a randomized control trial in India, Hanna, Duflo and Greenstone (2012) found no positive effects on health indicators by comparing households with improved stoves and without. Looking at levels of CO in respondents’ breath over the total research period of 5 years, they found a significant reduction in the primary cooks’ breath for the first year of 7.5 up to 12.5 % as compared to the control groups mean (Hanna, Duflo, & Greenstone, 2012, pp. 20-21). However, after the first year this effect had reduced to zero. Also Burwen & Levine (2012) found no detectable decline in personal exposure to CO among the improved stove using
| 88 |
Renewable energy and the impact on health
group although women in this group did report a decline in self-reported respiratory symptoms and irritated eyes. The lack of any significant relationship of these self-reported results on health and measured CO exposure levels, leads the authors to believe that the respondents caused a “courtesy bias” (Burwen & Levine, 2012).
Also a cross-sectional research in Honduras found no evidence for any association between cookstove type or air quality measures with lung function and C-reactive protein concentra-tion (Clark, et al., 2009).
7.2 Biogas and Health
Research conducted in Nepal regarding household impacts of bio-digesters shows positive results on health: almost all households reported an improvement in health after the installation of the bio-digester (Katuwal & Bohara, 2009). After switching to biogas as cooking fuel, 85.5% of the interviewed households reported a reduction of the smoke in the kitchen, even though households were found to still use their traditional stove simultane-ously. The household members were also asked to indicate whether health indicators had changed after the installation of the digester. Among the women suffering from one of the indicated symptoms31, 40% experienced a decrease in eye infections and 41% experienced a decrease in headaches. Women also mentioned to experience reductions in coughing (26%) and in respiratory diseases (24%). Also men and children experienced improvements in their health although much less than those effects experienced by women (Katuwal & Bohara, 2009).
Connecting toilets to the biogas plant could in theory also lead to an improved sanitation level, as it safely disposes of human excreta, but no evaluation data exist so far (Katuwal & Bohara, 2009).
7.3 Electricity and health
Considerably less literature focuses on the relation between electricity and health. The first association is between electricity and health facilities within the community. Two aspects have been evaluated for World Bank funded projects: longer opening hours and having equipment that requires electricity. For two countries (Bangladesh and Kenya) health facilities with electricity were open longer for about an hour a day, but the most commonly claimed benefit of electricity (PV and grid connection alike) is that it helps to maintain the ‘cold chain’ for vaccines.32 While electrification may shorten the cold chain, or make it more efficient, the difference in the proportion of clinics providing immunization services does
31 62% suffering from headaches; 43% suffering from coughs; 31% suffering from respiratory diseases and 56% suffering from eye infections (Katuwal & Bohara, 2009, p. 2671).
32 Many vaccines are sensitive to both heat and cold and need to be kept between two and eight degrees Celcius. In almost all countries, the Ministry of Health organizes a system that keeps vaccines at that temperature between manufacturing and vaccination (the cold chain).
Renewable Energy: Access and Impact
| 89 |
not vary largely according to electrification. In consequence, the impact or eletrification on immunization rates is not strong. (IEG, 2008, p. 94) The research in Bangladesh also showed that more qualified health workers were appealed by communities with electricity (IEG, 2008).
The second association is between electricity and reduced indoor air pollution. Since electricity may replace smoking oil lamps, kerosene lamps and candles, one may expect a health effect. A study concerning the adoption decisions for solar PV systems in Bangladesh reveals that households do take health aspects in consideration. Health risk reduction was found to be a major determinant for choosing the size of the SHS system. This is related to reduction or elimination of kerosene use (Komatsu, Kaneko, Shrestha, & Ghosh, 2011).
A cross sectional survey among rural households in Ghana revealed that nearly 75% of the households depend on kerosene lanterns as the main source of lighting after sunset. The study investigates the relation between solar PV systems and (reduction of ) indoor air pollution. The results indicate that solar PV lighting reduces the proportion of household members being affected by indoor smoke from kerosene lanterns by 50%, and the proportion of household members who get blackened nostrils by nearly a third. 89% of non-electrified households using kerosene lanterns were affected by indoor smoke, while 40% of PV users reported affection by indoor smoke. In this latter group all respondents used – next to PV – also kerosene lamps. Indoor smoke and heat from the combustion of kerosene is also related to catarrh and headache (Obeng, Akuffo, Braimah, Evers, & Mensah, 2008).
Often neglected are the health hazards of locally manufactured wicks for lighting, often solded or welded with lead. Burning such a wick for a few hours in an enclosed room results in lead concentrations sufficient to harm the mental development of children or even to cause foetal demage (IEG, 2008, p. box 5.2).
| 90 |
Renewable energy and the impact on health
Table 14 Overview of selected literature on impacts on Indoor Air Pollution and Health
Authors Year Country Intervention Relevant object of Research
Methodology Overall Quality Rating*
Hanna, Duflo, & Greenstone
2012 India Improved stoves IAP and health RCT before-after with control groups
S
Burwen & Levine
2012 Ghana Improved stoves IAP and health RCT before-after with control groups
S
GIZ 2011 Senegal Improved stoves Health RCT with-without S
Ludwinski, Moriarty, & Wydick
2011 Guatemala Improved stoves Health Before-after with control groups
S
Komatsu, et al.
2011 Bangladesh Solar PV Health Before-after; with without
A
Malla, et al. 2011 Kenya, Nepal, Sudan
Improved stoves CBA Before-after A
Practical Action
2011 Madagascar Improved stoves IAP and health Before-after with control groups
A
Smith, et al. 2011 Guatemala Improved stoves (RESPIRE)
IAP and health RCT before-after with control groups
S
Yu 2011 China Improved stoves IAP and Child health
Before-after with control groups
A
Armendariz-Arnez et al.
2010 Mexico Improved stoves IAP With-without A
Romieu et al. 2009 Mexico Improved stoves Respiratory health
Before-after with control groups
A
Clark, et al. 2009 Honduras Improved stoves IAP and health Before-after A
Katuwal & Bohara
2009 Nepal Biogas Health Before-after W
Smith-Sivert-sen, et al.
2009 Guatemala Improved stoves (RESPIRE)
IAP and health RCT before-after with controls groups
S
Pennise, et al. 2009 Ghana, Ethiopia
Improved stoves IAP Before-after, with control groups
A
Armendariz Arnez, et al.
2008 Mexico Improved stoves IAP and health Before-after A
Obeng, et al. 2008 Ghana Solar PV IAP and health Before-after W
Chengappa, et al.
2007 India Improved stoves IAP Before-after S
Diaz, et al. 2007 Guatemala Improved stoves(RESPIRE)
Eye discomfort, headache and back pain
RCT before-after with control groups
S
Renewable Energy: Access and Impact
| 91 |
Authors Year Country Intervention Relevant object of Research
Methodology Overall Quality Rating
Dutta, et al. 2007 India Improved stoves IAP Before-after A
Baris & Ezzati 2007 China Improved stoves IAP and health Before-after with control groups
A
Smith, et al. 2007 India, Mexico Improved stoves IAP Before-after with control groups
A
Bruce, et al. 2004 Guatemala Improved stoves IAP With-without A
Among the arguments in favour of promoting improved stoves figures the assumed impact on health resulting from more efficient combustion. Better combustion leads to less smoke and hence better air conditions. The health effects have been studied extensively, in particular concerning the effects on women and children. The diseases associated to indoor air pollution are: respiratory disease symptoms and eye infections. Linkages between air pollution and tuberculosis as well as cardiovascular diseases have been subject to research as well. Next to indoor air pollution, there are other health aspects, connected to fuelwood gathering and transportation, like bruising, knee injuries, neck ache, back ache and the like.
Most evaluative research took place in Guatemala, Mexico and India, while research conducted in Sub Saharan Africa is rather scarce. A determining factor for the results is the type of stove employed. Smaller transportable stoves, often found in Sub Saharan Africa, cannot be expected to have a similar impact on health as larger (fixed) stoves with chimney found in Latin America (although some do). In a randomized control trial conducted in rural Senegal findings suggest reductions of 8% in self-reported respiratory symptoms and 10% in eye problems.
It is not the stove itself, but precisely the human behaviour that determines the impact in daily life. Inadequate use, the change from outdoor to indoor cooking, or changing cooking patterns may outbalance the effects of reduced CO and PM in the air. The association between the change to electricity and health is less studied. Indoor air pollution caused by lighting devices refers almost exclusively to kerosene lamps and is associated to catarrh and headache.
There are no significant differences among studies conducted in Asia, Africa or Latin America. Self-reported health indicators seem to show slightly more positive results than diagnosed health indicators.
Renewable energy and social variables
8
Renewable Energy: Access and Impact
| 93 |
What is known about the impact of energy use on social variables, like time savings, safety, study perfor-mance of children and the use of means of communication?
8.1 Socio-economic differentiation
What is the change in status, self-esteem or social integration of individuals and households that have gained access to energy?
As indicated in chapter 5, the use of cleaner fuels and more expensive energy technologies are perceived as having a higher social status. Households not only move upwards the energy ladder out of efficiency reasons, but do so also to demonstrate a higher socio-economic status.
Concerning thermal energy, cleaner cooking is directly associated to higher welfare and less diseases. A study about energy use in rural areas in India indicated that over a 17-year period in all socio-economic groups there had been a significant switch towards cleaner fuels, triggered by the increasing availability of LPG. The relative expenditure for energy (as share of total consumption) had hardly changed, showing a dynamics of households switching fuel towards cleaner ones, without changing substantially the average expenditure for energy as share of household income. However, the share of the less well-off households had risen, showing a further differentiation within each income bracket (Pachauri, Mueller, Kemmler, & Spreng, 2004, pp. 2097-2098).
For lighting energy, studies indicate a strong relation to income. Barnes, Khandker and Samad argue even that the income-energy cost ratio is a sound indicator for household welfare (2010). Studies in Kenya, Zambia and South Africa agree in their findings that access to SHS in rural areas is restricted to higher income levels (civil servants, teachers, shop owners) (Madubansi & Shackleton, 2006). Poor households spend on energy the bare –unavoidable – minimum and when income increases cleaner energy sources are being added to the existing ones. Also a study about solar home systems in Ghana concluded that households with solar home systems are the better-off in the rural society and that the improvements in the quality of life are also reaped by this group, widening the gap between ‘energy poor’ and the ‘energy poorest’ in the community (Obeng, Evers, Akuffo, Braimah, & Brew-Hammond, 2008).
In Kenya, having access to electricity is perceived as having access to ‘higher welfare leisure’, evidenced by the finding that one year after the access to electricity, over 50% of households had acquired electric appliances and had reset the priority from light to the use of the appliances (Gustavsson, 2007b, pp. 803-805). This is frequently the result of cellular telephone use, that enables to increase the household’s markets, and expands the rural-urban connectivity. This is uneven with the rural elite and middle class having greater access to connective technologies than the rural poor (Jacobson, 2007). Also for rural Bangladesh it was found that richer households benefit more than poor households from
| 94 |
Renewable energy and social variables
electrification. Once connected to the (mini-) grid, the unequal consumption of electricity results in unequal distribution of benefits among the households. It deepens the socio-economic differentiation among income brackets in society in the short term, but once electricity becomes a good consumed broadly by all strata in society this difference flattens out (Khandker, Barnes, & Samad, 2009).
8.2 Time savings
What are the time savings of persons responsible for fuelwood provision? For which purpose is the ‘liberated’ additional time being used for?
There are two ways in which an improved stove may save time to its owner or user. First, if the higher efficiency of the stove leads to reduced fuelwood consumption, time is saved in fuelwood collection or buying at the market. In areas where wood is collected, these time savings are probably more substantial, since buying is usually combined with other activities in a multi-purpose market visit. Second, time savings can be obtained by reduced cooking times resulting from better combustion.
Cooking time savingsIf, and how much time is saved in cooking depends on the type of ’improved stove’ in the first place and the counterfactual in the second place. Since not all improved stoves require less cooking time, but on the contrary more cooking time due to lower power output of stoves with covered combustion chambers, and cooking behaviour may change as well, the overall result might even be negative, at least from the perspective of the (usually female) cook.
In Kenya switching from a three-stones stove to an LPG stove for quick meals led to total cooking time reductions of 961 hours per household per year; in Sudan the same switch led to cooking time savings of 119 hours per year per household. In Nepal cooking time reduced with 83 hours per year, using a different kind of stove (Malla, Bruce, Bates, & Rehfuess, 2011). The GIZ Senegal study reported that 84% of the interviewed households perceived cooking to be quicker while using an improved stove. This was substantiated by observed reductions in cooking duration of 21 minutes per meal and 69 minutes per day (GIZ, 2011, pp. 44,45). Also findings from Madagascar underline these findings: the majority of the interviewed house-holds (using either improved ethanol, charcoal or biomass stoves) reported that using the improved stoves made cooking go ‘a bit faster’ (Practical Action, 2011).
Concerning biogas as fuel, research from Nepal at household level found cooking time savings of 43 minutes per day. This also takes into consideration that not all cooking is done on biogas, since 28% of the household continued to use dung cakes as fuel after installation of the digester (Katuwal & Bohara, 2009).
However, cooking time savings are not self-evident. Results of controlled field tests were undertaken in Millennium Villages in Uganda and Tanzania and in all cases (5 different stoves, 3 different staples) significant increases in cooking time were measured ranging
Renewable Energy: Access and Impact
| 95 |
from an additional 5 to 24 minutes needed to cook either matooke, beans or ugali (Adkins, Tyler, Wang, Siriri, & Modi, 2010, p. 181). Hanna, Duflo and Greenstone found no significant effects on cooking time, although the majority of households believed that the stove reduced the cooking time. In practice, the cooking time actually increased (2012, p. 25) since the improved stoves invite for (or enable) longer-term simmering cooking rather than swift cooking.
Fuelwood collection time savingsIt is logical to assume that when less fuelwood is needed for cooking, less time is spent on either gathering or buying wood. However, evaluations on that aspect are not all pointing into the same direction.
The cost-benefit study conducted by Malla et al. (2011) shows substantial time savings as a result of adopting an improved stove. In Kenya and Nepal, annual collection time savings were measured of 64 hours and 152 hours respectively, being the largest contributor for the overall benefit (compared to health benefits, fuel cost savings and cooking time savings) in Nepal (Malla, Bruce, Bates, & Rehfuess, 2011, p. 7524). Also research on biogas in Nepal shows positive results in terms of time savings as a result of adopting a bio-digester. Prior to the installation of the bio-digester women reported to spend more than 3.75 hours per day on firewood collection and dung cake preparation, which was reduced to 2.38 hours (a reduction of 36%) after the installation of the digester. This reduction in time does however go hand in hand with an increase in time needed to fetch water (an increase of 47%), and in feeding the biogas plant (taking half an hour a day) (Katuwal & Bohara, 2009).
In rural Senegal where 97% of the interviewed households reported to collect at least part of the wood used for cooking, 62% uses collected fuelwood only. No significant time savings were measured that can be attributed to the improved stove (GIZ, 2011, p. 43). Even though there were significant reductions in fuelwood use, these were not translated into significant time reductions for fuelwood collection. Several explanations are possible (apart from measurement errors), like that the time spent to collect fuelwood remained the same, but that quantities collected per trip reduced (GIZ, 2011).33 The research by Practical Action in Madagascar does not report significant changes either when it comes to time needed to collect fuel (biomass and charcoal) after having adopted an improved stove (2011). Also other studies show no significant savings in collection time for improved stove users compared to the control group (Burwen & Levine, 2012).
While research confirms that women spend 3-5 times as much time as men on domestic activities (Blackden & Wodon, 2006) the picture for firewood collection is less clear and varies by country. At least one should refute the ‘common wisdom’ that it is always mostly women and girls that are responsible for the bulk of fuelwood collection (Köhlin, Sills, Pattanayak, & Wiflong, 2011; Masera, et al., 2007). In Mexico for example, men are responsible for collecting the firewood, in other countries, like Indonesia in particular the
33 Different factors make it difficult to provide accurate data on this impact area: 1) the unfamiliarity of rural household with time duration; 2) the combination of fuelwood collection with other activities 3) irregular fuelwood collection activity (GIZ, 2011, p. 44).
| 96 |
Renewable energy and social variables
elderly men. Table 15 illustrates the variance in gender disaggregation when it comes to fuelwood collection.
Table 15 Time spent on collecting wood (hours/day)
Country Men Women Children Total
Benin 0.5 2.9 na 3.4
Guinea (rural) 1.6 2.4 4.0 8.0
South Africa 0.35 0.7 na 1.05
Indonesia 0.2 0.1 na 0.3
Burkina Faso 0.03 0.10 na 0.13
Nepal 0.83 2.37 na 3.23
Source: IEG, 2008, p. 89
Other time savingsResearch undertaken by Practical Action (2011, p. 76) also reported time savings by needing less time to clean the kitchen. Specifically the ethanol stove appeared to have reduced the cleaning time by 1.2-1.5 hours on average per week.
The biogas research shows 45% time savings when it comes to cleaning the cooking utensils (Katuwal & Bohara, 2009, p. 2673). The attribution of these savings to the adoption of the bio-digester cannot be substantiated, and could also be the result of some other external factor.
Use of time savingsThe general assumption is that women may profit (more) from potential time savings, as being the persons within the household responsible for cooking and (mostly) for fuelwood collection. It is also argued that by either making fuelwood more easily accessible or by reducing the time spent on wood collecting, there would be potentially scope or increasing women’s involvement in income generating activities (Köhlin, Sills, Pattanayak, & Wiflong, 2011).
Katuwal and Bohara (2009) estimate the total time saved for a female household member after adoption of a bio-digester at 93.7 minutes per day. This includes the time needed for the digester, like livestock caring, fetching water, feeding the biogas plant, firewood collection/dung cake preparation, fodder collection, cooking and cleaning utensils. In response to the question what the respondents did with the time saved, almost a third of the female respondents stated that they were spending more time on social and community works, being participation in co-operatives and in so-called Mother Groups. These Mother Groups are voluntary groups of adult women working on a wide range of community welfare activities, like health and education. Other activities undertaken with the extra time were watching television and listening to the radio (26%) and reading (11.5%). Of all women, 28% said to spend the time on income generating activities, without specifying what these activities exactly entail (Katuwal & Bohara, 2009).
Renewable Energy: Access and Impact
| 97 |
A quantitative analysis of national household survey data in Malawi (Wodon & Beegle, 2006) reveals that the assumption of ‘women making use of time for productive purposes’ is questionable. In Malawi, the population in rural areas works longer hours than urban individuals, while women work more hours than men. Across activities, men have higher income generating work, but chores (including firewood and water collection) are more extensively done by women, such that their total hours of activity exceed those of men. The seasonal differential in working hours is largest for individuals who belong to the poorest quintile of the population. Since the demand for labour is highly seasonal in Malawi, there is a shortage during land preparation and sowing, as well as during harvesting not withstan-ding a general high unemployment. Poor women in rural areas have no other employment opportunities than agriculture. And that is exactly where they are employed in: either as subsistence farmer or contracted by a commercial farmer. Time savings obtained from an improved stove for example, simply implies that women may reduce the pressure on the agricultural activities they already perform.
A GIZ study (2011) in Senegal attempted to provide an insight how time savings have been used by elaborating time activity profiles. However, the data does not substantiate any shifts in daily activities as a result of time saved. Households owning improved stoves even seem to spend more time on household duties than the control households, although qualitative research suggests that the improved stove helps women to do household duties in a ‘less hurried way’ (p. 46). Practical Action reported that the majority of women uses the time saved for other chores, like doing more laundry. A third of the women having more time available spent it in their business (usually a shop or farming) (Practical Action, 2011).
Electricity and time savingsHow time savings would be obtained by electricity is less evident. One may assume that there is some time gains since no –or less– time is spent to purchase kerosene, paraffin, candles or batteries. But since these fuels are usually available from the local retailers, the time actually needed for buying is modest anyhow. No studies have been found that assessed quantitatively these time savings.
Time savings could be obtained if the household purchases time saving electrical appliances. In practice, this requires accompanying social marketing or financing schemes for appliances. Without that the efficiency of domestic chores will hardly improve (ESMAP 2004 in Köhlin, Sills, Pattanayak, & Wiflong, 2011; Sijbesma, Verhagen, Nanavaty, & James, 2009).
Nevertheless, connection to electricity has an enormous impact on time management at household level: watching TV, participation in community activities, shifting domestic tasks to evening hours, increasing time spent reading or doing home business. The time that can be counted as additional to traditional lighting has been assessed by various studies, and the findings fluctuate between one and three additional hours per day (IEG, 2008). For rural Zambia, it was reported that two-thirds of the clients indicated that they had changed their daily routines as a consequence of the access to electrical services through SHSs. Three changes were mentioned: more domestic work is being done at night; time is used for reading or studying at night; and time is destined to radio and TV entertainment. Within
| 98 |
Renewable energy and social variables
one year after having obtained a SHS, 47% of the users had acquired entertainment devices (Gustavsson & Ellegård, 2004, p. 1067). Also for rural Rwanda, there were ‘strong and significant effects on lighting hours that are robust across all methods’, thereby not only confirming that the electricity service is actually used by the households, but also in terms of extending the day with several hours (Bensch, Kluve, & Peters, 2011).
A literature review on the linkages between energy, gender and development prepared as a background paper for the World Development Report 2012, presents several studies that show an increase in female employment as a result of electrification (Köhlin, Sills, Pattanayak, & Wiflong, 2011). Findings from South Africa, Bangladesh and Guatemala show an increase of female employment of 9% after electrification versus no impact on male employment. These findings are largely attributed to the fact that electricity frees up time by increasing efficiency of domestic chores, especially cooking (Köhlin, Sills, Pattanayak, & Wiflong, 2011).
Table 16 Overview of selected literature on time savings
Authors Year Country Intervention Relevant object of Research
Methodology Overall Quality Rating
Burwen & Levine 2012 Ghana Improved stoves Time savings RCT before-after with control groups
S
Hanna, Duflo, & Greenstone
2012 India Improved stoves Time savings RCT before-after with control groups
S
Bensch, Kluve, Peters
2011 Rwanda Electricity Time savings Cross sectional with-without
S
GIZ 2011 Senegal Improved stoves Time savings RCT with-without S
Komatsu, Kaneko et al
2011 Bangladesh Improved stoves Time savings Before-after, with- without modelling
A
Practical Action 2011 Madagascar Improved stoves Time savings Before-after, with-without
A
Adkins, et al. 2010 Tanzania, Uganda Improved stoves Time savings With-without A
Malla, et al. 2011 Kenya, Nepal, Sudan
Improved stoves Time savings Before-after A
Peters & Vance 2011 Cote d’Ivoire Electricity Time usage, fertility
Cross sectional with-without, mixed methods
S
IEG 2008 World Electricity Time savings, use of time for study
Mixed methods, with-without
S
Smith, et al. 2007 Mexico Improved stoves Time savings Before-after, with-without
A
Katuwal & Bohara 2007 Nepal Biogas Time savings Before-after W
Masera, et al 2007 Mexico Improved stoves Time savings Before-after, cross sectional
S
Gustavsson 2007 Kenya Solar home systems
Time usage, welfare
Difference in difference
S
Renewable Energy: Access and Impact
| 99 |
8.3 Safety
To what extent has safety/protection changed?
In rural areas outside the electricity grid, pico-PV systems in combination with the advancement of LED technology (compact fluorescent lamps) have expanded the lighting opportunities in and around the house. Among the perceived benefits of electricity in general, and solar lamps in particular, feeling more secure in the dark is among the most frequently mentioned ones.
Outlet of locally manufactured solar lanterns in Burkina Faso
| 100 |
Renewable energy and social variables
To a certain extent one can measure security; there is an objectively verifiable dimension, for example stumbling outside, robberies, pillages34, harrassment, and animal attacks (snakes, scorpions). There is also a (perceived) dimension of ‘feeling uneasy after nightfall’, being afraid for someone’s one security and for the household members. Few studies have intended to assess the change in security as a result of having light. The exception is a research conducted in Senegal (Bensch, Peters, & Sievert, 2012) that measured how electric lighting affects security attitudes. The difference in (feelings of ) security between SHS-users and households without SHS was measured by both the objective and the perceptive dimensions. While on the objective dimension there was no difference between SHS-users and non-using households, there was a significant difference in the perceived dimension. Members from households with a SHS were leaving the house at night more frequently than those without SHS, in particular small children (less than 12 years old) and women. Among the SHS-users, a significantly lower share (approximately 30%) of adults was afraid when their children would play outside after nightfall (Bensch, Peters, & Sievert, 2012, p. 27). The authors conclude that the fact of having bright light inside and around the house contributes to reducing the fear for the dark in general.
Table 17 Overview of selected literature on safety
Authors Year Country Intervention Relevant object of Research
Methodology Overall Quality Rating
Bensch, Peters & Severt
2012 Senegal Solar home systems
Feelings of safety
Cross sectional, with-without
S
8.4 Study hours and school performance
Have study hours/reading time of children changed?
One claimed benefit of household connection to electricity (including solar lamps and SHSs) is an improvement in the opportunity to study, in particular to children. In literature there are no indications that this opportunity has been a statistically decisive motivation for a household to purchase a SHS (Komatsu, Kaneko, Shrestha, & Ghosh, 2011).
The World Bank distinguishes three channels through which electrification may affect education: (1) time allocation at home, with increased study time; (2) by improving the quality of schools, either through the provision of electricity-dependent equipment, or increasing teacher quantity and quality; and (3) through the availability of TV which may have educational and informative benefits (IEG, 2008).
34 The research was conducted in the destabilized Casamance region where some of the (ex-) separatist forces have changed their activities to pillage and robbery in order to survive.
Renewable Energy: Access and Impact
| 101 |
First, concerning time allocation at home for more study hours, it has to be mentioned that the number of lighting hours is not the single determinant for the time children spend studying at home. The quality in lighting, the brightness, plays an equally important role. In Senegal, although the number of lighting hours did not increase, the children in electrified households dedicate more time to studying than their non-electrified counterparts. This difference is fully driven by more studying time after nightfall (Bensch, Peters, & Sievert, 2012)
Researchers found for Rwanda a small positive effect on children studying at home (Bensch, Kluve, & Peters, 2011), but the same researchers (in part) did not find a similar result in rural Senegal, where not the number of lighting hours increased so much, but the light brightness, the lumen hours (Bensch, Peters, & Sievert, 2012). The reason why the number of lighting hours hardly increased was that families had already extended their lighting hours by using battery torches. Also a research in rural Zambia showed little difference between treatment and control group when it comes to the number of lighting hours at night, but also here a difference in quality, expressed in lumens: from 10-100 lm in the control group to 340-560 lm in the treatment group (Gustavsson & Ellegård, 2004, p. 1087). A vast majority of 97% of the respondents indicated that a good light source was important or very important for the children to be able to study at night. However, after one year over 50% of the SHS-users had reset the priority towards the use of the appliances, mainly television (2 hours usage per day) and reduced the use for light to 1 hour/day (Gustavsson, 2007b, p. 805).A study in the Philippines found that children in electrified households have approximately one hour additional study time as compared to children in the same school-age brackets of non-electrified households (IEG, 2008).
The evaluations of SHSs in rural Zambia found that nearly 80% of the households with SHS electricity had children in the school age bracket. Electricity was used for studying at home, but only in 47% of these homes (Jacobson, 2007, p. 178). Children from households with SHS did spend more time studying compared to their age group that lack these services (Gustavsson, 2007, p. 1292). Evaluation of rural electrification projects in Bangladesh and Vietnam showed educational results that are positive for all children, although boys seemed to benefit more. The boy’s school enrollment went up by 11% (girls 4%) and the number of schooling years increased as a result of the household connected to the grid. Over time, both school enrollment and years of completed of schooling consistently improve with increasing duration of having electricity at home (Khandker, Barnes, Samad, & Minh, 2009). Also for Bangladesh it was shown that villages with electricity have significantly better school outcomes; for example, girls’ schooling years increased substantially, but benefits are slightly higher for richer households than for poor households. As for children’s study hours, it are the richer households that post significant gains from electrification (slightly more for girls than for boys) while there are no significant impacts on study hours by the poor households (Khandker, Barnes, & Samad, 2009).
Secondly, concerning the improvement of the quality of the schools as a result of electrification, the study in Zambia showed that the additional study hours at home did not translate into significant better school performance of children that had electricity at home.
| 102 |
Renewable energy and social variables
The control group was selected by ‘the nearest neighbour’ method, selecting the closest house along the road next to the ‘treated’ household. So the children of both houses with and without electricity attended the same schools and had the same teachers. The author argues that rural schools try to make the living conditions attractive to teachers by equipping the teacher houses with PV installations. Since ‘better’ teachers were attracted by the electricity, the school (both children from households with and without electricity) performed better than schools in communities without electricity. The distinguishing factor was the quality of the teacher, not the additional study hours of children from households with electricity (Gustavsson, 2007a).
World Bank studies on rural electrification projects in Bangladesh and Vietnam demonstrate linkages between better energy services and improved education and livelihoods. A longitudinal study in Vietnam not only found that the duration of study at home increased over time, but that electrification had a beneficial effect on education in general: since not only households got access to electricity, but also schools, schooling outcomes improved (Khandker, Barnes, Samad, & Minh, 2009).
Thirdly, concerning the effect of television on school performance, it should be noted that in many households (Kenya, Bangladesh, India), at least a few years after the first introduc-tion of electricity watching television gets a higher priority than studying at night. In Kenya, albeit watching TV was found prioritised over children’s studies, respondents perceived that exposure to radio and TV broadcast had a positive effect on education as well: it ‘makes the outside world real’; it contributes to the knowledge of the language and it contributes the children to becoming an informed citizen (Gustavsson, 2007a).
In the longer run, children from households with electricity end up having higher educational levels than those without electricity, a difference of almost two years of schooling (IEG, 2008, p. 46)
Table 18 Overview of selected literature on study hours and school performance
Authors Year Country Intervention Relevant object of Research
Methodology Overall Quality Rating
Khandker, Barnes & Samad
2009 Vietnam Electricity Study time children
With-without S
IEG 2008 World Electricity Time savings, use of time for study
Mixed methods, with-without
S
Jacobson 2007 Kenya Solar home sytems
Study time and school perfor-mance, social differentiation
Cross sectional A
Khandker, Barnes, Samad & Minh
2009 Vietnam Rural electrifica-tion
Study time children
Difference in difference
S
Renewable Energy: Access and Impact
| 103 |
8.5 Communication (mobile telephone, television and internet use)
What is known about the use of mobile telephone, television and internet? Did, in response to increased media exposure, attitudes and behaviour change, such as women’s status, fertility, or children’s school enrolment?
One of the major motivations of households to get access to electricity is that it enables to make use of means of communication, like television and internet. Whether this is a major ‘drive’ or not varies from area to area and is related to income. Making use of communication means requires not only that the ether frequencies reach the geographic area of residence of the user, but also that sufficient electric energy is available to power the communication equipment. While (transistor-) radios are powered by dry-cell disposable batteries and therefore have been the main source of communication for households living in energy deprived rural areas for over decades, both mobile phones and television sets require either recharging facilities or a permanent supply of electricity. Although a mobile phone can be charged with a small manual dynamo or a pico-PV set and black and white television sets can be powered by car batteries, various studies (Chaury & Chandra Kandpal, 2010; Olken, 2009; Kemmler, 2007) agree in concluding that the demand for electricity is more and more triggered by the availability of mobile phones and television.
While in Rwanda only 27% of the connected households own a television set (Bensch, Kluve, & Peters, 2011, p. 584), this is almost half (47%) of the rural households in Kenya (Gustavsson & Ellegård, 2004) and Zambia (Gustavsson, 2007, p. 803) and 70% of the rural households in Indonesia (Olken, 2009, p. 8). In Zambia, TV justifies –in the opinion of over 80% of PV users– the additional expenditure (Gustavsson & Ellegård, 2004, pp. 1069-71). This also applies to countries like China, Thailand, and Sri Lanka (Jacobson, 2007).
Self-financedsolarelectrification(inparticularsmallersystems[25-50W])iscloselytiedtoincreased television use, telephone charging and rural-urban communication (Jacobson, 2007, p. 144). Larger solar systems (100-500W) or (semi-) permanent electricity supply enables consumers the opportunity of acquiring modern appliances such colour television sets and refrigerators. The studies by Gustavsson in Zambia on PV energy indicate that although the initial motivation to acquire electricity had been lighting, this changes rapidly towards the use for entertainment and communication, often at the detriment of lighting, since the PV system has limited power capacity. After having connected the electrical appliances, soon the capacity becomes too small and competition among usages leads overcharging and hence to disruption and deterioration (Gustavsson, 2007b; Gustavsson & Ellegård, 2004).
Life changes once television and mobile phones enter the family. The literature about the impact of television and other media on social behaviour has not been exhaustively explored in the present review, but the studies selected indicate clearly the impact on a wide range of attitudes and behaviour. Well-known are studies from Brazil, Venezuela and
| 104 |
Renewable energy and social variables
Mexico about the impact of soap operas and the role models they portray on lifestyle, women’s status and expectations in life (La Ferrara, Chong, & Duryea, 2008). In Zambia, two-thirds of the SHS users stated that they had changed their daily routines as a consequence of the access to electric services through the SHS. Three changes were mentioned: domestic work at night; reading/studying at night; and radio/TV entertain-ment. One side effect of the access to television is that children stay more at home instead of ‘running around in the neighborhood’ (Gustavsson & Ellegård, 2004).
Exposure to television happens to be associated with an increase in school enrolment for younger children. Usually low enrolment in rural areas in India is attributed to poverty, the need for extra ‘hands’ to earn the household income and to survive; the incapacity to pay school fees or books, or even the poor quality of schools and teachers. Television does not change that and in itself it does not cut school fees or improves schools or teachers quality, but it does have an impact on enrolment. This is likely to come from a change in norms and attitudes, where urban-like attitudes and lifestyle are being copied (Jensen & Oster, 2009).
Television changes people’s perception of the world, also about the desirable family size. The Independent Evaluation Group of the World Bank found a positive association between watching television and fertility in nine countries studied, largely attributed to better knowledge about contraceptives and health in general among the more literate women (IEG, 2008). Also Jensen and Oster (2009) highlight the impact of television in that respect. Using data from India they related the roll-out of cable TV to women’s attitude and vision and found that women’s acceptance to domestic violence decreased substantially; the preference for having sons instead of daughters declined; while female education and participation in the labour force increased. Television may affect fertility by providing information on family planning services or women may be given more freedom to do things outside the home such as going to the market, because the value of women’s leisure is increased by television. However, the view that ‘television is an alternative to sex’ is not supported by research data; on the contrary, the sexual activity is higher in those house-holds that do own television for a longer period of time, where women have a higher contraceptive knowledge (IEG, 2008).
Television exposes rural households to urban lifestyles, values and behaviours that are radically different from their own and rural households begin to adopt or emulate some of these (Jensen & Oster, 2009). A slightly more complex relation was found in an evaluation of a rural electrification programme in Cote d’Ivoire. While in the rural areas households with electricity showed less fertility than those lacking electricity, in the urban context residents with electricity had slightly more children than city dwellers lacking electricity (Peters & Vance, 2011). This has possibly to do with the higher income level (less child mortality in the 0-5 age bracket) and reduced period of breastfeeding in the urban context.
Jacobson (2007) describes the impact of an increasing number of rural Kenyans with PV power receiving national and international news through radio and television broadcasts and by using mobile telephones. Since access to electricity is largely limited to the rural elite and middle class, also the rural-urban connectivity is uneven, with some people (the elite
Renewable Energy: Access and Impact
| 105 |
and middle class) having more connections to urban areas than others. This leads to a reduction of cultural differences between the rural elite and the urban middle class, but at the same time to a growing distance among social strata within the rural areas. The improved connections are also ‘used’ by the political power, where the ruling party has monopolized the control over news and information in the country. Urban business advertisers may focus on rural consumers, in particular through radio, which leads to a gradual integration of rural customers into international consumer goods markets. Mobile phone communication is more rural-urban (55% of all calls) than rural-rural. While intra-family calls are ranking first, a high 35% of all calls are explicitly related to commercial activities of any sort (such as gathering information about goods or ordering spares or products) (Jacobson, 2007, pp. 156-157).
But apart from the impact of television on the norms and attitudes of individuals or households, there are impacts on the societal organisation as well. Olken (2009) measured the impact of radio and television on social capital in Indonesia. In that country, on average, 70% of the households own a television and 73% own a radio. Olken associated the strength of signal reception in relation to the time a household spends watching television and listening to radio. This was further linked to participation in social organisations; and subsequently related to self-reported trust and participation at village level. His study revealed that each additional television channel for which the signal is strong enough to be received over-the-air is associated with villagers watching, on average, about seven minutes of additional television per day. And this is related to a decline of about 3% in the number of people that are attending meetings at village level and on aggregate, over the longer term associated with a reduced number and diversity of groups that exist within a village. These results underpin Putnam’s (1993) classic statement that lower levels of social capital (participation) lead to deterioration of (local) governance (Olken, 2009).
There is an increasing flow of literature on negative impacts of television as well, such as erosion of cultural values and even language; reduced social integrity; reduced time for studying; reinforcement of sterotypes about women in advertising, videoclips and soaps; or increased obesity resulting from decreased physical activity and increased consumption of advertised unhealthy food (Köhlin, Sills, Pattanayak, & Wiflong, 2011).
| 106 |
Renewable energy and social variables
Table 19 Overview of selected literature on communication and social change
Authors Year Country Intervention Relevant object of Research
Methodology Overall Quality Rating*
Peters & Vance 2011 Cote d’Ivoire Electricity Time usage, fertility
Cross sectional with-without, mixed methods
S
Olken 2009 Indonesia Electricty Electricity, TV and social change
Difference in difference
A
Jacobson 2007 Kenya Solar home sytems
Study time and school perfor-mance, social differentiation
Cross sectional A
Bensch, Peters & Severt
2012 Senegal Solar home systems
Feelings of safety Cross sectional, with-without
S
Gustavsson 2007 Kenya Solar home systems
Time usage, welfare
Difference in difference
S
Note * : S = strong, A= Average, W = Weak
8.6 Concluding remarks
Renewable energy programmes frequently claim a number of expected social impacts to justify the promotion and support to these programmes. Among those expected impacts figure time savings (and hence opportunities for productive use of that time); extended study hours and hence better school performance; feelings of safety, and communication and entertainment.
Impact evaluations teach that all those claims can be confirmed, but not always. And that – next to the benefits – there is a flipside as well.
Resulting from the use of improved stoves or biogas stoves time savings can be made because less time is needed to collect or buy wood; and by reducing cooking time. Indeed, research confirms that substantial time savings can be made on wood gathering or buying, varying from several minutes to a few hours per day. But not always: some authors did not find any significant reduction of time destined to wood gathering (Senegal, Madagascar). One of the reasons can be that fuelwood can be collected at very large distances only and takes time anyhow, be it for larger or for smaller quantities. Little evidence exists for reduced time spent on cooking; in fact some studies indicate the opposite: more time is spent on foods that require more simmering.
Since hardly any time is spent on purchasing kerosene, paraffin, candles or batteries, the change to electricity does not produce any time savings here. If and when the introduction of electricty is accompanied by facilties to acquire appliances that save time in domestic
Renewable Energy: Access and Impact
| 107 |
chores, time savings may occur. However, among the selected studies none actually quantifies these savings.
Connection to electricity has an enormous impact on time use and management at household level: watching TV, shifting domestic tasks to evening hours, increasing time spent on reading or doing home business. The time that can be counted as additional to traditional lighting fuels has been assessed in various studies and fluctuates between one and three hours per day after nightfall.
Apart from one study conducted in Senegal, little is known about how electric lighting affects security attitudes. The study concludes that the fact of having bright light inside and around the house contributes to reducing the fear for the dark in general.Whether children study more at home once the household becomes connected to electricity is positively answered in studies in Vietnam, the Philippines and Bangladesh. Here it was also found that electrification had a beneficial effect on education in general, because not only households got access to electricity, but also the schools. Over time, both school enrollment and years of completed of schooling consistently improved with the duration of having electricity at home. For Bangladesh it was shown that girls’ schooling years increased substantially, while benefits were slightly higher for richer families than for the poor. But also in this respect there are no general findings: in Zambia, children from households with SHS do spend more time studying compared to their age group that lack these services, but the additional study hours did not translate into significant better school performance. Schools in villages with electricity performed better than schools lacking electricity.
The major impact comes from television and communication. Television brings a radical change in the rural areas: urban lifestyles are being copied resulting in lower fertility, less acceptance of domestic violence; increased school enrolment of girls; increased female participation in the labour force. Mobile phone communication is predominantly rural-urban and a high 35% of all calls are explicitly related to commercial activities of any sort. Social research in Indonesia found that watching television led to a deterioration of community organisation and social capital.
Renewable energy and CO2 emissions
9
Renewable Energy: Access and Impact
| 109 |
What is known about the effect of fuel switch on the reduction of CO2 emissions?
The reduction of greenhouse gas (GHG) emissions is key in the debate about renewable energy in developing countries, since it links technological change to development and climate change. Pursuing a development path that is cleaner and more sustainable may imply less dependence on imported fuels. Concerning environmental impacts, the literature review is limited to the impact on CO2 emissions. Other (potential) environmental impacts, like the visual and aesthetical impact, the effect on the ecosystem (flora and fauna), on water resources (thermal discharges), safety hazards, routine and accidental releases of chemicals (PV batteries), use of toxic and flammable materials during construction, pollution as a result of waste disposals (lead – acid batteries) and more (Tsoutsos, Frantzeskaki, & Gekas, 2005) have not been taken into consideration in the review.
The review produced few ‘rigid’ evaluations when it comes to fuel switch and CO2 reductions in developing countries, apart from studies related to improved stoves. Articles related to renewable electricity are either at a high level of aggregation or based at environmental impact assessments that do not necessarily make use of quantitative evaluative methods.
Renewable energy has been described as the linking pin between two global challenges: development and climate change. While the development of industrialized countries has been the major contributor to increased greenhouse gas emissions, the poorest countries – that have contributed least to GHG – are faced with pursuing a development path that is ‘cleaner’ and have to mitigate the impact of global climate change simultaneously. Poor countries are in need of a ‘synergistic strategy’ of low carbon technology without jeopardizing their opportunities for human and economic development. There is a growing consensus that poorer countries should not have to ‘pay the price of fixing the climate problem’, either directly (by paying the additional cost of low carbon technologies) or indirectly (by not developing at a speed that would have been achieved by using higher carbon technologies) (Yadoo & Cruickshank, 2012). In practice, various developing countries already rely heavily on renewable energy resources to power their grid network. In Rwanda, for example, renewable energy constitutes 53% of total electricity generation.
Carbon offset markets offer a source of potential revenue for low carbon energy programmes. These markets award tradable certificates – called carbon credits – for a reduction in GHG emissions relative to an estimated baseline. One carbon credit represents a reduction of one tonne carbon dioxide equivalent (tCO2e).35 Globally some 190 million tonnes of CO2 are produced from non-renewable fuel-based energy generation methods each year. The review does not encompass the vast literature concerning the generation and trade of carbon credits, but presents a brief overview of the mechanism in section 9.5 of this chapter.
35 One tCO2e is equal to one tonne of CO2 or a specific quantity of other greenhouse gasses (methane, nitrous oxide, etc.) that has an equivalent global warming potential over a given time period (usually 100 years).
| 110 |
Renewable energy and CO2 emissions
9.1. Improved stoves and fuelwood savings
How much fuelwood is effectively saved per household (taking into account cooking behaviour) as compared to non-renewable sources?
Various of the envisaged benefits of improved stoves are based on the assumption that these would have a positive effect on the quantity of fuelwood a household requires for daily cooking. The effects related to CO2 reductions and deforestation are also based on the assumption of reduced wood consumption thanks to improved stoves or biogas installations. In the first place, more efficient combustion of firewood and better heat transfer of the improved stoves leads to lower levels of gas emissions. In the second place, a reduction in the use of firewood can also have positive effects on levels of deforestation. To substantiate claims at this level, care should be taken to look into broader issues influencing deforestation, such as to what extent wood used for cooking is taken from a non-renewable source (or is only dead wood used) and whether the wood that is no longer used for cooking, is now used for other purposes. Prior to looking into calculations of potential contributions of improved stoves to CO2 reductions, this section is restricted to fuelwood savings as potential result of more efficient combustion in improved stoves.
Better combustion and resulting fuelwood savings are factors often measured in (field) laboratory circumstances. Levels of fuelwood savings are even the distinction that allows to bear the tag of ‘improved’ for stoves. In most cases, a 40% reduction in wood use can be taken as the discretionary threshold for ‘improved’ stove, although some claimed savings can run up to 70% (Onil stove in Guatemala). For understanding the level of fuelwood savings, several aspects should be taken into account. First, the type of measurement applied, taking into consideration that the names used of the different tests are not always consistently applied among authors. Table 20 provides an overview of different stove testing methods. Since laboratory test measurements of firewood savings, as well as near-laboratory settings (Controlled Cooking Tests) are not compatible to measurements in real life settings (e.g. Johnson et al. 2008; Bailis et al., 2007) these have been excluded. Although Kitchen Performance Tests in the field can also be ‘controlled’ to a certain extent (e.g. by cooking a certain dish, at a certain moment in the day, with a specified type of wood), results of these tests have been included in this section. Second, it is of importance whether one considers fuelwood savings per dish or per day. Estimates per day encompass potential changes in cooking behaviour that may obscure fuelwood savings resulting from more efficient combustion. This rebound factor can be controlled for by including detailed information on cooking behaviour. Third, crucial in determining savings is the counterfactual. In many cases households that switch to an improved stove, already made use of some sort of stove (and not an open fire). Not all authors reporting on fuelwood savings are precise in defining this counterfactual.
Table 20 Stove testing methods
Renewable Energy: Access and Impact
| 111 |
Table 20 Stove testing methods
Test Types Description
Controlled Cooking Test Conducted in laboratory or near-laboratory settings with simulated cooking. This type of testing aims at making comparisons among stoves types as easy as possible. An example of this is a Water Boiling Test.
Kitchen Performance Test Cooking real meals at household level, although settings can be controlled to a certain extent, like the kind of meal to be prepared and with what wood.
Uncontrolled Field testing Conducted in the course of an actual dissemination effort with real households cooking. This supposedly should give the best indication of change, since changes in household cooking behaviour are implicitly taken into account.
Fuelwood savings debateSince fuelwood savings are measured in different settings, in different countries and with different stoves, research findings should be dealt with cautiously. Research by Ludwinski, Moriarty, & Wydick (2011) conducted in Guatemala reports larger amounts of firewood savings as compared to other studies. Measured in cargas (a local measure to indicate the amount of wood an adult can carry from the forest), the authors report a reduction in wood consumption of – on average – 59.1% after the introduction of a new improved stove (p. 657). In absolute figures this implied a reduction of 13.7 kg of wood per day. Since all wood is gathered from the local forest, the authors estimated potential reductions in wood harvesting of up to 4.98 tonnes of wood per household per year (Ludwinski, Moriarty, & Wydick, 2011, p. 666). The improved stove studied in this case is an improved version of a stove already considered as ‘improved’ i.e. the plancha, and its level of sophistication is expressed by its price (USD 105).
Results from Kitchen Performance Tests in Mexico and India show statistically significant reductions in fuel use per person ranging from about 20% up to 67 %, although fuel use here also encompasses LPG and other fuel types (Smith, et al., 2007). Households in India using wood and dung as cooking fuel, were found to reduce fuel consumption with around 19% after the adoption of an improved stove. Also in China statistically significant reductions in fuelwood consumption was measured by the improved stove owning households in comparison to the control group (Yu, 2011).
Improved stoves in Sub-Saharan Africa have a simpler design than the ones used in Latin America and Asia, are mobile and often used in the open air. Research in rural Senegal shows significant results in savings of firewood per dish cooked on an improved stove as compared to an open fire (2.2 kg versus 4.2 kg of firewood) of 47% (GIZ, 2011, p. 38). Even when taking into account that traditional stoves are still used next to the improved stove, firewood savings are substantial: almost 27 kg are saved per week in every household after introduction of the ICS. Overall, a savings rate between 26% and 30% across all improved stove using households was measured (GIZ, 2011, p. 40). In urban Senegal, where charcoal is the principal energy source for the improved stoves, average savings per dish compared to a
| 112 |
Renewable energy and CO2 emissions
traditional charcoal stove are 25-26%. However, in this case the rebound effect (more side dishes were cooked) was that strong that the potential savings were entirely lost (Bensch & Peters, 2011). A field test carried out by the household cooks in their own kitchen with their own firewood, with food provided by the researchers, in Uganda showed statistically significant fuel savings of 38% to 46% relative to the three-stone fire. Tested stoves in Tanzania showed a statistically significant reduction of 22% to 36% for beans and from 25 – 41% for ugali (which is the staple food) (Adkins, Tyler, Wang, Siriri, & Modi, 2010). For Uganda, where plantains are the main staple, the authors calculated the annual savings to be 420-490 kg of fuelwood per year per household (Adkins, Tyler, Wang, Siriri, & Modi, 2010).
There are also authors that did not find any wood savings from improved stoves. This is not related to technical deficiencies of the stoves, but to household behaviour. In a Randomized Controlled Trial in India, Hanna, Duflo and Greenstone (2012) measured no significant change in the use of fuelwood, although over 60% of the households believed that the improved stoves use less wood (p. 24). Also Burwen and Levine (2012) found no statistically significant savings in Ghana. Earlier research conducted by Nepal, Nepal and Grimsrud (2010) partly underlines these findings, stressing that compared to the open fire, the improved stove yields lower coefficients than other stoves (kerosene and mud-stove) in terms of fuelwood reduction, but that all reductions in consumption of fuelwood are statistically insignificant (p.13). There are several reasons that could explain this. Next to the rebound effect (for example, having warm water the entire day) other reasons could be improper use, the simultaneous use of traditional and improved stoves, the fact that improved stoves are often more comfortable when the stove keeps running; or that the heat from the traditional fire place is missed and that separate house heating is required. Table 21 summarizes the main findings regarding fuelwood savings.
Table 21 Fuelwood savings
Authors Country Improved stove type Methods Fuelwood savings
Hanna, Duflo, & Greenstone (2012)
India Fixed two-pot mud stove with chimney
RCT; real life field testing None
Burwen & Levine (2012)
Ghana Clay fixed stove with chimney
RCT; real life field testing None
GIZ (2011) Senegal Simple portable stove Real life field testing 26 - 30%
Ludwinski, et al. (2011)
Guatemala Fixed ceramic stove with chimney
Real life field testing 59.1%
Adkins, et al. (2010)
Tanzania, Uganda
Simple portable stove In field Controlled cooking test
22 - 46%
Nepal, et al. (2010)
Nepal Mud-brick improved stove
Real life field testing None
Smith, et al. (2007)
India, Mexico Fixed cement; with/without chimney
Kitchen Performance Test 20% - 67%
Renewable Energy: Access and Impact
| 113 |
9.2 Improved stoves and reduction of CO2 emissions
Impacts on the reduction of CO2 emission can only be expected if less fuelwood is used indeed. In the measurement of CO2 emission of improved stoves, not only the combustion efficiency and cooking behaviour should be considered, but also the compensatory effect of renewable fuel harvesting. Quantitative studies that assessed the full spectrum of reduced CO2 emissions are the ones by Johnson et al. (2008; 2009). These authors looked at GHG36 reductions resulting from the use of the Patsari stoves in Mexico. Although these studies applied a wide range of technical devices to measure emission levels at household level, the sample of households was rather small. Johnson, et al. (2008) first estimated GHG reduction levels by comparing households using brick and mud-cement Patsari stoves to households using open fire places. Both brick and Patsari stoves performed better in terms of emission of CO, CH4 and TNMHC as compared to an open fire. However, when looking at CO2 emission rates, the open fire seems to score better for unexplained reasons. Reductions in GHG can be transferred into CO2-equivalents to express their contribution to Global Warming. Using the WISDOM model (Woodfuel Integrated Supply/Demand Overview Mapping model), the authors calculated that open fires produced the largest “Global Warming Commitment”, being 23% and 45% more than mud-cement and brick Patsari respectively (Johnson, Edwards, Frenk, & Masera, 2008, p. 1214).
Figure 10 Global Warming commitments, estimated for daily stove use in Mexico
TNMHCCOCH4
CO2
300
250
200
150
100
50
0open re
GW
C pe
r kg
woo
d bu
rned
(CO
2 g
[c] k
g-1)
brick Patsarimud-cementPatsari
Source: Johnson, Edwards, Frenk, & Masera, 2008
36 There is a difference between the set of GHG emissions as defined by the Kyoto Protocol and the full set of GHG. The GHG set encompasses carbon dioxide (CO2), methane (CH4), carbon monoxide (CO), and total non-methane hydrocarbons (TNMHC). The Kyoto set of gases only include CO2 and CH4 (Johnson, et al., 2009). In this section we will look mainly at C02 or CO2-equivalent, which is a measure to describe how much global warming a given type and amount of GHG may cause, using the functionally equivalent amount or concentration of CO2 as a reference.
| 114 |
Renewable energy and CO2 emissions
Taking these findings further by using a model based on a Geographic Information System that estimated the community-level fraction of non-renewable fuelwood harvesting, Johnson et al. (2009) reported mean annual savings for the 603 Patsari using households of 3.9 tonnes CO2-e per home per year, based on a fraction of non-renewable fuelwood harvesting of 39%.
An intriguing question is whether poor households are willing to pay a premium for renewable energy out of environmental considerations and awareness. The general assumption is that consumers from a developing country are too poor to pay for green/ethical products in the marketplace. This assumption was tested by means of an experimental design at fuelwood markets in Guatemala, enquiring whether households were willing to pay more for legal (renewable) rather than illegal firewood. The experiment resulted in close to half of the participants (49%) choosing legal fuelwood, even at a higher cost, under the condition that they are well informed. More inclined to make environmentally aware choices are younger and female customers. The average price premium in favour of legal firewood equaled 21% over the base price for a bundle of loggs. The researchers concluded that the assumption that consumers in developing countries are ‘too poor to be green’ does not hold under all circumstances (van Kempen, Muradian, Sandóval, & Castaneda, 2009).
9.3 Biogas and reduction of CO2 emissions
Almost no evaluative results are found in the selected literature about the environmental effects of biogas use. Katuwal and Bohara (2009) use 2007/2008 survey data among 461 respondents from 15 districts in Nepal to enquire and analyse the benefits of biogas. Without proving any causality, they found that biogas owning households reduce their firewood consumption by 53% (p.2672) after receiving a bio-digester. Based on this reduction they estimate that a household with biogas saves about 3 tonnes of firewood per year. Using emission coefficients for non-sustainable firewood of 1.5 tonnes of CO2-e per tonne saved, this would result in nearly 4.5 t of carbon emissions per year.
9.4 Renewable electricity and reduction of CO2 emissions
While electricity in itself is a ‘clean’ form of energy, the generation of it is not necessarily ‘clean’ as well (coal or crude oil). Renewable electricity technologies, like solar PV and micro hydro electricity provide obvious environmental advantages compared to fossil fuel generated electricity. The main advantage is related to the reduced CO2 emission, and, normally, absence of any air emissions or waste products during the operation. For lighting alone, about 11.5 million tonnes of kerosene is burned every year in developing countries, mostly in lamps made of a tin container and a wick. That way, kerosene is very inefficiently burned and due to incomplete combustion it actually produces other greenhouse gases which stay in the atmosphere for decades (Barnes, Khandker, & Samad, 2010).
Renewable Energy: Access and Impact
| 115 |
Since the connection to electricity is accompanied by new investment needs for appliances, families ‘save’ on other purchased fuels, in particular for lighting, such paraffin, and opt for ‘free’ fuels like fuelwood. In South Africa, the introduction of electricity was not associated with a reduction in fuelwood consumption; it even contributed to an increase in fuelwood collection (Madubansi & Shackleton, 2006).
In order to compare renewable electricity technologies with conventional ones as far as it concerns GHG emissions, usually a life-cycle analysis (LCA) of each technology is conducted. The LCA does not only consider the emissions during generation, but also at the manufacturing (and eventual disposal and waste management) stage. LCAs also take into consideration the emissions produced during the manufacturing of the generation equipment (for example crystalline modules for solar energy). In consequence, the emission during operation might be zero (like in solar PV), but the LCA is not zero when other aspects are taken into consideration. The following overview is based on sources used by Yadoo and Cruickshank (2012) and Tsoutsos et al. (2005).
Table 22 Life-cycle GHG emissions for various technologies
Energy source Range of LCA GHG emissions in gCO2-e/kWh
Coal generated electricity 950-1360
Oil generated electricity 500-1200
Gas generated electricity 440-780
Geothermal generated electricity 170
Solar PV 43-90
Wind energy (off and on-shore) 8-30
Pico and micro hydro electricity 1-41
Biogas NA
Biomass 35-99
Source: Own summary based on Yadoo & Cruickshank, 2012, p. 592 and Tsoutsos, Frantzeskaki, & Gekas, 2005, p. 290
A comprehensive study about the environmental impacts of solar energy technologies (Tsoutsos, Frantzeskaki, & Gekas, 2005), including life cycle aspects, indicated that during the operational stage, solar energy contributes to the reduction of greenhouse gases (mainly CO2, sulphur dioxide SO2 and nitrogen oxides NOx) and prevents toxic gas emissions (SO2, particulates), but that a life cycle analysis produces different results. The production of the current generation PV’s is energy intensive (especially crystalline and the mono-crystalline modules) and requires large quantities of bulk material. Small quantities of scarce material are required including the toxic Cadmium (2005, p. 293). In the case of poly- and mono-cristalline modules, the estimated emissions are 2.7-3.8 kg CO2 /kWp, 5.0-5.5 kg SO2/kWp and 4.5-5.3 kg NOx/kWp. Although some raw material has to be hauled over long distances, the CO2 emission due to transport represents only about 1% of the total emission produced in the manufacturing process. In the case of SHSs one has to add the
| 116 |
Renewable energy and CO2 emissions
emissions released in the production of the batteries. Depending on the manufacturing process, these can be substantial and vary according to location. However, ‘the total emissions are fewer than those of conventional fuel technologies’ (Tsoutsos, Frantzeskaki, & Gekas, 2005).
Apart from the life-cycle GHG emissions for various technologies for electricity generation and use, some impact studies focused on the savings in GHG emissions for solar energy in particular. Since solar energy is considered to be a ‘clean technology’, the comparison is usually made to the use of kerosene or oil lamps and candles (Contreras, 2008). Even with modest kerosene savings at household level, decentralized PV systems contribute to GHG mitigation (Chaury & Chandra Kandpal, 2010, p. 2274). A large survey in Bangladesh indicated that poor families with access to electricity consume 40% more energy than those who do not have electricity. To most households this implies that kerosene is continued to being used next to electricity, but households that switched to electricity consume one liter less of kerosene per month than those without electricity. That leads to a reduction of 2.8 kg/CO2 per household per month. While high income brackets use more electricity and less kerosene than low income brackets, they all consume more energy over time. In consequence, the real reduction in CO2 emission is less than what would theoretically be expected, but still significant (22-25% less CO2 emission) (Barnes, Khandker, & Samad, 2010, pp. 30-35).
9.5 Generating carbon credits
To what extent do small renewable energy devices generate carbon credits of which the proceeds are actively been used?
In this section, a brief presentation is made of the Kyoto Protocol commitments, for informa-tive reasons and – strictly spoken – does not pertain to the literature review.
At the moment of the elaboration of this review (2012) there were two broad categories of carbon offset markets operating in parallel, each with its own procedures and ‘prices’ or ‘premiums’: the so-mentioned compliance markets and voluntary markets. The difference between the two lies in whether those purchasing carbon credits have legally binding emission reduction commitments. Of particular interest within compliance markets is the Clean Development Mechanism (CDM) of the United Nations Framework Convention on Climate Change (UNFCCC), which is one of three flexible mechanisms of the Kyoto Protocol, along with Emissions Trading and Joint Implementation.37 It has two aims: 1) assist ‘industria-lized’ countries (listed in the so-mentioned ‘Annex I’) to achieve compliance with their quantified emission reduction commitments by purchasing carbon credits from non-Annex I countries; and 2) promote sustainable development in non-Annex I countries.
37 Emissions Trading allows industrialized countries (known as Annex I countries) of the Kyoto Protocol to meet their emission reduction commitments by buying greenhouse gas emissions permits from other countries. These permits will generally be sold or allocated to firms by the general government and be compliant with the national emission ‘cap’ (or target). The best known example is the EU’s Emission Trading Scheme. Joint Implementation allows Annex I countries to secure carbon credits towards Kyoto commitments by investing in emission reduction projects in other Annex I countries.
Renewable Energy: Access and Impact
| 117 |
At the 17th Conference of the Parties to the UNFCCC in December 2011, it was agreed thatthere will be a second commitment period to the Kyoto Protocol. While the UNFCCC prefers the continuation of the CDM, Canada, Japan and Russia have refused to join. The European Union has stated that it will comply with its emission reduction commitments to 2020, and that it will continue to allow CDM credits to be traded via its cap-and-trade system, the EU-Emission Trading Scheme (EU-ETS). In the case of projects that begin after 2012, only projects hosted in the Least Developed Countries (LDCs) will be eligible. This shift in policy may result in an increase in demand for CDM credits from LDCs. Due to regulatory uncer-tainty and oversupply in the EU-ETS, the price of CDM credits, called certified emission reductions (CERs), has dropped significantly (Hogart, 2012).
Voluntary offset markets are much more diverse than mandatory markets. They often have less strict requirements than the CDM in regards to monitoring and third-party verification. As a result, the value of carbon credits in voluntary markets, called Voluntary Emission Reductions (VERs) 38, is generally higher than CERs.
Carbon emissions in developing countries are primarily generated by small-scale sources. There are relatively few large-scale sources like industry smoke stacks. This implies that the reduction of emissions depends on small units that – in many countries – are geographically dispersed. This profile presents a number of challenges for carbon credits, such as the high transaction costs, aggregation of the offsets, the establishment of an operationally suitable methodology for measurement and credit, the monitoring of emissions reductions in a cost-effective manner and the establishment of (or calculation of ) a sound baseline situation. To overcome the risk of incorrect reporting, carbon trading involves a series of steps for quality assurance. These steps vary from market to market. In the case of the CDM, the steps include a representative of the national government, called a Designated National Authority (DNA), who must approve each project, with the purpose of ensuring that it complies with the ‘sustainable development’ goal of the CDM; a third party called a Designated Operational Entity (DOE) must validate the project design and register the project with the CDM Executive Board; the project implementing entity must monitor that offsets are achieved; and the DOE must verify that the emission reductions are authentic through a periodic independent review. The costs of these steps are disproportionally burdensome for single projects on a household scale, such as is the case with solar panels or improved stoves.
In order to overcome these transaction costs and reach a volume significant enough to access the market, small-scale projects can trade large numbers of carbon credits in aggregate. Within the CDM, two strategies exist to aggregate projects: the Bundling Approach and the Programmatic Approach (pCDM). ‘Bundling’ involves combining several projects together. The procedures for bundling are relatively well established, however they involve rigid restrictions. For instance, each project in the bundle and its location must be known ex-ante. If the bundle were to qualify as a small-scale project, and thus benefit
38 VER is a trading deal, managed by the World Bank, which is made between the country and a private company which want to buy the carbon credits to offset its own emissions (Katuwal & Bohara, 2009).
| 118 |
Renewable energy and CO2 emissions
simplified baseline and monitoring methodologies, the combined size of the emissions reductions must be below the “small-scale threshold” defined by the EB. Because the composition of the bundle may not change over time with the exit or entry of new projects and because there is a cap on the total size, the Bundling Approach to aggregating projects inhibits the entrance of scalable business models. To permit scalable projects, the programmatic CDM (pCDM) was introduced in 2007. Under pCDM “an unlimited number of project activities, over a wide area and starting at different times, can be administered under a single administrative umbrella, thus reducing transaction cost and contributing to the scaling up of the CDM” (Hogart, 2012). Programmes of Activities (PoA) can exist for a period of 28 years, whereby specific projects can be added at any point. While the size of each individual project must be below the small-scale threshold, the size of the programme as a whole is unlimited. Furthermore, sampling methodologies are permitted for monitoring and verification.
Calculation of emissions offset by a carbon project rests on the assumption that it is possible to accurately estimate the amount of emissions that would have been produced in the absence of that project. Hogart (2012) shows how that calculation was done in the case of solar lamps in Uganda. Als0 bio-digesters in Nepal have been successfully adopted as an energy source for cooking, benefitting from carbon trading could be a realistic option. Katuwal and Bohara (2009) report that biogas ‘programmes’ of nearly 20 000 biogas plants have been registered under the pCDM, and generate an economic benefit from carbon trading. Selling saved GHG emissions through Voluntary Emission Reduction already generated an earning of over USD 600,000 per year for Nepal (Katuwal & Bohara, 2009). In contrast, Contreras stated that considering registration and transaction costs of each CDM small-scale project, or even many of them bundled into a large one, the CDM scheme does not provide significant incentives in the choice of clean technologies for rural electrification of small villages (Contreras, 2008).
9.6 Concluding remarks
Although all stoves seem to yield a level of firewood savings regardless of stove type or country, the threshold of 40% does not hold in most cases. Lower savings estimates oscillate around 20%, substantially less than the savings measured in a laboratory setting. Although no conclusions can be drawn in terms of whether or not specific stoves are more successful than others, what can be noticed is that simple portable stove designs do not seem perform worse than larger fixed stoves.
Improved stoves and biogas installations do reduce firewood consumption, at least in laboratory settings. Crucial to the savings is the way that households actually behave when it comes to using these appliances. Hence whether or not an improved stove results in reduced firewood consumption – and CO2 emissions – depends on how the stove is being used in practice. The life cycle analysis is a valuable contribution to judge the environmental aspects of energy sources in general and the emission aspects in particular. While during the operational life the emission might be zero, this is not necessarily the case when taking the entire life cycle into consideration.
Renewable Energy: Access and Impact
| 119 |
Table 23 Overview of selected literature on fuel savings and Green House Gas emissions
Authors Year Country Intervention Relevant object of Research
Methodo-logy
Overall Quality Rating*
Hanna, Duflo, & Greenstone
2012 India Improved stoves
Fuel savings RCT before-after with control groups
S
Burwen & Levine
2012 Ghana Improved stoves
Fuel savings RCT before-after with control groups
S
GIZ 2011 Senegal Improved stoves
Fuel savings RCT with-without
S
Ludwinski, et al.
2011 Guatemala Improved stoves
Fuel savings Before-after; with-without
S
Adkins, et al. 2010 Tanzania, Uganda
Improved stoves
Fuel savings With-without A
Barnes, Khandker & Samad
2010 Bangladesh Rural electrifica-tion
Energy efficiency With-without S
Nepal, et al. 2010 Nepal Improved stoves
Fuel savings With-without A
Johnson, et al. 2009 Mexico Improved stoves
GHG emissions With-without S
Katuwal & Bohara
2009 Nepal Bio-diges-ters
Fuel savings and GHG emissions
With-without W
Johnson, et al. 2008 Mexico Improved stoves
GHG emissions With-without A
Smith, et al. 2007 India, Mexico
Improved stoves
Fuel savings Before-after with control groups
A
Note * : S = Strong, A= Average, W = Weak
Carbon trade markets offer an intriguing source of revenue to support renewable energy programmes based on household level appliances in developing countries. Without substantial volume, the transaction costs of the CDM are too taxing, and the monitoring requirements too demanding. Experiences from for example Nepal show that substantial savings can be achieved. One of the key elements is to ensure that accurate measurement substantiates claims. The literature study revealed that many of these measurement systems are at least open to further exploration and development.
10
Sustainability and the private sector
Renewable Energy: Access and Impact
| 121 |
What is known about lasting results in terms of development of the private sector in a) the energy market (suppliers and distributors) over time, and b) the market for (renewable) energy appliances and devices and their maintenance, in particular in rural areas and the urban periphery?
In section 2.2 the concept sustainable energy has been defined as ‘long-term availability of energy services, avoiding negative economic, social and environmental impacts’.39
In this chapter we present findings concerning the sustainability in the use of cleaner energy, followed by the main features of the enabling environment required for sustainable energy services, being the institutional and organisational aspects of the market and delivery systems for renewable energy.
This literature review does not encompass the ‘greening of the grid’ as element of search, hence the switch from fossil fuels to renewable fuels for feeding into the main electricity grid has not been subject to literature search. In consequence, an important component of the international discussion about the role of the private sector in renewable energy generation – being the feed-in tariff – has not been taken into consideration in this review.
The subject dealt with in this chapter is the role and the position of the private sector in the markets of improved stoves, biogas digesters, solar panels and small micro hydro installations. And, on top of that, the market for small domestic electric appliances, such as those for domestic duties, entertainment or communication.
10.1 Energy markets
What factors explain the development of (renewable) energy markets and what are its features?
The selection criteria set in this systematic review (chapter 3) are hardly or not suitable for responding to questions about the market and the role of the private sector. Research about market development at a regional or national level requires different evaluation techniques (for example modelling) that were not automatically admitted within the range of selected articles and reports.
Energy programmes stress the role of the market in the provision of energy (IEG, 2008). In countries where energy supply policies encourage greater access to modern energy services through market mechanisms, these policies have evolved in tandem with broader energy sector reforms opening up to more private sector participation (Kankam & Boon, 2009). For both thermal and lighting energy, there is a substantial difference between urban and rural areas, where rural areas markets are ‘thin’, i.e. they have a relatively small number of players providing services, and most of these players are in a financially precarious situation. The potential for a private enterprise to pull renewable energy services into remote rural areas is limited and if the private actor does so, the financial risks are high. Equally, the chances for
39 International Energy Agency. World Energy Outlook 2011. Energy for all. Financing Access for the poor. OECD/IEA, October 2011
| 122 |
Sustainability and the private sector
new enterprises that have their base in the rural areas are bleak, unless supply-side subsidies are made available to develop markets for improved stove programmes, pre-electrification or network extension (Kankam & Boon, 2009, p. 213).
Improved stove and biogas marketThe two main private sector agents involved in a supply line for improved stoves are the manufacturers (whitesmiths, masons, ceramic producers) and the retailers. For both the manufacturers (the ‘producers’), as well as the retailers (the ‘salesmen’) the ‘business’ should be profitable enough to sustain their activity. Whether the market for improved stoves is sufficiently profitable to both depends on the cost-benefit ratio, in relation to other similar products. Since there is no exact definition of what an improved stove is, there are many ‘improved’ stoves available at the market, at competing costs. The challenge is how to convince potential customers to pay a preferential price for the device that looks the same outside, but has a higher efficiency in the form of less fuel requirements. Evaluations revealed that it is not so much the actual performance that counts to the customer, but the perceived benefit of the stove. In an RCT conducted in rural India, Hanna, Duflo and Greenstone (2012) showed that despite the lack of evidence for the benefits of the stoves (less smoke, less fuel, less cooking time), 89% of the households were happy to recommend them to others, since they thought the stoves had these positive attributes. The price will determine sustainability at the market as well. Some improved stoves are imported from Europe, with a higher price than locally produced stoves, making the latter ones the more attractive option to potential customers (Pennise, et al., 2009).
Positive experiences with private sector involvement in the construction of biodigesters in Asia, in particular Nepal, made it to a model that is being replicated elsewhere. First, the embedding of biodigester construction companies in local communities was an important feature. Where business skills are lacking, ongoing business capacity development is needed to safeguard the supply of digesters. To guarantee quality of these construction companies, some countries issue certification standards (ASTAE, 2010). Second, a strong involvement of the national government is important to promote biogas as a source of energy. In Nepal, the biogas programme was a national programme whereby both subsidy and quality control mechanisms set the conditions to trigger demand and to encourage commercial entrepreneurs to produce high quality digesters. A prerequisite is that the programme is independent from political inference (Amigun & Blottnitz, 2010). Another factor of success in Nepal is the standardization of technology to a single approved design, to facilitate quality control.
Off-grid electrificationComparable to improved stoves, also for purchasing solar home systems, perceived benefits are more decisive than the cost-benefit ratio (Hossain Mondal & Sadrul Islam, 2011, p. 1126).The ‘market’ in rural areas for off-grid electrification is very focused on household level generation, be it small petrol or diesel generators, PV home systems, pico PV appliances or pico hydro equipment. The market for solar lamps is essentially equal to the one for flashlights. Usually the product is not manufactured locally, but imported, and retailing takes place at any market. The market for solar home systems is different. Most systems are
Renewable Energy: Access and Impact
| 123 |
either imported or assembled locally. Specialised retailers sell the devices, but mainly in an urban environment. The high upfront cost of a SHS are an impediment to rural clients, unless the retailers provides a supplier’s credit, or the customer can make use of a subsidy or credit line. Private companies are supposed to be technically equipped to maintain and repair SHSs, and to deliver suitable batteries. While in Kenya, the Philippines and some regions in India, the success of SHSs was based on market mechanisms, in other countries like Zimbabwe, South Africa or Ghana government backed programmes were needed to establish a market (Gustavsson & Ellegård, 2004). In Peru, Bolivia and Colombia SHSs were ‘marketed’ by electricity companies in pre-electrification programmes. The large-scale dissemination of over 200,000 small PV systems in Kenya bought component by component by end-users outside any official scheme is an illustration of the dynamics of marketing (Lemaire, 2011). Recently, Chinese manufactured small solar panels (25 -50 W) with LED appliances have penetrated the local markets, and sold at low prices, are accessible to middle income and poorer segments of the society.
Fee-for-service Both bilateral and multilateral organisations play an important role as financiers of solar PV projects (IEG, 2008). World Bank evaluations in the 1990s showed succesful initial dissemination of SHSs, but poor long-term functioning. It was concluded that solar PV should not be marketed as hardware, but as a service package, where clients essentially buy the services, but not the system itself. The fee-for-services happened to be successful in – amongst others – the Dominican Republic, Sri Lanka and Zambia (Gustavsson & Ellegård, 2004). The concept Energy Service Company (ESCO) emerged. In Zambia, the ESCO is a subsidiary to an existing company with businesses in other fields, such as farm implements. These are private companies licensed to do business and to install solar equipment by the Energy Regulation Board. SHS users are upper middle-class in the rural environment; high income households have generators. Nevertheless, 86% of the ESCO clients would rather own the systems than pay for the service. The main reason (50%) is that customers think they can reduce costs, but 20% also refers to the option to take the SHS to another location if they want to do so (Gustavsson & Ellegård, 2004). In Zambia, the government buys photovoltaic solar systems that are then handed over to the ESCOs, which have up to 20 years to reimburse the loan to government (Lemaire, 2009). In South Africa, ESCOs receive long-term concessions from government and can obtain loans to buy the systems (Lemaire, 2011). An additional advantage of the fee-for-services system is that either centrally, or by inter-panel connections a mini-grid can be established that can be supported by additional electricity generation through diesel generators. These hybrid systems have been successfully installed in South Africa, Namibia, Senegal and Morocco, while a long term experience also exists in Jujuy, Argentina (Lemaire, 2009).
Micro-credit systemA different way of enabling households to pay for the upfront costs of the SHS is by facilitating access to credit. The solar enterprises take care of the maintenance of the systems, but the financial support to the end-user is provided by a separate institution (Lemaire, 2011). However, micro-credit needs to be reimbursed by end-users and as photovoltaic systems do not directly generate extra income, also in this case the SHS market
| 124 |
Sustainability and the private sector
remains limited to the segment of the population who can afford such a micro-credit scheme with up-front public subsidies (Lemaire, 2011). In Bangladesh and India micro-credit schemes supported large-scale dissemination of SHSs. In absence of a well-implemented banking institute in rural areas, the fee-for-services seems more appropriate (e.g. Morocco, Mali and South Africa) (Lemaire, 2011).
Quality and maintenance of the devicesImproved stove programmes often entail extensive training of technicians and whitesmiths to safeguard quality standards. Quality standards can be granted by either regular inspection and monitoring of the stoves and involved technicians or by certification. An example is the improved stove programme in Burkina Faso, implemented through GIZ that works with stickers with the programme logo as a way to show the customer that the stoves adhere to certain quality standards (FAFASO, 2007). Maintenance and after-sales service to improved stoves and bio-digesters have been developed in some development programmes, but full integration in private sector systems remains a challenge. In supported biogas programmes, the biodigesters come with after-sales guarantees, entailing visits to ensure proper use and maintenance of the digesters.
Shop selling improved stoves in Burkina Faso
Renewable Energy: Access and Impact
| 125 |
Quality assurance of solar panels available at the market, requires a national control system. In Zambia, the Energy Regulation Board, in conjunction with the Zambia Bureau of Standards, has developed standards of solar systems since 1999. The Energy Regulation Board conducts quality inspection of the installations (Lemaire, 2009).
Ensuring capacity for the maintenance of solar systems in rural areas remains a challenge (Hogart, 2012). The fee-for-service ensures the systems are maintained and repaired whenever necessary. Since ESCOs have a direct interest in the running of the system (fees are only collected for panels actually working) they are more inclined to monitor the systems closely (Lemaire, 2009).
In South Africa so-called energy stores are central to ensuring maintenance of the systems. People come to the energy stores mainly to charge a token which gives them a credit of electricity. The token data also contains data on the functioning of the system, which can be transferred to a computer. These data can then be manipulated at the store and forwarded to the responsible office and all installations can be traced by their Global Positioning System (GPS) coordinates for maintenance.
10.2 Barriers to private sector development for energy markets
What is known about the barriers to private sector development when it comes to private investment in renewable energy?
The aim of providing subsidies and other public investments in the renewable energy sector is to finally obtain a sustainable market in which renewable sources successfully compete with non-sustainable sources of energy. Probably the most important barrier is that most renewable energy sources fail to be commercially competitive and hence potential customers face a financial hurdle in the market without subvention. This hurdle can either entail the capital cost for the device or the connection, or the operational costs for the service, or the additional costs that are needed to be made to make use of a new source (Grant 2003 in Louw, Conradie, Howells, & Dekenah, 2008).
The single most important actor to either promote or frustrate the market for renewable energy is government. In almost all countries government intervenes in the energy markets, either by regulation and licencing or by taxation and subsidies. Since energy sources are – to a large extent – interchangeable, interventions on one source has inmediate effects on others. For example, when government subsidizes kerosene for domestic use, small solar LED gear for lighting will be less appealing to the rural households. Competing government interventions may imply a disincentive to private actors. For example, in 2008 Indonesia introduced a 5% tax cut over six years for renewable energy producers (geothermal, solar and biofuels) as well as exemptions from value-added tax and import duties on equipment.
| 126 |
Sustainability and the private sector
However these incentives are marginal only as compared to the subsidy on fossil fuels (kerosene, diesel, gasoline and – to a lesser extent – LPG) and electricity prices. Subsidy (even up to 100%, being donation) has been a modality applied for the dissemination of improved stoves and biogas installations in rural areas, justified by high upfront costs that happened to be a barrier to households to acquire these devices, despite a positive cost-benefit ratio over a longer period of time (Malla, Bruce, Bates, & Rehfuess, 2011). Governments (and donors alike) justify subsidies by referring to the negative externalities of current cooking and heating practices. Evaluations about the efficiency of subsidy on dissemination of energy devices point in different directions. In rural Senegal, subsidies helped to achieve an uptake of almost 100% of improved stoves, where 87% of the households actually used the ICS as the main stove in the households (GIZ, 2011). This was not the case in Mexico: in a random allocation of the Patsari stoves on average 30% of the women included in the intervention group reported to use the Patsari stove, while 20% reported a combined use, and 50% reported using mainly an open fire during the follow-up period (Romieu, Riojas-Rodríguez, Marrón-Mares, Schillmann, Perez-Padilla, & Masera, 2009, p. 651). In a randomized control trial implemented in India presented by Hanna, Duflo and Greenstone (2012), in which the improved stoves were provided almost free of costs, only 70% of the treatment group actually installed the stove. Results from other research in India, indicate that 61% of the households that received an improved stove for free actually uses it as their primary device for cooking and heating (Chengappa, Edwards, Bajpai, Naumoff Shields, & Smith, 2007, p. 38).
In the biogas sector the role of subsidies is important as well, since customers of a biodigester face high upfront costs. To open up opportunities for relatively poorer households government may provide subsidies, either directly or in the form of concessional credits. These subsidies may enable the upscaling of the dissemination and precisely upscaling may lead to a reduction in the price of the installation. This was the case in Nepal, where the price dropped by 30% over the past 10 years (Amigun & Blottnitz, 2010). In some cases however, double subsidies were provided to spur uptake of the digesters, but these distorted the market at the same time.
Households in remote areas may realize that they will not be connected to the electricty grid in their lifetime. In the case these households depend on their own initiative within a market framework, the end-user (i) pays the full costs of the system, (ii) has full flexibility of choice (iii) and is fully responsible for maintenance and replacement. But the ‘market’ without distortions hardly exists. So, next to this market frame, there are all kind of stakeholders (electricity companies, governments or donors) that intervene in the market by means of either donations, subsidies or low interest credit mechanisms. In an environment with interventions the end-user (i) usually pays only part of the market costs of the system (ii) has limited choice, and (iii) is not – or only in part – responsible for the organisation, maintenance, replacement, etc. of the equipment, since this may rest with either a utility company or a government entity (van der Vleuten, Stam, & van der Plas, 2007).
A market environment without substantial interventions has been Jordan. Buying a SHS in Jordan is not financially and economically viable for lighting alone. Buying a SHS without
Renewable Energy: Access and Impact
| 127 |
subsidies is not based on positive cost-benefit, but on perceived benefits, such as welfare and modernization (Hossain Mondal & Sadrul Islam, 2011). SHS systems bought under market conditions is restricted to those households that can afford spending on entertainment, while lower income strata cannot (Obeng, Akuffo, Braimah, Evers, & Mensah, 2008, pp. 58-59). Photovoltaic systems are often unaffordable to rural dwellers, although prices are declining rapidly over the last decade. For the poorest strata the fee-for-services system seems more appropriate than ownership of the energy equipment (Laufer & Schäfer, 2011).
The retailer may provide a suppliers credit, usually to be repaid in installments over a period of less than 3 years (Hossain Mondal & Sadrul Islam, 2011). Economies of scale can cut back the costs of SHSs to about half, as shown in Zambia and South Africa. This requires government intervention in either credit lines or subsidy systems. The South African government however, continues to subsidize more the grid extension than the SHS (Lemaire, 2011).
A supply-side bottleneck is the lack of distribution networks in rural areas. One way of promoting solar technology is the grant-per-unit sold. The World Bank has employed this scheme in India, Indonesia, Sri lanka, China and Bangladesh with varying degrees of success (Miller, 2009, p.242). Grants-per-unit-sold channeled to small-scale distribution outlets may be an effective strategy to develop rural market infrastructure for solar lanterns as well. However, given that solar lanterns are competitive, the appropriate instrument to address the low purchasing power of adopters is not price subsidization, but consumer finance (Hogart, 2012).
10.3 Sustainability at household level
Whether a renewable source is continuously used over time at household level depends on an array of variables, like existing alternatives for energy, the service delivery systems, subsidies on fuel, and simply preference. The longitudinal study in five rural villages in South Africa revealed a pattern in which households continued to use different fuels simultaneously. Even 11 years after households got access to electricity, 58% of the households continued using four or more fuels to meet their energy needs (Madubansi & Shackleton, 2006, p. 4089). The relative composition of the sources did change for all, but differently among income brackets. In South Africa, there is a social stigma associated with use of dung, as it is interpreted as a sign of severe poverty, so over time all social strata used less dung as fuel. Households may fear LPG gas, even if it is a clean fuel, as they consider it dangerous. Families also used less dry-cell batteries over time, since these are expensive and have a short life time: in villages with electricity households used 43% less dry-cell batteries than households in villages lacking electricity. Also paraffin, candles, gas and personal generators were less used, while the use of electricity had increased. For thermal energy, fuelwood retained its importance, with or without an improved stove and with or without access to electricity. Only the highest income decile changed to cooking on electricity (Madubansi & Shackleton, 2006).
| 128 |
Sustainability and the private sector
A study in Bangladesh indicated that the sustained use of renewable energy is linked to income. Up to the 7th income decile, the mix of fuels for heating and lighting remained rather stable, which means that the rural households in Bangladesh mostly use traditional technology for cooking and lighting irrespective of income; only for the 30% highest incomes, households opt for modern energy (SHS, gas, grid electricity). Over time electricity (including SHS) got a higher share at the expense of other fuels (Barnes, Khandker, & Samad, 2010, pp. 28,29). A comparable pattern of parallel use of energy was found in Ghana (Kankam & Boon, 2009). New users of SHS are eager to improve their living standards by acquiring electrical appliances and soon the technical capacity becomes too small and overcharging leads to disruption and deterioration. Maintenance and replacement of batteries require organisation which is not always in place (Gustavsson, 2007b). Studies in India reveal that of all newly ‘electrified’ villages, about 10% is ‘de-electrified’ after 7-8 years for various reasons, such as:
• Provision of off-grid renewable energy technology does little to significantly raise income. Adopters can either not sustain the services costs or are unable to finance maintenance (change of battery of SHS, for example);
• In the case of mini-grids: long power cuts, voltage fluctuations coupled with relatively high tariffs result in mistrust and users abandon the service;
• Natural misfortune or even local vandalism that destroys for example small transformer equipment that subsequently is never repaired anymore (Chaury, Ranganathan, & Mohanty, 2004).
10.4 Efficiency of delivery modalities
What is known about the roles and sustained functioning of service providers, public agencies for the provision of renewable energy (generation, distribution)?
In developing countries, energy is usually supplied by state-run power utilities (generation, transmission, distribution) that often operate under rather precarious financial conditions. At the same time, among the government’s policy objectives figure topics like the promotion of fuel efficient and environmentally friendly cooking practices at household level and the extension of the electricity grid in order to provide energy services to the rural population. While subsidies are used to disseminate stoves, kerosene or LPG-gas, privatization and/or public private partnerships should lead to more efficient electricity supply. Since private investors prefer to service high demand and high density areas, the underprivileged sections of the rural society may be excluded from electricity on the one hand, but benefit from subsidized kerosene or LPG on the other hand.
Electricity is increasingly generated by private or semi-public enterprises. The enterprises get paid (‘feed-in tariff’) for certain quantities of electricity delivered to the grid. Usually the transmission and distribution is in public hands, also since one may expect that the delivery costs will increase over time due to the higher costs for reaching the more remote areas (Chaury, Ranganathan, & Mohanty, 2004). The importance and complexity of service providers and their organisations increases with each step on the energy ladder: from individual responsibility through village-level managed generation to a network of decentralized mini-grids or a regional or national electricty company for connection to the main grid (Figure 11).
Renewable Energy: Access and Impact
| 129 |
Figure 11 From small scale renewable energy at household level to the grid
Source: based on Chaury, Ranganathan, & Mohanty, 2004, p. 1704
Table 24 presents five institutional models for delivery of electricity.
Table 24 Five institutional models for electricity delivery
Electricity source Ownership Financing provided by
Subsidy provided by
Responsible for the installation, maintenance, replacement
Direct market against cash sales or suppliers’credit
Batteries, personal generator, SHS, solar lamp
End-user Private sector None End-user
Intervention; donation of equipment
Solar lamps, SHS, pico hydro
End-user Donor Donor End-user
InterventionCredit facility
SHS End-user Donor, financing institution
Donor / government
Various options; e.g. maintenance contract
Fee-for-services,Dealer modelor Concession model
SHS Energy Service Company (ESCO),Third party, dealer
ESCO, with support from third party/ies
Donor ESCO
Services SHS in case of pre-electrification;(mini-) grid, i.e. micro hydro
(local) Energy company
Government, donors, private banks
Various options (on generation, on distribution)
Energy company (outdoor); end-user (indoor)
Source: own elaboration based on van der Vleuten, Stam, & van der Plas, 2007.
• facilitatesminimumelectricityneeds,dispersedproductiveactivities, increased demand for electricity in the region
The efficiency of the distinguished delivery methods is widely discussed in literature, although few authors have conducted comparative studies among the delivery systems. Based on data from 17 African countries Barry, Steyn and Brent (2009) identified the main factors for choosing energy technologies:
• ease of maintenance and support; the security of supply; spares are affordable and can be easily acquired;
• the merits of the technology should be demonstrated through pilots to both decision makers and early adaptors;
• the performing organisation (for example electricity company) should have the capacity and procedures in place to implement the technology successfully;
• the community should be able to pay for services and sustainability.
While the factors mentioned above are of a managerial and organisational nature, Contreras (2008) looked into the economic and financial feasibility. She elaborated a profitability index as main criterion for assessing the choice to providers among four technologies(dieselmini-grids,photovoltaicservices,hybrid[PV-diesel]generatorsandsolar home systems) for electricity supply to rural communities of less than 500 inhabitants in Senegal. PV generation technologies happened to be the least cost solution when the village lies further than 5.4 kilometers from the transmission grid. However, after electrification households acquire electrical appliances between the second and fourth year, which doubles the electric consumption, and SHSs fall short of capacity. She concluded that hybrid mini-grids (fuel + PV) are desirable, but that rural electrification projects are not reasonably profitable without subsidies. While hybrid mini-grids respond better to the energy demand, PV mini-grids and solar home systems offer the technical solutions with the best economic performance for villages with less than 500 inhabitants (Contreras, 2008, p. 136). These findings are in line with the results from a literature review concerning the advantages and disadvantages of household level SHS versus PV decentralized mini-grids. Based on findings in some 15 countries it was found that hybrid supply options (like PV-diesel) are in the long run more cost effective (Chaury & Chandra Kandpal, 2010).
The GIZ project in Senegal argues that SHS is more economical for a small village and also a study for Sri Lanka concluded that to government, the SHS option is more cost-efficient than extension of the grid (Wijayatunga & Attalage, 2005). The cost of the connection of a rural household to the grid was found to be approximately 40% higher (including the costs for additional generation) than a small (24-50 Wp) SHS. While the initial investment in grid connection would take a lifetime to repay, the costs for a SHS are repaid by the household within a five year period.
Since rural electrification is financially hardly attractive to private investors and established electricity companies, rural electrification planning requires special vehicles like the Energy Service Companies (ESCOs) to match the resources with the needs and available technologies. While in Kenya, a substantial success has been reached in the dissemination of PV systems by relying largely on market forces, in Zimbabwe, South Africa and Ghana ambitious programmes were launched with strong government backing. ESCOs deliver PV electricity as a
Renewable Energy: Access and Impact
| 131 |
service package, where clients essentially buy the products (services) of the system: light, maintenance, but not the system itself. ESCOs have been important for the development of fee-for-services delivery models, as well as a variety of implementation models involving local entrepreneurs to develop decentralized electricity markets. ESCOs may make use of various technologies, like micro hydro, solar or hybrid mini-grids (Chaury & Chandra Kandpal, 2010).
A distinction can be made between ‘one hand’ models and ‘two hand’ models. In the ‘one hand model’ the ESCO is responsible for the entire chain from generation (or procurement of equipment) to distribution and client services. This can be the case with a community-based micro hydro grid, or when clients purchase their SHS with a credit provided by the ESCO, where the ESCO is – hence – not the owner of the SHS, but does provide maintenance and replacement against a fee. The ‘two hand model’ differentiates between the financial supplier (the lending authority, the owner of the hardware for generation) and the technical supplier responsible for client services and maintenance (Sri Lanka). In other cases, the end-user does not pay for the initial investment and does not own the equipment, but pays for the energy only (Zambia, South Africa).
In Sri Lanka, where about 13% of the rural population uses solar energy, the private ownership over energy equipment and fee-for-services systems exist alongside each other. Most solar firms are linked to government support programmes and microcredit facilities. While this financial support implied that the price for the equipment could be reduced, this was also at the expense of the quality and hence lifetime of the products, in particular the battery.40 Within the community the parallel ownership structure has led to a differentiation among families: the use of energy technologies or energy-consuming appliances characterizes the status of the family on the energy ladder. Expenditures on energy increase over time (lighting, TV radio, charging of mobile phones) (Laufer & Schäfer, 2011).
The experiences of ESCOs are well analyzed at a general level (Chaury & Chandra Kandpal, 2010) and evaluated for a variety of countries, like Zambia (Gustavsson & Ellegård, 2004; Gustavsson, 2007a; Lemaire, 2009); Fiji (Dornan, 2011); South Africa (Lemaire, 2011); and Kenya (Jacobson, 2007).
Experiences with ESCOs in the South Pacific areas have not been successful. Most of the highly subsidized or free SHS in the Pacific have failed due to inadequate institutional arrangements, that focused strongly on the hardware and paid little attention to the organisational aspects (Dornan, 2011). In Fiji, solar photovoltaic technologies were adversely affected by poor maintenance. Flaws identified in Fiji were incorrect treatment of principal-agent problems, information asymmetries, motivational problems and poor resourcing by government agencies. The core problem however was one of ownership over the continuous functionality of the hardware: was it the government who procured the SHSs, was it ESCO who leasedthepanelsfromgovernment,orwasittheend-user(Dornan,2011)?
40 A deep-cycle or lead acid battery delivers a constant electricity current and can be regularly discharged to most of its capacity. This is needed for the daily use of a SHS. In contrast, starter batteries (as used in cars) deliver high peak current (for starting an engine), but can be discharged at only part of their capacity.
| 132 |
Sustainability and the private sector
10.5 Concluding remarks
The focus of this literature review has been on rural areas in developing countries, where market development in general is hampered by an array of obstacles. This also applies to enterpreneurs in the market for (renewable) energy. A distinction to be made is between producers or manufacturers and retailers. The retailing of relatively low cost equipment, like smaller improved stoves, solar lamps and small solar panels seem to develop without support or subvention in various countries.
The economic viability of production or construction of assets like improved stoves, biogas digesters or solar home systems depends largely on the volume of the demand. And this demand depends on the availability of credit or subsidy facilities, at least in rural areas. Comparably the retailing of more expensive equipment, like solar panels requires credit lines and business support to the retailers.
About institutional and organisational sustainability no generalisations can be made. Concerning solar energy, literature pays a lot of attention to small service companies that deliver solar energy in a fee-for-services system. While this system has been succesful in some countries, it failed in others.
This literature review does not encompass the ‘greening of the grid’, and hence no conclusions are drawn when it comes to feeding in green electricty, generated by micro hydro installations for example into the main grid.
Renewable Energy: Access and Impact
| 133 |
Annexes
Renewable Energy: Access and Impact
| 135 |
Annex 1 About IOBObjectivesThe remit of the Policy and Operations Evaluation Department (IOB) is to increase insight into the implementation and effects of Dutch foreign policy. IOB meets the need for the independent evaluation of policy and operations in all the policy fields of the Homogenous Budget for International Cooperation (HGIS). IOB also advises on the planning and implementation of evaluations that are the responsibility of policy departments of the Ministry of Foreign Affairs and embassies of the Kingdom of the Netherlands.
Its evaluations enable the Minister of Foreign Affairs and the Minister for Development Cooperation to account to parliament for policy and the allocation of resources. In addition, the evaluations aim to derive lessons for the future. To this end, efforts are made to incorporate the findings of evaluations of the Ministry of Foreign Affairs’ policy cycle. Evaluation reports are used to provide targeted feedback, with a view to improving the formulation and implementation of policy. Insight into the outcomes of implemented policies allows policymakers to devise measures that are more effective and focused.
Organisation and quality assuranceIOB has a staff of experienced evaluators and its own budget. When carrying out evaluations it calls on assistance from external experts with specialised knowledge of the topic under investigation. To monitor the quality of its evaluations IOB sets up a reference group for each evaluation, which includes not only external experts but also interested parties from within the ministry and other stakeholders. In addition, an Advisory Panel of four independent experts provides feedback and advice on the usefulness and use made of evaluations. The panel’s reports are made publicly available and also address topics requested by the ministry or selected by the panel.
Programming of evaluationsIOB consults with the policy departments to draw up a ministry-wide evaluation programme. This rolling multi-annual programme is adjusted annually and included in the Explanatory Memorandum to the ministry’s budget. IOB bears final responsibility for the programming of evaluations in development cooperation and advises on the programming of foreign policy evaluations. The themes for evaluation are arrived at in response to requests from parliament and from the ministry, or are selected because they are issues of societal concern. IOB actively coordinates its evaluation programming with that of other donors and development organisations.
Approach and methodologyInitially IOB’s activities took the form of separate project evaluations for the Minister for Development Cooperation. Since 1985, evaluations have become more comprehensive, covering sectors, themes and countries. Moreover, since then, IOB’s reports have been submitted to parliament, thus entering the public domain. The review of foreign policy and a reorganisation of the Ministry of Foreign Affairs in 1996 resulted in IOB’s remit being extended to cover the entire foreign policy of the Dutch government. In recent years it has
| 136 |
Annexes
extended its partnerships with similar departments in other countries, for instance through joint evaluations and evaluative activities undertaken under the auspices of the OECD-DAC Network on Development Evaluation.
IOB has continuously expanded its methodological repertoire. More emphasis is now given to robust impact evaluations implemented through an approach in which both quantitative and qualitative methods are applied. IOB also undertakes policy reviews as a type of evaluation. Finally, it conducts systematic reviews of available evaluative and research material relating to priority policy areas.
Renewable Energy: Access and Impact
| 137 |
Annex 2 ReferencesAbdullah, S., & Wilner Jeanty, P. (2011). Willingness to pay for renewable energy: evidence from a contingent valuation survey in Kenya. Renewable and Sustainable Energy Reviews, 15(6), 2974-2983.
Adkins, E., Tyler, E., Wang, J., Siriri, D., & Modi, V. (2010). Field testing and survey evaluation of household biomass cookstoves in rural sub-Saharan Africa. Energy for Sustainable Development, 14, 172-185.
Alkire, S., & Santos, M. (2010). Acute Multidimensional Poverty: a new Index for Developing Countries. Oxford: Oxford Poverty and Human Development Initiative (OPHI).
Amigun, B., & Blottnitz, H. v. (2010). Capacity-cost and location-cost analyses for biogas plants in Africa. Resources, Conservation and Recycling, 55, 63-73.
Armendariz-Arnez, C., Edwards, R., Johnson, M., Rosas, I., Espinosa, F., & Masera, O. (2010). Indoor particle size distributions in homes with open fires and improved Patsari cookstoves. Atmospheric Environment, 44, 2881-2886.
Arnold, J., Kohlin, G., & Persson, R. (2006). Woodfuels,livelihoods and policy interventions: changing perpectives. World Development, 34(3), 596-611.
Arnold, J., Matto, A., & Narciso, G. (2008). Services inputs and firm productivity in sub-Saharan Africa: evidence from firm-level data. Journal of African Economies, 17(4), 578-599.
ASTAE. (2010). Cambodia: Support Self-Sustaining Commercial markets for Improved Cookstoves and Household Biodigesters. Washington, D.C.: IBRD/The World Bank.
Baris, E., & Ezzati, M. (2007). Household Energy, Indoor Air Pollution and Health: A Multisectoral Intervention Program in Rural China. Washington, D.C.: IBRD/ World Bank.
Barnes, D., Khandker, S., & Samad, H. (2010). Energy Access, Efficiency, and Poverty. How many households are energy poor in Bangladesh? World Bank, Development Research Group. Washington, D.C.: World Bank.
Barry, M.L., Steyn, H., & Brent, A. (2009). Determining the most important factors for sustainable energy technology selection in Africa: application of the Delphi technique. South African Journal of Industrial Engineering, 20, 2579-2589.
Bensch,G.,&Peters,J.(2011).Combatingdeforestation?ImpactsofImprovedStoveDissemination on Charcoal Consumption in Urban Senegal. RUHR Economic Papers, 306.
| 138 |
Annexes
Bensch, G., Kluve, J., & Peters, J. (2011). Impacts of rural electrification in Rwanda. Journal of Development Effectiveness, 3(4), 567-588.
Bensch, G., Peters, J., & Sievert, M. (2012). Fear of the Dark? How Access to electric lighting affects security attitudes and nighttime activities in rural Senegal. RWI. Essen: RWI.
Blackden, C., & Wodon, Q. (2006). Gender, Time Use, and Poverty in Sub-Saharan Africa. Washington, D.C.: IBRD / World Bank.
Brew-Hammond, A. (2010). Energy access in Africa: challenges ahead. Energy Policy, 38, 2291-2301.
Bruce, N., McCracken, J., Albalak, R., Schei, M., Smith, K., Lopez, V., et al. (2004). Impact of Improved stoves, house construction and child location on levels of indoor air pollution in exposure in young Guatemalan children. Journal of Exposure Analysis and Environmental Epidemidology, 14, S26-S33.
Burwen, J., & Levine, D. (2012). A rapid assessment randomized-controlled trial of improved cookstoves in rural Ghana. Energy for Sustainable Development, 16, 328-338.
Chaury, A., & Chandra Kandpal, T. (2010). Assessment and evaluation of PV based decentrali-zed rural electrification: an overview. Renewable and Sustainable Energy Reviews, 14(8), 2266-2278.
Chaury, A., Ranganathan, M., & Mohanty, P. (2004). Electricity access for geographically disadvantaged rural communities – technology and policy insight. Energy Policy, 32, 1693-1705.
Chengappa, C., Edwards, R., Bajpai, R., Naumoff Shields, K., & Smith, K. (2007). Impact of improved cookstoves on indoor air quality in the Bundelkhand region in India. Energy for Sustainable Development, XI(2), 33-44.
Clark, C., Peel, J., Burch, J., Nelson, T., Robinson, M., Conway, S., et al. (2009). Impact of improved cookstoves on indoor air pollution and adverse health effects among Honduran women. International Journal of Environmental Health Research, 19(5), 357-368.
Contreras, Z. (2008). Planning paths for the electrification of small villages using decentra-lised generation: experience from Senegal. International Journal of Energy Sector Management, 2(1), 118-138.
Dherani, M., Pope, D., Mascarenhas, M., Smith, K.R., & Weber, M. &. (2008). Indoor air pollution from unprocessed solid fuel use and pneumonia risk in children aged under 5 years: a systematic review and meta-analysis. Bulletin of the World Health Organization, 86(5), 390-398.
Renewable Energy: Access and Impact
| 139 |
Diaz, E., Smith Sivertsen, T., Pope, D., Lie, R., Diaz, A., McCracken, J., et al. (2007). Eye discomfort, headache and back pain among Mayan Guatemalan women taking part in a randomised stove intervention trial. Journal of Epidemiology and Community Health, 61, 74-79.
Dornan, M. (2011). Solar based rural electrification policy design: the renewable energy service company (RESCO) model in Fiji. Renewable Energy, 36(2), 797-803.
Duflo, E., Greenstone, M., & Hanna, R. (2008). Indoor air pollution, health and economic well-being. S.A.P.I.E.N.S., 1(1).
Dutta, K., Shields, K., Edwards, R., & Smith, K. (2007). Impact of improved biomass cookstoves on indoor air quality near Pune, India. Energy for Sustainable Development, XI(2), 19-32.
FAFASO. (2007). Final Technical report.
Fall, A., Sarr, S., Dafrallah, T., & Ndour, A. (2008). Modern energy access in peri-urban areas of West Africa: the case of Dakar, Senegal. Energy for Sustainable Development, 12(4), 22-37.
Frankfurt School; UNEP Collaborating Centre for Climate and Sustainable Energy. (2012). Global Trends in Renewable Energy Investment. Frankfurt: Frankfurt School of Finance and Management gGmbH.
GIZ. (2011). Interim Evaluation 2011: Impacts of the Usage of Improved Cooking Stoves in Rural Senegal. Evidence from a Rondomized Controlled Trial. Eschborn: GIZ.
Global Burden of Disease Study. (2010). A comparative risk assessment of burden of disease and injury attribuable to 67 risk factors and risk factor clusters in 21 regions, 1990–2010: a systematic analysis. Lancet, 380, 2224-2260.
Gustavsson, M. (2007a). Educational benefits from solar technology – Access to solar electric services and changes in children’s study routines, experiences from eastern province Zambia. Energy Policy, 35, 1292-1299.
Gustavsson, M. (2007b). With time comes increased loads; an analysis of solar home systems use in Lundazi, Zambia. Renewable Energy, 32(5), 796-813.
Gustavsson, M., & Ellegård, A. (2004). The impact of solar home systems on rural liveli-hoods. Experiences from the Nyimba Energy Service Company in Zambia. Renewable Energy, 29, 1059-1072.
Hanna, R., Duflo, E., & Greenstone, M. (2012). Up in Smoke: The Influence of Household Behavior on the Long-Run impact of Improved Cooking Stoves. HKS Faculty Research Working Paper Series, RWP12-015.
| 140 |
Annexes
Hogart, J. (2012). Promoting diffusion of solar lanterns through microfinance and carbon finance: a case study of FINCA-Uganda’s solar loan programme. Energy for Sustainable Development, in press.
Hossain Mondal, M. A. (2010). Economic viability of solar home systems: case study of Bangladesh. Renewable Energy, 35, 1125-1129.
Hossain Mondal, M. A., & Sadrul Islam, A. (2011). Potential and viability of grid-connected solar PV systems in Bangladesh. Renewable Energy, 36(6), 1869-1874.
IEG. (2008). The welfare impact of rural electrification: a reassessments of the costs and benefits. World Bank Independent Evaluation Group. Washington, D.C.: World Bank.
International Energy Agency. (2011). World Energy Outlook 2011. Energy for all, Financing Access for the poor. OECD/IEA.
Jacobson, A. (2007). Connective Power: solar electrification and social change in Kenya. World Development, 35(1), 144-162.
Jensen, R., & Oster, E. (2009). The power of TV: Cable Television and Women’s status in India. The Quarterly Journal of Economics, 124(3), 1057-1094.
Johnson, M., Edwards, R., Frenk, C., & Masera, O. (2008). In-field greenhouse gas emissions from cookstoves in rural Mexican households. Atmospheric Environment, 42, 1206-1222.
Johnson, M., Edwards, R., Ghilardi, A., Berrueta, V., Gillen, D., Frenk, C., et al. (2009). Quantification of Carbon Savings from Improved Biomass Cookstove Projects. Environmental Science and Technology, 43(7), 2456-2462.
Kan, X., Chiang, C.Y., Enarson, D., Chen, W., et al. (2011). Indoor solid fuel use and tubercu-losis in China: a matched case-control study. BMC Public Health, 11(1), 1-7.
Kankam, S., & Boon, E. (2009). Energy delivery and utilization for rural development: lessons from Northern Ghana. Energy for Sustainable Development, 13(3), 212-218.
Karanfil, F. (2009). How many times again will we examine the energy-income nexus using a limitedrangeoftraditionaleconometrictools?Energy Policy, 37, 1191-1194.
Katuwal, H., & Bohara, A. (2009). Biogas: A promising renewable technology and its impact on rural housholds in Nepal. Renewable and Sustainable Energy Reviews, 13, 2668-2674.
Kemmler, A. (2007). Factors influencing household access to electricity in India. Energy for Sustainable Development , 11(4), 13-20.
Renewable Energy: Access and Impact
| 141 |
Khandker, S., Barnes, D., & Samad, H. (2009). Welfare Impacts of Rural Electrification. A case study from Bangladesh. World Bank, Development Research Group. Washington, D.C.: World Bank.
Khandker, S., Barnes, D., Samad, H., & Minh, N. (2009). Welfare Impacts of Rural Electrification. Evidence from Vietnam. World Bank, Development Research Group. Washington, D.C.: World Bank.
Knaap, L. V., Leeuw, F., Bogaerts, S., & Nijssen, L. (2008). Combining Campbell Standards and the Realist Evaluation Approach: the best of Two Worlds. American Journal of Evaluation.
Köhlin, G., Sills, E., Pattanayak, S., & Wiflong, C. (2011). Energy, Gender and Development. What are the Linkages? Where is the Evidence? The World Bank.
Komatsu, S., Kaneko, S., Shrestha, R., & Ghosh, P. (2011). Nonincome factors behind the purchase decisions of solar home systems in rural Bangladesh. Energy for Sustainable Development, 15, 284-292.
Kooijman-van Dijk, A. (2012). The role of energy in creating opportunities for income generation in the Indian Himalayas. Energy Policy, 41, 529-536.
La Ferrara, E., Chong, A., & Duryea, S. (2008). Soap operas and fertility: evidence from Brazil. Washington, D.C.: Inter-American Development Bank.
Laufer, D., & Schäfer, M. (2011). The implementation of Solar Home Systems as a poverty reduction strategy - a case study in Sri Lanka. Energy for Sustainable Development, 15, 330-336.
Lemaire, X. (2009). Fee-for-services companies for rural electrification with photovoltaic systems: The case of Zambia. Energy for Sustainable Development, 13, 18-23.
Lemaire, X. (2011). Off-grid electrification with solar home systems: the experience of a fee-for-service concession in South Africa. Energy for Sustainable Development, 15, 277-283.
Louw, K., Conradie, B., Howells, M., & Dekenah, M. (2008). Determinants of electricity demand for newly electrified low-income African households. Energy Policy, 36, 2812-2818.
Ludwinski, D., Moriarty, K., & Wydick, B. (2011). Environmental and health impacts from the introduction of improved wood stoves: evidence from a field experiment in Guatemala. Environment, Development and Sustainability, 13, 657-676.
Madubansi, M., & Shackleton, C. (2006). Changing energy profiles and consumption patterns following electrification in five rural villages, South Africa. Energy Policy, 34, 4081-4092.
| 142 |
Annexes
Malla, M. B., Bruce, N., Bates, E., & Rehfuess, E. (2011). Applying global cost-benefit analysis methods to indoor air pollution mitigation interventions in Nepal, Kenya and Sudan; Insights and challenges. Energy Policy, 39, 7518-7529.
Masera, O., Edwards, R. A., Berrueta, V., Johnson, M., Rojas Bracho, L., Riojas-Rodriquez, H., et al. (2007). Impact of Patsari improved cookstoves on indoor air quality in Michoacan, Mexico. Energy for Sustainable Development, XI(2), 45-56.
McCracken, J., Smith, K., Stone, P., Díaz, A., Arana, B., & Schwartz, J. (2011). Intervention to Lower Household Wood Smoke Exposure in Guatemala Reduces ST-Segment Depression on Electrocardiograms. Envrionmental Health Perspectives, 119(11), 1562-1568.
Modi, V., McDade, S., Lallement, D., & Saghir, J. (2005). Energy services for the millenium development goals. Energy Sector Management Assistance Programme, United Nations Development Programme, UN Millennium Project. New York: World Bank.
Murphy, J. (2001). Making the energy transition in rural East Africa: is leapfrogging an alternative?Technological Forecasting and Social Change, 68, 173-193.
Mwirigi, J., Makenzi, P., & Ochola, W. (2009). Socio-economic constraints to adoption and sustainability of biogas technology by farmers in Nakuru Districts, Kenya. Energy for Sustainable Development, 106-115.
Neelsen, S., & Peters, J. (2011). Electricity usage in micro-enterprises - evidence from Lake Victoria, Uganda. Energy for Sustainable Development, 15(1), 21-31.
Nepal, M., Nepal, A., & Grimsrud, K. (2010). Unbelievable but improved cookstoves are not helpful in reducing firewood demand in Nepal. Environmental and Development Economics, 16, 1-23.
Obeng, G., & Evers, H.D. (2010). Impacts of public solar PV electrification on rural micro-enterprises: the case of Ghana. Energy for Sustainable Development, 14(3), 223-231.
Obeng, G., Akuffo, F., Braimah, I., Evers, H.D., & Mensah, E. (2008). Impact of solar photovoltaic lighting on indoor air smoke in off-grid rural Ghana. Energy for Sustainable Development, 12(1), 55-61.
Obeng, G., Evers, H.D., Akuffo, H., Braimah, I., & Brew-Hammond, A. (2008). Solar photovoltaic electrification and rural energy-poverty in Ghana. Energy for Sustainable Development, 12(1), 43-54.
Olken,B.(2009).DoTelevisionandRadiodestroysocialcapital?EvidencefromIndonesianvillages. American Economic Journal: Applied Economics, 1(4), 1-33.
Renewable Energy: Access and Impact
| 143 |
Ouedraogo, B. (2006). Household energy preferences for cooking in urban Ouagadougou, Burkina Faso. Energy Policy, 34, 3787-3795.
Owsianowski, J., & Barry, P. (2008). Improved cooking stoves for developing countries, unpublished paper.
Pachauri, S., & Speng, D. (2011). Measuring and monitoring energy poverty. Energy Policy, 39, 7497-7504.
Pachauri, S., Mueller, A., Kemmler, A., & Spreng, D. (2004). On Measuring Energy Poverty in Indian Households. World Development, 32(12), 2083-2104.
Parikh, J. (2011). Hardship and health impacts on women due to traditional cooking fuels: a case study of Himachal Pradesh. Energy Policy, 39(12), 7587-7594.
Pennise, D., Brant, S., Mahu Agbeve, S., Quaye, W., Mengesha, F., Tadele, W., et al. (2009). Indoor air quality impacts of an improved wood stove in Ghana and an ethanol stove in Ethiopia. Energy for Sustainable Development, 13, 71-76.
Peters, J., & Vance, C. (2011). Rural Electrification and Fertility; Evidence from Cote d’Ivoire. Journal of Development Studies, 47(5), 753-766.
Peters, J., Vance, C., & Harsdorff, M. (2011). Grid Extension in Rural Benin: micro-manufac-turers and the Electrification Trap. World Development, 39(5), 773-783.
Pine, K., Edwards, R., Masera, O., Schilmann, A., Marrón-Mares, A., & Riojas-Rodríguez, H. (2011). Adoption and use of improved biomass stoves in Rural Mexico. Energy for Sustainable Development, 15, 176-183.
Practical Action. (2011). Ethanol as a Household Fuel in Madagascar: Health Benefits, Economic Assessment and Review of African Lessons for Scaling up. Component A Final Report. Analysis of Household Air Pollution Interventions in Madagascar.
Romieu, I., Riojas-Rodríguez, H., Marrón-Mares, A. T., Schillmann, A., Perez-Padilla, R., & Masera, O. (2009). Improved Biomass Stove Intervention in Rural Mexico; Impact on the Respiratory Health of Women. American Journal of Respiratory and Critical Care Medicine, 180, 649-656.
Serpa, P., & Zilles, R. (2007). The diffusion of photovoltaic technology in traditional communities: the contribution of applied anthropology. Energy for Sustainable Development, XI no.1 , 78-87.
| 144 |
Annexes
Smith, K., Dutta, K., Chengappa, C., Gusain, P., Masera, O., Berrueta, V., et al. (2007). Monitoring and evaluation of improved biomass cookstove programs for indoor air quality and stove performance; conclusions from the Household Energy and Health Project. Energy for Sustainable Development, XI(2), 5-18.
Smith, K., McCracken, J., Weber, M., Hubbard, A., Jenny, A., Thompson, L., et al. (2011). Effect of reduction in household air pollution on childhood pneumonia in Guatemala (RESPIRE): a randomised controlled trial. Lancet, 378, 1717-26.
Smith-Sivertsen, T., Diaz, E., Pope, D., Lie, R., Diaz, A., McCracken, J., et al. (2009). Effect of Reducing Indoor Air Pollution on Women’s Respiratory Symptoms and Lung Function: The RESPIRE Randomized Trial, Guatemala. American Journal of Epidemiology, 170(2), 211-220.
Takama, T., Lambe, F., Johnson, F. X., Avidson, A., Atanassov, B., Debebe, M., et al. (2011). Will African Consumers Buy Cleaner Fuels and Stoves? A household Energy Economic Analysis Model for the Market Introduction of Bio-Ethanol Cooking Stoves in Ethiopia, Tanzania, and Mozambique. Stockhom: Stockholm Environment Institute.
Taylor, M., Moran-Taylor, M., Castellanos, E., & Elías, S. (2011). Burning for Sustainability: Biomass Energy, International Migration and the Move to Cleaner Fuels and cookstoves in Guatemala. Annals of the Association of American Geographers, 101(4), 918-928.
Tsoutsos, T., Frantzeskaki, N., & Gekas, V. (2005). Environmental impacts from the solar energy technologies. Energy Policy, 33, 289-296.
UNDP. (2012). Integrating Energy Access and employment creation to accelerate progress on the MDGs in Sub-Saharan Africa. New York: United Nations Development Programme.
van der Vleuten, F., Stam, N., & van der Plas, R. (2007). Putting solar home system program-mesintoperpective:Whatlessonsarerelevant?Energy Policy, 35, 1439-1451.
van Kempen, L., Muradian, R., Sandóval, C., & Castaneda, J.P. (2009). Too poor to be green consumers?AfieldexperimentonrevealedpreferencesforfirewoodinruralGuatemala.Ecological Economics, 68(7), 2160-2167.
van Ruijven, B., Urba, F., Benders, R., Moll, H., van der Sluijs, J., de Vries, B., et al. (2008). Modeling Energy and Development: an Evaluation of Models and Concepts. World Development, 36(12), 2801-2821.
Walekhwa, P., Mugisha, J., & Drake, L. (2009). Biogas energy from family-sized digesters in Uganda: Critical factors and polilcy implications. Energy Policy, 37, 2754-2762.
WHO. (2006). WHO Air Quality Guidelines for particulate matter, ozone, nitrogen dioxide and sulfur dioxide. Global update 2005. Summary of risk assessment. Geneva: World Health Organization.
Renewable Energy: Access and Impact
| 145 |
WHO. (2010). WHO Guidelines for Indoor Air Quality: Selected Polutants. Copenhagen: World Health Organization.
WHO and UNDP. (2009). The Energy Access Situtation in Developing Countries. New York: United Nations Development Programme.
Wijayatunga, P., & Attalage, R. (2005). Socio-economic impact of solar home systems in rural Sri Lanka: a case study. Energy for Sustainable Development, IX(2), 5-9.
Wodon,Q.,&Beegle,K.(2006).LaborShortagesDespiteUnderemployment?SeasonalityinTime Use in Malawi. In M. Blackden, & Q. Wodon, Gender, Time Use, and Poverty in Sub-Saharan Africa (Vol. 73, pp. 97-116). World Bank Working Paper.
Yadoo, A., & Cruickshank, H. (2012). The role for low carbon electrification technologies in poverty reduction and climate change strategies: A focus on renewable energy mini-grids with case studies in Nepal, Peru and Kenya. Energy Policy, 42, 591-602.
Yu, F. (2011). Indoor Air Pollution and Children’s Health: Net Benefits from Stove and Behavioral Interventions in Rural China. Environmental Resource Economics, 50, 495-514.
| 146 |
Annexes
Annex 3 Abbreviated Terms of Reference Systematic Literature Review
Terms of ReferenceLiterature review of impact evaluationsin the area of renewable energy in developing countries
1. Background of the reviewSince the early 1990s, access of the poor to energy has been part of the development cooperation by the Netherlands. The Ministry of Foreign Affairs’ standing policy on environment and renewable energy dates July 2008, but is currently (2012) subject to modification. According to the 2008 policy, it is the ministry’s goal that investments in (renewable) energy contribute to poverty reduction41 and to mitigate the negative effects of energy use on the climate.42 The access to energy can be seen as an indispensable precondition for the attainment of practically all Millennium Development Goals. The goal mentioned is to be achieved by supporting governments in developing countries to develop and implement – in cooperation with private and public organisations - ‘good and coherent’ policies with regards to renewable energy. The Dutch approach is to build on to active channels of implementation (i.e. World Bank, GIZ), using existing capacity and knowledge, while enabling development countries’ governments to strengthen its own capacities. The specific support is offered to four interlinked activities:1. Direct investments in the production of, and access to, renewable energy in priority
countries and regions;2. Improvement of the sustainability of production of biomass for energy purposes;3. Influencing policy of partners responsible for investment in renewable energy;4. Development of capacity and knowledge in developing countries with regards to
renewable energy.
Implementation of this policy is enabled by a budget input of EUR 500 million for renewable energy in developing countries through the “Promoting Renewable Energy Programme” (PREP, 2008). The geographical focus of the PREP programme is on Sub-Sahara Africa and in particular on the post-conflict region around the Great Lakes, and on Indonesia. However, the various sub-programmes (for example by the international financing organisations) are not restricted to these geographical areas.
The Policy and Operations Evaluation Department (IOB) of the Ministry of Foreign Affairs has scheduled an evaluation of this policy by 2014. The evaluation will encompass, next to a review of the policy itself, series of quantitative impact studies in Rwanda and Indonesia
41 The access to energy is frequently seen as precondition to the attainment of most Millennium Development Goals, while the access to energy alone does not lead automatically to such development.
42 Ministry of Foreign Affairs, DMW, 2008, Beleidsnotitie milieu en hernieuwbare energie in ontwikke-lingssamenwerking, juli 2008.
Renewable Energy: Access and Impact
| 147 |
(and a single study in Burkina Faso). The central research question of the of impact studies is “what have been the effects on living conditions of target groups – positive or negative, intended or not – of the energy and development cooperation programmes and projects supported by the Netherlands and how sustainable are the achieved results”. The Terms of Reference (ToR) for these studies were defined in September 2009.
The policy evaluation will be underpinned by a literature review of existing quantitative and qualitative effect studies, and thematic evaluations in the area of renewable energy in developing countries. The present document elaborates the envisaged methodology of the literature review.
2. Objective of the literature review and definitionsThe literature review will be a systematic overview that aims at providing policy makers and practitioners a comprehensive information source on literature regarding the effects and impact of renewable energy interventions at the level of end-users and local markets in developing (and middle income) countries.
The review of literature and reports on (renewable) energy will encompass an assessment of the evidence underlying the main objectives of the Dutch policy on energy. The focus will be on the link between investments in renewable energy and poverty reduction at the household and community level. As far as possible this also refers to inter-, and intra-household effects (age groups, gender) and opportunities for disadvantaged groups. Furthermore, the review and synthesis of the literature will provide insight on ‘what works where and why’. After access has become a reality, end-users discover opportunities to improve their livelihoods and a demand for permanent (or more powerful) modern energy emerges and hence modern energy markets mature.
The literature review is conducted in function of the IOB policy review on renewable energy and hence two basic contributions are to be expected:1 Validation. Evidence from literature assessing the validity of findings that emerge from
IOB primary research (rigorous impact analysis) in Rwanda, Indonesia and Burkina Faso.
2 Complementary evaluative material. To complement IOBs primary research with indications from literature, including on those topics not directly covered by IOB’s research, such as the relation between small renewable energy devices and health (respiratory diseases) and the relation between small energy devices and CO2 emission.
The objective of this review is to obtain an overview of existing effect studies and thematic evaluations in the area of renewable energy use at individual, household, community and/or District level in developing and middle-come countries.
3. Research questionsThe unit of analysis includes affected individuals (m/f ), households, public facilities and small enterprises. The impact on macro variables, such as climate change or deforestation at national or international level, is not subject to explicit search.
| 148 |
Annexes
The following six types of interventions will be dealt with: biogas digesters; improved stoves; solar energy (solar home systems, solar heaters, solar lamps); grid distributed energy supply generated by renewable resources in rural areas and the urban periphery; hydro-power energy (mini and pico hydro power installations) for individual use or off-grid application; and locally produced biofuels used at household or community level. 43
The research questions are:
1. What is known (and not) about the direct and indirect links between access to (renewable) energy, use of renewable energy, income and expenditure and poverty reduction, focusing on:
• theadoptionrate(numberofindividuals[m/f ],households,communities)ofrenewable energy technology and energy-related products and/or services as compared to non-renewable sources;
• whatvariables(social,economic,others)playaroleintheadoption?• changes in household expenditures for lighting (solar home systems, solar lamps, new
connection to electricity) and cooking energy (biogas, biofuels, improved cooking stoves);
2. Whatisknownabouttheeffectsonhealth?• what are the effects on health indicators, such as respiratory disease symptoms, eye
infections, stunted growth of children; • how much reduces the indoor air pollution per source of renewable energy versus the
traditionalones?
3. What is known about productive use of energy, and the socio-economic status of the variousenergysources?
• what factors determine the productive use of electricity /biogas / other renewable sourcesbyhouseholdsorsmallenterprises?
• is comfort/convenience a reason for change and / or a reason for demand for modern energysupply?
• what is known about the so-called “energy-losers” or those who ‘step downwards on theenergyladder’?
• what is known about productive use of energy by gender and gender disaggregated distributionofbenefits?
• What is known about changing patterns of investment by end-users (to adopt for renewable energy for their development)
43 Other sources of modern energy, like LPG for cooking or diesel fuelled mini-grids for electrification are not excluded, but no subject of search.
Renewable Energy: Access and Impact
| 149 |
4. What is known about the impact of energy use on social variables (like safety, study performance of children and adults, equal opportunities for disadvantages groups, gender,socialstructureswithinthehousehold)?
• towhatextenthassafety/protectionchanged?• howarebenefitsdistributedamonghouseholdsindifferentincomegroups?• how are benefits distributed within households (women vs. men, children vs. adults)
6. What is known about the effect on the reduction of CO2 emissions?• what is known about the CO2
emission measurement of small devices (cooking stoves, biogas,andsolarhomesystems)?
• how much fuelwood is effectively saved per meal per household (taking into account cookingbehaviour)ascomparedtonon-renewablesources?
• to what extent do small renewable energy devices generate carbon credits of which the proceedsareactivelybeenused?
7. What is known about lasting results in terms of development of the private sector in a) the energy market (suppliers and distributors) over time, and b) the market for (renewable) energy appliances and devices and their maintenance, in particular in rural areasandtheurbanperiphery?
• Whatfactorsexplainthedevelopmentofmodernenergymarkets?• What are the features of existing markets mechanisms when it comes to provision of
energydevicestohouseholds(stoves,biogasinstallations,electronicgear)?• What is known about the barriers to private sector development when it comes to
privateinvestmentinrenewableenergy(supply,distribution,appliances,retail)?• What is known about the roles and sustained functioning of service providers, public
agencies for the provision of renewable energy (generation, distribution).
4. Methods of the reviewThe review will adhere to most (but not all) basic principles of a systematic review. A systematic review uses transparent procedures (determined in advance) to find, evaluate and synthesize the results of relevant research. Systematic reviews help to package evidence in an accessible way. Systematic reviews focus on the quality of literature, they separate the
| 150 |
Annexes
‘evidence’ from the ‘interesting cases’, while by presenting a consistent set of conclusions they are accessible and easily understandable to non-experts.
A systematic review is characterized by: • criteria for inclusion/ exclusion have been established in advance; • an explicit search strategy;• systematic coding and analysis of included studies; • meta-analysis of the findings.
Systematic reviews help to:• identify gaps in the knowledge;• are helpful in setting the (future) evaluation agenda;• help to reduce duplication of research.
Since the source consist of published and accessible material, the review is ‘a body of evidence’, reducing the need for narrative piecemeal reviews.
For the review of effect measurement and thematic evaluations in the area of renewable energy, the envisaged method is the ‘realist evaluation approach’.44 The realist evaluation approach is a pragmatic variant of the systematic review as defined by the Campbell Collaboration protocol (C2 protocol).45 The realist evaluation approach is better equipped to take context factors into consideration, and hence to address “how, where and why” questions.
Pragmatic approachThe approach is as follows:• Search inventory and quick scan of relevant evaluation documents about renewable
energy in general and for each of the six subject matters in particular. There will be two separate ‘flows’: one comprising scientific articles and one encompassing evaluation reports by development agencies and international financing institutions (see section 6).
• A selection process (after a screening, a first selection on subject and methods applied, and second selection on contents and usefulness for the review) of studies / articles according to a format (encompassing the description of the contents, the quality of the methodology applied and the main conclusions of the research or evaluation).
• Elaboration of conclusions (derived from the selected articles) in function of the main research questions (section 3).
44 Van der Knaap, Leontien M., Frans L. Leeuw, Stefan Bogaerts and Laura T.J.Nijssen (2008). Combining Campbell Standards and the Realist Evaluation Approach: the best of Two Worlds. In: American Journal of Evaluation.
45 Guiding Principles for The Methods Groups of The Campbell Collaboration (2002). www.campbellcollaboration.org. The C2 protocol is less ‘strict and rigorous’ than the Cochrane Collaboration approach.
Renewable Energy: Access and Impact
| 151 |
Considering limitations in time and budget, pragmatic simplification is applied as compared to the procedure prescribed by the Campbell Collaboration approach. The simplifications are:
• a single responsible for classification of literature.46 In this review each article or report is being scored by one single researcher. In the second classification (see section 6 ‘search strategy’) an a-select sample of 25% of the articles and reports will be coded by a second researcher. In the case substantial differences were found in the scoring results of both reviewers, the percentage of articles with double review will be increased to 50%.
• a simplified registration system of literature up to the first selection.
5. Inclusion and exclusion criteriaThe inclusion and exclusion criteria are based on i) the evaluation subject and ii) the evaluation quality.
i) Criteria related to the evaluation subjectThe unit of analysis encompasses affected individuals (m/f ), households, public facilities and small enterprises in communities in developing and middle income countries. The impact on macro variables, such as the climate, is not subject to search, but will be taken into consideration and described, if and when possible.
The evaluation subject implies a geographic restriction: only research carried out at either world-wide level and/or concerning developing (GNI/pcpa below USD 1006) and middle-income (GNI/pcpa between USD 1006 and 3975) countries in Africa, Latin America and Asia will be included. Studies that refer explicitly to higher income countries such as European countries, North America or Oceania will be excluded.
The review includes studies that have been published since the start of the Dutch policy on renewable energy. Hence a publication date restriction is applied (2004-2012) and excludes studies based on data that dates back to years prior to 2000 only.47 The criteria related to the evaluation subject are derived from intervention logics for different sources of renewable energy.
These logics require that a distinction is made between (a) forms of energy that finally implies electricity to the household or to the local community, and (b) forms of energy that finally is used for cooking, combustion and heating.a) Forms of renewable energy that finally lead to electricity at household or community
level are solar energy (solar home systems and solar lamps); geothermal energy and hydro-energy (micro and pico-energy);
46 The C2 approach prescribes that scoring of literature and reports should be carried out by two researchers, who work independently from each other. Each article, reports is scored by both researchers.
47 The publication date [> 2004] is the main criterion. Studies that make use of historical data for longitudinal research (hence not only historical data) will be included.
| 152 |
Annexes
b) Forms of renewable energy that is (mainly) used for cooking, combustion and heating (fuel-efficient cooking stoves, biogas, and locally produced and used biofuels48).
The intervention logics for the two ‘pathways’ from intervention to effects and impact have been derived from the results chains elaborated for rigorous impact analysis of PREP funded activities.
Note that the supply of electricity does not necessarily guarantee access to electricity. Supply of electricity should be accompanied by transmission and distribution (in the case of a grid) and/or by a market where electrical equipment is being sold. In the case of improved cooking stoves and biogas an important feature is the skills training of masons or whitesmiths (in the case of local markets) or the establishment of a retail market (in case of imported equipment) to provide access to the population (rural and those living in the urban periphery).
The impact is not determined by having electricity or improved cooking facilities, but by usage. Since electricity enables the use of communication media, the impact on attitudes requires special attention.
In the case of improved cooking stoves, the health impacts merits special attention.Little productive use can be expected from fuel efficient cooking stoves (except bakeries, breweries, blacksmiths and restaurants). The productive use of biogas is limited as well.
The productive use of electricity depends on the power, the voltage that can be supplied.
Attention will be given to three transversal topics:
• Market development (a) energy supply; in particular the demand for modern energy and (b) sales of devices required for the use of renewable energy;
• The distribution of effects among households / enterprises according to socio-economic characteristics;
• The distribution of effects within households according to gender and age.
See the following graphs:
48 The impact of biofuels to generate electricity is considered under a) as electricity supply at household level.
Renewable Energy: Access and Impact
| 153 |
Intr
a-ho
useh
old
dist
ribut
ion
(incl
. gen
der e
quity
)
individual intervention interventionhousehold
Chan
ge in
inco
me
and
expe
nditu
re a
t Hou
seho
ld le
vel /
ente
rpris
e
local / regional market for efficient cooking stoves and/or biogas
Reduction of CO2 emission
Impr
oved
he
alth
thro
ugh
redu
ced
indo
or p
ollu
tion
Less
def
ores
tatio
n
Redu
ced
use
of fu
el w
ood
Re
gula
tion,
inst
itutio
nal
capa
city
Care
for t
he n
atur
al e
nviro
nmen
tal
Biog
as sl
urry
for
agric
ultu
re
Dev
elop
mar
kets
for
cook
ing
oven
s and
bio
gas
Soci
o-ec
onom
ic d
istr
ibut
ion
of o
vens
and
bi
ogas
ove
r com
mer
cial
act
iviti
esSo
cio-
econ
omic
dis
trib
utio
n of
cook
ing
st
oves
/ bi
ogas
ove
r hou
seho
lds
Incr
ease
d in
com
e
(bio
gas
only
) lig
htCo
okin
g
Less
wor
kloa
dTi
me
savi
ngs
woo
d co
llect
ion
Ove
ns a
nd
inst
alla
tions
to H
Hs
Dis
trib
ute
inst
alla
tions
to H
Hs
and
soci
al in
stitu
tions
Awar
enes
s ca
mpa
igns
Ove
ns a
nd
inst
all.t
o en
terp
rises
Impr
ove
fin
anci
ng fa
cilit
ies
Less
ope
n fir
e ac
cide
nts
Incr
ease
d co
mfo
rt
Price for energy, investment in devices
community
Use
of i
nsta
llatio
ns
Trai
n m
ason
s,
whi
tesm
iths
Inve
stm
ent i
n pr
ovid
ers
Enha
nce
safe
co
okin
g en
ergy
Impact pathways for improved cooking devices
| 154 |
Annexes
Intr
a-ho
useh
old
dist
ribut
ion
(incl
. gen
der e
quity
)
individual intervention Policy/strategyhousehold
Chan
ge in
inco
me
and
expe
nditu
re a
t Hou
seho
ld le
vel
Loca
l / re
gion
al
Mar
ket f
or e
lect
ricity
loca
l / re
gion
al m
arke
t for
dev
ices
Reduction of CO2 emission
Impr
oved
he
alth
thro
ugh
redu
ced
indo
or p
ollu
tion
Redu
ced
use
of fu
el w
ood
an
d ot
her n
on-r
enew
able
so
urce
s of
ene
rgy
Re
gula
tion,
inst
itutio
nal
capa
city
Oth
er
appl
ianc
es, i
nclu
ding
pro
duct
ive
use
Conn
ecte
d H
ouse
hold
s,So
cio-
econ
omic
dis
trib
utio
n of
hou
seho
lds
Incr
ease
d in
com
e
light
Ente
rtai
nmen
t (tv
, rad
io),
com
mun
icat
ion
Sale
s of
de
vice
s to
hou
seho
lds
Sale
s of
el
ectr
icity
to h
ouse
hold
s
Impr
ove
acce
ss
to fi
nanc
e, s
kills
Es
tabl
ish
loca
l pr
ovid
ers
Educ
atio
n th
roug
h ex
tend
ed s
tudy
hou
rs
Chan
ge o
f att
itude
s th
roug
h ex
posu
re to
in
form
atio
nIn
crea
sed
com
fort
Incr
ease
d se
curit
yTi
me
savi
ngs
Price for energy, investment in devices
community
Use
of e
lect
ricity
Inte
rnat
. In
vest
men
t in
supp
ly
Enha
nce
el
ectr
icity
sup
ply
Dev
elop
mar
kets
for e
lect
rical
de
vice
s
Dis
trib
ute
devi
ces
to H
Hs
and
so
cial
inst
itutio
ns
Enha
nce
el
ectr
icity
dis
trib
utio
n
Impact pathways for electrification
Renewable Energy: Access and Impact
| 155 |
ii) Criteria related to the evaluation qualityA main quality selective criterion is that the presented results can be attributed to the intervention by a plausible counterfactual analysis. Preferably this is done by using either econometric models or application of multivariate analysis or by using rigorous methods (difference-in-difference; randomized controlled trial, cross-sectional analysis) or by a less rigorous ‘before-after’ or ‘with-without’ comparison.
The following eight quality criteria will be applied49:
1 Study counts with a theoretical basis and with a clear definition of research questions;2 Clear definition and demarcation of the evaluation object;3 Evaluation / research design according to a logical framework; intervention logic, or PCM
design, or counts with an evaluation matrix;4 Clear and sound evaluation / research methodology (sampling, sample size, triangulation,
response rate, controlling for variables);5 Reliability of the information sources;6 Quality of the analysis (comprehensiveness and clarity of presentation and analysis of
findings; representativeness of the results);7 Quality of conclusions (consistency between results and conclusions; sufficient evidence to justify the conclusions, limitations discussed);8 Learning effect of conclusions (quality of recommendations).
6. Search strategyBoth search and the selection of reports / articles depend on the keywords used during the selection process.
The search consists of two different entries:A. Scientific Journals and Web of ScienceB. Development organisations portals
• In addition, “snowballing” will be used (identification of in-text references of relevance that are not identified during the search process). Snowballed relevant references are included in the review and will be inserted under A.
The reports that will be extracted from the portals of development organisations will be kept separate from those found in scientific journals, since most of these reports will be qualified as ‘grey literature’.50 In practice, we expect most evaluation reports from development organisations, donors and international financing institutions. The disadvantage of grey reports is that these have not always been peer-reviewed; the advantage is that they use to provide more information about interventions and their costs, context conditions and specific circumstances.
49 Amended criteria derived from an IOB inventory for the assessment of evaluation reports. 50 There is no standard definition of ‘grey literature’, but in general it refers to either printed or digital
publication by public institutions or international organisations, research entities, trade and industry of which the publication was not made by a commercial publisher. It encompasses (public) reports, but also PhD- and master theses that were made public by the candidates (and not by a commercial publisher). In the Netherlands the GLIN database contains these theses with some 110 000 titles.
| 156 |
Annexes
The outcome of the search strategy requires monitoring and ‘along the way’ refinement of the search strategy (key words, sources, full articles rather than abstracts, balance between “A” and “B” flow).
The keywords for identification are composed by the kind of research (evaluation, impact, effects, results), the subject matter (biogas, stoves, solar, etc.) and the kind of result expected (income, expenditure, gender, markets, health, etc.).
Keyword selection in the title and abstract:
Keyword 1 “AND” Keyword 2 “AND”, “OR” Keyword 3
Evaluation Biogas Income
Impact Stoves Expenditure
Effects Solar Gender
Results Micro hydro power Markets
Geo-thermal Fuelwood
Electrification Health
Renewable Energy Pollution
Note: keyword 2 concerns the six energy subject matters, as referred to in section 3.
Theoretically the number of combinations (“AND”,”OR”) possible is high, in particular if different language options are taken into consideration. In practice, however, most relevant studies will have the subject matter keyword 2 in either the title or the keyword list51.
Examples are52 • “evaluation” AND “electrification” AND “markets”• “impact” AND “stoves” AND “gender” OR “pollution” • “results” AND “renewable energy” AND “fuelwood”.
A. Scientific Journals and Web of ScienceThe main sources are on-line libraries and search engines aggregating academic research, databases of published journals and on-line websites.
All scientific journals require peer-review prior to publication: these reviews are concise and follow pre-determined procedures. Published articles in scientific journals are assumed to have been reviewed by independent reviewers. The search takes place on titles of articles and keywords that are provided by the authors (or the publisher) for search functions (title or abstract).Most scientific journals are accessible through either the interconnected inter-university data base of e-journals and/or through publisher’s websites, such as Taylor and Francis, Elsevier, Wiley, SAGE, InderScience, Springer, Emerald and others; and through general search machines like GoogleScholar and JSTOR.
51 The combination of 1 and 2 provides already 23 search options.52 Boolean search if facility allows to do so.
Renewable Energy: Access and Impact
| 157 |
B. Development Organisation portalsSearch carried out in portals takes place on titles of publications and evaluation reports is comparable to those applied for the scientific reports. Most portals however do not apply a keyword system, but a search machine function within the website. Words to be used are ‘evaluation’; ‘renewable energy; ‘rural electricity”, and each of the six subject matters.
Portals are:• World Bank• GIZ, in particular EnDev portal• Asian Development Bank• African development Bank• Norwegian NORAD• England’s DfID and BritishAid• European Commission (EuropeAid; Cap4Dev)• Swiss Development Co-operation• Canadian CIDA• UN-website: UNEP, UNIDO, UN Energy, GEF• Energypedia• NGO networks like REEEP, GVEP, HEDON, ENERGIA and EASE, GNESD.
Search stepsThe search within scientific journals and the search among portals of development organisations will be registered as separate flows. Both follow their own sequence of steps and will lead to a selection from which sets of conclusions can be derived. Only at the stage of overarching conclusions the two streams will be merged. The search steps are the following:
Search steps in two flows
Scientific Journals Portals of development organisations
1 Initial search on key words in title and abstract (selection of geographic dimension, date)
Initial search on key words in title (selection of geographic dimension, date)
2 Pre-screening on subject based on abstract Pre-screening on subject summary description
3 First classification (kind of research and methodology); start codification in standardised sheets
First classification (kind of research and methodology); start codification in standardised sheets
4 Second classification (quality) Selection minimum 5 out of 8
Second classification (quality)Selection minimum 5 out of 8
5 Abstract and conclusions Abstract and conclusions
6 Overarching conclusions
7 Reporting
In the pre-screening of the title and abstract, most attention is paid to the question whether the article really refers to evaluative relevant questions AND in the area of renewable energy in developing and middle income countries (geographic dimension) AND the period under consideration (publication date).
| 158 |
Annexes
During the pre-screening the articles / reports that are considered to be potentially relevant for the review will be registered, and – if possible – copied and stored in digital form.In an Excel-sheet the following information is being registered:• Title• Author• Journal• Publisher• Year of publication
• Website / portal• Downloaded yes/no• Main subject• Date of the search
The first classification makes use of a standardised coding sheet (to be elaborated). The first classification assesses the subject and character of the articles / reports. The first step is a quick screening on subject matter and methodology. This judges if a report / article is really evaluative in character, if it refers to the type of interventions or energy sources we are interested in. The quick screening eliminates all articles or reports that are obviously not relevant to the study. The main reason for not taking the report or the article into further consideration is registered in the Excel sheet.For the remainder, the article or report is excluded if it: • Lacks a counterfactual or does not refer to a counterfactual or benchmark. This latter
criterion will not be strictly applied to evaluations identified in the development organisations’ portals, in particular not if these evaluations refer to local markets or specific institutional arrangements for service delivery;
• Concerns an opinion article not based on empirical research or substantial review of literature;
• Does not provide any indication of the methodology used, the sample size or the area of research. Or if the methodology used is considered obviously weak;
• If it refers to data from prior to 2000 (unless used in longitudinal studies); • Only describes the evaluative methodology, the theoretical background, the quantitative
or statistical considerations and solution frames, but not the results of the evaluation or research.
• If the article does not contain clear conclusions.
The second classification is restricted to those articles that have passed the first threshold. In the second stage the retained articles are made subject to further analysis based on the eight quality criteria indicated in section 5-ii. Based on these eight criteria, the reviewer classifies the articles according to the following groups:
Category Excellent quality Good quality Sufficient quality Insufficient quality
Conclusions No doubt about conclusions
Limited number of beneficiaries or specific circumstances limit the reach of the conclusions
Conclusions should be taken as indications only
Rejected
Number of criteria All criteria score sufficient
1 or 2 criteria score insufficient
Max 3 criteria score insufficient
>3 criteria score insufficient
Renewable Energy: Access and Impact
| 159 |
Only those that pass 5 or more accomplished criteria are taken into the further analysis on contents. All papers that considered in the first classification are electronically stored (unless costs impede to do so53).
All classified articles will be compiled in a bibliography with electronic links to their sources.
7. Classification and codes In the second classification the following data will be registered (a registration form is to be developed).
Cover sheet: title, author, year of publication, Journal, publisher; name of reviewer
Criterion 1: Study counts with a theoretical basis and with a clear definition of research questions.• Type of intervention;• Researchquestionsrelevant?• Theoretical assumptions;• Topic clearly explained.
Criterion 2: Clear definition and demarcation of the evaluation object• Objective of the evaluation / research;• Selection criteria for demarcation;• Type(s) of renewable sources;• Types of interventions / comparisons /participants;• Specified inclusion and exclusion criteria to reduce biased sampling.
Criterion 3: Evaluation / research design according to a logical framework, intervention logic, or Project Cycle Management design, or counts with an evaluation matrix.• Rationale from energy source to behavioural outcome;• Logic from energy source and market intervention;• Primary and secondary outcomes;• Use of OECD evaluation criteria.
Criterion 4: Clear and sound evaluation / research methodology (sampling, sample size, triangulation, response rate, controlling for variables).• Treatment, no treatment conditions;• Counterfactual;• Sample size;• Sampling criteria and methodology (prioritization);• Response rate;• Whoaretherespondents(ageandgenderdistribution)?• Rural setting and living arrangements.
53 Publishers may require payment for the download. Most scientific articles however can be obtained through search through the university library and/or the central library of the Netherlands ministry of Foreign Affairs.
| 160 |
Annexes
Criterion 5: Reliability of the information sources• Choice and suitability of tools; • Primary and secondary data;• Data processing quality (control mechanism);• Benchmarks.
Criterion 6: Quality of the analysis (comprehensiveness and clarity of presentation and analysis of findings; representativeness of the results)• Method data analysis (deviations, standardized mean difference, confidence interval,
Chi-square test);• Interpretation of data; outcomes considered in their context (geographic, socio-economic,
time);• Sensitivityanalysis?
Criterion 7: Quality of conclusions (consistency between results and conclusions;sufficient evidence to justify the conclusions, limitations discussed);• Narrative logic;• Generalisation (deduction, induction logic);• Free of unnecessary jargon;• Arethereanysubgroups(peopleorinterventions)thatmayshowdifferentoutcome?Is
thatmadeexplicit?• Comprehensiveness: thorough reporting of results, disaggregated and analysed by range of
factors.
Criterion 8: Learning effect of conclusions (quality of recommendations).• Isitinteresting?• Gender/agedifferenceincluded?• Identified areas of future research/ evaluation.
Each criterion can be scored: • insufficient: very weak, not enough information to make a judgement• weak: contains significant weaknesses (rudimentary or partial presentation)• acceptable: strong in parts• strong across all areas
8. Elaboration of conclusionsThe resulting overview after the second classification provides the set of information as source to address the research questions, and hence the key findings from the study.Conclusions are being derived from those articles that are considered ‘strong in all areas’ and ‘strong in parts’ only (unless there are strong reasons for incorporating other research as well). Even during the writing process, articles which are found to be less relevant for addressing the research questions can still be dropped from the list.The writing of conclusions will be subtracted from the flows A (scientific articles) and B (‘grey’ literature) separately. In a second and overarching step these conclusions are integrated.
The final product is an IOB study ‘green cover’ publication.
Renewable Energy: Access and Impact
| 161 |
Evaluation reports of the Policy and Operations Evaluation Department (IOB) published 2008-2013
More information about IOB can be found on the IOB website: www.government.nl/foreign-policy-evaluations
IOB no. Year Title evaluation report ISBN
376 2013 Renewable Energy: Access and Impact. A systematic literature review of the impact on livelihoods of interventions providing access to renewable energy in developing countries
978-90-5328-437-7
375 2013 The Netherlands and the European Development Fund - Principles and practices. Evaluation of Dutch involvement in EU development cooperation (1998-2012)
978-90-5328-436-0
374 2013 Working with the World Bank. Evaluation of Dutch World Bank policies and funding 2000-2011
978-90-5328-435-3
373 2013 Evaluation of Dutch support to human rights projects. (2008-2011)
978-90-5328-433-9
372 2013 Relations, resultats et rendement. Evaluations de la cooperation Benelux du point de vue des Pays-Bas.
978-90-5328-434-6
372 2012 Relaties, resultaten en rendement. Evaluatie van de Benelux Unie-samenwerking vanuit Nederlands perspectief
978-90-5328-431-5
371 2012 Convirtiendo un derecho en practica. Evaluacion de impacto del programa del cancer cervico-uterino del centro de mujeres lxchen en Nicaragua (2005-2009)
978-90-5328-432-2
371 2012 Turning a right into practice. Impact evaluation of the Ixchen Centre for Women cervical cancer programme in Nicaragua (2005-2009)
978-90-5328-429-2
370 2012 Equity, accountability and effectiveness in decentralisation policies in Bolivia
369 2012 Begrotingssteun: Resultaten onder voorwaarden – Doorlichting van een instrument (2000-2011)
978-90-5328-426-1
368 2012 Civil Society, Aid, and Development: A Cross-Country Analysis
979-90-5328-425-4
367 2012 Energievoorzieningszekerheid en Buitenlandbeleid – Beleidsdoorlichting 2006-2010
979-90-5328-424-7
366 2012 Drinking water and Sanitation – Policy review of the Dutch Development Cooperation 1990-2011
978-90-5328-423-0
| 162 |
Annexes
366 2012 Drinkwater en sanitaire voorzieningen – Beleidsdoorlichting van het OS-beleid 1990-2011
978-90-5328-422-3
365 2012 Tactische diplomatie voor een Strategisch Concept – De Nederlandse inzet voor het NAVO Strategisch Concept 2010
978-90-5328-421-6
364 2012 Effectiviteit van Economische Diplomatie: Methoden en Resultaten van Onderzoek.
978-90-5328-420-9
363 2011 Improving food security: A systematic review of the impact of interventions in agricultural production, value chains, market regulation, and land security
978-90-5328-419-3
362 2011 De Methodische kwaliteit van Programma-evaluaties in het Medefinancieringsstelsel-I 2007-2010
978-90-5328-418-6
361 2011 Evaluatie van de Twinningfaciliteit Suriname-Nederland
978-90-5328-417-9
360 2011 More than Water: Impact evaluation of drinking water supply and sanitation interventions in rural Mozambique
978-90-5328-414-8
359 2011 Regionaal en geïntegreerd beleid? Evaluatie van het Nederlandse beleid met betrekking tot de Westelijke Balkan 2004-2008
978-90-5328-416-2
358 2011 Assisting Earthquake victims: Evaluation of Dutch Cooperating aid agencies (SHO) Support to Haiti in 2010
978-90-5328-413-1
357 2011 Le risque d’effets éphémères: Evaluation d’impact des programmes d’approvisionnement en eau potable et d’assainissement au Bénin
978-90-5328-415-5
357 2011 The risk of vanishing effects: Impact Evaluation of drinking water supply and sanitation programmes in rural Benin
978-90-5328-412-4
356 2011 Between High Expectations and Reality: An evaluation of budget support in Zambia
978-90-5328-411-7
355 2011 Lessons Learnt: Synthesis of literature on the impact and effectiveness of investments in education
978-90-5328-410-0
354 2011 Leren van NGOs: Studie van de basic education interventies van geselecteerde Nederlandse NGOs
978-90-5328-409-4
353 2011 Education matters: Policy review of the Dutch contribution to basic education 1999–2009
978-90-5328-408-7
352 2011 Unfinished business: making a difference in basic education. An evaluation of the impact of education policies in Zambia and the role of budget support.
978-90-5328-407-0
351 2011 Confianza sin confines: Contribución holandesa a la educación básica en Bolivia (2000-2009)
978-90-5328-406-3
350 2011 Unconditional Trust: Dutch support to basic education in Bolivia (2000-2009)
978-90-5328-405-6
Renewable Energy: Access and Impact
| 163 |
349 2011 The two-pronged approach Evaluation of Netherlands Support to Formal and Non-formal Primary Education in Bangladesh, 1999-2009
978-90-5328-404-9
348 2011 Schoon schip. En dan? Evaluatie van de schuldverlichting aan de Democratische Republiek Congo 2003-2010 (Verkorte samenvatting)
978-90-5328-403-2
347 2011 Table rase – et après? Evaluation de l’Allègement de la Dette en République Démocratique du Congo 2003-2010
978-90-5328-402-5
346 2011 Vijf Jaar Top van Warschau De Nederlandse inzet voor versterking van de Raad van Europa
978-90-5328-401-8
345 2011 Wederzijdse belangen – wederzijdse voordelen Evaluatie van de Schuldverlichtingsovereenkomst van 2005 tussen de Club van Parijs en Nigeria. (Verkorte Versie)
978-90-5328-398-1
344 2011 Intérêts communs – avantages communs Evaluation de l ‘accord de 2005 relatif à l ‘allègement de la dette entre le Club de Paris et le Nigéria. (Version Abrégée)
978-90-5328-399-8
343 2011 Wederzijdse belangen – wederzijdse voordelen Evaluatie van de schuldverlichtingsovereenkomst van 2005 tussen de Club van Parijs en Nigeria. (Samenvatting)
978-90-5328-397-4
342 2011 Intérêts communs – avantages communs Evaluation de l’accord de 2005 relatif à l’allègement de la dette entre le Club de Paris et le Nigéria. (Sommaire)
978-90-5328-395-0
341 2011 Mutual Interests – mutual benefits Evaluation of the 2005 debt relief agreement between the Paris Club and Nigeria. (Summary report)
978-90-5328-394-3
340 2011 Mutual Interests – mutual benefits Evaluation of the 2005 debt relief agreement between the Paris Club and Nigeria. (Main report)
337 2011 Evaluación de las actividades de las organizaciones holandesas de cofinanciamiento activas en Nicaragua
336 2011 Facilitating Resourcefulness. Synthesis report of the Evaluation of Dutch support to Capacity Development.
978-90-5328-392-9
335 2011 Evaluation of Dutch support to Capacity Development. The case of the Netherlands Commission for Environmental Assessment (NCEA)
978-90-5328-391-2
- 2011 Aiding the Peace. A Multi-Donor Evaluation of Support to Conflict Prevention and Peacebuilding Activities in Southern Sudan 2005 - 2010
978-90-5328-389-9
333 2011 Evaluación de la cooperación holandesa con Nicaragua 2005-2008
978-90-5328-390-5
332 2011 Evaluation of Dutch support to Capacity Development. The case of PSO
978-90-5328-388-2
| 164 |
Annexes
331 2011 Evaluation of Dutch support to Capacity Development. The case of the Netherlands Institute for Multiparty Democracy (NIMD)
978-90-5328-387-5
330 2010 Evaluatie van de activiteiten van de medefinancieringsorganisaties in Nicaragua
978-90-5328-386-8
329 2010 Evaluation of General Budget Support to Nicaragua 2005-2008
978-90-5328-385-1
328 2010 Evaluatie van de Nederlandse hulp aan Nicaragua 2005-2008
978-90-5328-384-4
327 2010 Impact Evaluation. Drinking water supply and sanitation programme supported by the Netherlands in Fayoum Governorate, Arab Republic of Egypt, 1990-2009
978-90-5328-381-3
326 2009 Evaluatie van de Atlantische Commissie (2006-2009) 978-90-5328-380-6
325 2009 Beleidsdoorlichting van het Nederlandse exportcontrole- en wapenexportbeleid
978-90-5328-379-0
- 2009 Evaluation policy and guidelines for evaluations No ISBN
324 2009 Investing in Infrastructure 978-90-5328-378-3
- 2009 Synthesis of impact evaluations in sexual and reproductive health and rights
978-90-5328-376-9
323 2009 Preparing the ground for a safer World 978-90-5328-377-6
322 2009 Draagvlakonderzoek. Evalueerbaarheid en resultaten 978-90-5328-375-2
321 2009 Maatgesneden Monitoring ‘Het verhaal achter de cijfers’
978-90-5328-374-5
320 2008 Het tropisch regenwoud in het OS-beleid 1999-2005 978-90-5328-373-8
319 2008 Meer dan een dak. Evaluatie van het Nederlands beleid voor stedelijke armoedebestrijding
978-90-5328-365-3
318 2008 Samenwerking met Clingendael 978-90-5328-367-7
317 2008 Sectorsteun in milieu en water 978-90-5328-369-1
316 2008 Be our guests (sommaire) 978-90-5328-372-1
316 2008 Be our guests (summary) 978-90-5328-371-4
316 2008 Be our guests (Main report English) 978-90-5328-371-4
316 2008 Be our guests (samenvatting) 978-90-5328-370-7
316 2008 Be our guests (hoofdrapport) 978-90-5328-370-7
315 2008 Support to Rural Water Supply and Sanitation in Dhamar and Hodeidah Governorates, Republic of Yemen
978-90-5328-368-4
314 2008 Primus Inter Pares; een evaluatie van het Nederlandse EU-voorzitterschap 2004
309 2008 Het vakbondsmedefinancieringsprogramma – Summary English
978-90-5328-357-8
309 2008 Het vakbondsmedefinancieringsprogramma – Resumen Español
978-90-5328-357-8
309 2008 Het vakbondsmedefinancieringsprogramma 978-90-5328-357-8
308 2008 Het Nederlandse Afrikabeleid 1998-2006. Evaluatie van de bilaterale samenwerking
978-90-5328-359-2
308 2008 Het Nederlandse Afrikabeleid 1998-2006. Evaluatie van de bilaterale samenwerking (Samenvatting)
978-90-5328-359-2
307 2008 Beleidsdoorlichting seksuele en reproductieve gezondheid en rechten en hiv/aids 2004-2006
978-90-5328-358-5
If you want to receive a publication in printed form, please send an e-mail to [email protected], mentioning the title and ISBN number.
| 166 |
Published by:
Ministry of Foreign Affairs of the Netherlands Policy and Operations Evaluation Department (IOB)P.O.Box 20061 | 2500 eb The Hague | The Netherlandswww.government.nl/foreign-policy-evaluations
Front photo: Children watching television in Niger | Lineair Fotoarchief B.V.Photos: W.J. Cornelissen, J. Engelbertink
ISBN: 978-90-5328-437-7
Titel van het rapport | IOB Evaluatie | nr. 000 | Titel van het rapport | IOB Evaluatie | nr. 000 | Titel van het rapport | IOB Evaluatie | nr. 000 | Titel van het rapport | IOB Evaluatie | nr. 000 | Titel van het
Renewable Energy: Access and Im
pactIO
B Study | no. 376
Renewable Energy: Access and Impact| IOB Study | no. 376 | Renewable Energy: Access and Impact| IOB Study | no. 376 | Renewable Energy: Access and
Published by:
Ministry of Foreign Affairs of the NetherlandsPolicy and Operations Evaluation Department (IOB)P.O.Box 20061 | 2500 eb The Hague | The Netherlandswww.government.nl/foreign-policy-evaluations
About 40% of the global population relies on traditional use of biomass for cooking (i.e. the three-stone fires) and heating their houses. The united Nations has called for universal access to modern energy (i.e. electricity and clean cooking facilities) by 2030. The objective of the systematic literature review presented in this report is to provide a compre-hensive overview of evaluative literature and reports regarding the impact of (renewable) energy interventions on the livelihoods of end-users, being either individuals, households or communities in rural areas and the urban periphery in developing and middle income
countries. The interventions encompass the use of improved cooking stoves, biogas digesters, solar home systems (including solar lamps), and hydro powered mini-grids.
558 studies on the subject could be identified as evaluations, out of which 66 finally qualified for review. Conclusions are – amongst others – that the impact of interventions in energy sources and devices is determined by human behaviour rather than by technological design features. And while improved stoves and (renewable) electricity have a positive impact on health, the impact on the environment is at best modest.