20
Green Energy 2014 Renewable Energy M&A in the United States and Canada kpmgglobalenergyinstitute.com A research report from GLOBAL ENERGY INSTITUTE

Green Energy 2014Renewable Energy M&A in the United States and Canada
kpmgglobalenergyinstitute.com
A research report from
GLOBAL ENERGY INSTITUTE

Contents
Foreword ...................................................................................................................1
Executive summary .................................................................................................3
The evolving renewable energy M&A landscape ................................................4
Looking in the rear view mirror: the main M&A trends in 2013
M&A activity poised to keep growing
Who’s buying and selling? ......................................................................................6
The rise of the YieldCo
Institutional investors warming to renewable energy assets
Utilities and IPPs still acquiring renewable energy assets
European utility divestments slowing
Focusing on deal terms ......................................................................................... 11
Liquidity back at 2007 levels
New investors compressing returns
Solar in focus .......................................................................................................... 13
United States – M&A opportunities a plenty
Canada – opportunity limited to Ontario
Wind in focus .......................................................................................................... 15
United States – PTC uncertainty to catalyze M&A activity
Canada – Ontario and Quebec offer immediate investment opportunities

The ongoing attractiveness of investment yield associated with renewable generation assets is fueling continued capital flows into projects and pipelines of projects. These capital flows have been evident in new investment vehicles into the sector as well as ownership of assets flipping to utilities, IPPs, banks, or investment funds with lower costs of capital. While players downstream are benefitting from efficient capital markets, they are also facing challenges associated with declining PPA prices and the uncertainty of looming regulation, specifically in distributed generation solar.
While there is more clarity downstream, technology providers upstream and the broader Cleantech landscape continue to face commercialization and financing
Foreword
challenges that are leading to both consolidation and rationalization. New venture capital investment into the sector has slowed and focused on funding existing portfolio companies. Corporations in the United States, Europe, and Asia are benefitting from the opportunity of buying advanced technology, which they expect to leverage their manufacturing and distribution expertise to commercialize and deploy.
Subsectors of interest within Cleantech have gone through various volatilities. We saw significant interest initially in solar at the wafer, cell, and module level go through tremendous peaks and valleys, only to finally stabilize with fewer global players. We saw a fervor of activity in first-and-second-generation
Over the last few years we have seen a strong evolution in the renewable energy sector, from investment value being created upstream and throughout various elements of the supply chain, to value being more concentrated downstream at either the project level, or developers and/or financiers enabling utility and distributed generation assets.
Shez Bandukwala
Managing Director Head of Cleantech Investment Banking
John Gimigliano
Partner Washington National Tax
Anthony Bohnert
Partner Advisory
biofuels with interest now waning with limited commercial success beyond some of the initial ethanol and biodiesel players. Some of that investment and acquisition appetite has been captured in next-generation bio-materials, which still show significant promise in the market place. We expect to continue to see activity in certain subsectors such as energy storage, smart grid, and hybrid and electric vehicles.
We would like to thank everyone who participated in this survey and the interviewees that have given up their valuable time to contribute to the report. We would also like to thank Clean Energy Pipeline for assisting us in producing this report. We hope you find it insightful.
Green Energy 2014 | 1

The report was written in collaboration with Clean Energy Pipeline, a specialist provider of research, news, and data on the clean energy sector worldwide. Investment statistics in this report have been extracted directly from Clean Energy Pipeline’s transaction databases. Clean Energy Pipeline is a division of VB/Research.
2 | Green Energy 2014

The U.S. and Canadian renewable energy market is poised for a further upswing in M&A activity. Two thirds of survey respondents expect the number of sub-$50 million deals to increase during the next 18 months while 58 percent expect the number of $50–$500 million sized deals to increase.
These predictions are particularly striking given they were made following a very busy year for M&A. Some 222 acquisitions of U.S. and Canadian renewable energy companies and projects valued at $12.1 billion were announced in 2013, a 13 percent increase in deal numbers on the 197 deals totalling $11.8 billion announced in 2012.
So why do our survey respondents expect M&A activity to increase for a second consecutive year? Firstly, a new acquirer has burst onto the M&A scene in the form of the YieldCo. The three YieldCos that completed IPOs in 2013—TransAlta Renewables, Pattern Energy Group and NRG Yield—acquired stakes in 2.2 GW of operating wind capacity and 445 MW of operating solar capacity in 2013 alone. It is therefore no surprise that 43 percent of survey respondents expect YieldCos to be “very active” acquirers of renewable energy assets during the next 18 months, which would make them the third most active acquirers behind infrastructure funds and IPPs.
The majority of assets initially acquired by YieldCos were from their parent companies, but recent deals indicate they are now purchasing
Executive summary
assets from third parties as well. Many more YieldCos are in the pipeline, which should add further impetus to M&A activity.
YieldCos aside, the renewable energy sector continues to attract the attention of institutional investors including insurance funds, pension funds, and infrastructure funds. Institutional investors acquired 38 renewable energy assets valued at $2.5 billion in 2013, a significant increase on the 13 assets ($219 million) purchased two years ago.
Survey responses expect institutional investors to continue buying renewable energy assets—57 percent expect infrastructure funds to be “very active” acquirers during the next 18 months, placing them ahead of every other buyer class. Coming slightly further down the rankings, 28 percent expect pension funds to be “very active” acquirers.
Utilities and IPPs are also expected to be keen buyers of renewable energy assets during the next 18 months. This should be underpinned by the desire to hedge against rising and volatile natural gas prices as well as the glut of development-stage wind farms that are being put up for sale by smaller developers unable to complete construction. Almost 50 percent of survey respondents expect both IPPs and utilities to be “very active.”
Looking at individual sectors, solar PV and wind will continue to dominate M&A activity—69 percent of survey respondents targeting
acquisitions in North America during the next 18 months are exploring solar PV opportunities, while 45 percent are looking at wind, making these the top two most attractive sectors. There was a similar picture in 2013, when wind and solar PV deals collectively accounted for 70 percent of the total number and value of total M&A activity.
In solar, M&A activity is expected, broadly speaking to be characterized by financial investors and IPPs acquiring operating utility-scale solar PV projects from their developers, many of which are equipment manufacturers; and YieldCos acquiring projects from IPPs. Project-level M&A is not conducive to the residential solar market, although M&A could take place at a corporate level as installers seek to increase or consolidate their geographic coverage. We also expect to see investment opportunities arising from the securitization of pooled residential assets.
In wind, M&A is expected to be underpinned by IPPs acquiring development-stage projects from smaller developers struggling to fund construction. Driven by the expectation that new investment opportunities will decrease from 2015, we also expect to see IPPs take to M&A to rationalize their operating portfolios. Operating wind assets are also proving particularly attractive acquisition targets to institutional investors seeking long-term, low-risk returns. In short, 2014 looks set to be another very busy year!
Green Energy 2014 | 3

The evolving renewable energy M&A landscape
Renewable energy M&A activity in the US and Canada
Source: Clean Energy Pipeline
Number of deals
0
1
2
3
4
5
6
7
1Q14
4Q13
3Q13
2Q13
1Q13
4Q12
3Q12
2Q12
1Q12
4Q11
3Q11
2Q11
1Q11
4Q10
3Q10
2Q10
1Q10
4Q09
3Q09
2Q09
1Q09
0
10
20
30
40
50
60
70
Deal value
Dea
l val
ue ($
bill
ion) N
umber of deals
Note: Includes generation assets and the supply chain
stakes in 2.2 GW of operating wind capacity, 445 MW of operating solar capacity, and 127 MW of operating hydro capacity in 2013 (including transfers of assets from parent companies).
Thirdly, a number of major European utilities continued to divest minority stakes in large portfolios of operating renewable energy assets across the United States and Canada, both to bolster their balance sheets and to recycle capital into new investments. European utilities, or subsidiaries of European utilities, announced the
sale of 10 North American portfolios of renewable energy projects valued at $913 million in 2013, well below the $2.8 billion worth of divestments announced in 2012, but significantly ahead of the $347 million worth of sales announced in 2011.
Lastly, motivated by the ongoing low-yield environment and the maturation of the sector, institutional investors maintained their interest in acquiring operating renewable energy projects. Pension funds, insurance funds, and infrastructure funds acquired 38 renewable energy assets valued at
Looking in the rear view mirror: the main M&A trends in 2013 M&A activity hit a new peak in 2013. Some 222 acquisitions of U.S. and Canadian renewable energy companies and projects were announced in 2013, a 13 percent increase on the 197 deals announced in 2012. The value of M&A activity also increased—$12.1 billion worth of M&A deals were announced in 2013 versus $11.8 billion in 2012.
The increase was underpinned by four principal factors. Firstly, 72 acquisitions of solar PV projects valued at $2.5 billion were announced in 2013, representing an 18 percent increase on the 61 deals announced in 2012. This was due to a wave of projects coming online—some 2.8 GW of utility-scale solar PV projects came online in 2013, a 56 percent increase on the 1.8 GW installed in 2012. Many of these projects were developed by panel manufacturers, which triggered a series of disposals since panel manufacturers usually sell their utility-scale projects to financial investors or utilities once they become operational.
Secondly, 2013 witnessed the emergence of YieldCos, publically listed infrastructure investment funds that offer investors long-term stable dividends based on the cash flows from renewable energy projects. Although the largest YieldCos only completed IPOs in the second half of 2013—NRG Yield secured $495 million through an IPO in July 2013, while Pattern Energy Group raised $352 million through an IPO in September 2013—YieldCos acquired
4 | Green Energy 2014

How do you expect the following aspects of the renewable energy M&A environment to evolve during the next 18 months? (North American survey respondents)
Source: Clean Energy Pipeline
Number of deals > $1 billion
Number of deals between $0.5 billion and $1 billion
Number of deals between $50 million and $0.5 billion
Number of deals < $50 million
Increase Stay the same Decrease
66% 24% 10%
58% 29% 13%
31% 44% 26%
27% 40% 33%
Renewable energy M&A activity in the United States and Canada by sector as a percentage of deal value (2013)
Renewable energy M&A activity in the United States and Canada by sector as a percentage of deal numbers (2013)
Source: Clean Energy Pipeline Source: Clean Energy Pipeline
14%
45%
Wind
Solar
Biofuels
Hydro
Biomass
Geothermal
13% 2%
1%
25% Hydro5%
GeothermalGeothermal2%
27%
Wind
14%
Biofuels
Solar
43%Biomass
9%
$2.5 billion in 2013, in line with the 39 acquisitions announced in 2012 ($5.0 billion), but significantly above the 13 acquisition totalling $219 million in 2011.
Looking at the sector breakdown, the M&A landscape was dominated by wind and solar, which collectively accounted for 70 percent of the total number and value of deals. Acquisitions of operational assets or owners/developers of operational assets accounted for 77 percent of the number and 92 percent of the value of deals. Acquisitions of companies in the supply chain provided the remainder of the deals.
M&A activity poised to keep growingSurvey respondents are unanimous that the high level of M&A activity witnessed last year will be maintained during the next 18 months—66 percent expect the number of sub-$50 million deals to increase while 58 percent expect the number of $50–$500 million deals to increase. Given that 92 percent of M&A deals announced in 2013 were under $500 million in size, the next 18 months look set to be very busy.
Green Energy 2014 | 5

Who’s buying and selling?
The rise of the YieldCo The emergence of the YieldCo structure is one of the most exciting developments in the North American renewable energy sector during the past 12 months, and also one of the primary drivers of future M&A activity. Three YieldCos have already been created in the United States. In July 2013, NRG Yield, the YieldCo vehicle of NRG Energy, the largest IPP in the US, secured $495 million through an IPO on the New York Stock Exchange. The proceeds were used to acquire a series of assets from NRG Energy, including 1,324 MW of natural gas, wind, and solar power projects.
Since then, Pattern Energy Group LP secured $352 million for its own YieldCo, Pattern Energy Group Inc., through an IPO on the NASDAQ in September 2013. Most recently, in April this year, SunEdison completed the initial $250 million capitalisation of its YieldCo vehicle “SunEdison Yieldco,” financed by Goldman Sachs. In Canada, TransAlta Corporation closed the $210 million IPO of its YieldCo vehicle TransAlta Renewables Inc., in August 2013.
The strategies of each of these YieldCos vary. For example, NRG Yield and TransAlta Renewables will only acquire operating assets, while Pattern Energy Group has also purchased construction-stage assets. The YieldCos’ investment focus also differs by sector, country, and cash available for distribution. One commonality, however, is that they all need to reach a critical scale to be attractive to public market investors and to create sufficient profits to absorb the tax benefits of owning renewable energy assets.
For this reason, YieldCos need to amass at least $500 million worth of assets before they can be marketed for IPO. It is therefore unsurprising that 43 percent of survey respondents expect YieldCos to be “very active” acquirers of renewable energy assets during the next 18 months, making them the third most active acquirers behind infrastructure and private equity funds and IPPs. This is remarkable given that NRG Yield, the first renewable energy YieldCo in the United States, only completed its IPO in July 2013.
“I think we will see more M&A activity in the next 12-18 months than we have witnessed in the past three to four years combined,” predicts Matthew Brown, founding principal at Tamra-Tacoma Capital Partners. “The introduction and growth of YieldCos is poised to revolutionize the renewable energy industry. YieldCos need to demonstrate growth, which they do by acquiring and pooling assets.”
Many more YieldCos are in the pipeline. U.S.-based wind farm operator NextEra Energy filed to list a YieldCo vehicle on the public markets in late April 2014 (size currently undisclosed). Abengoa has also announced plans to raise up to $600 million from the IPO of its new U.S. YieldCo unit; Abengoa Yield plc.
Institutional investors warming to renewable energy assetsIn the current low-yield environment, many institutional investors have acquired operational renewable energy assets because they represent a compelling alternative to fixed-income instruments such as government bonds. Some have invested directly, while
6 | Green Energy 2014

Who’s buying and selling?
others have invested in infrastructure and private equity funds with renewable energy mandates, thereby giving them exposure to a wide range of projects.
In 2013 institutional investors acquired 38 renewable energy assets valued at $2.5 billion, significantly more than the 13 assets totalling $219 million in 2011.
Notable examples in the past 18 months include: Canadian institutional fund manager Caisse de dépôt et placement du Québec’s $500 million acquisition of a minority stake in a 1.5 GW portfolio of 13 operating wind farms in Canada and the USA in January 2013; Fiera Axium Infrastructure and MetLife’s acquisition of an 86 MW portfolio of solar PV projects in Ontario, Canada in October 2013 (value undisclosed); and KKR’s acquisition alongside Google of a portfolio of six solar PV projects located in California and Arizona in November 2013.
Survey respondents expect institutional investors to maintain their interest—57 percent expect infrastructure funds to be “very active” acquirers during the next 18 months, compared with 52 percent in last year’s survey, while 28 percent expect pension funds to be ‘very active’ investors. According to survey respondents, solar PV, hydro and onshore wind assets represent the most attractive targets for institutional investors.
“There is liquidity in the market that is looking for long-term safe investments,” explained Gabriel Alonso, CEO of EDP Renewables North America. “This, coupled with the fact that there is a stronger understanding of how reliably we operate wind farms, makes wind a safe investment. So I think investors will
How active will the following institutions be in acquiring and investing in the renewable energy sector over the next 18 months? (North American survey respondents)
Source: Clean Energy Pipeline
Governments
Multilateral financial organisations (e.g. EIB, IFC)
Pension funds
Sovereign wealth funds
Renewable energy equipment manufacturers
Utilities
YieldCos
Independent power producers (IPP)
Infrastructure funds / PE funds57%Very active (2014)
52%Very active (2013)
51%60%
43%
42%37%
33%
32%31%
28%28%
22%22%
19%20%
42%
No data in 2013
Green Energy 2014 | 7

continue to buy stakes in wind assets. Pension funds and insurance companies are already doing this, and I expect they will do more in the future.”
Utilities and IPPs still acquiring renewable energy assetsSurvey respondents also expect utilities and IPPs to be active acquirers during the next 18 months—51 percent expect IPPs to be “very active” acquirers, while 42 percent expect utilities to be “very active” acquirers.
As Arno Harris, CEO of Recurrent Energy, explains, there is a strategic rationale for large IPPs to acquire renewable energy projects from smaller developers. “In the U.S. you have lots of different policy environments and industry dynamics across different states, so there is always going to be room for smaller developers to put projects together,” he said. “However, it will be really difficult for these developers to take these projects all the way through to completion. To do this, they will have to sell before construction. Access to capital makes the top tier developers the primary buyers of projects in this market.”
The emergence of YieldCos also explains why IPPs are expected to be the second most active acquirers. Many IPPs are currently acquiring renewable
To what extent are the following operating renewables assets attractive to investors seeking long term low risk returns, such as pension or infrastructure funds? (North American survey respondents)
Source: Clean Energy Pipeline
Very attractive Somewhat attractive
Biomass
Offshore wind
Solar thermal
Onshore wind
Hydro
Solar PV51% 41% 92%
87%
85%
72%
67%
66%
40% 47%
37% 48%
17%
17%
54%
50%
20% 46%
8 | Green Energy 2014

energy projects to amass a large enough portfolio that can then be consolidated into a YieldCo vehicle and offered to public market investors.
For both utilities and IPPs, the steady increase in natural gas prices during the last two years has been a motivating factor in driving acquisitions of renewable energy projects. The predictable operating costs of wind and solar act as a natural hedge against natural gas price volatility. Natural gas prices, according to the Henry Hub index, averaged $4.9 per million BTU in March 2014, more than double the price in March 2012 ($2.17 per million BTU).
“Many utilities and municipalities that need long-term power are choosing wind over natural gas in certain cases as you don’t have the price volatility of the fuel source and it adds diversification to the energy mix,” confirmed Craig Carson, U.S. CEO of Infigen Energy. “The same is true for utility scale solar, although this is slightly less competitive.”
On the flipside, one factor that could put a dampener on utility-led acquisitions is Renewable Portfolio Standard (RPS) fulfilment. In the past six years, many utilities have pursued M&A strategies to meet RPS targets, which require utilities to produce a specific percentage of their electricity from renewable energy sources. Failure to meet these targets can lead to penalties. Some 30 U.S. states have implemented RPSs, and a further eight have established renewable energy goals. However, states with some of the most ambitious RPSs, such as California, are close to meeting these objectives.
“California is reaching contractual fulfilment of its RPS, which has been a major driver in recent years,” confirmed Arno Harris. “The major utilities are slowing down their procurement as they wait to see which direction the state is going to take. There is still a fair amount of procurement happening from the municipalities, but overall procurement is slowing down.”
Henry Hub Natural Gas Spot Price
Source: US Energy Information Administration
0
3
6
9
12
15
2014
2013
2012
2011
2010
2009
2008
2007
2006
2005
2004
2003
2002
2001
2000
1999
1998
1997
$ pe
r mill
ion
BTU
Green Energy 2014 | 9

European utility divestments slowingIn the past two years one of the major catalysts for M&A activity in North America and Canada was divestments by major European utilities. European utilities, or subsidiaries of European utilities, announced sales of portfolios of renewable energy assets located in Canada and the United States valued at $913 million in 2013. However, this was almost $2.0 billion less than in 2012.
While the number of disposals by European utilities is relatively small, only accounting for 5 percent of all announced deals in 2013, the value of divestments is material since European utilities own very large portfolios of assets across Canada and the United States. In 2012 the $2.8 billion worth of divestments by European utilities accounted for 24% of the total value of announced M&A deals that year.
The significant decrease in the value of disposals by European utilities in 2013 indicates those with divestment strategies have now sold their largest assets. Survey respondents are divided on the extent to which European utilities will continue to be active sellers of North American renewable energy assets—47 percent agree with the statement that “M&A activity in North American will be catalyzed by European investors exiting renewables portfolios,” while 53 percent disagree.
To what extent to you agree that M&A activity in North American will be catalyzed by European investors exiting renewables portfolios?
Source: Clean Energy Pipeline
7%6%
40%47%
Strongly agree
Agree
Disagree
Strongly disagree
10 | Green Energy 2014

Focusing on deal terms
Liquidity back at 2007 levels The availability of funding was rated the second most important driver of M&A activity by North American survey respondents, behind only a desire for assets with long-term stable returns. Although survey respondents are divided on the extent to which the availability of
acquisition finance has changed during the past 12 months—27 percent believe acquisition financing is easier to secure, 30% believe acquisition financing is harder to secure and 44 percent believe there has been no measurable change—anecdotal evidence suggests funding is readily available.
How significant will the following factors be in driving M&A activity in the renewable energy sector over the next 18 months? (North American survey respondents)
Source: Clean Energy Pipeline
Very significant factor
Improving green credentials
Distressed assets coming to market
Meeting regulatory targets
Accessing new markets
Need for consolidation
Availability of good quality opportunities
Availability of funding
Desire for assets with long term stable returns
Significant factor Not a significant factor
56% 35% 9%
48% 43% 9%
43% 47% 10%
38% 43% 19%
27% 50% 23%
22% 49% 28%
19% 46% 35%
14% 50% 36%
56%Agree that desire for assets with long-term stable returns is a very significant factor driving M&A activity
Green Energy 2014 | 11
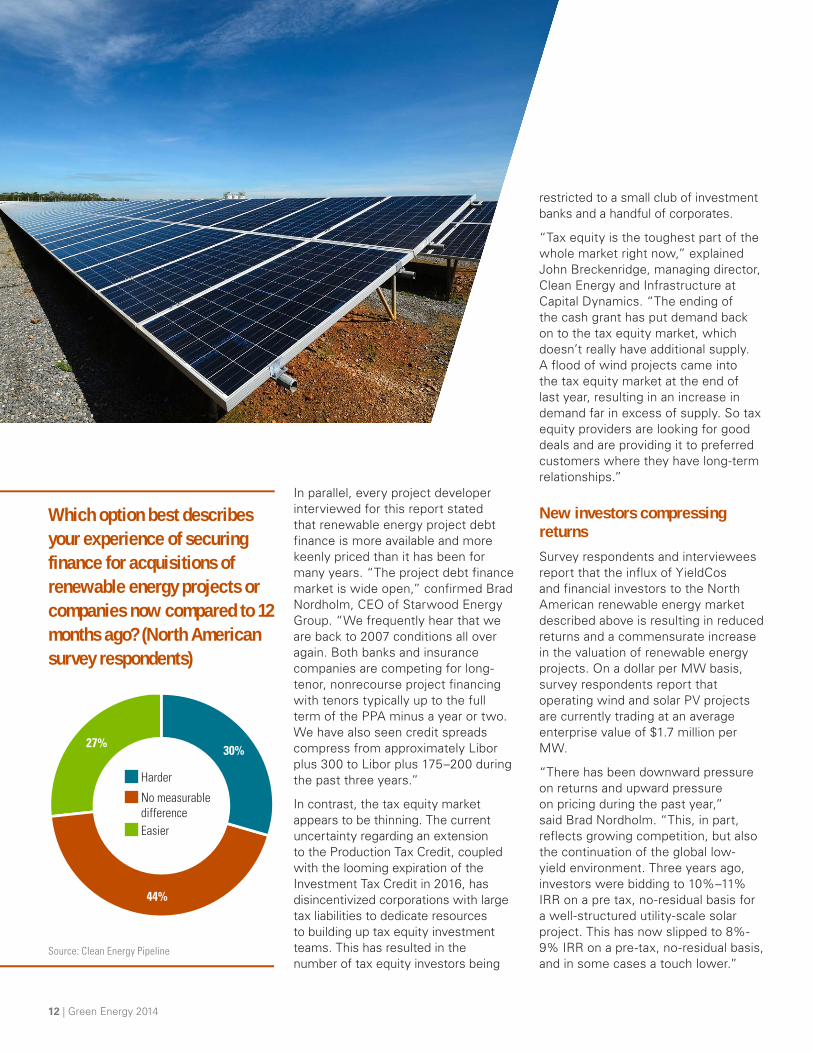
Which option best describes your experience of securing finance for acquisitions of renewable energy projects or companies now compared to 12 months ago? (North American survey respondents)
Source: Clean Energy Pipeline
27%30%
44%
Harder
No measurable differenceEasier
In parallel, every project developer interviewed for this report stated that renewable energy project debt finance is more available and more keenly priced than it has been for many years. “The project debt finance market is wide open,” confirmed Brad Nordholm, CEO of Starwood Energy Group. “We frequently hear that we are back to 2007 conditions all over again. Both banks and insurance companies are competing for long-tenor, nonrecourse project financing with tenors typically up to the full term of the PPA minus a year or two. We have also seen credit spreads compress from approximately Libor plus 300 to Libor plus 175–200 during the past three years.”
In contrast, the tax equity market appears to be thinning. The current uncertainty regarding an extension to the Production Tax Credit, coupled with the looming expiration of the Investment Tax Credit in 2016, has disincentivized corporations with large tax liabilities to dedicate resources to building up tax equity investment teams. This has resulted in the number of tax equity investors being
restricted to a small club of investment banks and a handful of corporates.
“Tax equity is the toughest part of the whole market right now,” explained John Breckenridge, managing director, Clean Energy and Infrastructure at Capital Dynamics. “The ending of the cash grant has put demand back on to the tax equity market, which doesn’t really have additional supply. A flood of wind projects came into the tax equity market at the end of last year, resulting in an increase in demand far in excess of supply. So tax equity providers are looking for good deals and are providing it to preferred customers where they have long-term relationships.”
New investors compressing returnsSurvey respondents and interviewees report that the influx of YieldCos and financial investors to the North American renewable energy market described above is resulting in reduced returns and a commensurate increase in the valuation of renewable energy projects. On a dollar per MW basis, survey respondents report that operating wind and solar PV projects are currently trading at an average enterprise value of $1.7 million per MW.
“There has been downward pressure on returns and upward pressure on pricing during the past year,” said Brad Nordholm. “This, in part, reflects growing competition, but also the continuation of the global low-yield environment. Three years ago, investors were bidding to 10%–11% IRR on a pre tax, no-residual basis for a well-structured utility-scale solar project. This has now slipped to 8%-9% IRR on a pre-tax, no-residual basis, and in some cases a touch lower.”
12 | Green Energy 2014

Solar in focus
For the second year running, survey respondents targeting clean energy investments in North America are most attracted to solar PV—69 percent are targeting investments in or acquisitions of solar PV assets during the next 18 months, a significant upswing on the 63 percent targeting solar PV in last year’s survey. Transaction data confirms this trend. Some 97 acquisitions of solar PV companies or projects valued at $3.0 billion were announced in 2013, a 26 percent increase in deal numbers on the 77 transactions totalling $4.8 billion in 2012. However, the opportunities for solar PV investment and M&A differ significantly between Canada and the United States and by project size.
Which sectors are you seeking to acquire/invest in during the next 18 months? (Respondents targeting acquisitions/investments in North America)
Source: Clean Energy Pipeline
Tidal/Wave
Offshore wind
Biogas
Biofuels
Geothermal
Biomass
Hydro
Onshore wind
Solar PV69%
63%2014 survey2013 survey
38%23%
45%41%
36%45%
22%27%
19%38%
19%17%
14%23%
9%20%
//PPAs issued in 2009–2011 are getting built now. Next year will still be big in terms of installations but that bubble will work itself off in 2016.//
Arno Harris CEO, Recurrent Energy
Green Energy 2014 | 13

United States – M&A opportunities a plenty
Canada – opportunity limited to Ontario
Utility-scale projects: The prospects for solar PV investment and M&A in the United States vary significantly by asset size. The utility-scale solar PV market (>20 MW) is expected to continue to grow significantly over the next two years due to a sizeable backlog of projects with PPAs in place that are currently being built in major solar markets such as California. Approximately 2.8 GW of utility-scale assets were installed in the United States in 2013, a 56 percent increase on the 1.8 GW installed in 2012, according to the U.S. Solar Energy Industries Association.
However, Californian utilities, which have been the most active procurers of utility-scale solar PV projects in the past five years, are now scaling back their procurement activities as they approach fulfilment of their RPS requirements. Despite the emergence of Texas as an attractive market for utility-scale solar, new utility-scale installations will almost certainly decrease from 2016.
“The amount that the three major Californian utilities (SCE, PG&E and SDG&E) have procured has really tailed off,” confirmed Arno Harris, CEO of Recurrent Energy. “PPAs issued in 2009–2011 are getting built now. Next year will still be big in terms of installations but that bubble will work itself off in 2016.”
This surge in new utility-scale installations should trigger an increase
Ontario represents the greatest opportunity for solar PV investment in Canada. Some 1 GW of solar PV capacity was operating in Ontario at the end of 2013, while a further 1.1 GW was under development. This sizeable project pipeline and base of installed capacity should create opportunities for
in M&A activity since many projects are being developed by panel manufacturers that have no strategic interest in retaining ownership of these assets. “A lot of large 100 MW-plus projects are being constructed now, and a lot of these were built by panel manufacturers,” explained John Breckenridge, managing director, Clean Energy and Infrastructure at Capital Dynamics. “They don’t want to hold these assets over the long term. This is the biggest driver of M&A activity for utility-scale solar PV projects.”
Commercial, government, school, and nonprofit projects: The commercial, government, school and non-profit solar PV market is also growing rapidly—some 1.1 GW was installed in 2013, in line with the 1.1 GW installed in 2012 (830 MW was installed in 2011). This increase is being underpinned by continued cost reductions and certainty that the solar PV investment tax credit (ITC) will be available through 2016. Indeed, system costs for commercial-scale projects fell by 16 percent year-on-year to $3.57 per watt in 2013. As discussed earlier, M&A activity in commercial-scale solar PV projects is expected to be driven by the emergence of YieldCo structures.
Residential solar PV: The fastest growing sector of the solar PV industry is the residential market. Some 792 MW of residential solar PV panels was installed in 2013,
both new investment and secondary M&A opportunities.
Solar PV investment opportunities are limited across the rest of Canada. Alberta has a solar resource that is 25 percent better than Ontario’s and 30 percent better than Germany’s,
a 60 percent increase on the 494 MW installed in 2012. This increase was driven by further decreases in solar PV costs and innovation in financing structures, lowering the cost of capital. A notable recent example of financing innovation is the securitization structure deployed by SolarCity. In November 2013, the residential solar installer closed a pooled securitization of distributed energy assets, raising just over $54.4 million.
This transaction highlights the types of investment opportunities in residential solar PV. Conversely, it is not expected that conventional project-level M&A activity will take off in this market segment given the difficulties in creating portfolios of assets. The only obvious area for M&A activity in residential solar PV could be consolidation among installers seeking to expand their geographic coverage.
“The business model of the companies that are putting solar panels on rooftops is not really conducive to project-level M&A since these companies own and then rent the assets,” said Paul Walker, CFO of RES Americas. “That said, these companies may become vertically integrated by buying companies further down the supply chain. Some of these companies have already expanded into new regions through M&A.”
yet virtually no solar PV capacity is installed in the province. As described earlier, this could change if the province introduces an attractive renewable energy framework as expected this year.
14 | Green Energy 2014
The outlook for wind installations in Canada and the United States is very strong. In the United States, the one-year renewal of the PTC on the second day of 2013 and, importantly, the added proviso that projects may still qualify for the PTC as long as construction had started by December 31, 2013 (as opposed to previous PTCs that required projects to be operational by the deadline date) resulted in a huge number of projects commencing construction in the second half of 2013. According to the American Wind Energy Association, a record 12 GW of wind capacity was under construction at the end of 2013.
However, there is a degree of uncertainty as to whether a large number of these projects have actually satisfied the “under construction” criteria required to qualify for the PTC. According to Internal Revenue Service (IRS) guidelines, wind projects can
According to survey data, wind M&A activity will increase during the next 18 months—some 45 percent of North American survey respondents are targeting wind acquisitions during the next 18 months, a slight increase on the 41 percent registered last year. However, as with the solar sector, wind investment and M&A opportunities are expected to vary markedly in Canada and the United States.
Wind in focus
United States – PTC uncertainty to catalyze M&A activity
qualify for the PTC if physical work of a significant nature has commenced (the “begin construction” criteria) or if more than 5 percent of project costs have been incurred (the safe harbor criteria) prior to the deadline. If projects qualify through the latter, they must also undertake construction on a “continuous basis” thereafter. Concern has recently arisen that projects qualifying under the “begin construction” criteria may not have actually fulfilled the qualification requirements.
“Initially, it was thought there were clear rules concerning how the tax credit will be available to projects that complete construction by December 31, 2015,” explained James Spencer, CEO at EverPower. “But now there is some fogginess about what those rules really are. The real question is what “start of construction” means. The IRS elaborated on this, and then all of a
//We are seeing a lot of shovel-ready projects that people want us to acquire. But we, as a potential acquirer, are very nervous about these assets due to the uncertainty about whether they have actually satisfied the PTC requirements.//
James Spencer CEO, EverPower
Green Energy 2014 | 15

sudden people who that thought they had started construction by the deadline actually hadn’t. Uncertainty hangs over 40% of projects people thought had fulfilled the obligations to secure the PTC. This is not a risk that tax equity providers will take. Developers need to have unquestionable proof that they have satisfied the rules.”
Despite this uncertainty, the volume of wind capacity built in 2014 and 2015 is expected to be significant by historical standards given the sheer volume of capacity currently being built. The outlook beyond this is unclear and will depend to a large extent on whether the PTC is extended. The fact that only 1.1 GW of wind was installed in the United States in 2013 (compared with 13.1 GW in 2012) underlines the extent to which the industry relies on this incentive.
These evolving dynamics are expected to impact M&A activity in two ways. Firstly, developers with projects that qualified under the “safe harbor” criteria must now satisfy continuous construction requirements and ensure
their project is online by the end of 2015. For smaller developers with limited access to capital, this could prove problematic, potentially leading to divestments to larger developers that are better placed to bring projects online within the required time frame.
“Smaller developers that own projects they did not intend to fully construct, own, and operate may struggle to qualify for the PTC under ‘continuous construction’ if they don’t have sufficient capital,” said James Spencer. “These projects must be brought online by the end of next year. These deadlines will spur some M&A activity in late stage development projects. We are seeing a lot of shovel ready projects that people want us to acquire. But we as a potential acquirer are very nervous about these assets due to the uncertainty about whether they have actually satisfied the PTC requirements.”
Secondly, M&A activity may be catalyzed on the basis that investment opportunities will be limited after 2015. As Craig Carson, U.S. CEO of Infigen
Canada – Ontario and Quebec offer immediate investment opportunities
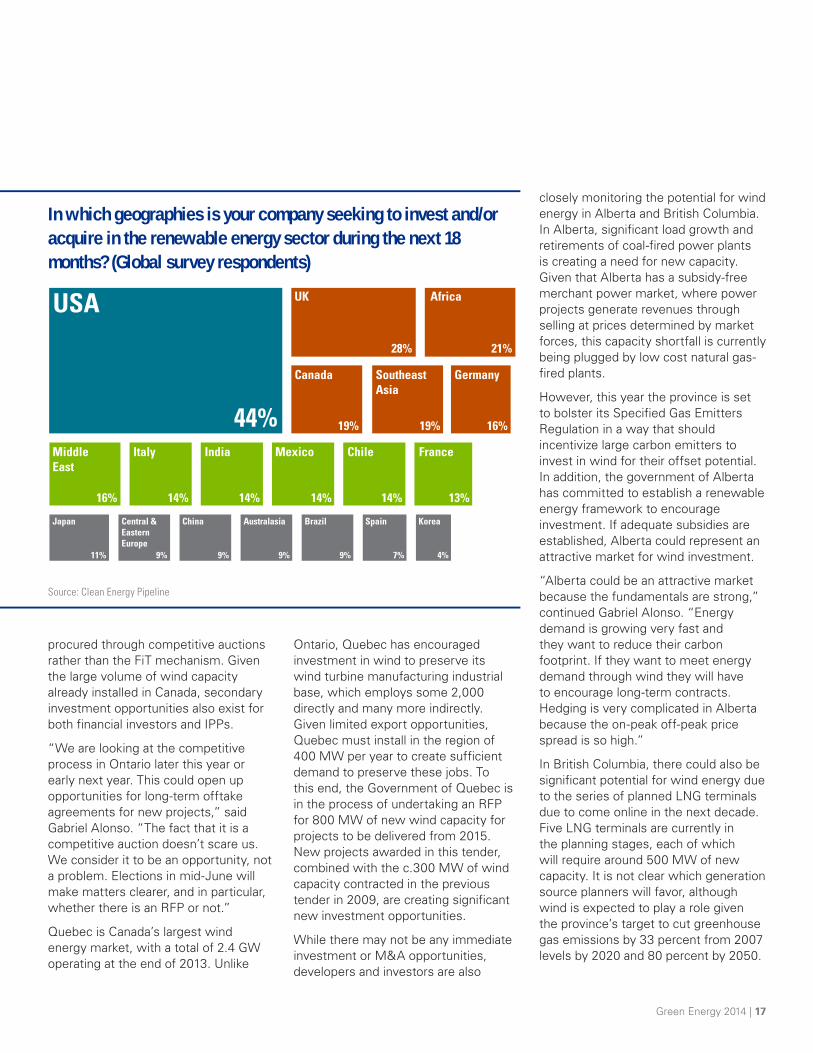
Canada’s major provinces have very different electricity markets and policies to promote wind energy, so naturally the opportunities for M&A and new investment vary significantly across the country. According to survey respondents, there is significant appetite to invest in Canada’s wind sector—19 percent of our global sample of survey respondents are targeting renewable energy investments and/or acquisitions in Canada during the next 18 months, making it the fourth most attractive market behind the United States, United Kingdom, Africa, and Southeast Asia. However, among
North American survey respondents Canada is ranked the second most attractive sector for renewable energy investments after the United States. Given that renewable energy investment opportunities in Canada are limited to wind and hydro, it is likely that a large proportion of this figure is targeting wind investments.
With 2.5 GW of installed wind capacity at the end of 2013, Ontario is Canada’s largest wind energy market. Wind energy has historically been subsidised by a feed-in tariff, which was implemented to assist the province meet
Energy explains, fewer new build opportunities may encourage asset owners to create value by rationalizing their portfolio through M&A. “The wind industry is starting to go through a portfolio rationalization phase as there are less new build opportunities available,” he said. “They will try to maximize the value they already have by consolidation and generating economies of scale.”
“For example, we have a series of facilities in Texas and the Pacific Northwest. It might make sense to exit some of our position in the Pacific Northwest to a company that might want to exit its position in Texas, so there could be some asset trading to provide greater focus on one geography, technology, or a preference for contracted versus merchant projects.”
As outlined earlier, there is also significant potential for wind M&A activity due to the emergence of YieldCos and the strong appetite of institutional investors for contracted assets offering long-term stable returns.
its target to install 10.7 GW of non-hydro capacity by 2021, the majority of which is expected to be wind.
The significant volume of wind projects awarded feed-in tariffs that have not commenced construction, combined with the province’s future procurement plans, mean there ought to be plenty of investment opportunities for developers and investors. Indeed, in December 2013 the Government of Ontario announced it would request proposals for 600 MW of additional wind capacity in 2014 and 2015. Furthermore, all wind projects over 500 KW will be
16 | Green Energy 2014
procured through competitive auctions rather than the FiT mechanism. Given the large volume of wind capacity already installed in Canada, secondary investment opportunities also exist for both financial investors and IPPs.
“We are looking at the competitive process in Ontario later this year or early next year. This could open up opportunities for long-term offtake agreements for new projects,” said Gabriel Alonso. “The fact that it is a competitive auction doesn’t scare us. We consider it to be an opportunity, not a problem. Elections in mid-June will make matters clearer, and in particular, whether there is an RFP or not.”
Quebec is Canada’s largest wind energy market, with a total of 2.4 GW operating at the end of 2013. Unlike
Ontario, Quebec has encouraged investment in wind to preserve its wind turbine manufacturing industrial base, which employs some 2,000 directly and many more indirectly. Given limited export opportunities, Quebec must install in the region of 400 MW per year to create sufficient demand to preserve these jobs. To this end, the Government of Quebec is in the process of undertaking an RFP for 800 MW of new wind capacity for projects to be delivered from 2015. New projects awarded in this tender, combined with the c.300 MW of wind capacity contracted in the previous tender in 2009, are creating significant new investment opportunities.
While there may not be any immediate investment or M&A opportunities, developers and investors are also
closely monitoring the potential for wind energy in Alberta and British Columbia. In Alberta, significant load growth and retirements of coal-fired power plants is creating a need for new capacity. Given that Alberta has a subsidy-free merchant power market, where power projects generate revenues through selling at prices determined by market forces, this capacity shortfall is currently being plugged by low cost natural gas-fired plants.
However, this year the province is set to bolster its Specified Gas Emitters Regulation in a way that should incentivize large carbon emitters to invest in wind for their offset potential. In addition, the government of Alberta has committed to establish a renewable energy framework to encourage investment. If adequate subsidies are established, Alberta could represent an attractive market for wind investment.
“Alberta could be an attractive market because the fundamentals are strong,” continued Gabriel Alonso. “Energy demand is growing very fast and they want to reduce their carbon footprint. If they want to meet energy demand through wind they will have to encourage long-term contracts. Hedging is very complicated in Alberta because the on-peak off-peak price spread is so high.”
In British Columbia, there could also be significant potential for wind energy due to the series of planned LNG terminals due to come online in the next decade. Five LNG terminals are currently in the planning stages, each of which will require around 500 MW of new capacity. It is not clear which generation source planners will favor, although wind is expected to play a role given the province’s target to cut greenhouse gas emissions by 33 percent from 2007 levels by 2020 and 80 percent by 2050.
In which geographies is your company seeking to invest and/or acquire in the renewable energy sector during the next 18 months? (Global survey respondents)
Source: Clean Energy Pipeline
USA
44%
Canada Germany
Middle East
Japan Central &Eastern Europe
China Australasia
Italy
SoutheastAsia
UK
28%
19%
16%
11% 9% 9% 9%
14%
19% 16%
21%
Africa
India Mexico Chile France
Brazil Spain Korea
14% 14% 14% 13%
9% 7% 4%
Green Energy 2014 | 17

About the research
kpmgglobalenergyinstitute.comThe information contained herein is of a general nature and is not intended to address the circumstances of any particular individual or entity. Although we endeavor to provide accurate and timely information, there can be no guarantee that such information is accurate as of the date it is received or that it will continue to be accurate in the future. No one should act on such information without appropriate professional advice after a thorough examination of the particular situation.
The KPMG name, logo and “cutting through complexity” are registered trademarks or trademarks of KPMG International.
© 2005-2014 Clean Energy Pipeline, a division of VB/Research Ltd.
John GimiglianoPrincipal, Tax KPMG
T: +1 202 533 4022E: [email protected]
Shez BandukwalaManaging Director, Corporate Finance KPMG
T: +1 312 665 1067E: [email protected]
This report provides insight into mergers and acquisitions (M&A) activity in the renewable energy sector in the U nited States and Canada. The findings are based on a survey of over 800 senior executives in the renewable energy industry worldwide. Survey respondents include corporates, investors, service providers, debt providers, and governments.
The report was written in collaboration with Clean Energy Pipeline, a specialist provider of research, news and data on the clean energy sector worldwide. Investment statistics in this report have been extracted directly from Clean Energy Pipeline’s transaction databases. Clean Energy Pipeline is a division of VB/Research.
The report was completed between April and May 2014. To supplement the survey results, interviews were conducted with the following individuals:
• John Breckenridge, managing director – Clean Energy and Infrastructure, Capital Dynamics
• Gabriel Alonso, CEO, EDP Renewables North America
• James Spencer, CEO, EverPower
• Craig Carson, U.S. CEO, Infigen Energy
• Arno Harris, CEO, Recurrent Energy
• Paul Walker, CFO, Renewable Energy Systems Americas (RES Americas)
• Brad Nordholm, CEO, Starwood Energy Group
• Matthew Brown, managing director and founding principal, Tamra-Tacoma Capital Partners


