15
STATE OF KNOWLEDGE AND SUSTAINABILITY ISSUES SOLAR POWER A RENEWABLE ENERGY OPTION

STATE OF KNOWLEDGE AND SUSTAINABILITY ISSUES
SOLAR POWER
A RENEWABLE ENERGY OPTION

The Energy of the Sun
Intermittent sunshine
The amount of sunshine varies significantly depending on the time of day, weather and season, a fact that has a direct effect on solar power generation.
[ Day/night variation is predictable. On a clear day, the intensity of sunlight drops from a maximum of roughly 1,000 W/m² around noon to virtually 0 W/m² once the sun has set.
[ Cloud cover is fairly unpredictable. Clouds reduce the amount of sunshine, thus decreasing the amount of power that can be generated. The decrease can last anywhere from a few seconds (on partly cloudy days) to several days (during extended cloudy periods).
[ Seasonal fluctuation is predictable. Around the world, day-to-day sunlight varies greatly by season. In southern Québec, the mean daily amount of sunlight climbs by 50% from December to June—and even more farther north.
Cover: Ground-based photovoltaic panels
Opposite: Ground-based photovoltaic panels; Rooftop photovoltaic panels
STATE OF KNOWLEDGE
PHOTOVOLTAIC SOLAR
POWER IS ENERGY
FROM SUNLIGHT,
COLLECTED AND
CONVERTED DIRECTLY
INTO ELECTRICITY
BY PHOTOVOLTAIC (PV)
SOLAR PANELS,
OR MODULES.
A RENE WABLE ENERGY OPTION SOL AR POWER: STATE OF KNOWLEDGE AND SUSTAINABIL IT Y ISSUES
2

Mean insolation in Québec
Insolation is the solar radiation that reaches the earth’s sur-face, expressed in kilowatthours per square metre (kWh/m²). In other words, it is the total solar radiation (direct, indirect and diffuse) that reaches one square metre of the Earth’s surface. It is a measurement of the energy value of a location.
In Québec, mean daily insolation for the most heavily populated regions is 4.2 to 5 kWh/m² (Figure 1). It is greater
than in Germany and similar to Japan. Nevertheless, those two countries, along with China and the United States, are the world leaders in PV solar power output.
Mean annual insolation in Québec varies between 1,000 kWh/m² and 1,350 kWh/m², which is comparable to Ontario, but less than Tokyo and Southern California (Table 1).
FIGURE 1. GEOGRAPHIC DISTRIBUTION OF MEAN DAILY INSOLATION* IN QUÉBEC
Source: Natural Resources Canada, 2013.
* Insolation: the amount of incoming direct solar radiation on a unit horizontal surface at a specific level, measured in W/m2.
Mean daily global insolation in MJ/m² (kWh/m²)Tilted south-facing panel
12-15 (3.3-4.2) 15-18 (4.2-5)
TABLE 1. MEAN ANNUAL INSOLATION OF SELECTED LOCATIONS IN QUÉBEC AND AROUND THE WORLD
LOCATION MEAN ANNUAL INSOLATION (kWh/m2)
Montréal 1,350
City of Québec 1,300
Sherbrooke 1,300
Sept-Îles 1,250
Fermont 1,100
Inukjuak 1,150
Toronto 1,400
Ottawa 1,350
Southern California 1,800
Tokyo 1,400
Bordeaux 1,350
Berlin 1,050
Source: Global Solar Atlas, 2016.
A RENE WABLE ENERGY OPTION SOL AR POWER: STATE OF KNOWLEDGE AND SUSTAINABIL IT Y ISSUES
3
Solar Power Generation
Around the world
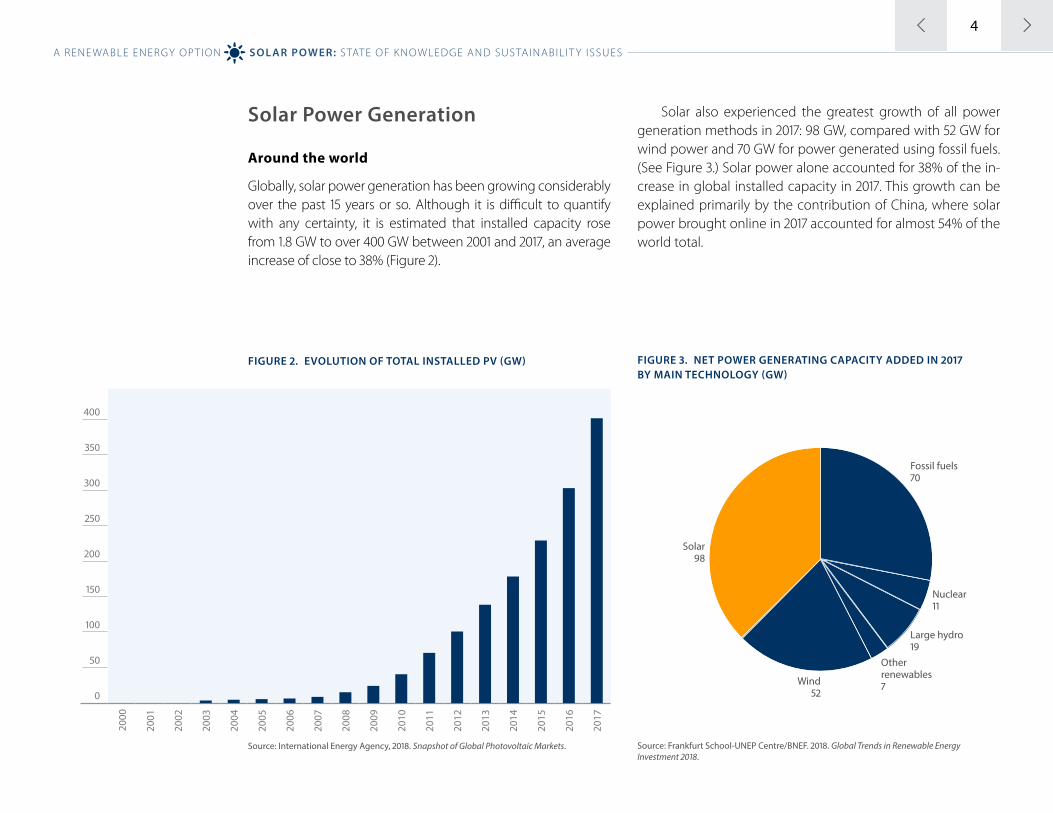
Globally, solar power generation has been growing considerably over the past 15 years or so. Although it is difficult to quantify with any certainty, it is estimated that installed capacity rose from 1.8 GW to over 400 GW between 2001 and 2017, an average increase of close to 38% (Figure 2).
FIGURE 2. EVOLUTION OF TOTAL INSTALLED PV (GW)
400
350
300
250
200
150
100
50
0
2000
2001
2002
2003
2004
2005
2006
2007
2008
2009
2010
2011
2012
2013
2014
2015
2016
2017
Source: International Energy Agency, 2018. Snapshot of Global Photovoltaic Markets.
Solar also experienced the greatest growth of all power generation methods in 2017: 98 GW, compared with 52 GW for wind power and 70 GW for power generated using fossil fuels. (See Figure 3.) Solar power alone accounted for 38% of the in-crease in global installed capacity in 2017. This growth can be explained primarily by the contribution of China, where solar power brought online in 2017 accounted for almost 54% of the world total.
FIGURE 3. NET POWER GENERATING CAPACITY ADDED IN 2017 BY MAIN TECHNOLOGY (GW)
Wind 52
Solar 98
Fossil fuels 70
Nuclear 11
Large hydro 19
Other renewables 7
Source: Frankfurt School-UNEP Centre/BNEF. 2018. Global Trends in Renewable Energy Investment 2018.
A RENE WABLE ENERGY OPTION SOL AR POWER: STATE OF KNOWLEDGE AND SUSTAINABIL IT Y ISSUES
4

Solar power therefore plays an important role in the development of the power industry. Overall, nearly 500 TWh were generated in 2017 by PV systems installed and commissioned that same year, which represents over 2.1% of the planet’s electricity demand. In some countries, the PV contribution to electricity demand was even higher: 10.3% in Honduras, 8.7% in Italy, 7.6% in Greece, 7.0% in Germany and 5.7% in Japan.
According to data on installed solar capacity as at December 31, 2017,1 China led with 131 GW, trailed by the U.S.A. (51 GW), Japan (49 GW) and Germany (42 GW) (Table 2). Next, and much farther behind, came Italy (19.7 GW), India (18 GW) and the United Kingdom (13 GW). For all other solar-generating countries, the figure was below 10 GW: 8.0 GW in France, 7.2 GW in Australia, 5.6 GW in Spain and South Korea, and 2.9 GW in Canada, to name but a few. Most Canadian facilities (99%) are concentrated in Ontario, because of policies implemented there in recent years.
1. Actual output data may vary, due to differences in irradiance between countries and the characteristics of the PV power stations considered.
TABLE 2. ANNUAL AND CUMULATIVE INSTALLED PV POWER, DECEMBER 2017
COUNTRY ANNUAL INSTALLED CAPACITY (GW)
CUMULATIVE INSTALLED CAPACITY (GW)
China 53.00 131.00
India 9.10 18.00
U.S.A. 7.40 51.00
Japan 7.00 49.00
Turkey 2.60 3.40
Germany 1.80 42.00
Australia 1.30 7.20
South Korea 1.20 5.60
Brazil 0.99 1.10
UK 0.95 13.00
France 0.88 8.00
Netherlands 0.85 2.90
Chile 0.67 1.80
Italy 0.41 19.70
Belgium 0.28 3.80
Switzerland 0.26 1.90
Thailand 0.22 2.70
Canada 0.21 2.90
Austria 0.15 1.25
Mexico 0.15 0.54
Sweden 0.09 0.30
Israel 0.06 1.10
Denmark 0.06 0.91
Portugal 0.06 0.58
Malaysia 0.05 0.39
Finland 0.02 0.06
Spain 0.15 5.60
Norway 0.02 0.05
South Africa 0.01 1.80
A RENE WABLE ENERGY OPTION SOL AR POWER: STATE OF KNOWLEDGE AND SUSTAINABIL IT Y ISSUES
5

In Québec
Although not very widespread, decentralized solar power generation (grid-connected individuals and companies) actually does exist in Québec. In June 2018, there were 515 solar customer-generators signed up for Hydro-Québec’s net metering option, and that does not include unconnected self-generators (cottages or off-grid systems).
Conventional utility-scale generation (solar farms con-nected to Hydro-Québec’s transmission system) is gradual-ly taking shape. The Québec government’s energy policy action plan includes a solar power development project. So Hydro-Québec will be able to propose a diversified portfolio of projects that will vary with evolving needs and take into account the energy context.
Solar Power Generation Method
Photovoltaic solar power
[ Autonomous photovoltaic device – Used to supply elec-tricity to low-power systems for applications such as op-tical signaling, battery recharging and satellite powering.
[ Building-integrated systems, whether connected to a power system or not – Used to provide electricity for buildings. Customer-generators can meet their own power needs and sell any surplus.
[ Grid-connected power stations or farms – Used to supply the grid by directly injecting power generated by hundreds of PV panels.
Passive solar – The building’s orientation and its window place-ment and size, along with floors made of materials that provide thermal mass, thermal walls and electrochromic windows, are designed to take maximum advantage of incoming solar energy to assist in heating and cooling.
Solar thermal – A heat transfer fluid and glazed, unglazed or vacuum tube collectors or other collector materials convert sunlight into heat. Frequent applications include water heaters and pool heaters.
Concentrating solar power (CSP) stations – A concentrator, or solar collector, uses reflectors in a variety of shapes (flat plates, cylindrical or parabolic dishes) to focus direct radiation onto a receiver surface at the focal point and heat a fluid to a high temperature. Depending on the degree of concentration, focal point temperatures can reach anywhere from 350°C to over 1,000°C. That heat is used to drive a steam turbine and generate electricity. This technology is most often used in desert regions.
A RENE WABLE ENERGY OPTION SOL AR POWER: STATE OF KNOWLEDGE AND SUSTAINABIL IT Y ISSUES
6

Power Stations and Systems
Components
A photovoltaic solar power plant consists of two subsets of components: PV equipment and basic equipment common to other kinds of generating stations (Figure 4).
FIGURE 4. DIAGRAM OF PV SOLAR POWER PLANT
These are the main photovoltaic components:
[ Solar panels – Consist of dozens of PV cells arranged in glass-covered panels, which convert sunlight into electric-ity. A solar power plant consists of many interconnected panels that generate the voltage required, depending on the inverters selected.
[ Inverters – Convert the direct current (DC) produced by the panels to alternating current (AC) so it can be fed into the grid.
[ Mounting structures – Support the panels. With fixed structures, the panels are always at the same angle to the horizon. With pivoting platforms, the angle can be changed, either manually or automatically, using a mechanical system to track the position of the sun (east-west or north-south).
This equipment is found in most generating stations and is needed for solar power generation, as well:
[ Low-voltage collector system and switchyard, which in-cludes a control and protection system, metering system and system to transform low voltage to high voltage to be fed into the grid.
Transmission systemRadiation
PV solar panels
Direct current Alternating current
Meter
Low voltage/High voltage transformer
AC-DC inverters
Control panels
A RENE WABLE ENERGY OPTION SOL AR POWER: STATE OF KNOWLEDGE AND SUSTAINABIL IT Y ISSUES
7

Smaller than a solar farm, a decentralized, distributed or home PV system consists of an array of cells arranged in panels that are connected in series, in parallel or by both methods (Figure 5). More precisely, the system consists of the following components:
[ One or more PV panels
[ An inverter to convert the direct current (DC) produced by the panels to alternating current (AC) so it can be used in the home
[ One meter to measure output and another to measure the amount of electricity used from both the public and decentralized systems.
Types of photovoltaic cells
PV cells use the photovoltaic effect to convert sunlight directly into electricity (Figure 6).
There are three types of PV cells:
[ Crystalline silicon – Thin slices cut from a silicon crystal (in the case of monocrystalline silicon), a block of silicon crystals (polycrystalline silicon) or ribbon silicon. Their manufacture requires a significant amount of energy and raw materials.
[ Thin-film – Thin layers of a photosensitive material laid on a substrate of glass, stainless steel or plastic. The main materials used are amorphous silicon, cadmium telluride (CdTe), and copper indium diselenide (CIS) or copper indium gallium selenium (CIGS). Their manufacture makes a lesser use of energy and raw materials. Multijunction cells, which are made of several thin layers, are the most efficient.
FIGURE 5. DIAGRAM OF DECENTRALIZED PV SYSTEM COMPONENTS
Photovoltaic panels
Alternating current
Direct current
Inverter Production meter
Consumption meter
Domestic use
Public utility system
FIGURE 6. PHOTOVOLTAIC EFFECT
+ ++ +
The photovoltaic effect is the direct conversion of photons (sunlight) into electric current by means of a semiconducting material.
Negative electrode (front contact)
Positive electrode (rear contact)
Silicon
Silicon
ELECTRICITY GENERATION
Boundary layer
A RENE WABLE ENERGY OPTION SOL AR POWER: STATE OF KNOWLEDGE AND SUSTAINABIL IT Y ISSUES
8

[ Organic cells – Created by depositing a thin layer of an organic semiconductor on a thin plastic substrate, something like light, flexible camera film. There are three types of organic solar cells: those based on organic crystal semiconductors, those based on organic polymer semiconductors, and hybrids. Their manufacture requires very little in the way of energy and raw material.
Almost all cells on the market are either crystalline silicon (first generation) or thin-film (second generation), but crystalline silicon cells dominate thanks to their commercial availability, relatively high efficiency and low cost. Silicon-based cells accounted for about 94% of global PV cell production in 2016 and 93% in 2015. Over the past decade, the mean efficiency of crystalline silicon solar panels has risen by some 12%, to between 17% and 20%. In the lab, they may be up to 24.4% efficient.
At the same time, the supply of thin-film cells has been considerably consolidated in recent years, and it seems to be on the increase. This type of cell offers some advantages in certain operating conditions and is increasingly competitive. For that reason, these cells are likely to continue to play an important role in the range of products offered.
Organic PV cells (third generation) are still in the R&D stage. In 2017, they were estimated to be about 12% efficient.
Hybrid perovskite cells, while still in development, are considered to be highly promising. They are similar to thin-film cells, but are made of methylammonium lead iodides. Efficiencies of about 22% have been achieved in the lab.
Multijunction PV cells are more than 40% efficient, but the manufacturing costs are too high for utility-scale production. They may, however, be used with an optical concentrator. An optical concentrator uses a lens or mirrors to focus sunlight on photovoltaic cells placed inside a collector. In this way, the same amount of power is generated with fewer cells.
It is worth noting that all PV cells on the market are more effective in cooler temperatures. So with equal insolation, a PV system may be up to 30% more efficient in winter than in summer.
Grid
Photovoltaic systems may or may not be connected to a power grid.
Grid-connected systems
[ Systems connected to a building that uses electricity
[ Systems integrated into a structure that is connected to a power grid or another electrical system (e.g., a roof over a public walkway or a sound barrier)
[ Systems composed of an array of cells arranged in ground-mounted panels connected in series, in parallel or by both methods. These systems can cover thousands or tens of thousands of square metres. Such generating systems feed power into power grids.
Off-grid systems
[ Artificial satellites, portable electronics, small devices like calculators and watches, road signs, highway emergency telephones, parking permit dispensers, telecommunications links, shipping and air traffic beacons and isolated sites (electrification)
A RENE WABLE ENERGY OPTION SOL AR POWER: STATE OF KNOWLEDGE AND SUSTAINABIL IT Y ISSUES
9
Capacity factor and production profile
The capacity factor of a photovoltaic installation is the ratio of its annual electrical energy output to its maximum possible electrical energy output over that period. This factor varies from one region to another, depending on the amount of sunlight. For instance, it is about 15% in Canada and 25% to 30% in the sunniest parts of the United States.
The production profile usually shows a peak in the middle of the day and a monthly increase in summer. In Québec, unlike California, for instance, the solar capacity factor doesn’t match the demand profile.
Efficiency
The efficiency of photovoltaic systems depends primarily on insolation (amount of sunlight available on the ground) and the conversion efficiency of the technology being used.
Insolation is affected mainly by the sun’s position (distance and inclination) and cloud cover, or cloudiness, which depends on the season. The reflectance of the surrounding surface, or albedo, also affects insolation. The greater the reflectance, the more indirect sunlight is captured by PV panels. For example, snow is one of the most highly reflective surfaces.
A PV system’s efficiency also depends on atmospheric conditions, including temperature, humidity, precipitation and pollution levels. So with equal insolation, a PV system is more efficient in a cool environment (low ambient temperature, wind or cooling system) than hot. Accordingly, a 10°C drop in temperature translates into a 3% to 7% increase in energy output.
In given atmospheric and environmental conditions, a facility’s performance will therefore depend on the technical specifications of the PV panels and their angle to the ground.
Changing costs
Solar panels
Since 1990, the mean cost of PV panels has been in constant decline, except for a brief period in the early 2000s. The increase in costs observed between 2004 and 2008 is the result of a global shortage of crystalline silicon, which has since been replaced by a type of silicon developed specifically for the industry. Between 2009 and 2017, production of solar panels continued to increase and the price declined steadily.
Between 2010 and 2016, the cost of PV panels dropped by about 80%. In 2016, the mean retail price in China was US$0.43/W, but was among the highest in California, where it rose to US$0.61/W. In 2017, prices fell a little more: good quality panels could be sustainably made for US$0.40/W or less. Together, China and Japan produced about 70% of all the PV panels in the world in 2015 and 2016.
Conventional PV system production
Between 2010 and 2017, based on the mean weighted cost of components, the total cost of installing a utility-scale PV system dropped by 68%, with a 10% decline from 2016 to 2017.
The rapid decrease in costs in China, Japan and the United States is the chief factor making solar technology increasingly competitive. In the period from 2010 to 2017, the total costs of setting up a PV solar farm dropped by over 70% in many countries. The smallest decline in that period was in the United States (52%).
So in 2016, the price for peak power (expressed as kilowatt peak, or kWp) of utility-scale PV systems was about US$660/kWp in Germany, US$1,005/kWp in China and US$1,500/kWp in the United States and Canada.
A RENE WABLE ENERGY OPTION SOL AR POWER: STATE OF KNOWLEDGE AND SUSTAINABIL IT Y ISSUES
10

System prices continued to decrease in 2016 and 2017 thanks to a drop in the price of panels, accessory costs and marginal costs. Prices below US$1,000/kWp for utility-scale PV systems are now common in very competitive RFPs.
Distributed PV systems (residential)
The total costs of installing a home PV system have also dropped dramatically in many countries since 2010. In Germany, Japan and the United States, costs oscillated between US$6,700/kW and US$11,100/kW in 2007. A decade later, they ranged between US$1,050/kW and US$4,550/kW, a 47% to 78% drop. Costs are still the highest in California: in the first quarter of 2017, they were US$4,550/kW, twice as high as in Germany and three times as high as in India.
What about Québec?
In 2018, installing a home PV system cost between C$2,500/kW and C$3,250/kW, or about C$3,000/kW on average.
In December of the same year, the National Energy Board (NEB) published a report on the financial viability of typical solar power projects in Canada entitled The Economics of Solar Power in Canada.
The competitiveness of solar power generation in a given province generally depends more on local electricity prices than on the amount of sunlight received there.
In its report, the NEB presented the average return on a residential solar power system based on the cost of electric-ity in Canadian provinces and territories using three scenarios: today (2018), in the near future (2023) and in a low-cost future (2028). The three scenarios are based on solar installation costs falling over time, and continuing to fall for several years to come. Consequently, the breakeven point—meaning the price at which system owners save enough on electricity to recover their costs—will also continue to fall.
However, residential solar systems are not cost-effect-ive in Québec or Manitoba due primarily to the low price of electricity, even under the low-cost future (2028) scenario.
Nevertheless, the decision to install a residential, commer-cial or community system is not only motivated by the savings such a project would generate. Other reasons may also come into play, particularly environmental factors. In this case, the system’s breakeven point would be lower than the figure indi-cated in the NEB report, although it may not be a good indica-tor of the savings achieved by the owner.
A RENE WABLE ENERGY OPTION SOL AR POWER: STATE OF KNOWLEDGE AND SUSTAINABIL IT Y ISSUES
11
The main environmental issues associated with solar power are discussed below.
Greenhouse Gas Emissions
Greenhouse gas emissions and air pollution are associated with the manufacture and installation of solar panels, but PV systems generate no GHG emissions in normal operation. Those attributable to manufacturing depend largely on the source of energy used in the region where the components are manufactured. The same applies to GHG emissions associated with system installation: they vary depending on the equipment used at this stage.
Life Cycle Assessment
In the life cycle approach, the main environmental impacts of photovoltaic solar power are estimated to be slightly greater than for hydroelectricity and other renewable energy sources. System service life, sunlight conditions and the manufacture of panels in countries where most electricity is generated by burning fossil fuels are the most important factors in the life cycle analysis for this power option.
For more information on the subject, please see these reports. (Full reports available in French only.)
[ Comparing power generation options and electricity mixes
[ Small-scale distributed electric power generation
Ecosystems and Biodiversity
The installation of a ground-mounted photovoltaic solar farm could have various impacts on the natural environment: ero-sion, small changes to vegetation cover, habitat fragmentation for certain species, etc. In arid regions, the installation of solar panels may necessitate major changes to the landscape, such as clearing vegetation, grading and compacting soil, and building access roads, which increase soil erosion by wind and water.
PV power stations in built-up areas generally have little direct impact on biodiversity. The main risk is to local wildlife, particularly any animals displaced by the erection of a fence on sometimes extensive lands. Large projects should provide for fence openings and wildlife corridors. The benefits of PV pro-jects in arid regions include creating shade for small animals, limiting invasive species populations and reducing disturb-ances caused by off-road vehicles.
Like any industrial infrastructure, solar power systems and farms may have an impact on birds and insects. Bird deaths due to by photovoltaic infrastructure appear to be very lim-ited, much fewer than those caused by any other type of infra-structure.
In the case of PV panels, birds are killed by flying into struc-tures. For concentrating solar power stations in desert areas, deaths are due to burns caused by exposure to concentrated sunlight. One of the few studies on the subject estimates that the bird mortality rate in California is about 10 deaths per in-stalled megawatt per year, much lower than what has been observed for other types of infrastructure (buildings, thermal generating stations and so on). In that study, bird mortality was
SUSTAINABILITY ISSUES
A RENE WABLE ENERGY OPTION SOL AR POWER: STATE OF KNOWLEDGE AND SUSTAINABIL IT Y ISSUES
12

within the low range of estimated mortality for utility-scale wind farms.
The idea that aquatic birds could confuse solar panels with bodies of water appears to be unfounded. A study carried out in Germany at a solar farm next to an immense Rhine-Main-Danube canal holding basin was inconclusive in this regard.
Cleaning panels for normal operation of a PV system uses a minimal volume of water, 15 L/MWh. But much more water is needed to wash solar panels in desert regions, where dust can reduce panel efficiency. This type of cleaning is not necessary in Canada. Solar technology uses much less water than thermal power stations (1,140 L/MWh) or nuclear power stations (1,500 L/MWh), both of which require water for cooling. Concentrating solar power plants may use more water than coal- or gas-fired generating stations if they are cooled by water rather than air. This technology is not used in Canada.
Health and Quality of Life
Some compounds used in manufacturing photovoltaic sys-tems, such as cadmium telluride, are a concern due to their toxicity. However, only small quantities are used in the manu-facturing process, and they are not released into the atmos-phere during system operations. In the United States, cadmium emissions associated with solar power are 150 times lower than those associated with coal-fired generation. Moreover, once PV cells have reached the end of their useful life, the metals can be recycled. However, there are few recovery sites to date.
In nonelectrified areas, the use of solar power improves quality of life. For instance, it can be used to provide lighting or access to information (radio, TV and cellular telephony), which can help improve literacy rates. In addition, the use of solar-powered devices like stoves is beneficial for human health, as opposed to burning wood or oil indoors, which pollutes the air.
Land Use
Although a photovoltaic solar farm occupies a greater area than a wind farm, its visual impact is smaller. Here’s why:
[ Its horizontal structure is only a few metres high, making it unobtrusive, even for nearby observers.
[ Its colors are neutral, ranging from medium blue to dark gray.
[ It stays still or moves only a little (if it tracks the sun). There are no moving parts to draw an observer’s eye and attention.
The ground area needed for solar panels is about 2 to 3 ha (about 6 acres) per MW (DC) for fixed support structures and about double that for rotating platforms. PV systems gener-ate the most energy per unit of surface area of all renewable sources, including wind energy, hydropower and biomass, making them an efficient use of land.
Interestingly, a photovoltaic solar farm takes up no more space than a coal-fired generating station in the United States. In fact, over the entire lifetime of a coal station (25 years), both generation and transportation take up a great deal of space, mainly because 70% of the coal used in American coal-burning power plants comes from open-pit mines.
A building-integrated PV system may have an impact on the landscape, but less so than a ground-mounted system. Rooftop panels do not require any ground of their own.
In the United States and other countries with limited land, combining solar power with other energy sources (like hydro, wind, biomass, fuel) may be worthwhile. Optimization methods for solar-wind systems are being used in several parts of the world.
As photovoltaic systems can be located on a wide range of sites—vacant lots, brownfields, adjacent to highways, railways or airports, etc.—there may be land-use conflicts between
A RENE WABLE ENERGY OPTION SOL AR POWER: STATE OF KNOWLEDGE AND SUSTAINABIL IT Y ISSUES
1313
agricultural operators and solar farm operators. But a PV solar farm can be compatible with some agricultural practices, like raising sheep, beekeeping and small-scale vegetable farming.
Since 2015, over 100 floating photovoltaic (FPV) farms have been commissioned around the world, on hydropower reser-voirs, industrial basins, aquaculture ponds and other bodies of water. The benefits of FPV include cheaper output per unit of land, higher output (probably thanks to the cooling effect of the water on the panels) and less water evaporation. Japan leads in the number of FPV farms because it has only limited ground space for PV systems. Others countries also stand out: China, with an installed capacity of about 400 MW, Korea and Brazil, which completed its first FPV farm in 2017.
Regional Economy
Photovoltaic solar power projects demand major investments, but can create jobs and local economic spinoffs during construction, operation and dismantling. Leveraging this
source of power, which can help secure energy supply, will also spur regional development and strengthen energy security. The extra power sold to customers or local distributors is a new source of revenue, and local benefits are maximized if the owner and installer hail from the host community, if the PV system components are manufactured there and if the system maintenance, which is easy and minimal, is performed by locals. It is worth noting that PV solar power creates twice as many jobs per megawatthour as thermal power does.
Social Acceptability
Generally speaking, solar power is well accepted by host com-munities. In short, the environmental impacts on the landscape and wildlife, when effectively managed, are limited. However, this source of energy is still little used in Québec. Taking certain steps—such gaining a better understanding of the potential im-pacts of the various types of PV panels on the market—could contribute to its growth and development.
A RENE WABLE ENERGY OPTION SOL AR POWER: STATE OF KNOWLEDGE AND SUSTAINABIL IT Y ISSUES
14

A RENE WABLE ENERGY OPTION SOL AR POWER: STATE OF KNOWLEDGE AND SUSTAINABIL IT Y ISSUES
15
REFERENCES1. Environment Canada. 2012. Assessment of the environmental performance
of solar photovoltaic technologies. https://www.ec.gc.ca/scitech/B53B14DE-034C-457B-8B2B-39AFCFED04E6/ForContractor_721_Solar_Photovoltaic_Technology_e_09%20FINAL-update%202-s.pdf. Retrieved July 2018.
2. Frankfurt School-UNEP Collaborating Centre and Bloomberg New Energy Finance. 2018. Global trends in renewable energy investment. www.greengrowthknowledge.org/sites/default/files/downloads/resource/Global_Trends_in_Renewable_Energy_Investment_Report_2018.pdf. Retrieved July 2018.
3. Hernandez, R. R., S. B. Easter, M. L. Murphy-Mariscal, F. T. Maestre, M. Tavassoli, E. B. Allen, C. W. Barrows, J. Belnap, R. Ochoa-Hueso, S. Ravi and M. F. Allen. 2014. Environmental impacts of utility-scale solar energy. Renewable and Sustainable Energy Reviews, No. 29, pp. 766-779. https://cloudfront.escholarship.org/dist/prd/content/qt62w112cg/qt62w112cg.pdf?t=o1zpex. Retrieved July 2018.
4. Hernandez, R. R., M. K. Hoffacker and C. B. Field. 2014. Land-use efficiency of big solar. Environmental Science and Technology, No. 48, pp. 1315-1323. https//pubs.acs.org/doi/abs/10.1021/es4043726. Retrieved July 2018.
5. International Energy Agency. 2018. Snapshot of global photovoltaic markets. Report IEA PVPS T1-33:2018. www.iea-pvps.org/fileadmin/dam/public/report/statistics/IEA-PVPS_-_A_Snapshot_of_Global_PV_-_1992-2017.pdf. Retrieved July 2018.
6. International Energy Agency. 2017. Trends 2017 in photovoltaic applications. Report IEA PVPS T1-32:2017. www.iea-pvps.org/fileadmin/dam/public/report/statistics/IEA-PVPS_Trends_2017_in_Photovoltaic_Applications.pdf. Retrieved July 2018.
7. International Renewable Energy Agency. 2016. The power to change: Solar and wind cost reduction potential to 2025. Abu Dhabi: IRENA. www.irena.org/DocumentDownloads/Publications/IRENA_Power_to_Change_2016.pdf. Retrieved July 2018.
8. International Renewable Energy Agency. 2017. Renewable power generation costs in 2017. Abu Dhabi: IRENA. https://www.irena.org/-/media/Files/IRENA/Agency/Publication/2018/Jan/IRENA_2017_Power_Costs_2018.pdf. Retrieved July 2018.
9. Leroy, J. W. Jr., K. E. Rollins, K. E. LaGory, K. P. Smith and S. A. Meyers. 2016. A preliminary assessment of avian mortality at utility-scale solar energy facilities in the United States. Renewable Energy, 92: 405-414. https://www.sciencedirect.com/science/article/pii/S0960148116301422. Retrieved July 2018.
10. Ministère de la Transition écologique et solidaire. 2018. Solaire. https://www.ecologique-solidaire.gouv.fr/solaire. Retrieved July 2018.
11. Ministère de l’Écologie, du Développement durable, des Transports et du Logement et Ministère de l’Économie, des Finances et de l’Industrie. 2011. Installations photovoltaïques au sol: Guide de l’étude d’impact. https://www.ecologique-solidaire.gouv.fr/sites/default/files/Guide_EI_Installations-photovolt-au-sol_DEF_19-04-11.pdf. Retrieved July 2018.
12. Moore-O’Leary, K., R. R. Hernandez, D. S. Johnston, S. R. Abella, K. E. Tanner, A. C. Swanson, J. Kreitler and J. E. Lovich. 2017. Sustainability of utility-scale solar energy – Critical ecological concepts. Frontiers in Ecology of the Environment, 15, No. 7, pp. 385-394. https://onlinelibrary.wiley.com/doi/abs/10.1002/fee.1517%20. Retrieved July 2018.
13. NATIONAL ENERGY BOARD. 2018. The Economics of Solar Power in Canada (online). http://www.one-neb.gc.ca/nrg/sttstc/lctrct/rprt/cnmcsfslrpwr/index-eng.html (January 2019).
14. Natural Resources Canada. 2013. Photovoltaic and solar resource maps. https://www.nrcan.gc.ca/18366. Retrieved July 2018.
15. Renewable Energy Policy Network for the 21st Century. 2017. Renewables 2017 Global Status Report. Paris: REN21 Secretariat. http://www.ren21.net/gsr-2017/. Retrieved July 2018.
16. Renewable Energy Policy Network for the 21st Century. 2018. Renewables 2018 Global Status Report. Paris: REN21 Secretariat. http://www.ren21.net/wp-content/uploads/2018/06/17-8652_GSR2018_FullReport_web_final_.pdf. Retrieved July 2018.
Reproduction authorized with acknowledgement of source
Legal deposit – 1st quarter 2019 Bibliothèque et Archives nationales du Québec ISBN: 978-2-550-83425-0
Original text written in French. Ce document est également publié en français.
2018G429-A


