1 A. Shakouri 7/28/2009 Overview of Renewable Energy Sources Ali Shakouri Baskin School of Engineering University of California Santa Cruz http://quantum.soe.ucsc.edu/ Santa Cruz LoCal-RE Summer Program, Santa Cruz, CA; 28 July 2009
Transcript
1
A. Shakouri 7/28/2009
Overview of Renewable Energy SourcesAli ShakouriBaskin School of EngineeringUniversity of California Santa Cruzhttp://quantum.soe.ucsc.edu/
Santa Cruz
LoCal-RE Summer Program, Santa Cruz, CA; 28 July 2009
2
A. Shakouri 7/28/2009
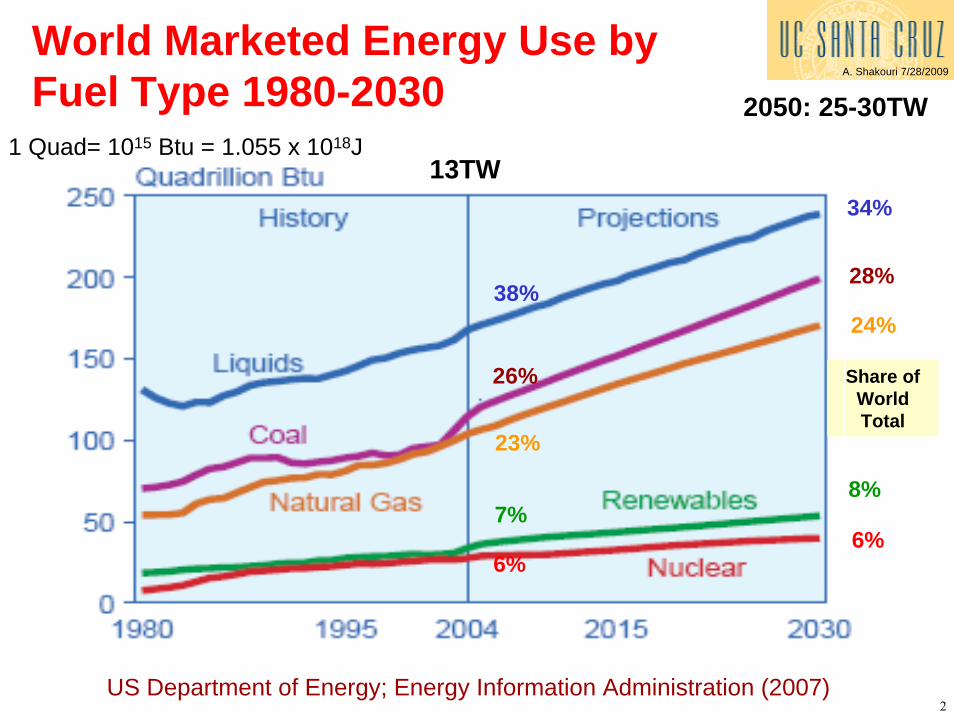
34%
8%
28%
6%
Share of WorldTotal
24%38%
26%
23%
7%
6%
World Marketed Energy Use by Fuel Type 1980-2030
13TW
2050: 25-30TW1 Quad= 1015 Btu = 1.055 x 10¹⁸J
US Department of Energy; Energy Information Administration (2007)
3
A. Shakouri 7/28/2009
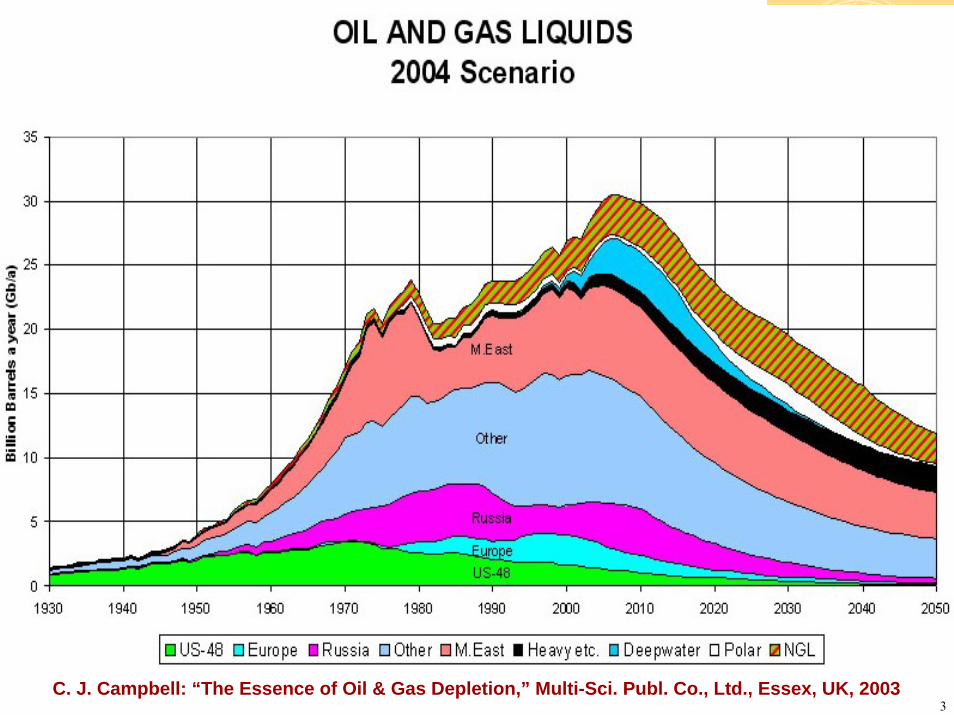
C. J. Campbell: “The Essence of Oil & Gas Depletion,” Multi-Sci. Publ. Co., Ltd., Essex, UK, 2003
4
A. Shakouri 7/28/2009
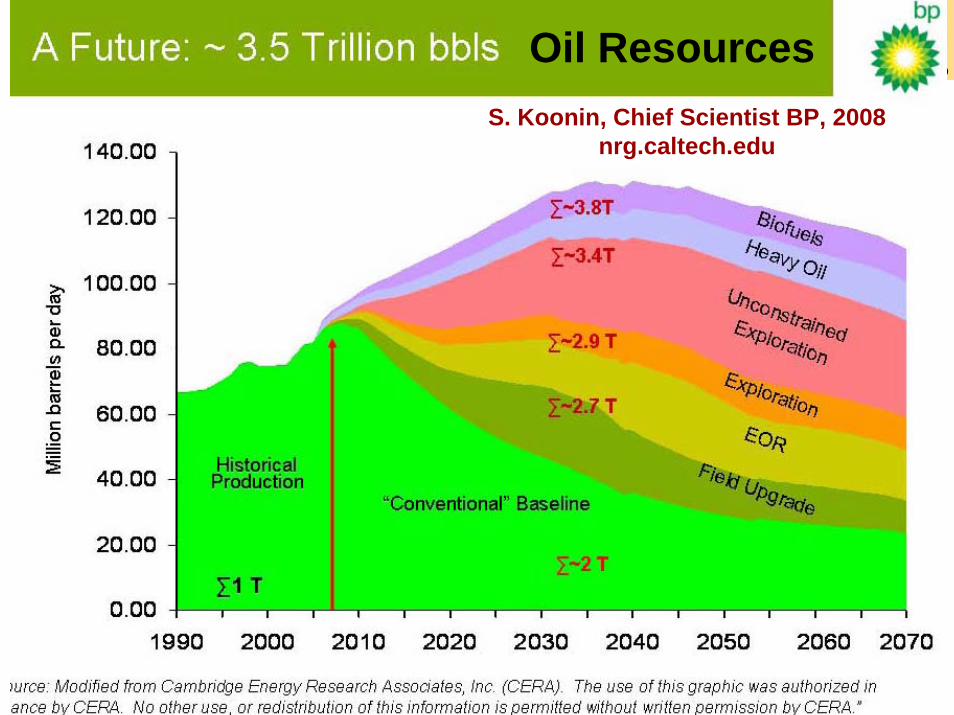
S. Koonin, Chief Scientist BP, 2008nrg.caltech.edu
Oil Resources
5
A. Shakouri 7/28/2009
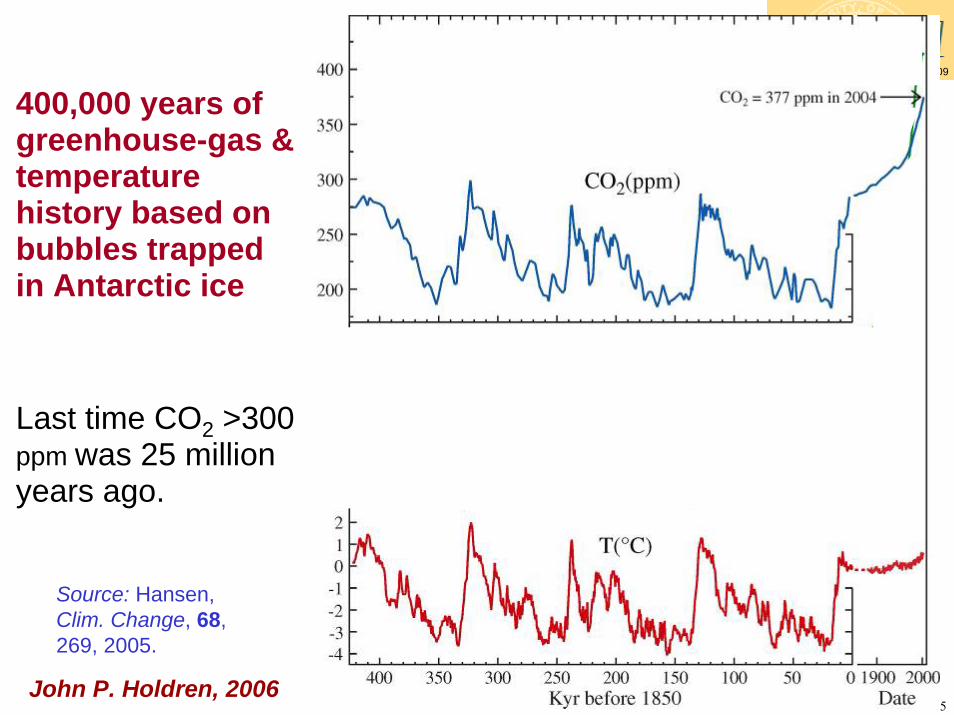
Source: Hansen, Clim. Change, 68, 269, 2005.
400,000 years of greenhouse-gas & temperature history based on bubbles trapped in Antarctic ice
Last time CO2 >300 ppm was 25 million years ago.
John P. Holdren, 2006
6
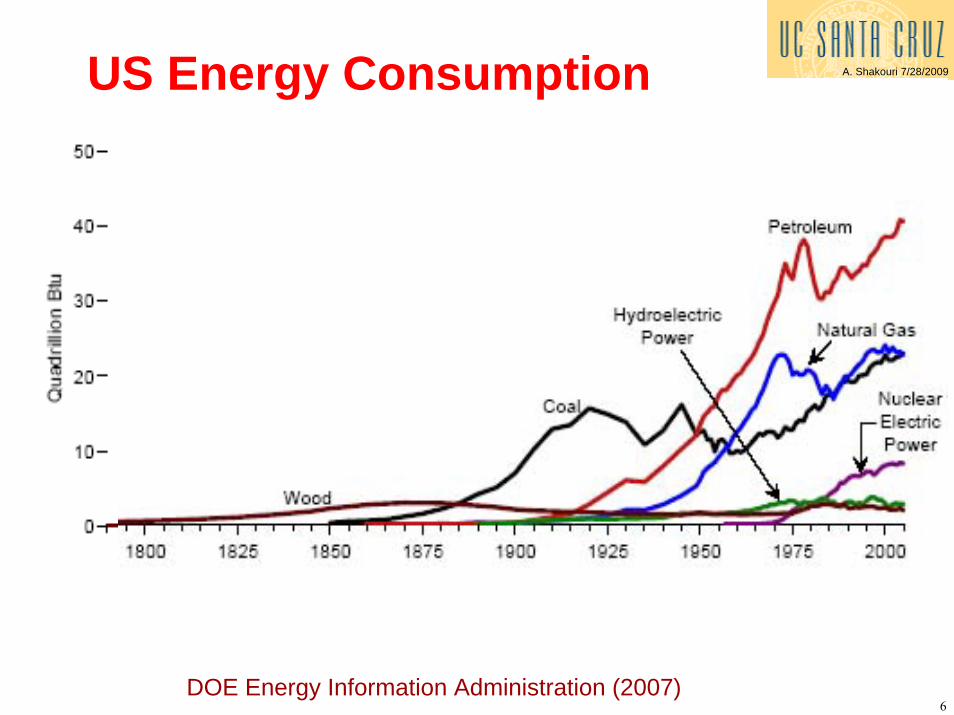
A. Shakouri 7/28/2009US Energy Consumption
DOE Energy Information Administration (2007)
7
A. Shakouri 7/28/2009
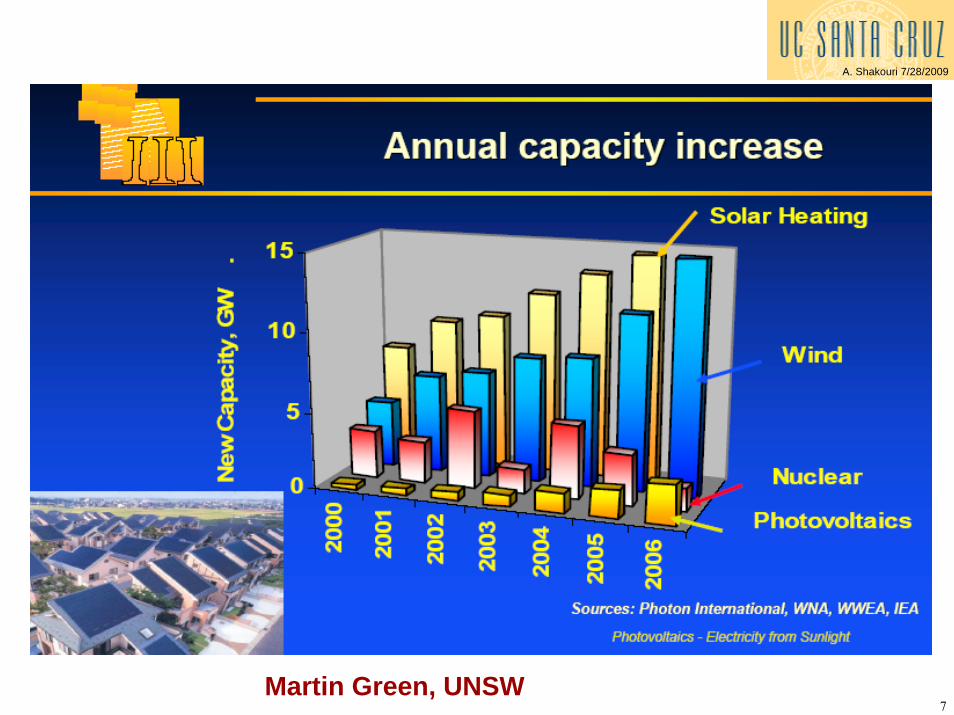
Martin Green, UNSW
8
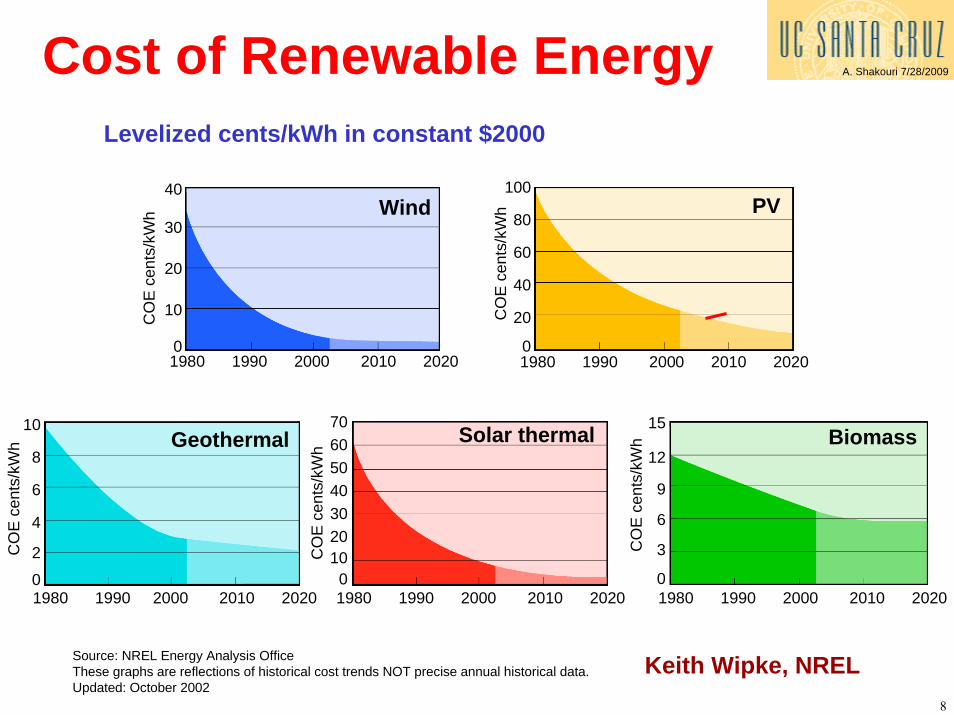
A. Shakouri 7/28/2009Cost of Renewable EnergyLevelized cents/kWh in constant $2000
PV
1980 1990 2000 2010 2020
100
80
60
40
20
0
CO
E c
ents
/kW
hWind
1980 1990 2000 2010 2020
CO
E c
ents
/kW
h
40
30
20
10
0
10
8
6
4
2
0
CO
E c
ents
/kW
h Geothermal
1980 1990 2000 2010 2020
Biomass
1980 1990 2000 2010 2020
15
12
9
6
3
0
CO
E c
ents
/kW
hSolar thermal
1980 1990 2000 2010 2020
706050403020100
CO
E c
ents
/kW
h
Source: NREL Energy Analysis OfficeThese graphs are reflections of historical cost trends NOT precise annual historical data.Updated: October 2002
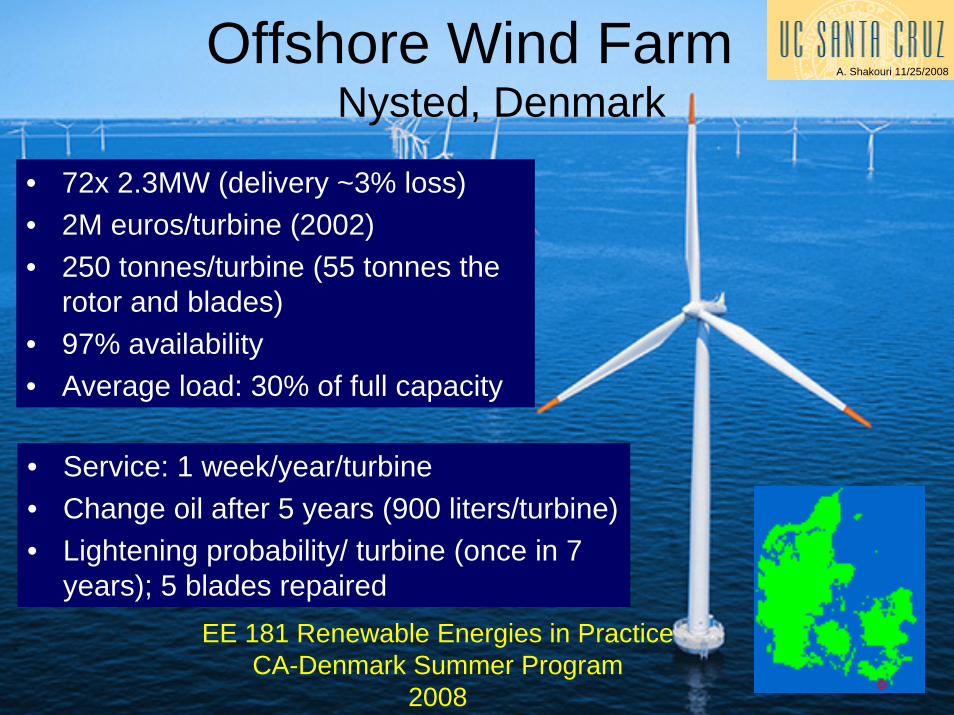
rotor and blades)• 97% availability• Average load: 30% of full capacity
• Service: 1 week/year/turbine• Change oil after 5 years (900 liters/turbine)• Lightening probability/ turbine (once in 7
years); 5 blades repaired
16
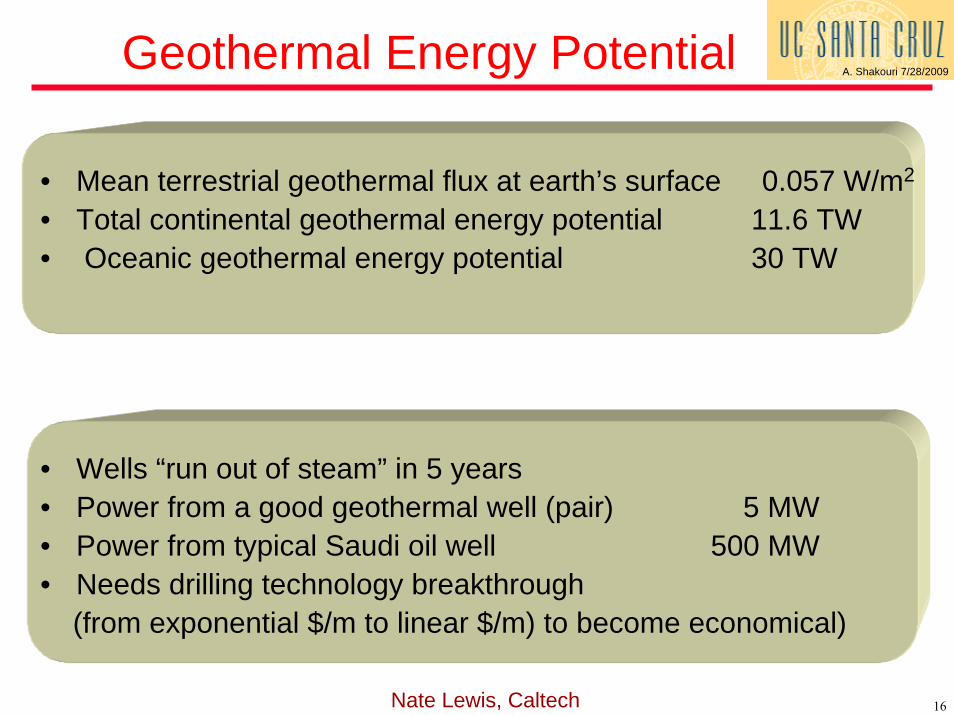
A. Shakouri 7/28/2009Geothermal Energy Potential
• Mean terrestrial geothermal flux at earth’s surface 0.057 W/m2
• Total continental geothermal energy potential 11.6 TW• Oceanic geothermal energy potential 30 TW
• Wells “run out of steam” in 5 years• Power from a good geothermal well (pair) 5 MW• Power from typical Saudi oil well 500 MW• Needs drilling technology breakthrough
(from exponential $/m to linear $/m) to become economical)
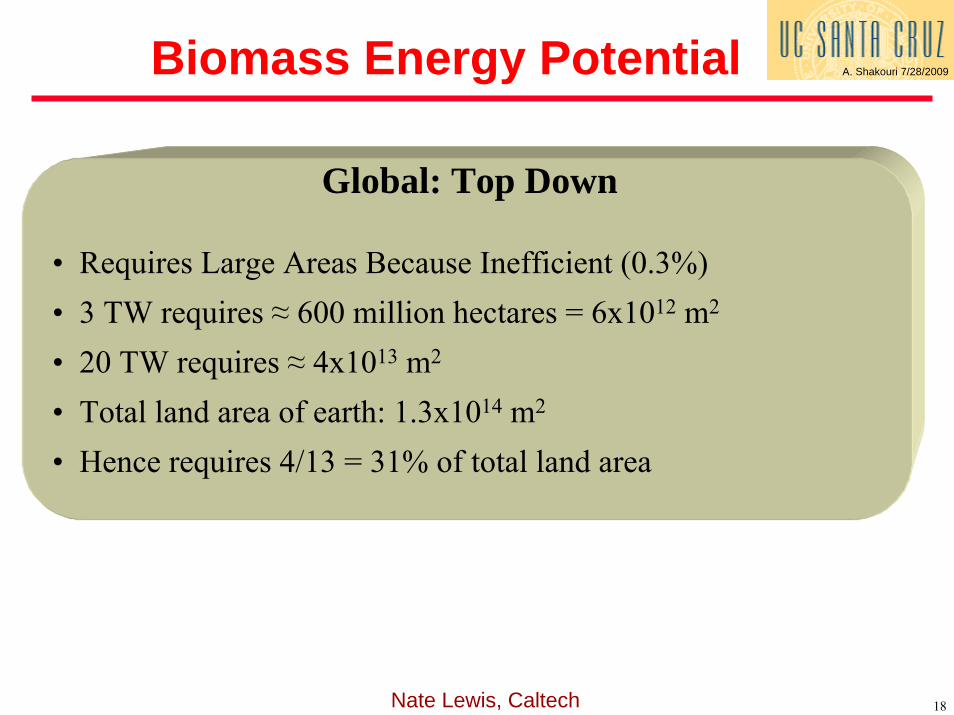
• Requires Large Areas Because Inefficient (0.3%)• 3 TW requires ≈ 600 million hectares = 6x10¹² m2
• 20 TW requires ≈ 4x10¹³ m2
• Total land area of earth: 1.3x10¹⁴ m2
• Hence requires 4/13 = 31% of total land area
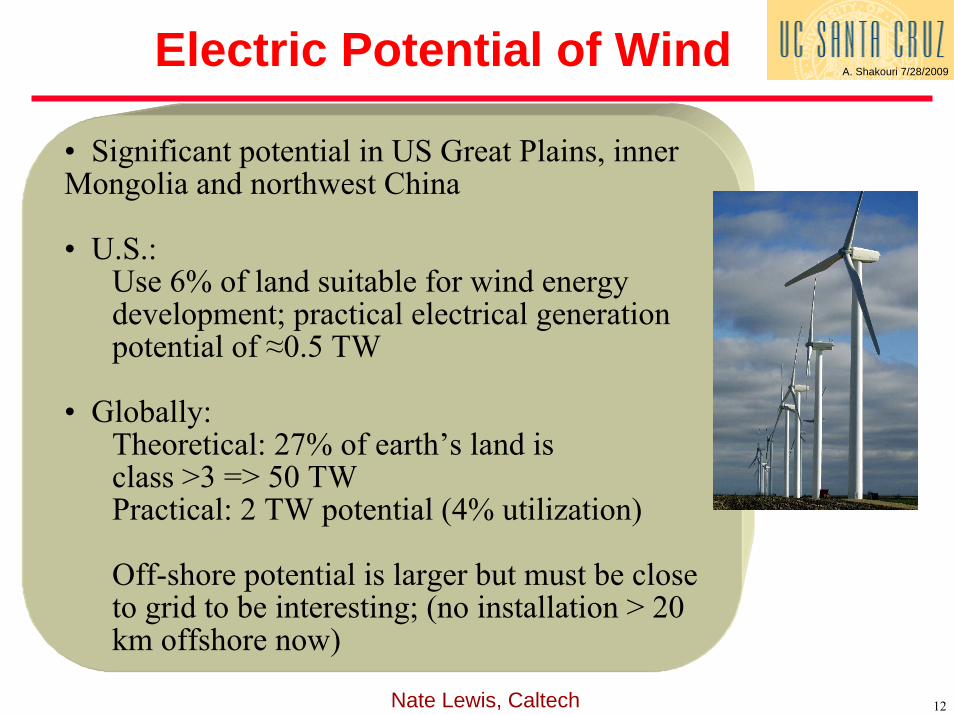
Nate Lewis, Caltech
19
A. Shakouri 7/28/2009
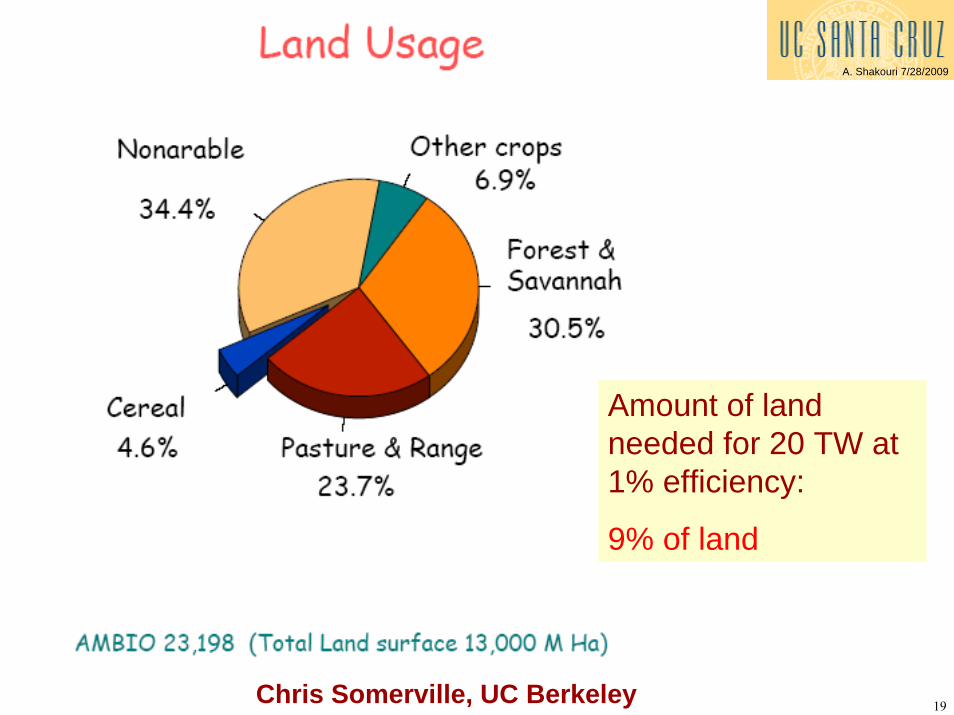
Amount of land needed for 20 TW at 1% efficiency:
9% of land
Chris Somerville, UC Berkeley
20
A. Shakouri 7/28/2009Corn Ethanol Greenhouse Gas Emission
Farrell et al. (Science 311, 2006)
21
A. Shakouri 7/28/2009
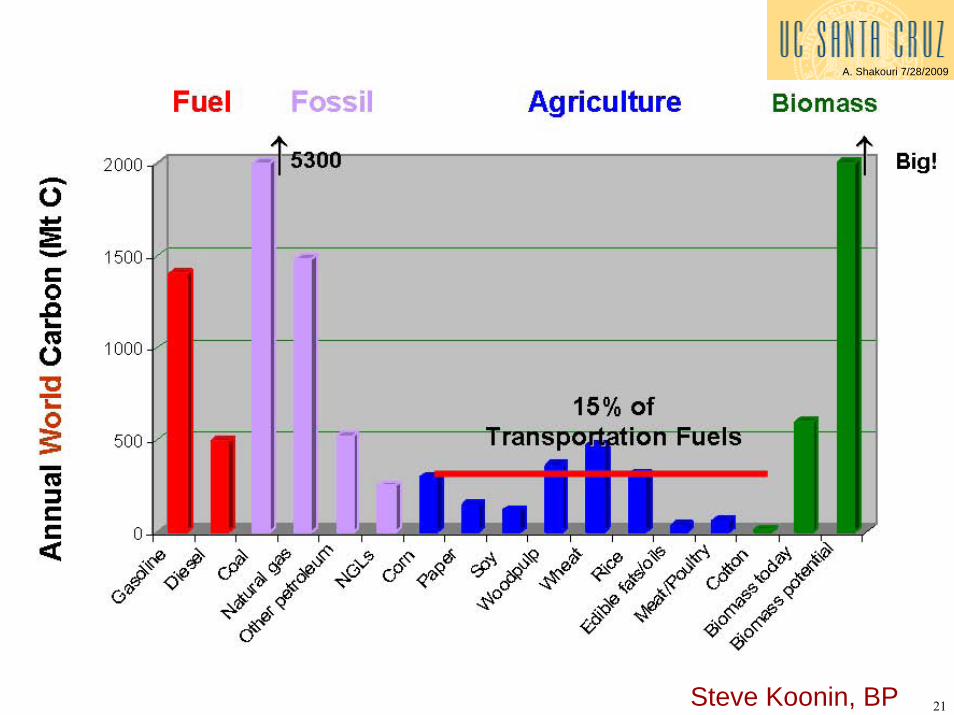
Steve Koonin, BP
22
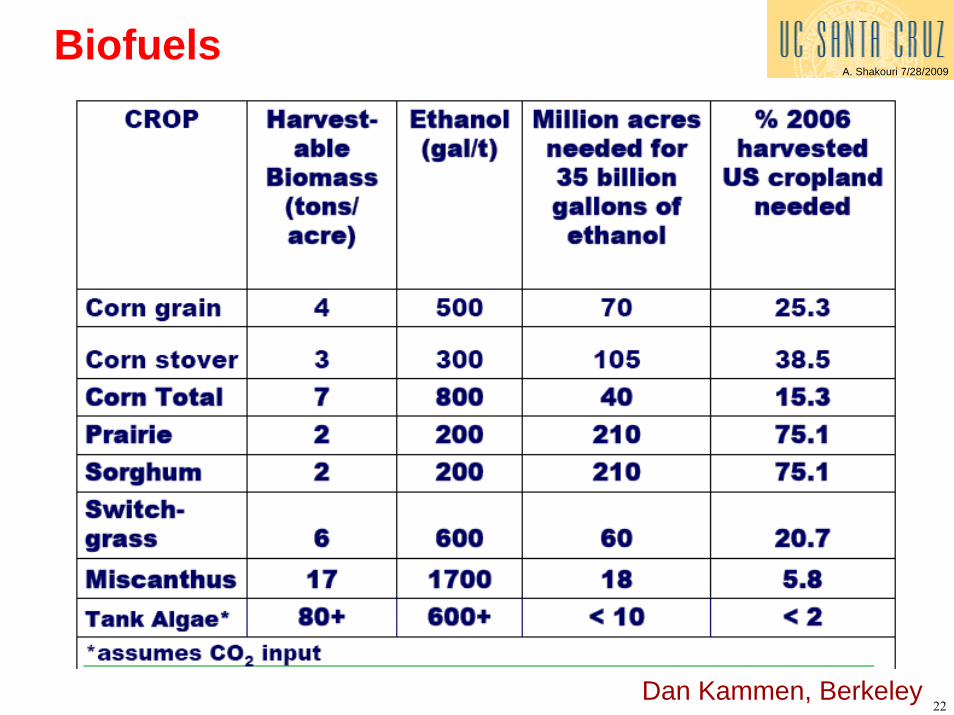
A. Shakouri 7/28/2009Biofuels
Dan Kammen, Berkeley
23
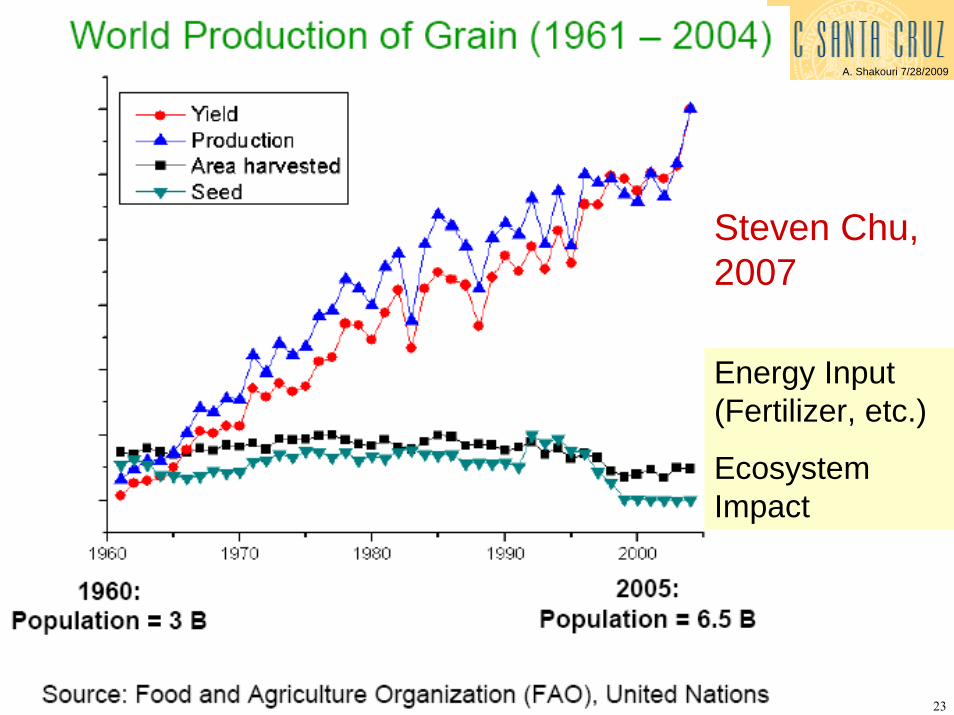
A. Shakouri 7/28/2009
Steven Chu, 2007
Energy Input (Fertilizer, etc.)
Ecosystem Impact
24
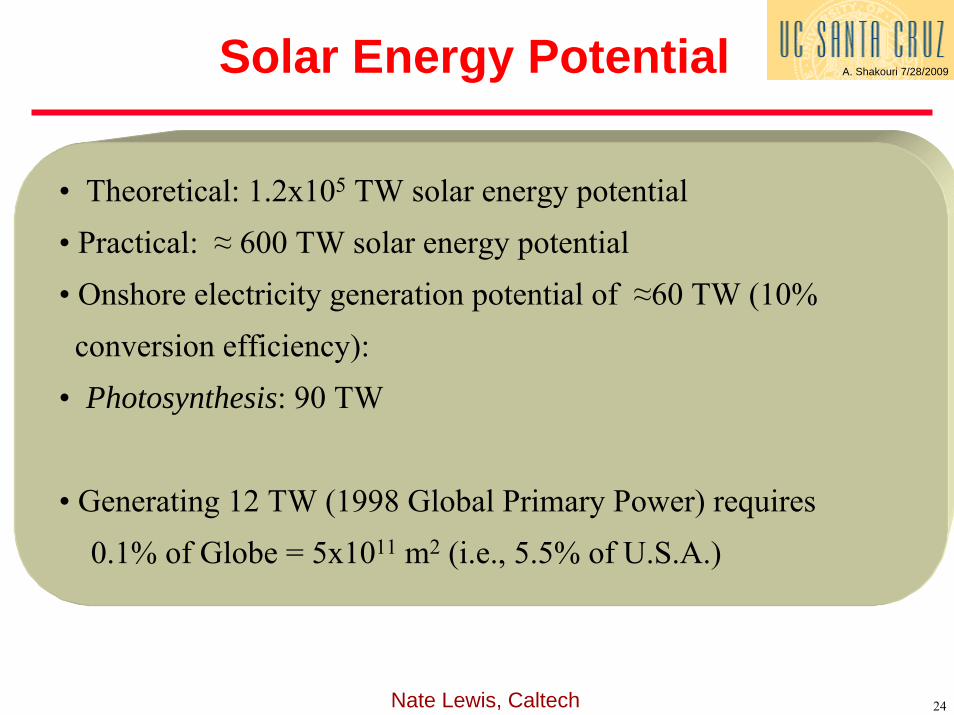
A. Shakouri 7/28/2009Solar Energy Potential
• Theoretical: 1.2x10⁵ TW solar energy potential• Practical: ≈ 600 TW solar energy potential• Onshore electricity generation potential of ≈60 TW (10% conversion efficiency):
• Photosynthesis: 90 TW
• Generating 12 TW (1998 Global Primary Power) requires0.1% of Globe = 5x10¹¹ m2 (i.e., 5.5% of U.S.A.)
Nate Lewis, Caltech
25
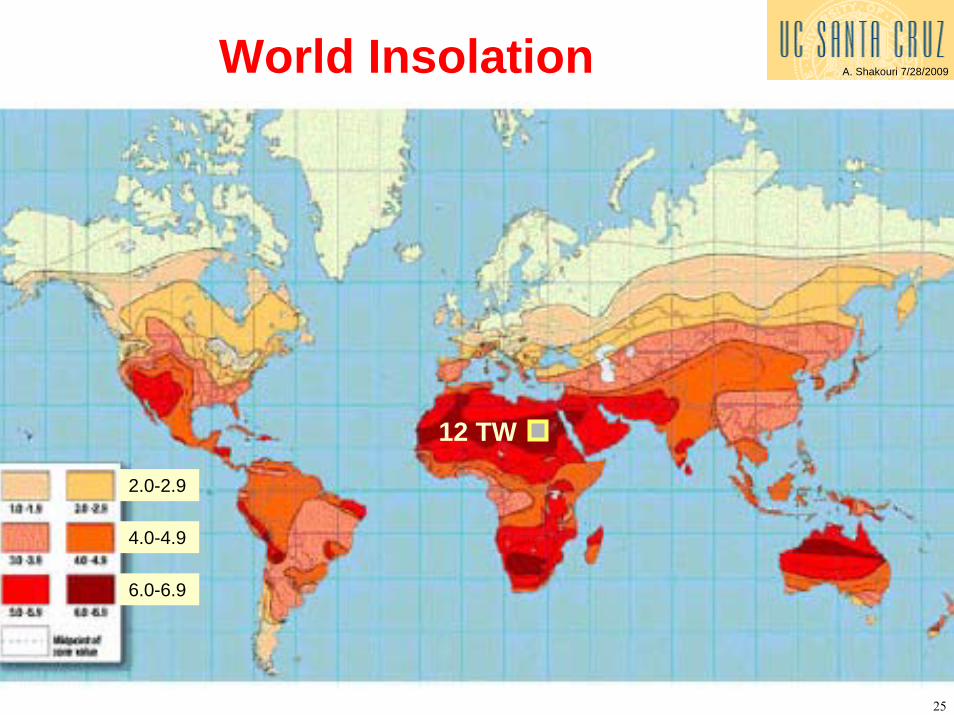
A. Shakouri 7/28/2009World Insolation
12 TW
6.0-6.9
4.0-4.9
2.0-2.9
26
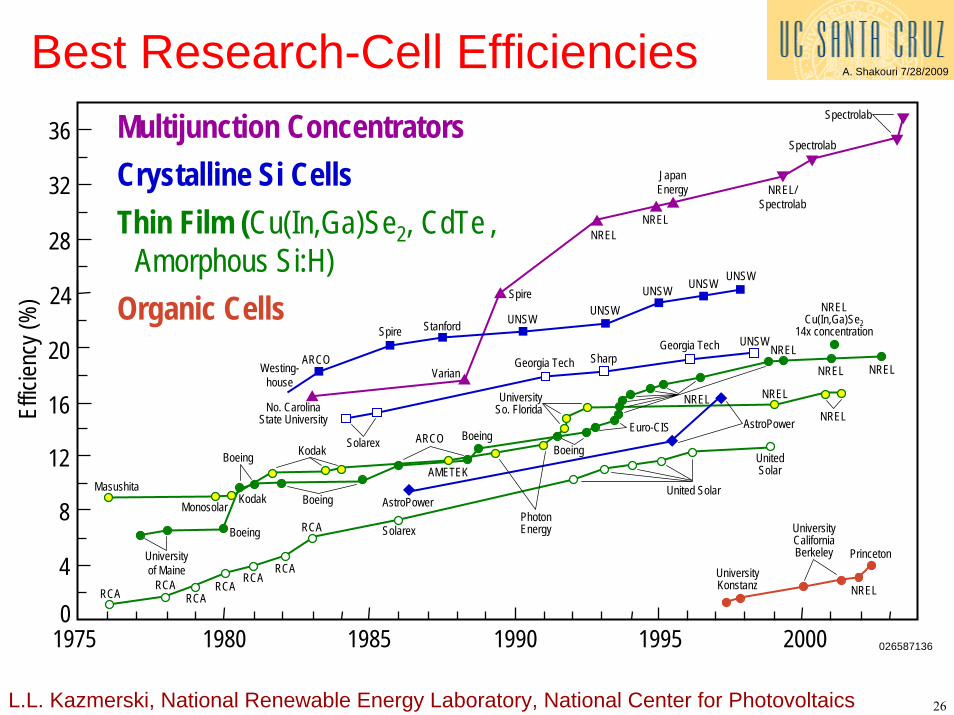
A. Shakouri 7/28/2009Best Research-Cell Efficiencies
Effic
iency
(%)
Universityof Maine
Boeing
Boeing
Boeing
BoeingARCO
NREL
Boeing
Euro-CIS
200019951990198519801975
NREL/Spectrolab
NRELNREL
JapanEnergy
Spire
No. CarolinaState University
Multijunction ConcentratorsCrystalline Si CellsThin Film (Cu(In,Ga)Se2, CdTe ,
Amorphous Si:H)Organic Cells
Varian
RCA
Solarex
UNSW
UNSW
ARCO
UNSWUNSW
UNSWSpire Stanford
Westing-house
UNSWGeorgia TechGeorgia Tech Sharp
AstroPower
NREL
AstroPower
Spectrolab
NREL
MasushitaMonosolar Kodak
Kodak
AMETEK
PhotonEnergy
UniversitySo. Florida
NREL
NREL
Princeton UniversityKonstanz NREL
NRELCu(In,Ga)Se2
14x concentration
NREL
UnitedSolar
United Solar
RCA
RCARCA
RCARCA
RCA
026587136
Spectrolab
University CaliforniaBerkeley
Solarex12
8
4
0
16
20
24
28
32
36
L.L. Kazmerski, National Renewable Energy Laboratory, National Center for Photovoltaics
27
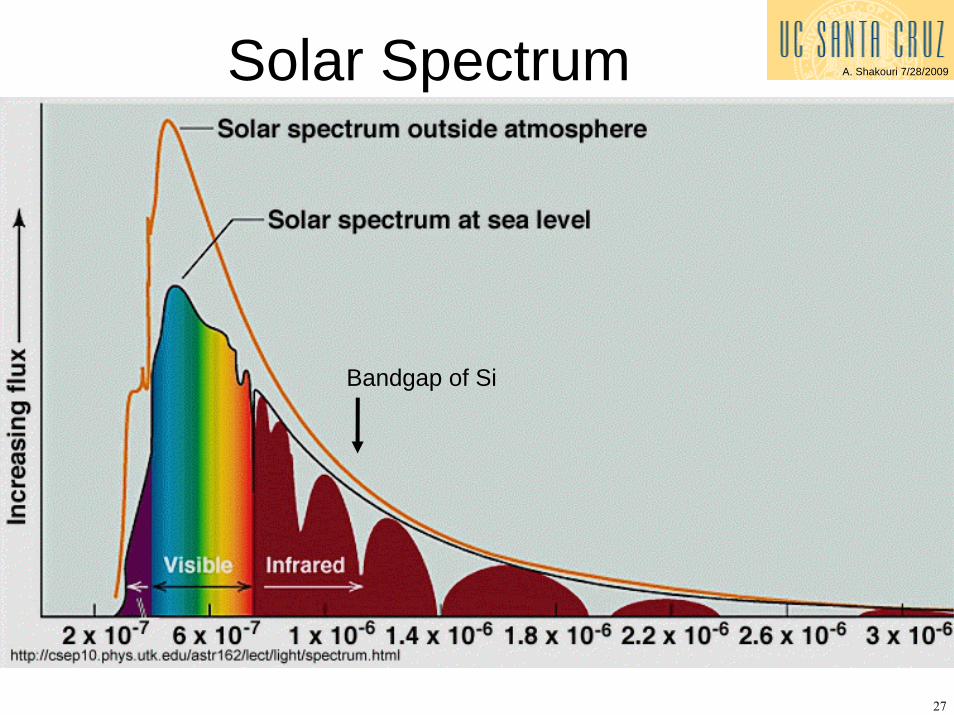
A. Shakouri 7/28/2009Solar Spectrum
Bandgap of Si
28
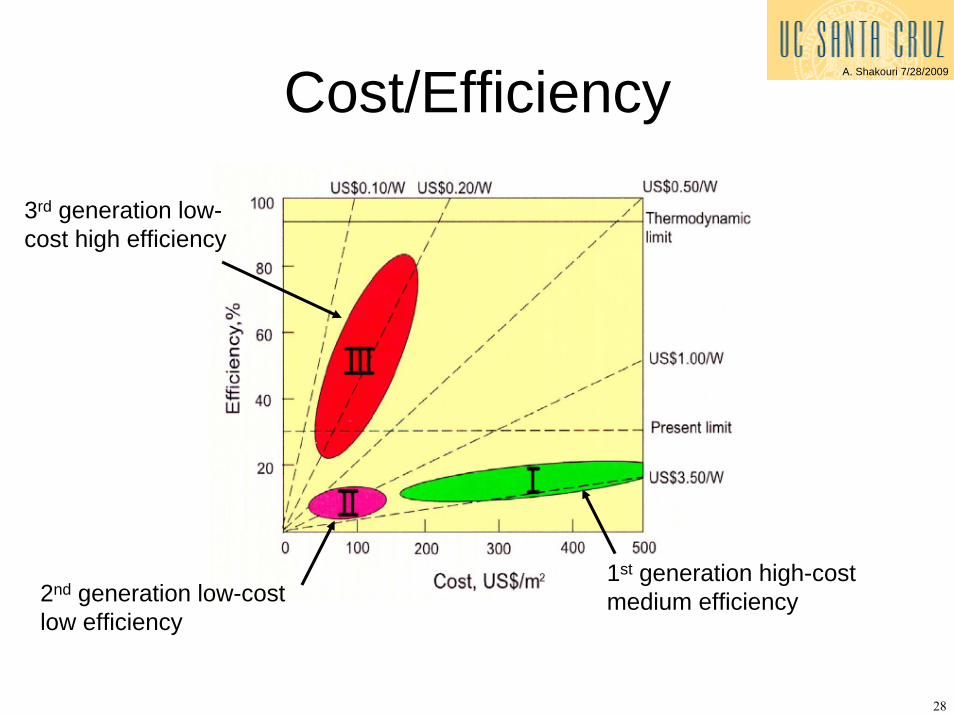
A. Shakouri 7/28/2009Cost/Efficiency
1st generation high-cost medium efficiency2nd generation low-cost
low efficiency
3rd generation low-cost high efficiency
29
A. Shakouri 7/28/2009
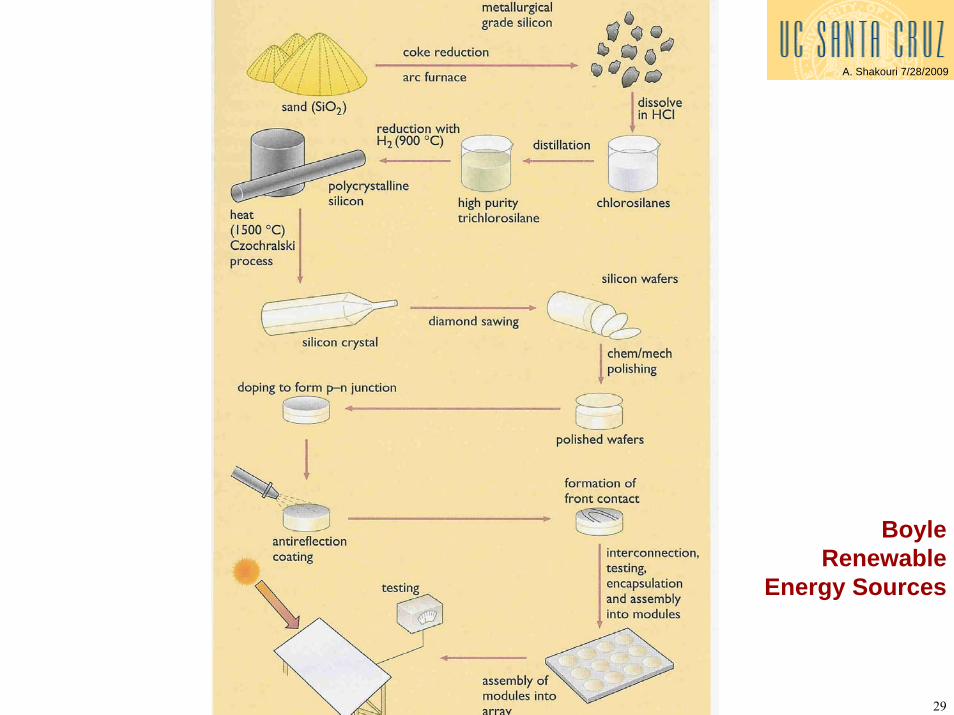
BoyleRenewable
Energy Sources
30
A. Shakouri 7/28/2009
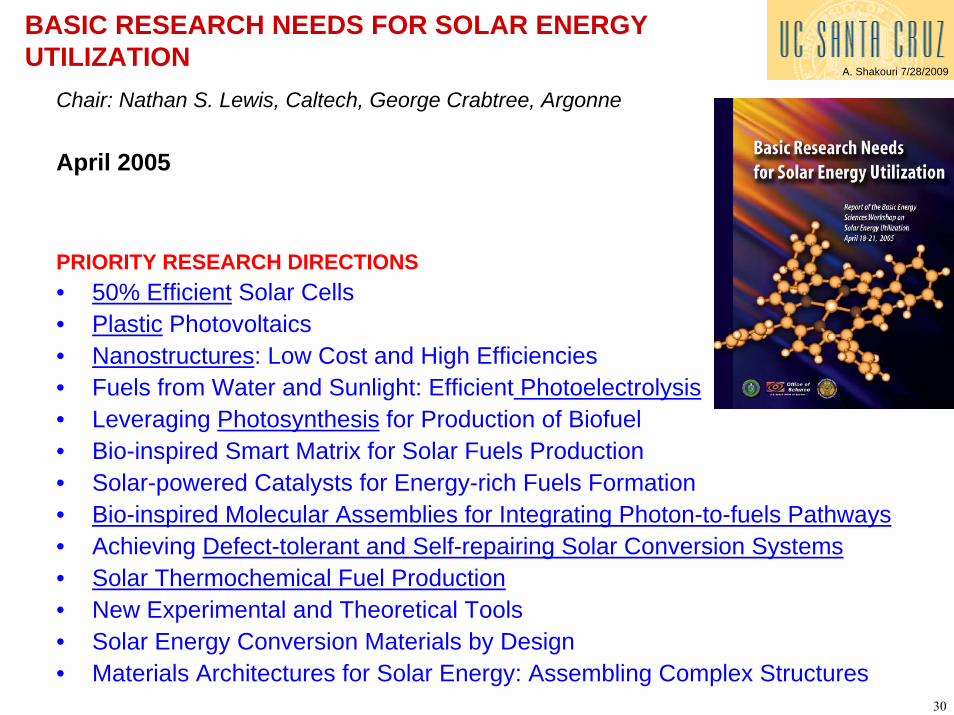
BASIC RESEARCH NEEDS FOR SOLAR ENERGY UTILIZATION
Chair: Nathan S. Lewis, Caltech, George Crabtree, Argonne
PRIORITY RESEARCH DIRECTIONS• 50% Efficient Solar Cells • Plastic Photovoltaics• Nanostructures: Low Cost and High Efficiencies • Fuels from Water and Sunlight: Efficient Photoelectrolysis• Leveraging Photosynthesis for Production of Biofuel• Bio-inspired Smart Matrix for Solar Fuels Production• Solar-powered Catalysts for Energy-rich Fuels Formation • Bio-inspired Molecular Assemblies for Integrating Photon-to-fuels Pathways• Achieving Defect-tolerant and Self-repairing Solar Conversion Systems• Solar Thermochemical Fuel Production• New Experimental and Theoretical Tools • Solar Energy Conversion Materials by Design • Materials Architectures for Solar Energy: Assembling Complex Structures
April 2005
31
A. Shakouri 7/28/2009A. Shakouri 11/25/2008
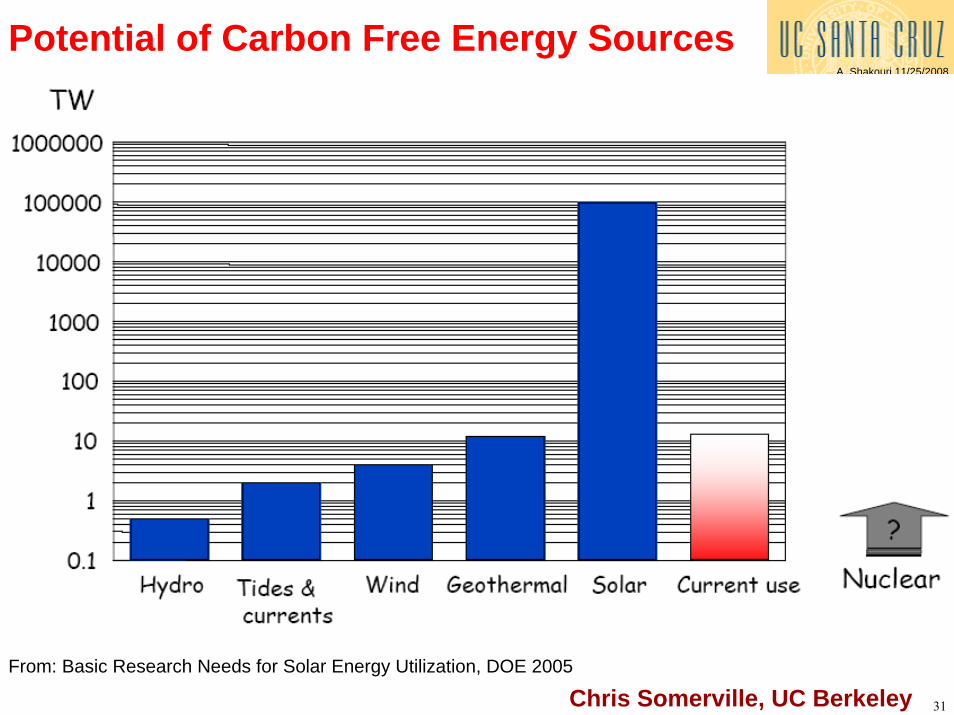
Potential of Carbon Free Energy Sources
From: Basic Research Needs for Solar Energy Utilization, DOE 2005
Chris Somerville, UC Berkeley
32
A. Shakouri 7/28/2009
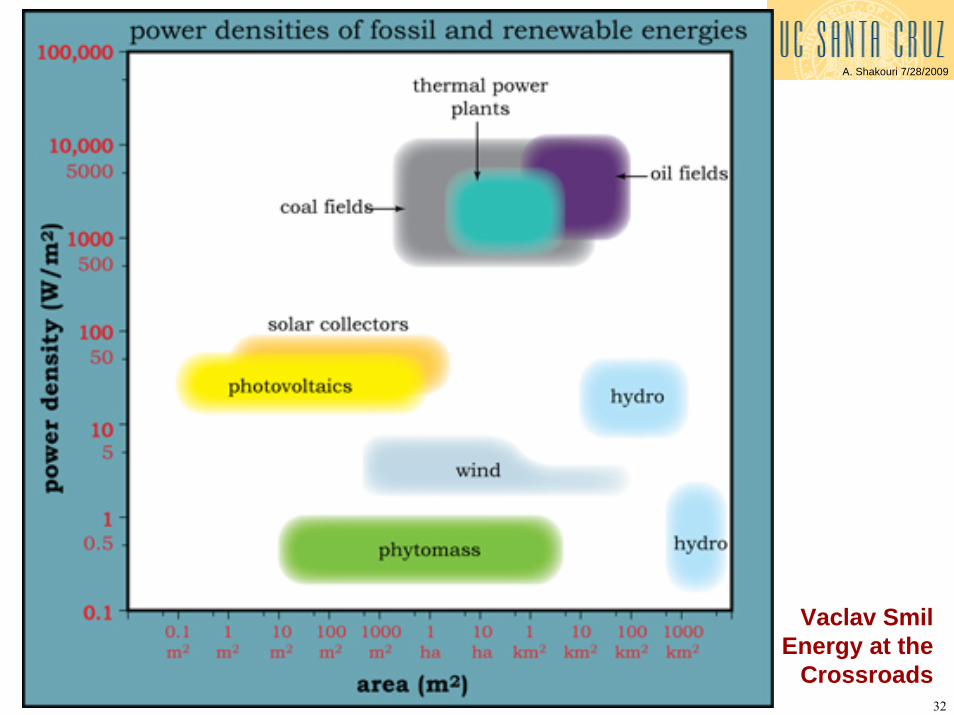
Vaclav SmilEnergy at the
Crossroads
33
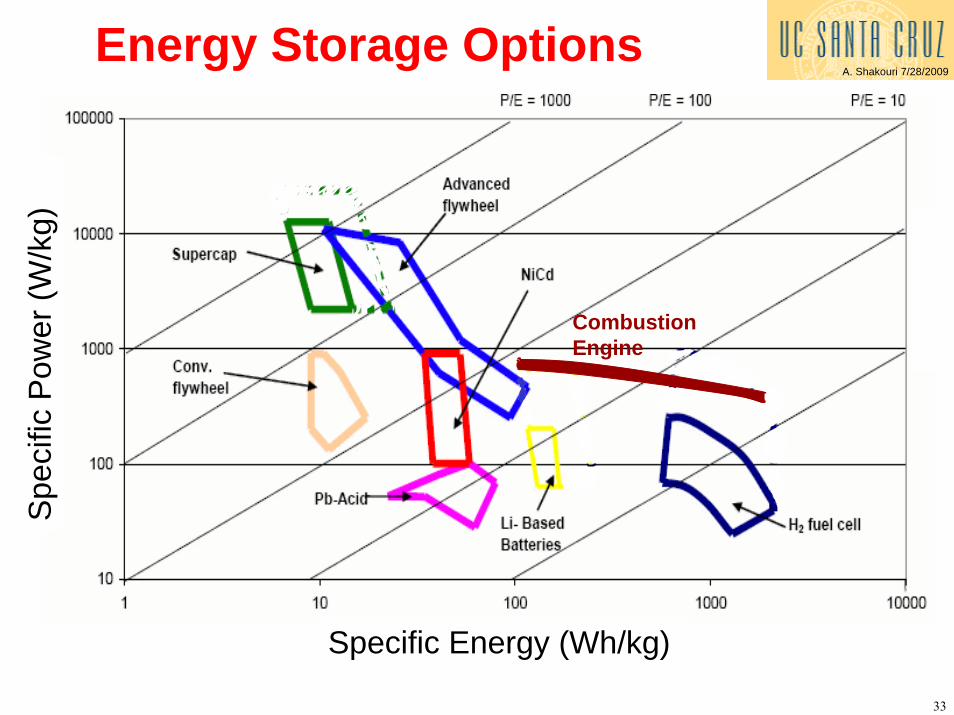
A. Shakouri 7/28/2009Energy Storage Options
Specific Energy (Wh/kg)
Spe
cific
Pow
er (W
/kg)
Combustion Engine
34
A. Shakouri 7/28/2009
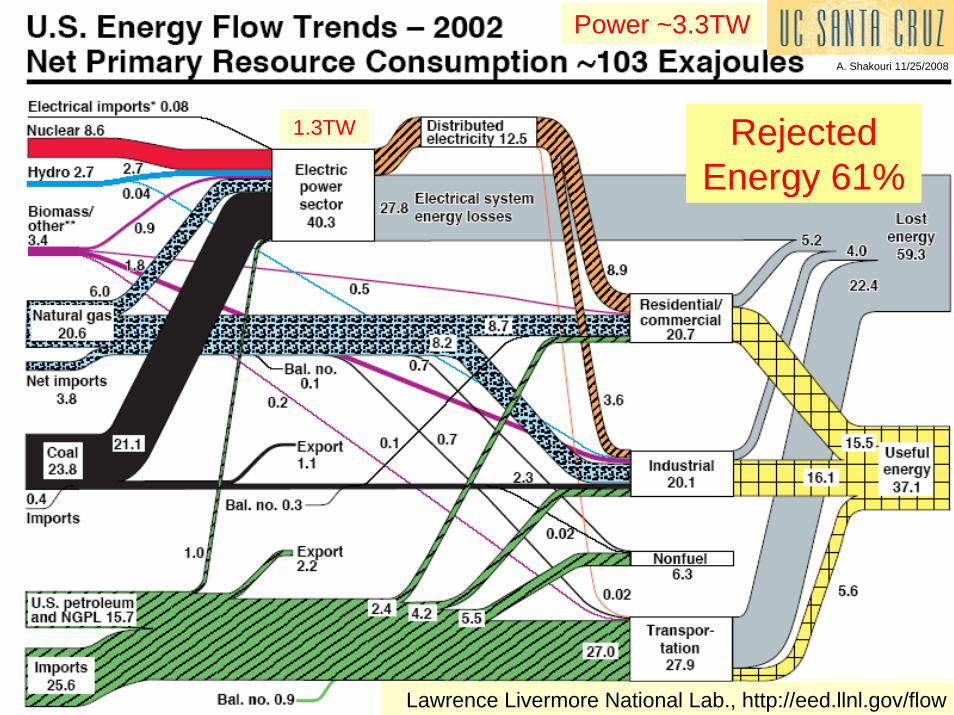
RejectedEnergy 61%
Lawrence Livermore National Lab., http://eed.llnl.gov/flow
Power ~3.3TW
1.3TW
A. Shakouri 11/25/2008
35
A. Shakouri 7/28/2009
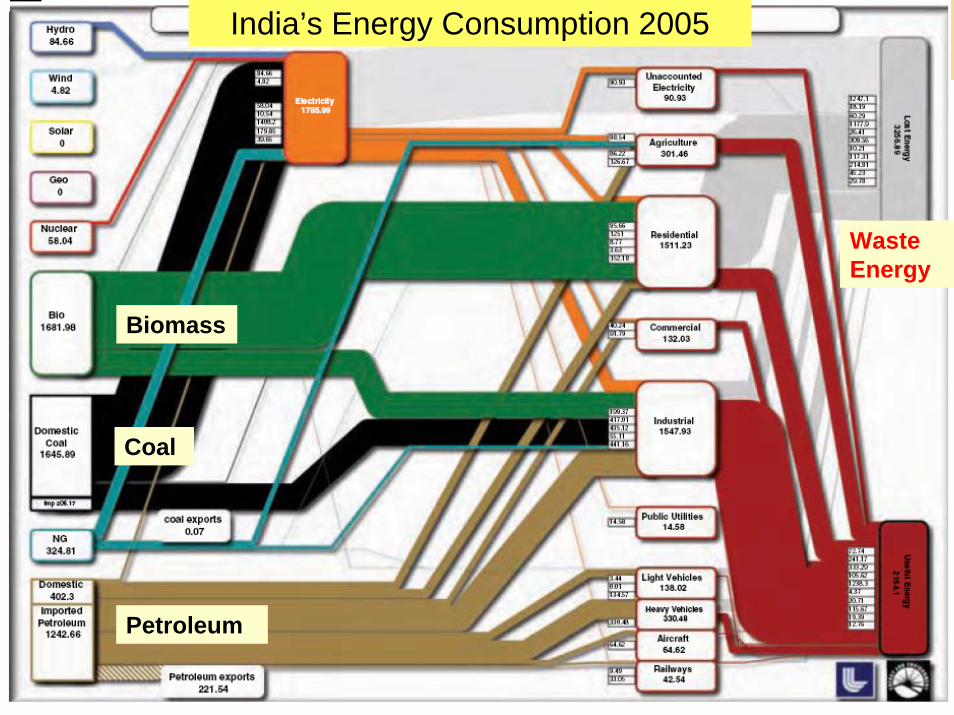
Biomass
Petroleum
Coal
Waste Energy
India’s Energy Consumption 2005
36
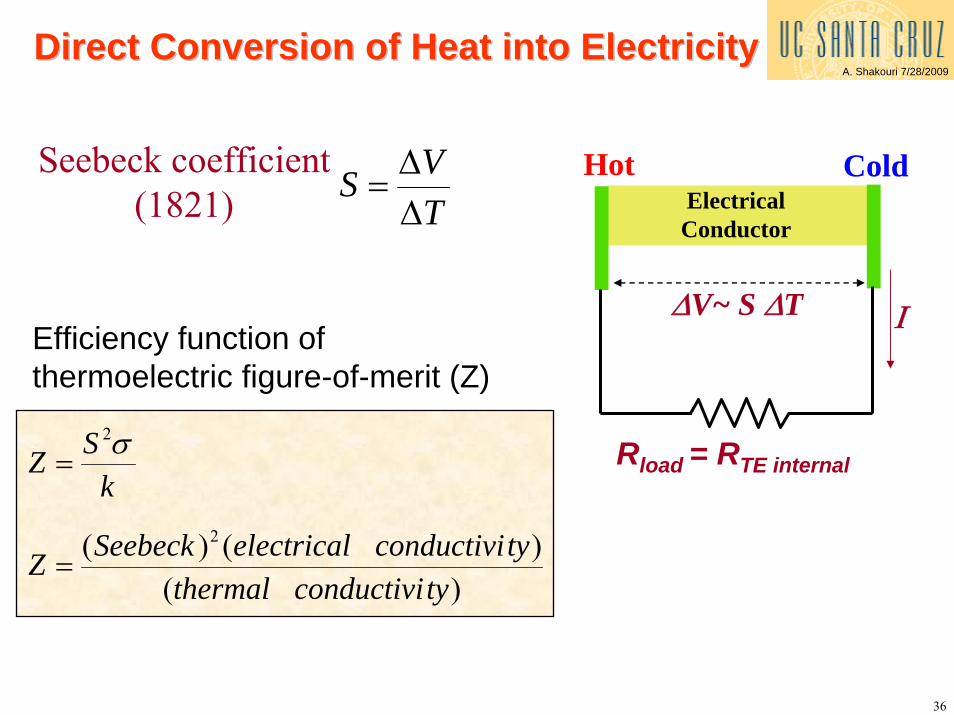
A. Shakouri 7/28/2009Direct Conversion of Heat into ElectricityDirect Conversion of Heat into Electricity
TVS
∆∆
=Seebeck coefficient
(1821)
∆V~ S ∆T
Electrical Conductor
Hot Cold
Ι
Rload = RTE internal
Efficiency function of thermoelectric figure-of-merit (Z)
)()()( 2
2
tyconductivithermaltyconductivielectricalSeebeckZ
kSZ
=
=σ
37
A. Shakouri 7/28/2009
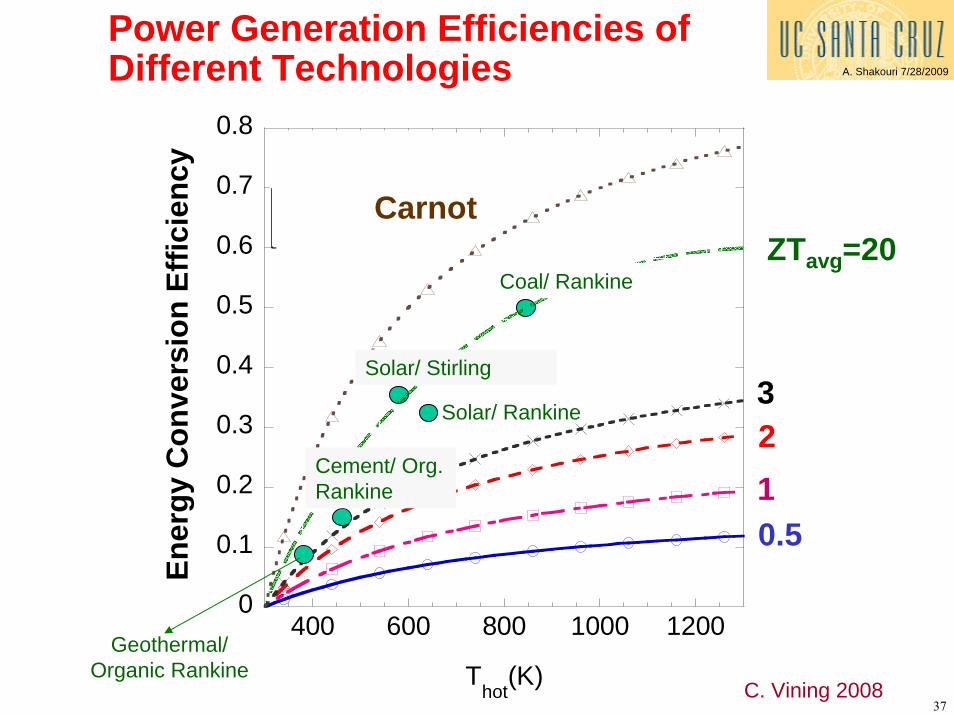
Power Generation Efficiencies of Different Technologies
0
0.1
0.2
0.3
0.4
0.5
0.6
0.7
0.8
400 600 800 1000 1200
ZTm=0.5ZTm=1ZTm=2ZTm=3Carnot limit
Thot
(K)
0.5
Ener
gy C
onve
rsio
n Ef
ficie
ncy
3
12
Carnot
Solar/ Rankine
Geothermal/ Organic Rankine
ZTavg=20Coal/ Rankine
Cement/ Org. Rankine
Solar/ Stirling
C. Vining 2008
38
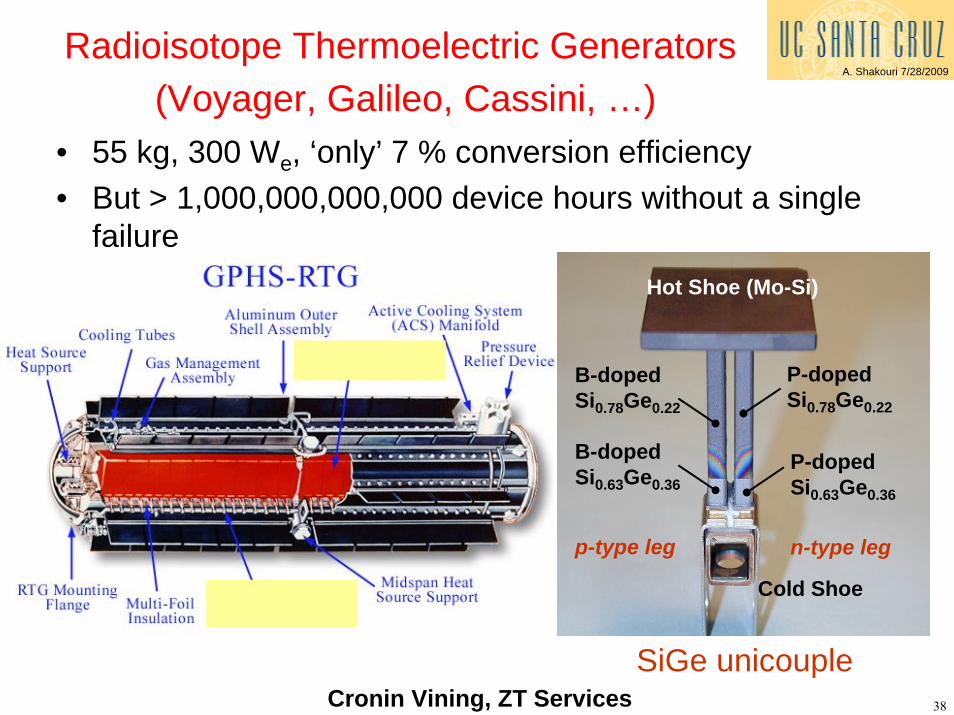
A. Shakouri 7/28/2009Radioisotope Thermoelectric Generators
(Voyager, Galileo, Cassini, …)• 55 kg, 300 We, ‘only’ 7 % conversion efficiency• But > 1,000,000,000,000 device hours without a single
failure
B-doped Si0.78Ge0.22
P-doped Si0.78Ge0.22
B-doped Si0.63Ge0.36
P-doped Si0.63Ge0.36
Hot Shoe (Mo-Si)
Cold Shoe
n-type legp-type leg
SiGe unicoupleCronin Vining, ZT Services
39
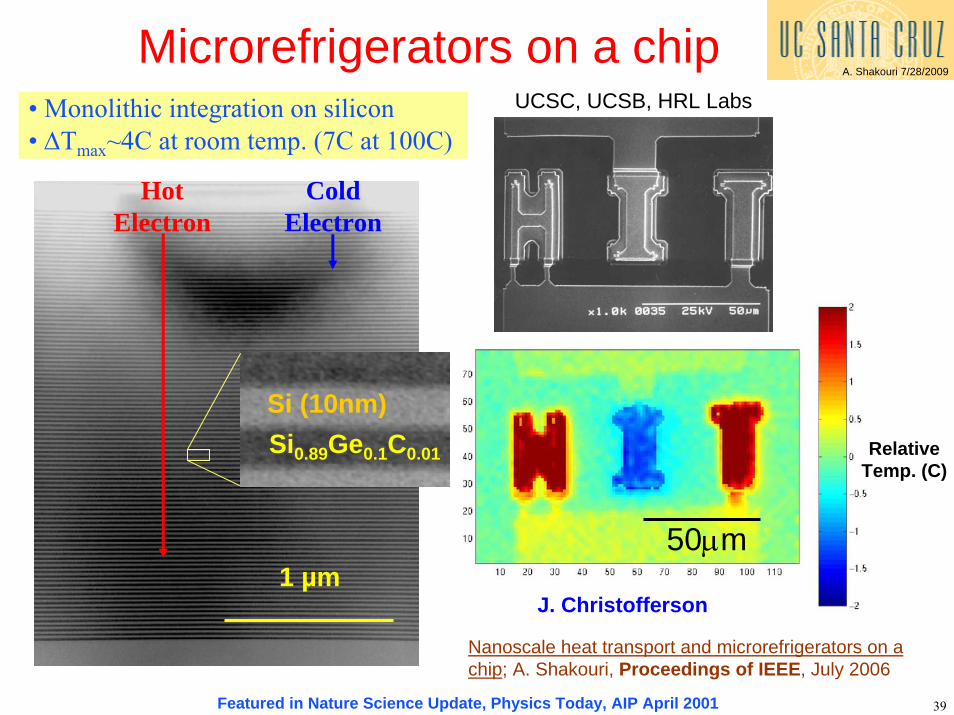
A. Shakouri 7/28/2009Microrefrigerators on a chip
Featured in Nature Science Update, Physics Today, AIP April 2001
• Monolithic integration on silicon• ∆Tmax~4C at room temp. (7C at 100C)
UCSC, UCSB, HRL Labs
Relative Temp. (C)
50µm1 µm
Hot Electron
Cold Electron
Nanoscale heat transport and microrefrigerators on a chip; A. Shakouri, Proceedings of IEEE, July 2006
J. Christofferson
Si (10nm)Si0.89Ge0.1C0.01
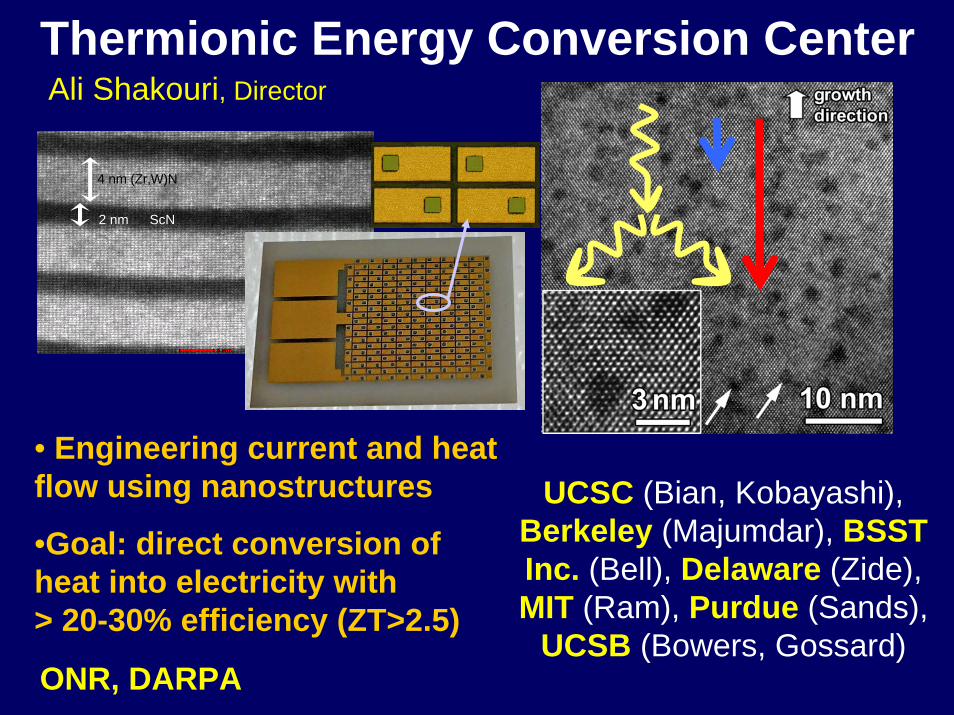
Ali Shakouri, Director
Thermionic Energy Conversion Center
4 nm (Zr,W)N
2 nm ScN
• Engineering current and heat flow using nanostructures
•Goal: direct conversion of heat into electricity with > 20-30% efficiency (ZT>2.5)
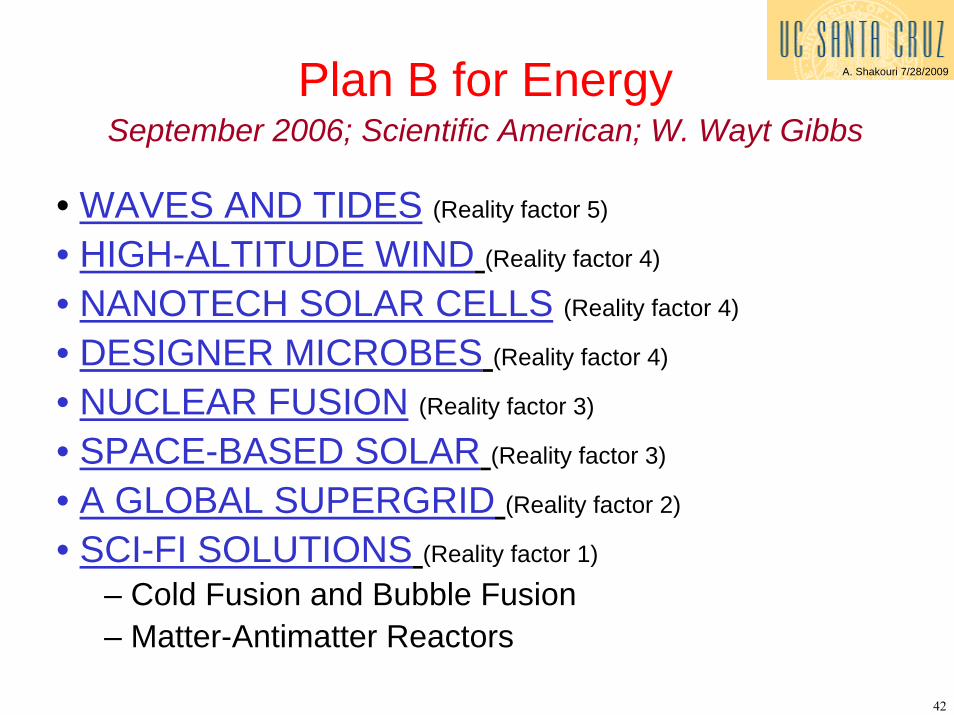
A. Shakouri 7/28/2009Plan B for EnergySeptember 2006; Scientific American; W. Wayt Gibbs
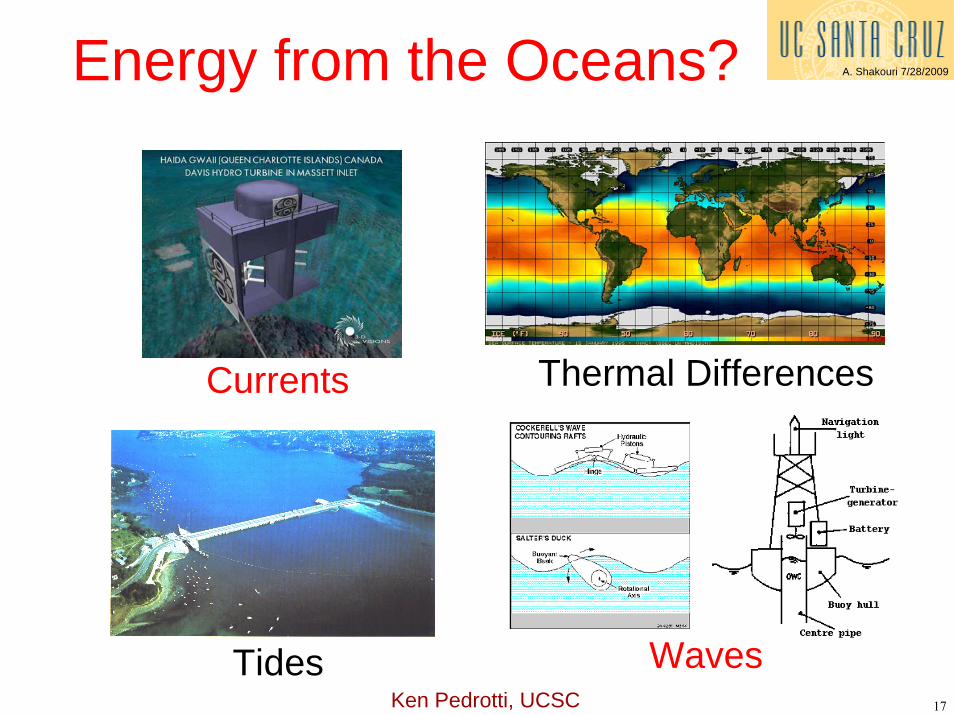
• WAVES AND TIDES (Reality factor 5)
• HIGH-ALTITUDE WIND (Reality factor 4)
• NANOTECH SOLAR CELLS (Reality factor 4)
• DESIGNER MICROBES (Reality factor 4)
• NUCLEAR FUSION (Reality factor 3)
• SPACE-BASED SOLAR (Reality factor 3)
• A GLOBAL SUPERGRID (Reality factor 2)
• SCI-FI SOLUTIONS (Reality factor 1)
– Cold Fusion and Bubble Fusion– Matter-Antimatter Reactors
43
A. Shakouri 7/28/2009
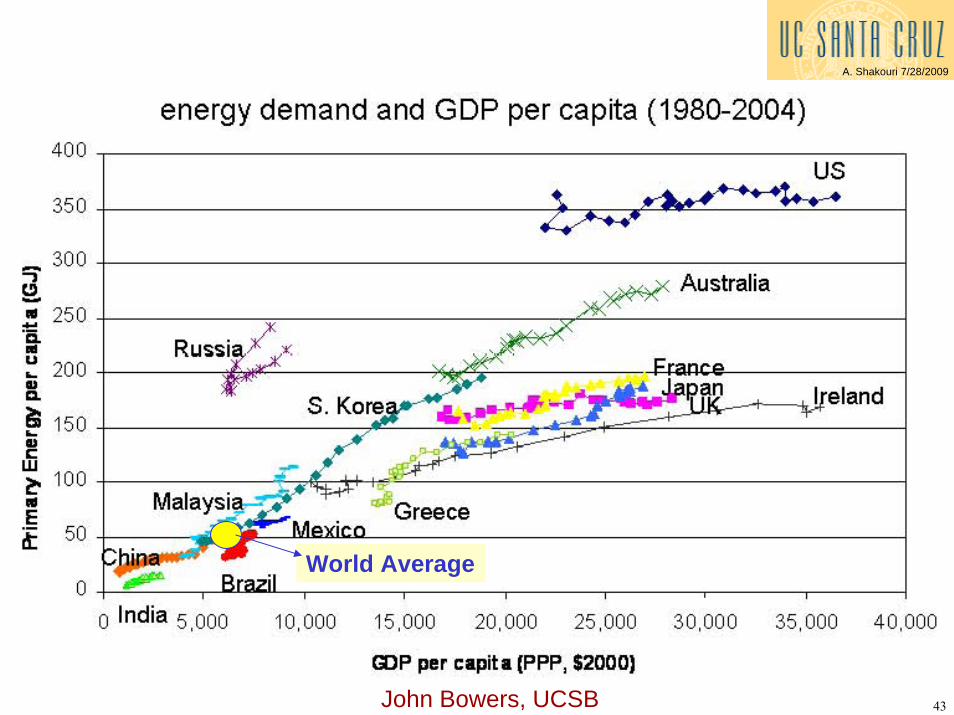
John Bowers, UCSB
World Average
44
A. Shakouri 7/28/2009
45
A. Shakouri 7/28/2009
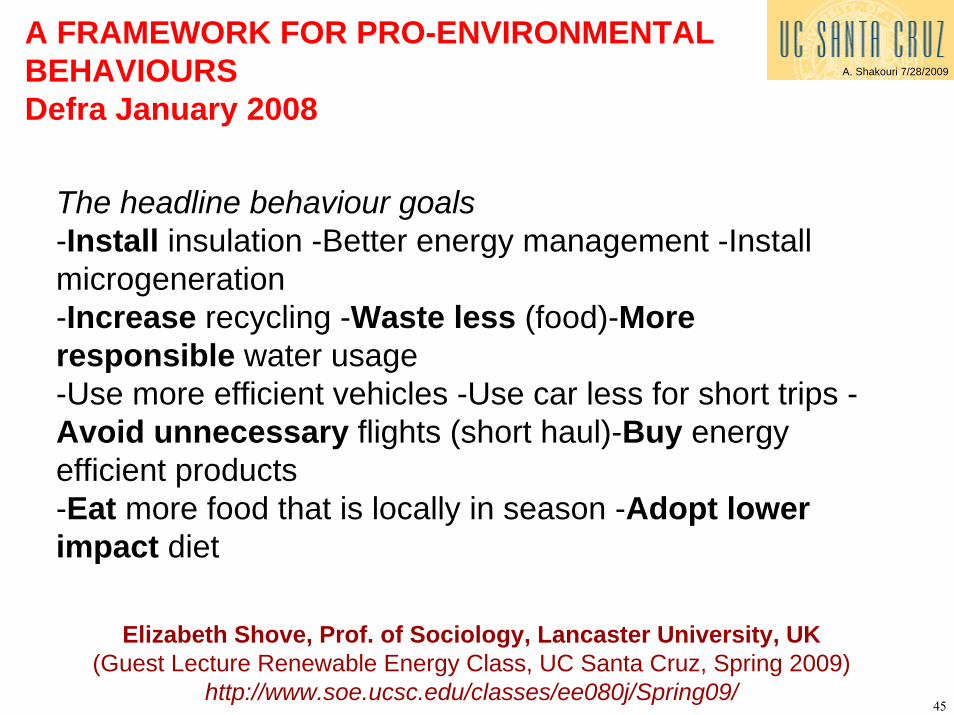
A FRAMEWORK FOR PRO-ENVIRONMENTAL BEHAVIOURSDefra January 2008
The headline behaviour goals-Install insulation -Better energy management -Install microgeneration-Increase recycling -Waste less (food)-Moreresponsible water usage-Use more efficient vehicles -Use car less for short trips -Avoid unnecessary flights (short haul)-Buy energy efficient products-Eat more food that is locally in season -Adopt lower impact diet
Elizabeth Shove, Prof. of Sociology, Lancaster University, UK (Guest Lecture Renewable Energy Class, UC Santa Cruz, Spring 2009)
http://www.soe.ucsc.edu/classes/ee080j/Spring09/
46
A. Shakouri 7/28/2009
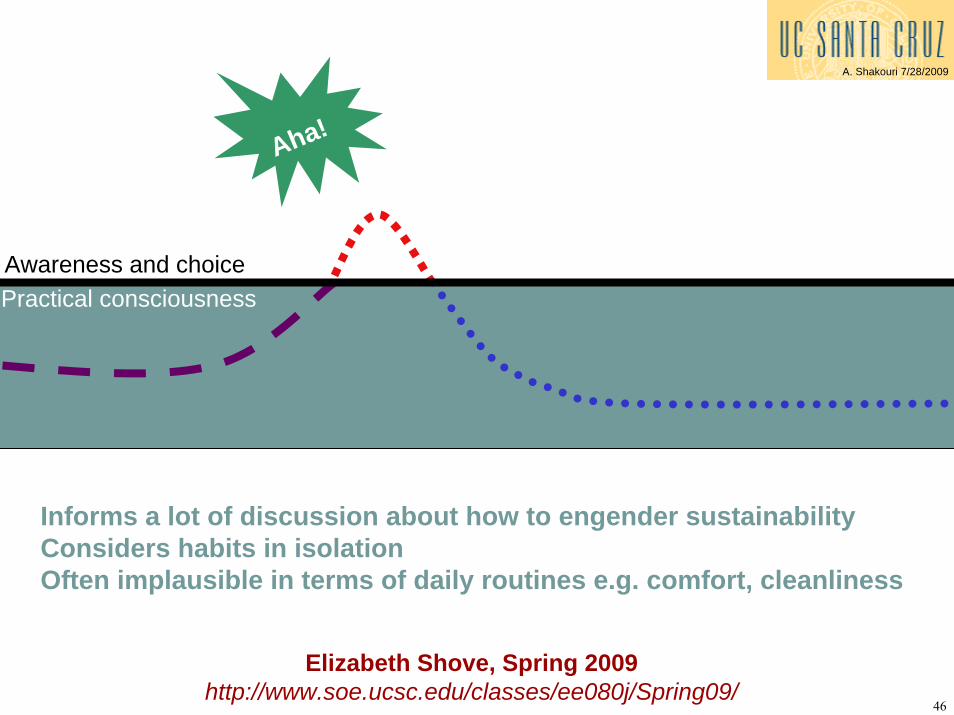
Aha!
Practical consciousnessAwareness and choice
Informs a lot of discussion about how to engender sustainabilityConsiders habits in isolationOften implausible in terms of daily routines e.g. comfort, cleanliness
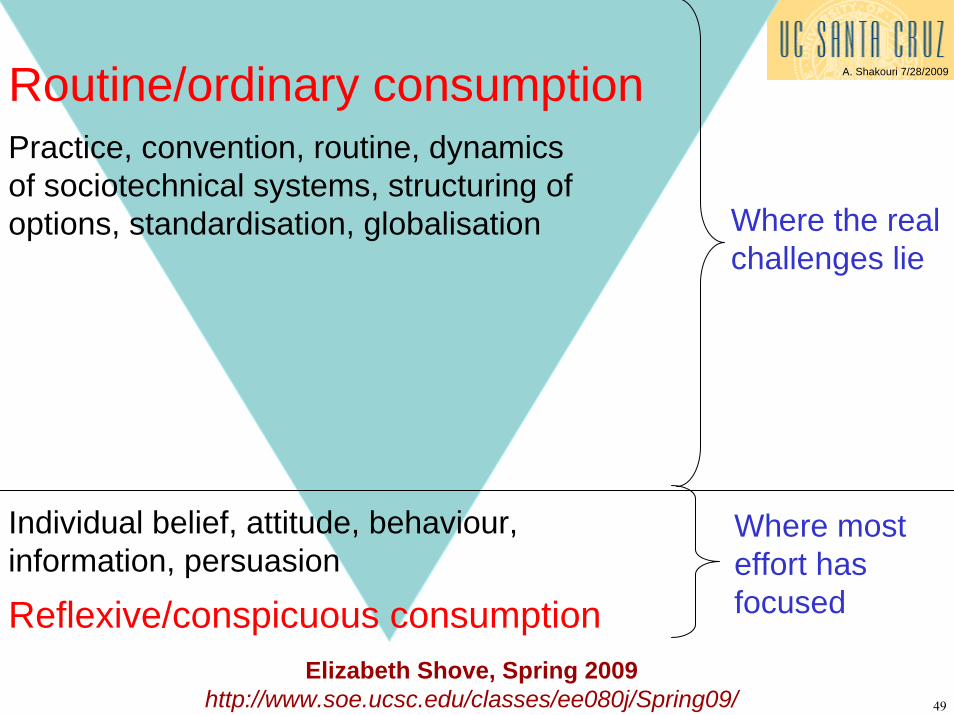
Elizabeth Shove, Spring 2009 http://www.soe.ucsc.edu/classes/ee080j/Spring09/
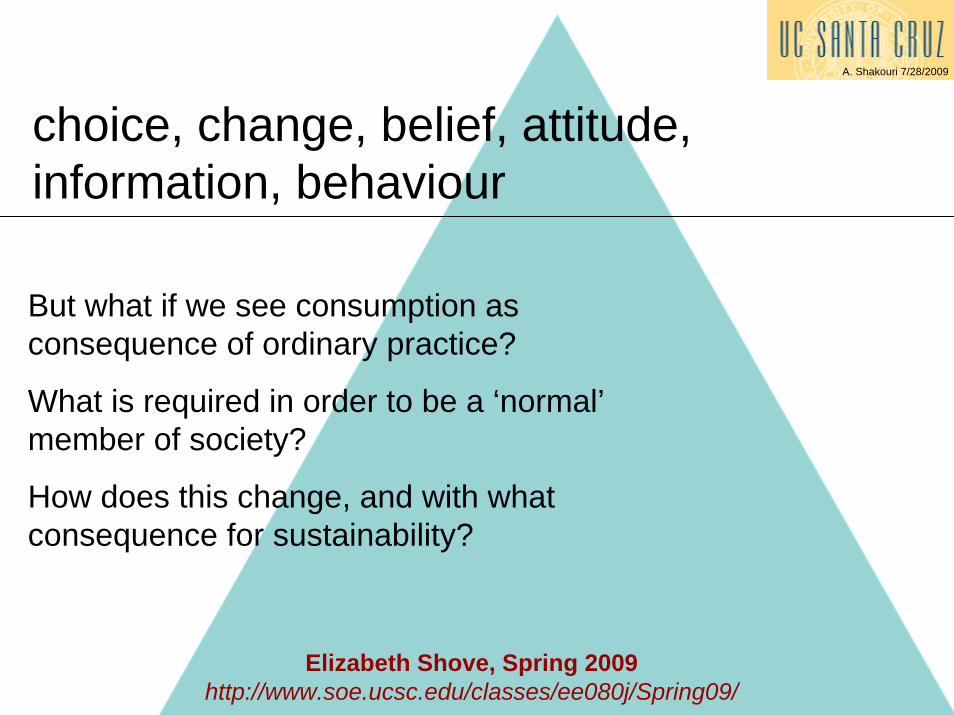
But what if we see consumption as consequence of ordinary practice?
What is required in order to be a ‘normal’member of society?
How does this change, and with what consequence for sustainability?
Elizabeth Shove, Spring 2009 http://www.soe.ucsc.edu/classes/ee080j/Spring09/
48
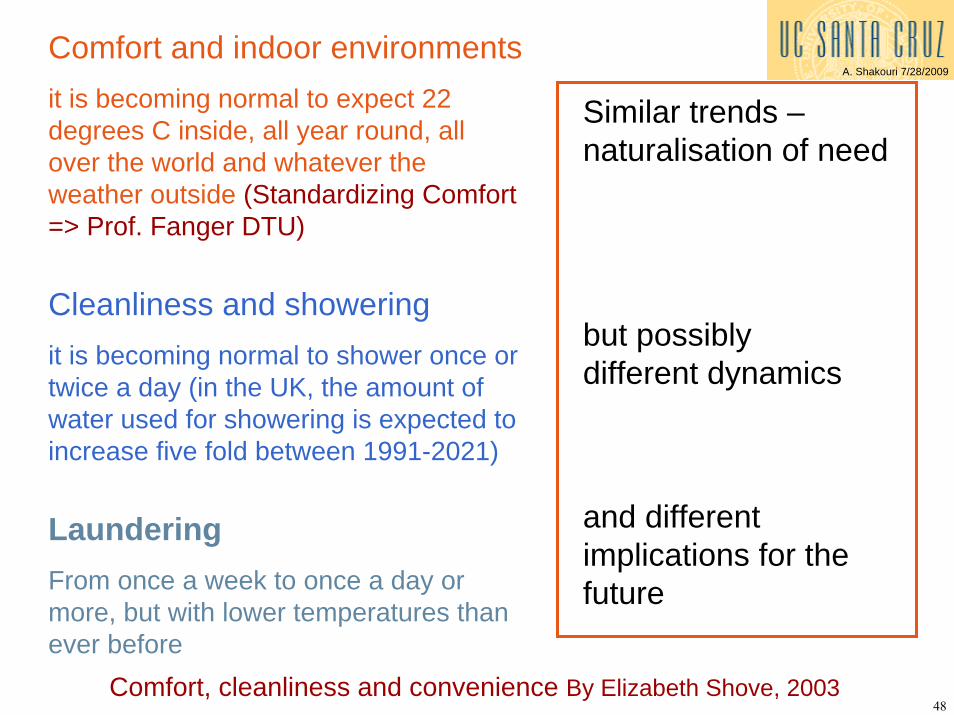
A. Shakouri 7/28/2009Comfort and indoor environments it is becoming normal to expect 22 degrees C inside, all year round, all over the world and whatever the weather outside (Standardizing Comfort => Prof. Fanger DTU)
Cleanliness and showeringit is becoming normal to shower once or twice a day (in the UK, the amount of water used for showering is expected to increase five fold between 1991-2021)
LaunderingFrom once a week to once a day or more, but with lower temperatures than ever before
Similar trends –naturalisation of need
but possibly different dynamics
and different implications for the future
Comfort, cleanliness and convenience By Elizabeth Shove, 2003