79
Renewable Energy Production December 6 2012 The School of Environmental Studies, Queen’s University Katrina Angus, Meghan Arteaga, Brendan McGovern, Sarah Taylor

Renewable Energy Production
December 6
2012 The School of Environmental Studies, Queen’s University Katrina Angus, Meghan Arteaga, Brendan McGovern, Sarah Taylor
2

3
Acknowledgements
We would like to say thank you to the following people for the valuable input they provided
throughout our project:
Ryan Danby – Queen’s University, School of Environmental Studies
Graham Whitelaw – Queen’s University, School of Environmental Studies
Susan Greaves – Queen’s University GIS and Map Librarian
Kirby Calvert – Queen’s University, Department of Geography
Warren Mabee – Queen’s University, Department of Geography
Michael Dwyer – Ministry of the Environment
Cameron Connor – Queen’s University, School of Business
Don Ross – Frontenac Arch Biosphere Network
Sarah Matheson – Frontenac Arch Biosphere Network
4
Executive Summary
Renewable energy is defined as “the production of electrical power from an energy
source that is renewed by natural processes” (Ministry of Municipal Affairs and Housing, 2005).
The industrialized world is currently reliant on fossil fuels and other polluting energy systems
that have been linked to global environmental issues such as climate change. Renewable energy
has been identified as an alternative to these types of conventional energy sources, and is
thought to be preferable because of its ability to produce sustainable energy, which reduces
environmental impacts. Numerous renewable energy facilities have been constructed in various
areas across the globe in an attempt to generate electricity with fewer detrimental effects on
the environment, and to provide benefits to both the economy and to public health (Ministry of
the Environment, 2011).
The Frontenac Arch Biosphere (FAB) is a region in the province of Ontario that helps to
“guide [its] community towards a more sustainable approach to living on earth” (FAB, 2012).
The development of renewable energy sources in the FAB would greatly increase its
sustainability. In this report, several indicators related to renewable energy were investigated in
order to synthesize a reasonable and representative outlook on the sustainability of the FAB.
Solar, wind, hydrological and bioenergy were investigated, as all of these sources are located
within the FAB’s boundaries. The quantity and location of renewable energy sources, the
diversity of energy types, and the number of people per energy source and energy capacity
were determined for both the FAB and Ontario. These metrics were then compared between
the two regions, and it was found that the FAB’s overall sustainability is greater than that of the
province of Ontario.

5
Table of Contents
Acknowledgements .................................................................................................................................... 3
Executive Summary..................................................................................................................................... 4
List of Figures .............................................................................................................................................. 7
List of Tables ............................................................................................................................................... 8
1.0 Introduction .................................................................................................................................... 9
2.0 Relationship to Sustainability ........................................................................................................ 11
3.0 Background ................................................................................................................................... 13
3.1 Biosphere Reserves ................................................................................................................... 13
3.2 The Feed-In-Tariff Program ....................................................................................................... 13
3.3 Types of Renewable Energy ...................................................................................................... 14
4.0 Goal ............................................................................................................................................... 16
5.0 Objectives ..................................................................................................................................... 17
6.0 Scale and Scope ............................................................................................................................ 18
7.0 Indicators ...................................................................................................................................... 19
7.1 Number of feed-in tariffs issued by the government ................................................................ 19
7.2 Numbers and types of renewable electrical sources................................................................. 19
7.3 Energy production from renewable sources ............................................................................. 19
7.4 Number of municipalities that include a sustainable energy section in their Official Plan/official
documents ............................................................................................................................................ 20
8.0 Methods ........................................................................................................................................ 21
8.1 Acquisition ................................................................................................................................ 21
8.1.1 ‘Brainstorming Sessions’ ................................................................................................... 21
8.1.2 General Research .............................................................................................................. 22
8.1.3 Field Study ......................................................................................................................... 23
8.1.4 Individual Research ........................................................................................................... 23
8.1.5 Further Research ............................................................................................................... 25
8.1.6 New ‘Main Ideas’ ............................................................................................................... 25
8.1.7 Group Workshop ............................................................................................................... 26
8.1.8 Final Research ................................................................................................................... 26
8.2 Analysis and Synthesis .............................................................................................................. 26
6
9.0 Assessment ................................................................................................................................... 29
9.1 Government Issued Feed-in Tariffs and Capacity Allocated Exempt Projects ........................... 30
9.1.1 Number of feed-in tariffs and capacity allocated exempt projects issued by the
government ...................................................................................................................................... 30
9.2 Renewable Energy..................................................................................................................... 37
9.2.1 Number and type of renewable electrical energy sources ................................................ 38
9.3 Energy Production ..................................................................................................................... 42
9.3.1 Energy production from renewable energy sources ......................................................... 42
9.4 Sustainability Initiatives ............................................................................................................ 48
9.4.1 Number of municipalities that include a sustainable energy section in their Official
Plan/official documents .................................................................................................................... 48
10.0 Assessment – Concluding Remarks ............................................................................................... 52
11.0 Opportunities ................................................................................................................................ 53
11.1 Hydrological .............................................................................................................................. 54
11.2 Wind .......................................................................................................................................... 56
11.3 Solar .......................................................................................................................................... 57
11.4 Bioenergy .................................................................................................................................. 58
11.5 Initiatives................................................................................................................................... 59
12.0 Conclusions ................................................................................................................................... 60
13.0 Future Research ............................................................................................................................ 62
14.0 Definitions ..................................................................................................................................... 64
15.0 List of Abbreviations ..................................................................................................................... 65
16.0 References .................................................................................................................................... 66
17.0 Appendix A .................................................................................................................................... 69
18.0 Appendix B .................................................................................................................................... 75

7
List of Figures
Figure 1: Locations of FIT and CAE renewable energy sources in Ontario cities.. ..................................... 31
Figure 2: Locations of FIT and CAE renewable energy sources in south-eastern Ontario ......................... 32
Figure 3: Total number of FIT or CAE projects in Ontario. ........................................................................ 34
Figure 4: Total number of FIT or CAE projects in Ontario. ........................................................................ 34
Figure 5: Locations of FIT and CAE projects in the FAB. ............................................................................ 35
Figure 6: Quantities and types of FIT and CAE energy projects in Ontario. ............................................... 38
Figure 7: Quantities and types of FIT and CAE energy projects in the FAB. .............................................. 39
Figure 8: Quantities and types of FIT or CAE energy sources in the FAB ................................................... 40
Figure 9: Values (kilowatts) and proportions of energy capacity per type of energy source in Ontario. .. 43
Figure 10: Values (kilowatts) and proportions of energy capacity per type of source in the FAB ............. 43
Figure 11: Total energy capacity (kilowatts) for each type of energy source in Ontario cities. ................. 44
Figure 12: Total energy capacity (kilowatts) for each type of energy source in the FAB cities. ................ 45
Figure 13: Energy capacity (kilowatts) per city in Ontario......................................................................... 46
Figure 14: Renewable energy capacity (kilowatts) per city in the FAB. ..................................................... 47
Figure 15: Energy Output by Fuel Type in Ontario .................................................................................... 54
Figure 16: Map showing existing waterpower generation stations in and around the FAB and potential
hydroelectricity sites in the region ........................................................................................................... 55
Figure 17: Map showing wind speeds and the potential for wind energy in the FAB region. ................... 57
Figure 18: Energy capacities per each bio-gas energy source in Ontario. ................................................. 69
Figure 19: Energy capacities per each biomass energy source in Ontario. ............................................... 70
Figure 20: Energy capacities per each landfill energy source in Ontario. .................................................. 71
Figure 21: Energy capacities per each water energy source in Ontario. ................................................... 72
Figure 22: Energy capacities per each water energy source in Ontario. ................................................... 73
Figure 23: Energy capacities per each wind energy source in Ontario. ..................................................... 74
Figure 24: Energy capacities per each bio-gas energy source in the FAB. ................................................. 75
Figure 25: Energy capacities per each biomass energy source in the FAB. ............................................... 76
Figure 26: Energy capacities per each solar energy source in the FAB...................................................... 77
Figure 27: Energy capacities per each water energy source in the FAB. ................................................... 78
Figure 28: Energy capacities per each wind energy source in the FAB. .................................................... 79

8
List of Tables
Table 1: List of potential indicators, as discussed in the preliminary stages of data acquisition............... 21
Table 2: Sources for data used in the report ............................................................................................. 23
Table 3: Total number of FIT and CAE energy sources in the FAB ............................................................. 33
Table 4: Total number of FIT and CAE energy sources in the FAB ............................................................. 36
Table 5: Number of each type of energy present in the FAB cities. .......................................................... 40
Table 6: A list of the renewable energy sections in the Official Plans of the townships located in the FAB,
and the years they were approved by the Ministry of Municipal Affairs. ................................................. 49

9
1.0 Introduction
Biosphere Reserves are areas of terrestrial and coastal ecosystems that promote
biodiversity conservation and sustainability. Biosphere reserves serve as a way of
demonstrating integrated management of land, water and biodiversity. One of the biggest
challenges that currently exists throughout the world is determining how to maintain healthy
natural systems, while also meeting the material needs and desires of an increasing population.
Currently, representatives from a variety of sectors are working towards developing projects
that relate environmental conservation with economic and social development.
There are 13 designated biosphere reserves in Canada, including the Frontenac Arch
Biosphere (FAB), which was officially recognized in 2002. The FAB is spread over 2700 square
kilometers in the south-eastern portion of the province of Ontario, where the Canadian Shield
and the Adirondack Mountains of New York State connect. This region is ecologically sensitive
due to its vast amount of biodiversity and was designated a biosphere by United Nations
Educations, Scientific and Cultural Organization’s (UNESCO) Man and the Biosphere Program.
The area is a network comprised of conservation organizations, economic and social
development groups, as well as educational and scientific communities (Frontenac Arch
Biosphere, 2012). Together, these groups work towards sustaining the region’s future.
Shoreline and water quality conservation, tourism and recreational development are a few of
the areas where the FAB has focused its attention in order to develop a more sustainable
region.
A State of the Environment (SOE) report is a means of providing accurate, timely and
accessible information on the condition of ecosystems. This information allows the public to

10
become more knowledgeable and assists in priority setting and decision-making related to
environmental issues. The relationship between environmental conditions and socio-economic
factors are established in SOE reports, reflecting the connections that exist between humans
and the environment. SOE’s also report on the effectiveness of current policies and programs
designed to respond to any environmental change, including whether or not environmental
standards and targets are being achieved. Together, the final reports for each of the given
themes in ENSC 430 will construct a SOE report on the FAB that will assess the overall
sustainability of the region.
This project focuses on current renewable energy sources within the FAB region. The
exact locations of the current renewable energy sources in the FAB were determined, as well as
the amount of energy each source is producing. In order to report on the use of renewable
energy sources in the FAB, current feed-in tariff (FIT) and capacity allocated exempt (CAE)
projects, and the potential for new renewable sources in the FAB were explored. This
assessment will aid in the development of methods that can be used to increase the
sustainability of the FAB in the future.

11
2.0 Relationship to Sustainability
Humanity’s dependence on the use of non-renewable energy sources has led to severe
global environmental degradation, which has resulted in economic decline from decreased
biodiversity and productivity of natural ecosystems. Transitioning from current non-renewable
energy sources to renewable sources will reduce negative impacts on the global environment,
while producing several benefits. With current population trends and the increasing demand
for energy, fossil fuels will fail to sustainably meet future energy needs. The implementation of
renewable energy sources is a step towards achieving a more sustainable energy system.
In order to achieve sustainability, it is evident that society must work towards using
more renewable energy sources, which can contribute to a stable economy and a healthy
environment. Sustainable energy will provide energy that meets the needs of the present,
without compromising the ability of future generations to meet their needs. There are many
renewable energy technologies, however for the purpose of this project only hydrological
power, solar power, bioenergy (includes bio-gas, biomass and landfill energy), and wind energy
will be focused on. All of these sources are reliable, inexhaustible and environmentally friendly.
The overall sustainability of the FAB may be increased by pinpointing areas within this
region that are currently using renewable sources. This knowledge will help determine where
future renewable energy opportunities exist. Comparing current renewable sources in the FAB
and in Ontario is important in determining ways in which the FAB can become more sustainable
in the future. It is important to determine if and where the potential for renewable sources
exists, since this could eventually lead to the implementation of new sources, thus increasing
the overall sustainability of the region.

12
The implementation of new renewable energy sources within the FAB can increase
employment opportunities, stimulate the green economy and play a role in the local culture.
Exploring and implementing renewable energy projects will allow the FAB to become a leader in
renewable energy among Canadian biospheres. Most importantly, transitioning from the use of
non-renewable energy sources to renewable energy sources will ensure that energy is available
for future generations to flourish.

13
3.0 Background
3.1 Biosphere Reserves
Biosphere reserves are chosen for their ability “to promote sustainable development
based on local community efforts and sound science” (UNESCO, N.d.). These regions are
expected to fulfill three goals: (1) conservation – to conserve landscapes, ecosystems, species,
and genetic variation; (2) development – to support culturally and ecologically sustainable
human and economic development; (3) logistical – to allow research, monitoring, education,
and information exchange to take place that are related to local, national, and global issues of
conservation and development (FAB, 2012). New and promising practices are oftentimes
‘experimented with’ in biosphere reserves in an attempt to sustainably manage human
activities and nature. They are learning sites that provide tools for countries to promote
sustainable growth. Currently, there are 610 biosphere reserves in 117 different countries
around the world (UNESCO, N.d.).
3.2 The Feed-In-Tariff Program
The Feed-In Tariff (FIT) Program was created by the Canadian government to encourage
the development of renewable energy projects in the country. With the introduction of The
Green Energy and Green Economy Act in early 2009, the development of renewable energy
projects in Ontario has quickened (Ministry of the Environment, 2011). Through the FIT
Program, citizens are paid a guaranteed price to generate renewable energy when under a
contract with the Ontario Power Authority (OPA). The program is divided into FIT and microFIT,
for projects that can generate more than 10 kW or less than 10 kW, respectively (OPA, 2010).

14
Capacity Allocation Exempt (CAE) projects are generally small and directly connected to the
distribution system. The rated generating capacity of these facilities is 500 kW or less, and
depending on their size they are either connected to a line that is below or above 15 kV. Each
contract made for a FIT or CAE project is stored in an online database open to the public. This
information is easily accessible and was the main source of data for this report. Therefore,
when ‘energy sources’ or ‘renewable energy’ are discussed further on in this report, these
terms are only referring to projects listed under FIT or CAE. It should be noted that at the time
of data collection, only the 2009 and 2010 FIT and CAE databases were available. This means
that the conclusions drawn from this report will include all renewable energy sources accepted
under these programs up to 2010.
3.3 Types of Renewable Energy
Renewable energy is recognized as a cleaner alternative to conventional energy sources,
such as coal or fossil fuels, due to the fact that it is generated from natural sources that can
replenish themselves (Ministry of the Environment, 2011). It includes hydrological energy,
bioenergy, wind energy, solar energy, geothermal energy, and ocean energy.
Wind energy relies on the kinetic energy in wind, which can be transformed into
electricity. In areas that have good wind regimes and are in close proximity to existing electrical
grids, turbines can be constructed (oftentimes on ‘wind farms’). Wind speed in these regions
must be high enough to move the large propellers on the turbines, but not strong enough so
cause damage during operation (Natural Resources Canada, 2009).

15
Hydrological energy uses the kinetic energy of naturally flowing water in rivers to
generate hydroelectricity. Turbines are commonly used in this process. Water flow spins these
turbines as water pushes against their blades, causing an attached electrical generator to spin
as well, thus producing electricity (Natural Resources Canada, 2009).
Solar energy harnesses the power of the sun, which gives off radiated heat and light.
This radiant energy can be converted into electricity through solar photovoltaic technology.
This process involves the use of solar cells to perform the conversion (Natural Resources
Canada, 2009).
Bioenergy encompasses a number of processes, such as biogas, biomass, and landfill
sources, that use biomass to produce usable energy. Biomass is referred to as any biological
material in solid, liquid, or gaseous form that contains chemical energy from stored sunlight,
excluding substances that have developed over a long period of time like coal or petroleum
(Natural Resources Canada, 2009).

16
4.0 Goal
The goal of this paper is to investigate the current and future state of energy
sustainability in the FAB, contributing to an ongoing comprehensive state of the environment
reporting initiative for the region.

17
5.0 Objectives
1. Identify and examine large-scale FIT and CAE approved renewable energy projects that
are greater than 10 kilowatts within the FAB.
2. Create a map of all the locations that use renewable energy or are planning to
incorporate renewable energy into their current production in the FAB. Each location
includes information describing the type of energy produced and the kilowatt
production per year. Hydrological power, solar power, wind energy and bio energy were
focused on in this report.
3. Compare renewable energy sources to conventional energy sources in the area.
4. Explore the potential for renewable energy in the FAB. In addition to current and
planned renewable energy, potential locations for renewable energy were proposed
based on the suitability of the region. Suitability was determined based on information
such as the availability of wind and water in the region, as well as other factors.

18
6.0 Scale and Scope
This report incorporates information from the entire FAB region, which includes nine
municipalities within its boundaries. In terms of temporal scale, the current state of renewable
energy in the area was examined. By looking at policies, plans and trends, the potential for
renewable energy was investigated. Only large-scale FIT and CAE approved renewable energy
projects that are greater than 10 kW were analysed in this report. This kilowatt cut-off number
was chosen because if projects that produced less than the indicated amount were included,
driving around the area looking for small-scale ‘off-grid’ projects would be necessary, since
there is very little documentation on them. MicroFIT project databases do not include all small-
scale ‘off-grid’ projects, so if microFIT data was used in this analysis, the results would be
unrepresentative of what is actually present within the FAB. It should be noted that non-
electrical energy sources were not considered in this energy assessment, therefore geothermal
energy is not included in this report.
19
7.0 Indicators
7.1 Number of feed-in tariffs issued by the government
This indicator helps determine the number of FIT and CAE projects issued by the
government in the FAB region. Numbers collected are used to compare the FAB to the province
of Ontario. Using this comparison, the environmental sustainability of the FAB is assessed and
trends or issues are identified. This indicator is indicative of the state to renewable energy
production in the FAB.
7.2 Numbers and types of renewable electrical sources
With a focus on renewable energy sources, it is important to determine the numbers
and types of sources within the FAB. By identifying the numbers and types of energy sources,
trends can be identified within the FAB, which can help in decision-making processes related to
sustainability. This information is easy to interpret, easily communicated and feasible to obtain,
making it a suitable indicator. It is indicative of the state of the current electricity production in
the FAB.
7.3 Energy production from renewable sources
This indicator reflects the amount of electrical energy produced (kW) by renewable
sources within the FAB. In terms of environmental sustainability, this indicator helps gauge the
extent to which renewable sources are contributing to mitigate greenhouse gas (GHG)
emissions. Although the indicator regarding the numbers and types of renewable sources is
useful for showing geographic distribution of different types of energy within the FAB, this
indicator will show the production from each individual source. This focus will help to
20
communicate the renewable energy sustainability from another perspective. This is a state
indicator.
7.4 Number of municipalities that include a sustainable energy section in
their Official Plan/official documents
This indicator is used to show which municipalities and townships consider energy
sustainability an issue of concern. It is also relevant to decision-making regarding these
townships and municipalities. This indicator reflects the response of the FAB to increases in
concern related to energy sustainability.

21
8.0 Methods
The following sections will outline the processes taken to acquire data relating to the
renewable energy sources in Ontario, and more specifically the FAB. In addition, the analysis
and synthesis of the collected data will be discussed.
8.1 Acquisition
The data acquisition stage of this project lasted approximately two months, and resulted
in extensive information that is representative of the renewable energy sources located within
Ontario, and the FAB.
8.1.1 ‘Brainstorming Sessions’
The initial step in this project was to determine potential indicators (Table 1) to be used
in the final report, as well as ensure that a goal and scope were postulated. ‘Brainstorming
sessions’ were an efficient method used to exchange ideas and create a basis of knowledge on
which future research would build upon.
Table 1: List of potential indicators, as discussed in the preliminary stages of data acquisition.
Potential Indicators
Access to renewable energy sources within the FAB
Renewable energy use within other biosphere reserves versus use within the FAB
Amount of renewable energy existing within and outside the FAB
Cost effectiveness of renewable energy versus conventional energy
FAB residents' opinions on renewable energy
Locations of renewable energy sources within the FAB (distribution patterns)
Number of initiatives to implement renewable energy within the FAB
Number of initiatives to promote 'greener' energy use within the FAB
Number of renewable sources contributing to the grid versus ‘off-grid’ within the FAB
Percentage of each type of renewable energy used in the FAB
Social awareness of renewable energy sources within the FAB

22
The initial goal postulated was to determine where all renewable energy sources
currently exist or are being developed within the FAB. Potential for renewable energy
production within the FAB was also to be investigated. At this point, the main and most
important goal was to produce a map pinpointing types of energy (including hydrological, wind,
bio-energy and solar) within the FAB. Kilowatt production data and date of installation were to
be included with each energy source.
At this point in the research process, it was also decided that the scope should be
limited to a certain kilowatt production range in order to focus the project and ensure that it
would be completed within the 2 month research period. The actual range was not set until
later stages in the research process, when it was clear how much data was available for
analysis.
8.1.2 General Research
After deciding on the indicators, goals and scope of the project, it was necessary to
gather background information relating to renewable energy. The following questions are a few
of the many that were to be answered or better understood through conducting general
background research:
What types of energy can be used to gauge the energy sustainability in the FAB?
What are the most viable renewable energy sources in Ontario based on the
geography in this province?
Where does the outline of the FAB lie and how many townships are located within
its perimeter?

23
This stage in the research was essential in proceeding through to individual research, as
it aided each research member in better grasping the complexities associated with energy
sustainability.
8.1.3 Field Study
A field excursion to the FAB allowed our research group to get a sense of what a
‘biosphere’ consists of and helped put the research topic into context.
8.1.4 Individual Research
To ensure that the most efficient data collection was being conducted, the FAB was
divided between research members. The main nine townships located within the FAB (South
Frontenac, Rideau Lakes, Leeds and the Thousand Islands, Athens, Front and Yonge, Elizabeth-
Town Kitley, Brockville, Gananoque, Westport) were divided between research members so
overlapping data would not be an issue. Table 2 shows sources found through individual
research that provide useful and relevant data that are used in the final report.

24
Table 2: Sources for data used in the report.
Type of Source Source
Website Association of Power Producers of Ontario
Website Canadian Solar Industries Association
Website Ministry of Natural Resources
Website Ontario Power Authority
Website Ontario Sustainable Energy Association
Website Paid 4 Power
Website Solar Direct Canada
Website Solar Photovoltaic Canada
Database StatsCan
Website Canadian Wind Energy Association
Website Eastern Ontario Power
Reports ENSC 430 past reports (2009, 2010, 2011)
Website Google maps
Website Hydro One
Website Independent Electricity System Operator
Website Ministry of the Environment
Website Ontario Energy Board
Website Ontario Waterpower Association
Professional Individual
Professor Warren Mabee
Database Queen’s University Library
Website Regional Conservation Authority
Professional Individual
Susan Greaves
The Ministry of Natural Resources website contains a wind map which was used to
assess the potential for wind energy in the FAB, along with the Canadian Wind Energy Atlas
website. The Ministry of Natural Resources website also contains a water resources map which
was used to determine the present-day locations of all hydrological plants within the FAB,
allowing potential locations to be suggested. Google maps was used in an attempt to locate
‘off-grid’ renewable energy locations, however because of the low resolution of the images
over the FAB, this method had to be abandoned.

25
8.1.5 Further Research
Further research suggested that the initial indicators needed to be narrowed down and
made more specific. For example, the ‘amount of renewable energy existing within and outside
the FAB’ indicator was narrowed down to ‘amount of renewable within and outside the FAB,
but within Ontario’. Some indicators were eliminated due to the short period of time allotted to
collect and compile data (ex. ‘off-grid’ sources were eliminated as indicators due to the fact
that it is extremely hard to come across this data without actually driving around the FAB,
which would require a longer-term research period). ‘Social awareness’, ‘access to renewable
energy sources’, and ‘FAB residents’ opinions on renewable energy’ are indicators that were
also eliminated from the preliminary indicator list. It is more important to gather quantitative
data than qualitative data, because the final goal is very much quantitatively based. It is more
time efficient for research to be focused on collecting data that will contribute to the final map
than gather residents’ opinions; however this may be something that is considered in future
years’ reports.
8.1.6 New ‘Main Ideas’
As research progressed, a list of ‘top indicators’ was agreed on, as seen below:
1. Number and type of renewable energy sources in the FAB
2. Number and type of conventional energy sources in the FAB
3. Energy production from renewable and conventional energy in the FAB

26
8.1.7 Group Workshop
An in-class workshop introduced new ideas relating to how the indicators and scope
could be improved, and where no changes were necessary. Specifically, our research group
asked the ENSC 430 class which indicators could be added to the ‘top indicators’ list, as well as
whether the range of scope was too broad or narrow. A high percentage of the class concluded
that ‘feed-in tariffs used by townships/offered by government’ and ‘percentage of renewable
versus conventional energy in the FAB and within Ontario’ should be added to the ‘top
indicators’ list. In addition, most other research groups agreed that the scope was not too
broad or narrow, and therefore no changes would have to be made.
8.1.8 Final Research
The kilowatt cut off was narrowed down to include only FIT programs (>10 kW), at the
suggestion of Warren Mabee, a renewable energy specialist at Queen’s University. This decision
results in a more sound and accurate sustainability assessment, because smaller microFIT
programs may not be representative of what is actually in the FAB (as mentioned before, there
may be smaller ‘off-grid’ sources that are present in the FAB, but not registered under
microFIT). The focus of the final paper was also narrowed down to electricity production only
(i.e. not heat – geothermal), therefore only water, wind, solar, and bio-energy were to be
considered.
8.2 Analysis and Synthesis
Although data was collected from a wide range of sources, the most important raw data
relating to the types and locations of renewable energy sources within Ontario were gathered

27
from Kirby Calvert (Queen’s University), Robyn Budd (Ministry of Energy), and Susan Greaves
(Queen’s University). These three sources provided very similar information (Phase 1, 2, 3 of FIT
data, and Phase 1, 2, 3 of CAE data).
Tables of raw FIT and CAE data were sorted and refined in order to eliminate
unnecessary data that would not be useful to the project. All useful data was placed in an excel
spreadsheet, with headings including ‘project name’, ‘project city’, ‘project source (specific)’,
‘energy type’, ‘nameplate capacity (kW)’, ‘current status’, ‘population’, ‘latitude’ and
‘longitude’. All latitude and longitude values were determined using Google maps, and have
been recorded in decimal degrees which can be readily imported to ArcGIS (a computer-based
mapping program).
A shapefile, which is a geographically referenced file, of the FAB was obtained through
Susan Greaves and was used in ArcGIS to delineate the boundary of the FAB in the final maps.
The compiled excel spreadsheet data was imported into ArcGIS, and using the latitude and
longitude of each energy source, the locations of renewable energy sources were pinpointed.
Once all data was compiled, it was displayed in maps, pie charts, tables and graphs.
Because the collected data is primarily quantitative, it is most effective to use visual forms to
convey findings, which leave little ambiguity and can be easily understood. Displaying
quantitative data in maps, pie charts, tables and graphs also allows it to be easily analysed.
The final maps have different themes, including ‘solar/water/wind/bio-energy
distribution patterns’, ‘total energy distribution in the FAB’, and ‘total energy distribution in
Ontario’. Tables are used to display data, including ‘total number of each type of renewable

28
energy source’, and ‘total renewable energy sources per city’. Pie charts are used to compare
‘types of renewable energy used per township’.
Interpretation of the final maps is based on comparing population with the number of
renewable energy sources or renewable energy capacity (i.e. more renewable energy sources
per person in the FAB than outside the FAB would indicate that this biosphere has a more
sustainable energy system than Ontario, however the opposite shows that there is room for
energy sustainability improvement).
The data presented in this final report is significant because all sources of FIT and CAE
energy projects will have been compiled, synthesized and analysed, therefore past renewable
energy initiatives and present funded programs will be considered (i.e. no data will slip through
the cracks). Overall, because the data collected is primarily quantitative, it will not be hard to
evaluate its significance – unlike projects that may be more qualitatively based. Qualitative
data can be influenced by bias whereas quantitative data requires less personal analysis that
directly affects the outcome.
29
9.0 Assessment
All of the data collected during the acquisition stage of this project was synthesized in a
way that would be easily understood and analysed. The main methods of assessment used
were maps, pie charts and tables. Using these three methods, the data was analysed in a way
that would answer the questions posed by the indicators of sustainability. In order to provide a
sustainability comparison with the FAB, renewable energy sources were plotted throughout
Ontario as well as within the FAB. This allowed the differences in distribution and density of FIT
or CAE renewable energy sources in Ontario and in the FAB to be determined. Population was
used in place of area to compare Ontario with the FAB, because much of Ontario’s area is not
populated which would result in a skewed interpretation of energy sustainability.
It should be noted that the main mode of assessment used in this analysis was mapping
of renewable energy sources, which would provide an idea of how sustainable the energy
system is. There is no indication of whether or not the energy produced in the FAB is actually
used within its boundaries, or if the energy produced is transported out. Despite this fact, the
number of renewable energy sources in the FAB will act as a sustainability indicator for the
purposes of this project.
The sustainability indicators that were determined in the initial stages of this project
were placed into three broad themes – ‘government issued feed-in tariffs and capacity
allocated exempt projects’, ‘renewable energy’, and ‘energy production’. It is under these three
themes that the sustainability of the FAB will be determined.

30
9.1 Government Issued Feed-in Tariffs and Capacity Allocated Exempt
Projects
Feed-in tariff programs are designed to accelerate the investment in renewable energy
systems. Since they are offered through governments, they not only reflect the willingness of
residents and businesses to install renewable energy sources, but also reflect governmental
support. The number of feed-in tariffs and capacity allocated exempt projects issued by the
Ontario government was used as an indicator to assess this theme. These numbers will reflect
the ability of Ontario and the FAB to install renewable sources and will also reflect the
awareness of FIT and CAE programs in these regions. This information can provide a
comparative tool for similar areas in Canada and in other countries when measuring
sustainability.
9.1.1 Number of feed-in tariffs and capacity allocated exempt projects issued by the
government
Research shows that there are many cities throughout Ontario that support FIT and/or
CAE energy projects. This indicates that there is an overall general awareness of these programs
in Ontario, and also shows that there is a high level of support for these programs by residents
and businesses. Figure 1 shows the cities where there are FIT or CAE projects present in

31
Ontario.
Figure 1: Locations of FIT and CAE renewable energy sources in Ontario cities. Note that the dots show the locations of the energy sources, but do not represent the number of energy sources in each city.
It was found that the overall density of renewable energy sources in Ontario is highest in
south-eastern Ontario. This is likely due to the fact that this is the most highly populated area of
the province. There is a sparse distribution of renewable energy sources in southern and south-
western Ontario, however there are no FIT or CAE renewable energy sources in northern
Ontario. The FAB lies within the south-eastern portion of Ontario where the density of FIT and
CAE energy sources is highest.

32
Figure 2 shows the cities where there are FIT or CAE projects present in and around the
FAB. As can be seen in Figure 2, there are 10 cities in the FAB that support FIT or CAE projects.
These cities include Brockville, Seeley’s Bay, Forfar, Rideau Lakes, Joyceville, Westport,
Keelerville, Elgin, Gananoque, and Forest. Table 3 shows the number of renewable energy
sources under FIT or CAE in the FAB.
Figure 2: Locations of FIT and CAE renewable energy sources in south-eastern Ontario. Note that the dots show the locations of the energy sources, but do not represent the number of energy sources in each city.

33
Table 3: Total number of FIT and CAE energy sources in the FAB.
City Number of FIT and CAE Sources
Brockville 9
Seeley's Bay 3
Forfar 1
Rideau Lakes 3
Joyceville 1
Westport 2
Keelerville 1
Elgin 1
Gananoque 2
Forest 2
Brockville, being the highest populated city that contains FIT or CAE energy sources in
the FAB, contains 9 renewable energy sources. Other cities within the FAB contain lower
numbers of renewable energy sources in comparison. Seeley’s Bay and Rideau Lakes have three
renewable energy sources. Three cities contain 2 renewable energy sources while four hold
only 1. The presence of these generation sites shows that renewable energy sources can be
implemented in these areas, and that they hold potential for future development.
Analysis of the number of FIT versus CAE energy sources within Ontario can be used to
determine the number of ‘easily connected’ renewable energy sources (CAE) that were
implemented throughout Ontario compared to those sources that were more difficult to
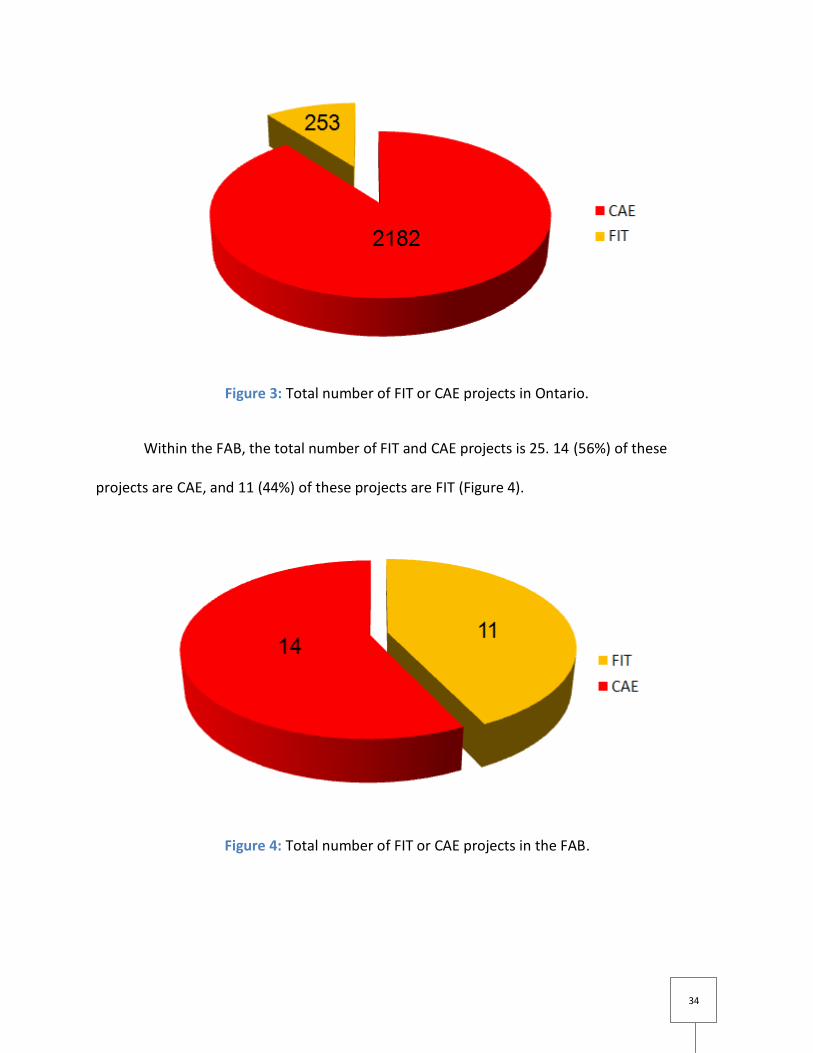
connect (FIT) to the energy system. The total number of FIT and CAE projects in Ontario is 2435.
2182 (90%) of these projects are capacity allocation exempt projects, whereas 253 (10%) are
feed-in tariff projects (Figure 3).
34
Figure 3: Total number of FIT or CAE projects in Ontario.
Within the FAB, the total number of FIT and CAE projects is 25. 14 (56%) of these
projects are CAE, and 11 (44%) of these projects are FIT (Figure 4).
Figure 4: Total number of FIT or CAE projects in the FAB.

35
Figure 5 shows the locations where there are FIT or CAE projects in the FAB, as well as
the number of FIT or CAE in each city. Table 4 shows the number of FIT or CAE energy sources
within the FAB.
Figure 5: Locations of FIT and CAE projects in the FAB. The pie charts indicate the proportion of each type of project in each city, and the numbers represent the quantity of each type of project.

36
Table 4: Total number of FIT and CAE energy sources in the FAB.
City FIT CAE
Brockville 2 7
Seeley's Bay 2 1
Forfar 1 0
Rideau Lakes 3 0
Joyceville 0 1
Westport 0 2
Keelerville 0 1
Elgin 1 0
Gananoque 1 1
Forest 1 1
The results show that there is a higher proportion of CAE projects than FIT projects in
Ontario. The FAB shows similar results, however the proportion of CAE and FIT projects are
relatively equal. Using the population of the FAB which is approximately 70,000 (note: there is
no up-to-date population for this area, therefore an estimate by Don Ross was used), it was
determined that there is one renewable energy source for every 2800 people living in the FAB.
This same calculation was made for Ontario, which has a population of 12,851,821, and it was
found that there is one renewable energy source for every 5278 people living in Ontario
(Google, 2011).
Calculation for the FAB:
37
Calculation for Ontario:
Although the FAB is much less populated than some of the major districts in south-
eastern Ontario, it has a higher number of renewable resources per person. Based on these
findings, CAE projects are more commonly implemented in Ontario and the FAB, which
demonstrates that present and future sustainability is more reliant on easily connected sources
(CAE) as opposed to FIT projects. Due to the higher ratio between population and number of
renewable energy projects in the FAB, this region has the potential to phase out conventional
energy sources, moving towards the implementation of a more sustainable energy system.
These ratios and comparisons would indicate that the FAB is more sustainable than Ontario as a
whole.
9.2 Renewable Energy
This theme was assessed by determining the numbers and types of renewable energy
sources in Ontario and in the FAB. By determining the number of each type of source present in
both regions, the potential for untapped sources was examined, and the current energy
diversity in each region was assessed.

38
9.2.1 Number and type of renewable electrical energy sources
The total number of FIT and CAE energy sources within Ontario is 2435. Of all the FIT
and CAE energy projects in Ontario, 92% are solar, 3% are wind, 2% are water, 2% are bio-gas,
0.5% are landfill, and 0.5% are biomass (Figure 6).
Figure 6: Quantities and types of FIT and CAE energy projects in Ontario.
In the FAB, there are a total of 25 FIT and CAE energy sources. 76% of the energy
sources are solar, 16% are water, 4% are wind, and 4% are bio-gas (Figure 7).

39
Figure 7: Quantities and types of FIT and CAE energy projects in the FAB.
Figure 8 shows the locations of all of the FIT and CAE energy sources within the FAB, as
well as the number of each type of energy source in each location. It can be seen that most
renewable energy sources are situated on the outer perimeter of the FAB while few are located
within the interior. Table 5 shows the types of energy sources per city in the FAB.

40
Figure 8: Quantities and types of FIT or CAE energy sources in and around the FAB. Note that the pie charts represent the proportions of each type of energy present.
Table 5: Number of each type of energy present in the FAB cities.
City Bio-gas Biomass Solar Wind Landfill Water
Brockville 0 0 9 0 0 0
Seeley's Bay 1 0 0 0 0 2
Forfar 0 0 1 0 0 0
Rideau Lakes 0 0 3 0 0 0
Joyceville 0 0 1 0 0 0
Westport 0 0 2 0 0 0
Keelerville 0 0 1 0 0 0
Elgin 0 0 0 0 0 1
Gananoque 0 0 1 0 0 1
Forest 0 0 1 1 0 0

41
When comparing the renewable sources in Ontario to those in the FAB, it is clear that
solar energy is the most common renewable energy source under FIT and CAE projects. The
second most common source in Ontario is wind, whereas it is water in the FAB. This would
indicate that the FAB and Ontario have very similar proportions of each type of energy.
However, the data also shows that Ontario has greater energy diversity than the FAB. This could
be attributed to the larger area of Ontario, and thus the larger number of renewable sources
that are viable in this region. However, the sources of renewable energy that the FAB does not
currently have (i.e. biomass and landfill energy) are definitely viable within the FAB.
Implementation of these types of energy could increase the diversity of the energy sources in
the FAB and therefore increase its sustainability. Overall, the results under this theme show
that solar is likely the most effective renewable energy source in Ontario, as it is the most
commonly implemented, and that the FAB has a lower energy diversity than Ontario.
A higher energy diversity is more favourable because of the issues that surround
renewable energy sources and reliability. Certain renewable energy systems can only operate
under certain conditions. For example, solar energy only produces electricity during the
daytime when the sun is shining and unobstructed. In Ontario, it has been found that solar
panels produce more energy during the summer (Rombro, 2011). If a greater diversity of
renewable energy sources is present, issues of reliability will be greatly reduced by providing
more options for energy production throughout the year.

42
9.3 Energy Production
The final theme that will be presented is ‘energy production’. In order to gauge the
energy production sustainability in the FAB, the capacity of FIT and CAE energy sources in
Ontario and the FAB were determined. Because it was difficult to find the actual amounts of
energy that each source produces, the capacity was used. Nameplate capacity values were
included in all FIT and CAE data spreadsheets obtained through the Ontario Power Authority
(OPA), and are defined as the maximum energy level that a source can output when it is
working at full efficiency. These values do not necessarily represent the energy production of
an energy source at all times, as often sources do not operate at maximum capacity, however
they provide a readily accessible metric to compare different energy sources in various regions.
9.3.1 Energy production from renewable energy sources
The total energy capacity in Ontario through FIT and CAE energy sources is 4,780,449
kW. 66% of the energy capacity is from wind energy, 28% is from solar energy, 5% is from water
energy, 0.5% is from bio-gas, 0.3% is from biomass energy, and 0.2% is from landfill energy
(Figure 9).

43
Figure 9: Values (kilowatts) and proportions of energy capacity per type of energy source in Ontario.
The total energy capacity in the FAB is 156,788 kW. 64% of the energy capacity is from
wind energy, 33% is from solar energy, 2.7% is from water energy, and 0.3% is from bio-gas
(Figure 10).
Figure 10: Values (kilowatts) and proportions of energy capacity per type of source in the FAB.

44
The energy capacity for each energy type was mapped throughout Ontario, and from
Figure 11, it can be seen that in southern-eastern Ontario there is a great diversity of renewable
energy capacities in each city. Appendix A shows separate capacity maps for each energy type
in Ontario.
Figure 11: Total energy capacity (kilowatts) for each type of energy source in Ontario cities.

45
Similar to Figure 11, Figure 12 shows the energy capacity per each type energy source in
the FAB. Forest, which contains a wind energy source, has the highest energy capacity in the
FAB – at 100,100 kW. Appendix B shows separate capacity maps for each energy type in the
FAB.
Figure 12: Total energy capacity (kilowatts) for each type of energy source in the FAB cities.

46
Figure 13 shows the total energy capacity per city in Ontario where there are FIT or CAE
energy sources present. It can be seen from Figure 13 that in southern-eastern Ontario there is
a great diversity of renewable energy capacities in each city. Energy sources that are present in
southern and south-western Ontario have lower total energy capacities per city.
Figure 13: Energy capacity (kilowatts) per city in Ontario. Note that the dots represent the total energy capacity per city, and do not represent the total capacity per each source.
Figure 14 is the total energy capacity per city in the FAB where there are FIT or CAE
energy sources present. Compared to energy capacities per city in Ontario, the energy
capacities in the FAB are much smaller. Most energy capacities fall into the 22-16,500 kW or

47
16,501-69,000 kW categories, which are the two lowest ranges for energy capacities per city in
Ontario.
Figure 14: Renewable energy capacity (kilowatts) per city in the FAB. Note that the dots represent the total energy capacity per city, and do not represent the total capacity per each source.
When comparing the energy capacity in Ontario with that in the FAB, it can be seen that
even though solar is the most common energy source in both regions, wind energy has the
most capacity to produce larger amounts of energy. In Ontario, when considering the total
energy capacity in all cities combined, there is a capacity to produce 0.37 kW of energy per
person who resides in Ontario. In the FAB, there is a capacity to produce 2.24 kW of energy per
person who resides there. This is a clear indication that the FAB holds more renewable energy

48
capacity per person than Ontario as a whole. Renewable energy production can be used in
place of conventional sources. Therefore, if more renewable energy can be produced per
person, sustainability will be increased.
9.4 Sustainability Initiatives
9.4.1 Number of municipalities that include a sustainable energy section in their Official
Plan/official documents
The Provincial Policy Statement (PPS) of Ontario is composed of a number of statements
that describe the government’s policies on land use planning and development. It is often used
by municipalities to develop their Official Plan (OP). An OP is designed to lay out policies that
guide public and private interests within a municipality to ensure good development under the
most desirable conditions. It establishes policies to govern land use and development, and
identifies public actions which need to be taken to support private development (Ontario
Ministry of Municipal Affairs and Housing, 2010). It can cover topics ranging from road
infrastructure to community growth and improvement, to the location of housing and shops.
OPs are mandatory and must be approved by the Ministry of Municipal Affairs (MMA) before
they can be put into place, but a section on renewable energy does not need to be included
within the Plan.
Renewable energy projects can oftentimes take up large plots of land, and therefore
must involve good land planning. The location of these facilities is integral to the amount of
energy they produce and who may receive this output. Therefore, it is extremely important that
renewable energy sections are included in the OP of a township that is striving for sustainable
development.

49
There are nine townships which fall within the FAB’s boundaries. The OP of each
acknowledges sustainable development. However, only a fraction of them include statements
pertaining to renewable energy sources specifically. As seen in Table 6, five of the four
municipalities in the FAB do not mention renewable energy to a suitable degree. Front of
Yonge, Gananoque, Athens, and Brockville are the four townships that have included renewable
energy sections in their OPs. They were approved by the MMA in the years 2006, 2009, 2010,
and 2012, respectively, whereas the other OPs were accepted in the year 2006 or earlier.
Judging by this pattern, it seems that the majority of the OPs that have renewable energy
sections have been more recently created than those without. Perhaps a trend is occurring
where townships are beginning to realize the importance of incorporating renewable energy
into their official documents.
Table 6: A list of the renewable energy sections in the Official Plans of the townships located in the FAB, and the years they were approved by the Ministry of Municipal Affairs.
Township Year Renewable Energy Sections and
Statements
South Frontenac 2003 None
Rideau Lakes 2004 None
Elizabethtown-Kitley 2005 None
Leeds & the Thousand Islands 2006 ‘Renewable energy systems’; defined in Definitions section but not used in report
Front of Yonge 2006 Energy Policy
Westport 2006 None
Gananoque 2009 Energy section; Energy Efficiency section
Athens 2010 Energy section included in Objectives of the Plan; Energy Policy
Brockville 2012 Green Energy & Green Employment section; Energy Efficiency & Conservation section

50
All nine municipalities’ OPs stated or implied that their vision was to encourage
sustainable growth of their township. For example, under ‘Objectives of the Plan’, the township
of Rideau Lakes stated: “To preserve and enhance the rural, recreational and vacation-oriented
flavour of the Township, while providing opportunities for controlled, environmentally-
sustainable growth, particularly within the tourism sector” (Novatech, 2004). The OP of Leeds
& the Thousand Islands includes under ‘Goals’: “The overall goal of this Official Plan is to satisfy
the community’s economic needs without degrading the environment, thereby achieving
sustainable development” (Richards, 2006). These sorts of statements could imply the
incorporation of renewable energy, but the term is never specifically referred to or elaborated
on in the documents.
Brockville seems to be the most advanced when it comes to renewable energy
initiatives, perhaps because it is the municipality with the largest population in the FAB. Its OP
is also the most recently released, having been accepted by the MMA on February 9, 2012. It
includes sections not only on ‘Green Energy’, but ‘Green Employment’ and ‘Energy Efficiency’ as
well. The city also has a link on its main homepage that offers a list of green technology energy
projects that are either in operation, have been proposed or are in the process of being built,
alongside other initiatives and programs that support sustainability.
Of nine municipalities, only four have deemed it important to plan for the
implementation of renewable energy sources by including relative sections in their OPs. This
ratio demonstrates that the majority of the FAB’s townships do not have a strategy which
involves land use and renewable energy development. This is important to consider because
the inclusion of a renewable energy section within a township’s official documents reveals that

51
it views the addition of renewable energy sources as a way to encourage sustainable
development. It can also increase the awareness of the importance of sustainable practices and
energy systems. By not including these sections, a municipality appears to have no plans for
increasing renewable energy production in its boundaries, and therefore cannot reach its
potential for sustainable development.

52
10.0 Assessment – Concluding Remarks
Overall, the FAB has a higher number of renewable energy sources and a higher energy
capacity per person than Ontario. The FAB also has a lower energy diversity, however this can
be easily changed with future implementation of new energy sources. Including renewable
energy sections in the OP or official documents of a township may aid in the process of creating
these new sources. Four of the nine townships in the FAB include statements on renewable
energy already, which suggests that they are in this process. All together, this data would
indicate that the FAB is more sustainable than Ontario. It should be considered that the
renewable energy sources within the FAB are concentrated on its perimeter, which would
indicate that overall, the FAB may not be as sustainable as it appears. It should be noted again
that smaller sources (i.e. microFIT) were not examined in this study due to the inaccessibility of
data, therefore there may be smaller projects that exist in the interior of the FAB that were not
considered.
53
11.0 Opportunities
There will always be ways in which the FAB can improve sustainability. This can be done
by increasing the development of renewable energy projects in the region. This section will
investigate and suggest areas where the FAB can improve on its renewable energy generation
while considering the unique environmental, social and economic conditions within the region.
Currently, energy output within Ontario is dominated by nuclear power (Figure 15),
which contributes 59.9% to the total energy generated in the province (IESO, 2012). Coal and
gas further contribute 2.7% and 14.7%, respectively (IESO, 2012). This means that 74.3% of the
total energy generated within the province of Ontario comes from non-renewable sources. The
remaining 25.6% of energy generated comes from renewable energy sources like hydrological,
solar, wind and bioenergy (IESO, 2012). The bulk of this percentage however, comes from
hydrological power (22.2%) (IESO, 2012). The renewable energy production picture is similar
within the FAB boundaries. Although it is positive that approximately a quarter of the total
energy output in Ontario comes from renewable sources, there is still room to increase the
contribution, as well as the diversity, of renewable sources. This is also true for energy
generation within the FAB boundaries. Although renewable energy generation within the FAB is
considerable and relatively well varied, there can be improvements made with all renewable
sources, particularly with solar and bioenergy projects.

54
Figure 15: Energy Output by Fuel Type in Ontario (IESO, 2012)
11.1 Hydrological
There are areas in the FAB that can be used to further generate alternative energy.
Hydroelectric power is an example. There are currently 4 water generators within the
boundaries of the FAB, under the FIT program, with a capacity of 4200 kW. One of these is the
Gananoque Generating Station, which is located on the Gananoque River and generates
approximately 2781 MWh of renewable energy every year (OPA, 2010). This is enough energy
to power approximately 300 homes over the course of a year.
The Ministry of Natural Resources has identified 24 areas as potential hydroelectric
power generation sites in the FAB. One of these sites is located within a protected area, the
Charleston Lake Provincial Park. The remaining 23 are direct site release.
Although there are 24 areas that have been identified as being suitable for energy
generation (Figure 16), project development in the FAB has to be particularly considerate with

55
regards to the environment. Hydroelectric generation provides non-polluting power with low
maintenance costs, however there are several drawbacks. These drawbacks include
environmental issues associated with hydroelectric damming including habitat destruction and
water quality issues. Another significant drawback is the considerable start up costs.
Hydroelectric generating stations tend to be federally or privately owned, therefore it is
not likely that the FAB has the capability to request the construction of hydroelectric generating
stations. Although there is some potential in the FAB region for hydroelectric generation, due
to the drawbacks stated earlier, the FAB’s efforts in promoting renewable energy systems
would be more effective for other types of sources.
Figure 16: Map showing existing waterpower generation stations in and around the FAB and potential hydroelectricity sites in the region (Ministry of Natural Resources, 2012).
56
11.2 Wind
Wind power is a very popular and productive source of electricity. Within the FAB there
is only one wind power generating station in Forest with a 100,000 kW capacity. Although there
is some potential for increasing this production, wind turbines must be placed in specific areas
to be effective and efficient.
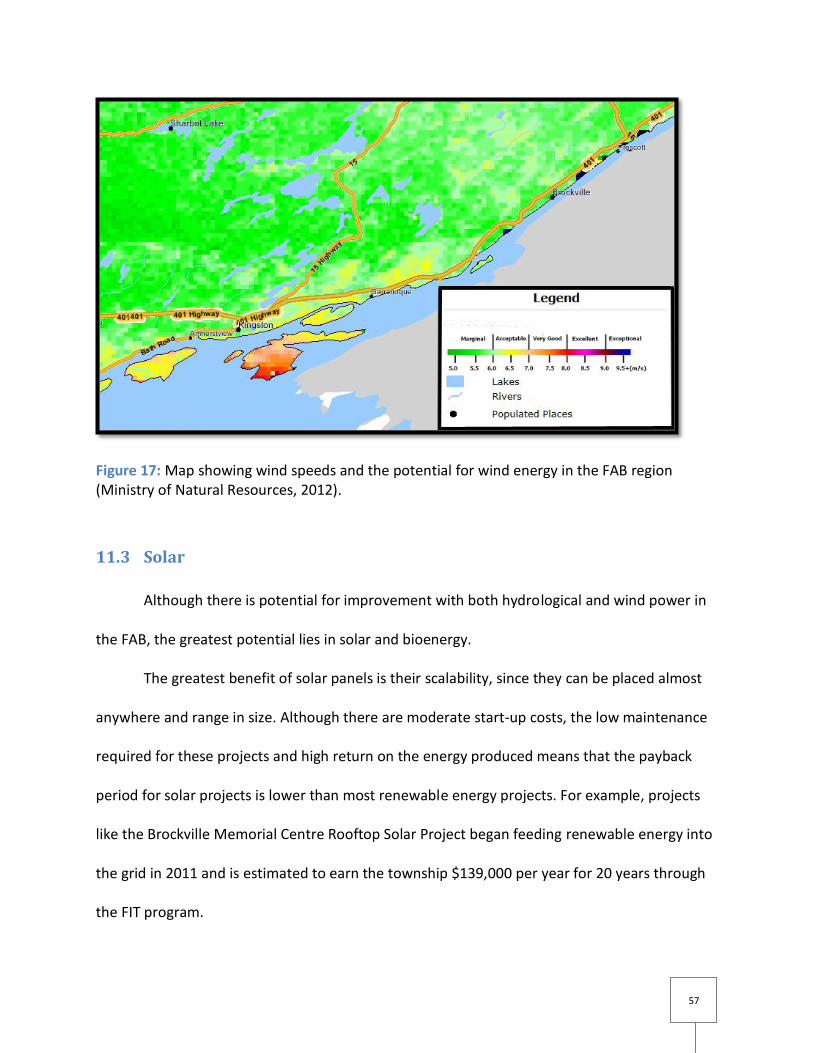
By looking at the map of wind speeds from the Ministry of Natural Resources (Figure
17), it can be seen that the FAB region consists of areas with mostly “marginal” wind speeds.
This does not necessarily mean that wind turbines should not be placed in these areas, however
they might not be entirely effective. The area surrounding Gananoque has wind speeds that are
considered “acceptable” (Ministry of Natural Resources, 2012). Similarly, the area around
Brockville has wind speeds that are considered “exceptional” (Ministry of Natural Resources,
2012).
From a purely energy generation standpoint, the implementation of wind sources is
feasible. However, in an area such as the FAB which attempts to promote economic,
environmental and social sustainable development, the impact of wind projects must be
considered in its entirety. There are definitely some environmental issues associated with wind
turbines in terms of bird population disturbance as well as social impacts. Power generation
from wind turbines can also be slightly erratic. Figure 17 shows suitable areas for wind
generation development. For the FAB to achieve its mandate of sustainable development, there
should be extensive environmental, economic and social assessments as well as appropriate
consultation processes when a wind project is proposed.
57
Figure 17: Map showing wind speeds and the potential for wind energy in the FAB region (Ministry of Natural Resources, 2012).
11.3 Solar
Although there is potential for improvement with both hydrological and wind power in
the FAB, the greatest potential lies in solar and bioenergy.
The greatest benefit of solar panels is their scalability, since they can be placed almost
anywhere and range in size. Although there are moderate start-up costs, the low maintenance
required for these projects and high return on the energy produced means that the payback
period for solar projects is lower than most renewable energy projects. For example, projects
like the Brockville Memorial Centre Rooftop Solar Project began feeding renewable energy into
the grid in 2011 and is estimated to earn the township $139,000 per year for 20 years through
the FIT program.

58
Limited environmental impacts and quick return on investments make solar panels a
feasible and appealing option in regard to sustainability. The FAB should focus its efforts
towards promoting small-scale, residential solar panels as well as larger-scale, commercial solar
panels to maximize sustainable renewable energy generation in the region.
11.4 Bioenergy
Another feasible and easily implemented renewable energy source for the FAB is
bioenergy. Bioenergy generators are often located on farms or any area that has organic
materials available for fuel. Ledgecroft Farms, the only bioenergy generating project in the
FAB, has a capacity of 500 kW.
Bioenergy generation uses waste materials ranging from manure to leftover food from
restaurants. With large agricultural areas, these facilities could be very effective and an efficient
way to increase renewable energy generation in the FAB. Another positive attribute of bio-gas
generation is the minimal environmental and spatial footprint. This makes bioenergy projects
ideal for an area like the FAB, which must be particularly considerate in regard to the
environment.
The greatest restriction with these facilities are the considerable start-up costs. These
costs can be lowered with multiple subsidies associated with bioenergy generation. Ledgecroft
Farms received approximately $500,000 worth of subsidies from the Ministry of Agriculture,
Food and Rural Affairs. There are also subsidy programs available that promote renewable
energy generation on farms, making the start up process less of an economic burden. If these
costs can be surmounted, the FAB region would be suited for such facilities. The ideal

59
conditions in the FAB offer an excellent opportunity for the region to become a pioneer in
bioenergy generation.
11.5 Initiatives
The FAB should implement a program where it is mandatory to include a sustainable
energy section in each township’s Official Plan. Signing up for the program would have to be
voluntary, but once enrolled it would be mandatory to include a sustainable energy section in
the OP. This will push townships to consider the value of renewable energy and discover the
benefits it can bring not only to them, but to the FAB as well. If all nine townships within the
FAB work towards building more renewable energy sources, not only will this increase the
sustainability of the area as a whole, but may help in bringing communities closer.
Although the FAB holds no authority or governance and cannot create or implement
laws or rules, the townships that are included within its boundaries have willingly committed to
being part of the FAB Network. This agreement includes an understanding of the environment
and a dedication to sustainable development. These townships were brought together once
through their commitment to the FAB and what it represents, so sustainability clearly has an
influence on their decision-making processes. 4 of the 9 townships in the FAB already include a
section on renewable energy in their OP. If these townships signed up for a program like
suggested above, it may push the remaining few to do the same.

60
12.0 Conclusions
Based on the FIT and CAE data analysed, the number of sources per person and the
capacity of energy per person are higher in the FAB than in Ontario. This would indicate that
the FAB has higher energy sustainability than Ontario; however it needs to be considered that
only FIT and CAE data were compiled in this analysis, therefore renewable energy data from
other sources are not represented. Despite this fact, the data used in this report is a good
representation of the sustainability in the FAB because FIT and CAE projects require the
willingness of government, resident and businesses to support more sustainable energy
systems. Government involvement is crucial to build a more sustainable future. It is the
collaboration and involvement of these bodies that forms the core of present day and future
sustainability.
The diversity of the renewable energy sources in the FAB is lower than that of Ontario,
which indicates that the FAB could benefit from implementation of different energy types. The
development of landfill and biomass energy would increase the diversity of energy types in the
FAB to the level of Ontario.
Four out of nine municipalities in the FAB include a sustainable energy section in their
Official Plan or official documents. Therefore, roughly half of the municipalities in the FAB show
that they are planning to improve their sustainability through the construction of renewable
energy projects. This number should be increased if the sustainability of the FAB is to improve
in the future.

61
There are many opportunities to implement new renewable energy sources in the FAB.
These new energy sources would include solar, wind, hydrological, and bioenergy. Based on the
analysis, there is potential to improve with each of these listed energy types, however solar and
bioenergy have the greatest potential to increase the sustainability of the FAB. Initiatives can
also be improved with an increase of municipalities’ OPs and official documents that include
sustainable energy sections. This can be done through a voluntary program issued by the FAB
that ensures these sections are included.
Overall, the sustainability of the FAB is good. However, it can be improved upon with
future adjustments to the energy system that increase reliance on renewable energy instead of
conventional energy. Changes such as these are necessary in moving society toward a more
sustainable future.
62
13.0 Future Research
Due to time constraints, many of the initial indicators postulated for this project had to
be abandoned. It is suggested that future ENSC 430 groups expand on the energy sustainability
assessment of this report by determining the number, type and energy production or capacity
of conventional energy sources in Ontario and in the FAB. This could be fulfilled by contacting
the Ontario Power Authority, and large power distribution businesses, such as Hydro One. In
addition, information provided by the Independent Electricity System Operator (IESO) would be
extremely beneficial, as they provide maps for conventional energy sources on their website;
however they do not provide production or capacity values per facility present in Ontario.
Therefore, this information would have to be determined by contacting one of their
representatives. This should be done as early as possible in the research period in order to
ensure the data is collected. The indicator should be used as a comparison against the
renewable electrical production sources in the FAB. By comparing the sources of conventional
and renewable sources, this would help to compare the FAB’s energy profile with others from
provinces or municipalities. These comparisons can aid in identifying the state of sustainability
in the FAB, relative to other regions, in terms of energy production. It would also be beneficial
to examine small-scale ‘off-grid’ projects in the FAB. This could be done through the use of
surveys and community workshops to determine a greater picture of small-scale, off-grid
residential renewable energy sources.
Due to complications with ArcGIS and time constraints, specific locations of energy
sources within the FAB could not be plotted. However, this is definitely feasible for future
groups and should be investigated. Becoming familiar with ArcGIS or another mapping

63
program would be extremely helpful and should be understood in the primary stages of
research. FIT, microFIT, and CAE spreadsheets include ‘project names’ that can be used to find
the exact location (latitude and longitude) of each energy source in their respective cities,
which can then be uploaded into ArcGIS or another mapping program. Mapping these specific
locations would give a detailed representation of the density and distribution of renewable
energy sources in the FAB. These patterns can then be used to assess sustainability in greater
detail.
Other indicators that should be examined in future reports are listed in Table 1.
Although some of these indicators were used in this report, others were not. Therefore, they
are available for analysis by future ENSC 430 groups.

64
14.0 Definitions
Biosphere Reserves are areas of terrestrial and coastal ecosystems that promote biodiversity
conservation and sustainability. They serve as a way of demonstrating integrated management
of land, water and biodiversity through goals concentrated on conservation, development, and
logistics.
Capacity Allocation Exempt (CAE) projects are a subdivision under the FIT program that
includes renewable energy sources that are small (< 500 kW generating capacity) and directly
connected to the distribution system.
MicroFIT projects are a section of the FIT program that include renewable energy sources that
have a generating capacity of less than 10 kW.
Nameplate capacity is the maximum energy level that an energy source can output when it is
working at full efficiency. This amount is not always reached during the total operational
period due to limiting factors.
Official Plan (OP) is a document written by a municipality that outlines policies to guide public
and private interests to ensure good development under the most desirable conditions,
including those that govern land use and development. It must be reviewed and approved by
the Canadian government before it can be put into place.
Renewable Energy is considered a sustainable source of energy that is obtained from natural
resources such as wind, sunlight, or water, which can be replenished or renewed within a
lifespan. The negative effects from its production are considered much lower than those
produced by conventional energy sources.
The Feed-In Tariff (FIT) Program is an initiative that promotes the development of renewable
energy projects in Canada by paying citizens who generate renewable energy. FIT projects
generally have a generating capacity of more than 10 kW.

65
15.0 List of Abbreviations
ArcGIS Arc Geographic information system
CAE Capacity Allocation Exempt
ENSC Environmental Science
FAB Frontenac Arch Biosphere
FIT Feed-In Tariff
GHG Greenhouse Gas
IESO Independent Electricity System Operator
KW Kilowatt
MWh Megawatt per hour
MMA Ministry of Municipal Affairs
OP Official Plan
OPA Ontario Power Authority
PPS Provincial Policy Statement
SOE State of the Environment
UNESCO United Nations Educational, Scientific, and Cultural Organization

66
16.0 References
Frontenac Arch Biosphere. (2012). About Biosphere Reserves. Retrieved from
http://www.fabr.ca/About%20our%20Biosphere%20Reserve.htm. Accessed on
November 15, 2012.
Frontenac Arch Biosphere Reserve. (2012). Biosphere Background. Retrieved from
http://www.fabr.ca/Biosphere%20Background%20part%201.htm. Accessed on
November 4, 2012.
Frontenac Arch Biosphere Reserve. (2012). Welcome. Retrieved from http://www.fabr.ca/.
Accessed on November 20, 2012.
Google. (2011). Ontario. Retrieved from
https://www.google.ca/search?q=population+of+ontario&ie=utf-8&oe=utf-
8&aq=t&rls=org.mozilla:en-US:official&client=firefox-a. Accessed on November 28,
2012.
IESO (2009). The Ontario Reliability Outlook. Retrieved from
http://www.ieso.ca/imoweb/pubs/marketReports/ORO_Report-Dec2009.pdf. Accessed
on November 3, 2012.
IESO (2012). 18-Month Outlook from September 2012 to February 2014: An Assessment of the
Reliability and Operability of the Ontario Electric System. Retrieved from
http://www.ieso.ca/imoweb/pubs/marketReports/18MonthOutlook_2012sep.pdf.
Accessed on November 3, 2012.
Ministry of Natural Resources. (2012). Ontario’s Renewable Energy Atlas and Prepared Wind
Maps. Retrieved from

67
http://www.mnr.gov.on.ca/en/Business/Renewable/2ColumnSubPage/276957.html.
Accessed on November 1, 2012.
Ministry of the Environment. (2011). Provincial Approvals for Renewable Energy Projects.
Retrieved from http://www.ene.gov.on.ca/stdprodconsume/groups/lr/@ene/
@resources/documents/resource/std01_079527.pdf. Accessed on November 20, 2012.
Ministry of the Environment. (2011). Renewable Energy. Retrieved from
http://www.ene.gov.on.ca/environment/en/subject/renewable_energy/index.htm.
Accessed on November 25, 2012.
Ministry of Municipal Affairs and Housing. (2010). Land Use Planning: Official Plans.
Retrieved from http://www.mah.gov.on.ca/Page1759.aspx. Accessed on November 3,
2012.
Ministry of Municipal Affairs and Housing. (2005). Provincial Policy Statement. Retrieved from
http://www.mah.gov.on.ca/Asset1421.aspx. Accessed on November 3, 2012.
Natural Resources Canada. (2009). About Renewable Energy. Retrieved from
http://www.Natural Resources Canadaan.gc.ca/energy/renewable/1297. Accessed on
November 26, 2012.
Novatech Engineering Consultants Ltd. (2004). Official Plan of the Township of Rideau Lakes.
Retrieved from http://www.twprideaulakes.on.ca/plan/trl-official-plan-2004-web.pdf.
Accessed on November 14, 2012.
Ontario Power Authority. (2010). Background. Retrieved from
http://fit.powerauthority.on.ca/background. Accessed on November 17, 2012.

68
Ontario Power Authority. (2010). Capacity Allocation Exempt Projects. Retrieved from
http://fit.powerauthority.on.ca/capacity-allocation-exempt-projects. Accessed on
November 5, 2012.
Ontario Power Authority. (2010). FIT Program, Introduction. Retrieved from
http://fit.powerauthority.on.ca/introduction. Accessed on November 5, 2012.
Richards, J.L. & Associates. (2006). Official Plan of the Township of Leeds and the Thousand
Islands. Retrieved from http://www.starlightcascade.ca/rl/officialplan-leeds.pdf.
Accessed on November 18, 2012.
Rombro. (2011). FAQs. Retrieved from http://www.rombrosolar.com/Solar_Energy_
FAQ_By_Rombro_Solar_Experts.html. Accessed on December 2, 2012.
Sustainable Environmental Services. (2009). Environmental services. Retrieved from
http://www.nwsustainable.net/. Accessed on November 4, 2012.
Transat. (N.d.). The Frontenac Arch Biosphere Reserve. Retrieved from
http://www.transat.com/en/corporate.responsibility/frontenac.aspx. Accessed on
November 10, 2012.
United Nations Educational, Scientific and Cultural Organization. (N.d.) Biosphere Reserves –
Learning Sites for Sustainable Development. Retrieved from
http://www.unesco.org/new/en/natural-sciences/environment/ecological-
sciences/biosphere-reserves/. Accessed on November 13, 2012.

69
17.0 Appendix A
Figure 18: Energy capacities per each bio-gas energy source in Ontario.

70
Figure 19: Energy capacities per each biomass energy source in Ontario.

71
Figure 20: Energy capacities per each landfill energy source in Ontario.

72
Figure 21: Energy capacities per each water energy source in Ontario.

73
Figure 22: Energy capacities per each water energy source in Ontario.

74
Figure 23: Energy capacities per each wind energy source in Ontario.

75
18.0 Appendix B
Figure 24: Energy capacities per each bio-gas energy source in the FAB.

76
Figure 25: Energy capacities per each biomass energy source in the FAB.

77
Figure 26: Energy capacities per each solar energy source in the FAB.

78
Figure 27: Energy capacities per each water energy source in the FAB.

79
Figure 28: Energy capacities per each wind energy source in the FAB.


