73
2011 - 2012 Renewable Energy Readiness Assessment Report: The GCC Countries

2011 - 2012
Renewable Energy ReadinessAssessment Report:
The GCC Countries
Organizational and Scientific Co-ordination
&

GCC Renewable Energy Readiness Report 2011 – 2012
1
Contents List of Tables ................................................................................................................................................. 3
List of Figures ................................................................................................................................................ 4
List of Acronyms ............................................................................................................................................ 5
Acknowledgements ....................................................................................................................................... 6
1 Introduction .......................................................................................................................................... 7
1.1 Motivation ..................................................................................................................................... 7
1.1 Renewable Energy Readiness ....................................................................................................... 8
1.2 Aim of this Report ......................................................................................................................... 9
1.3 Objectives...................................................................................................................................... 9
2 Energy Demand and the Deployment of Renewables ........................................................................ 10
2.1 Growing Energy Demand ............................................................................................................ 10
2.1.1 Global Energy Mix ............................................................................................................... 11
2.1.2 Future Energy Supply .......................................................................................................... 11
2.1.3 The GCC Energy Scenario .................................................................................................... 12
2.2 Deployment of Renewable Energy Technologies ....................................................................... 13
2.2.1 Drivers and Barriers to the Deployment of RETs ................................................................ 14
2.3 Potential Renewable Energy Jobs in the GCC Countries ............................................................. 15
3 Energy Demand and Renewable Energy Development Initiatives in the GCC Countries ................... 18
3.1 Bahrain ........................................................................................................................................ 18
3.1.1 RET Development Initiatives ............................................................................................... 18
3.2 Kingdom of Saudi Arabia ............................................................................................................. 18
3.2.1 RET Development Initiatives ............................................................................................... 19
3.2.2 Initiatives for Reducing Supply Side Energy Consumption ................................................. 19
3.2.3 Renewable Energy Program to Displace Fossil Fuels .......................................................... 19
3.3 Kuwait ......................................................................................................................................... 20
3.3.1 RET Development Initiatives ............................................................................................... 20
3.4 Oman ........................................................................................................................................... 21
3.4.1 RET Development Initiatives ............................................................................................... 21
3.5 Qatar ........................................................................................................................................... 21
3.5.1 RET Development Initiatives ............................................................................................... 21
3.5.2 National Research Funding Mechanisms ............................................................................ 23

GCC Renewable Energy Readiness Report 2011 – 2012
2
3.6 United Arab Emirates .................................................................................................................. 23
3.6.1 RET Development Initiatives ............................................................................................... 23
4 Methodology: Framework to Assess Renewable Energy Readiness .................................................. 24
5 Analysis of RE-Readiness Factors ........................................................................................................ 28
5.1 Infrastructure .............................................................................................................................. 28
5.1.1 Natural Resources ............................................................................................................... 28
5.1.2 Overall Country Infrastructure ............................................................................................ 30
5.1.3 Existing Grid Capacity .......................................................................................................... 30
5.1.4 Market Infrastructure ......................................................................................................... 30
5.1.5 Electricity Access Rate and Projected Demand................................................................... 36
5.2 Institutions .................................................................................................................................. 38
5.2.1 Public and Private Institutions Supporting RE..................................................................... 38
5.2.2 Key Policies .......................................................................................................................... 38
5.2.3 Renewable Energy Finance ................................................................................................. 42
5.2.4 Macroeconomic Environment ............................................................................................ 44
5.3 Human Capital ............................................................................................................................. 45
5.3.1 Technical and Commercial Skills ......................................................................................... 45
5.3.2 Adoption and Diffusion of New Technologies .................................................................... 48
5.3.3 Consumers, Investors and Decision Makers Awareness ..................................................... 49
6 Summary of Findings ........................................................................................................................... 51
6.1 Identified Gaps in GCC Countries ...................................................................................................... 55
6.2 SWOT Analysis ................................................................................................................................... 58
6.3 Priority Research Areas ..................................................................................................................... 59
7 Conclusions ......................................................................................................................................... 60
8 References .......................................................................................................................................... 62
9 Appendix ............................................................................................................................................. 68

GCC Renewable Energy Readiness Report 2011 – 2012
3
List of Tables Table 1: Key indicators of the GCC countries and world average (2009-2010)
Table 2: Global competitiveness scores of the GCC countries
Table 3: RE-readiness framework factors and respective weight
Table 4: The GCC countries energy reserve ranks and RE-readiness scores
Table 5: Solar and wind potential in the GCC countries
Table 6: Scoring criteria for competitive advantage of RETs
Table 7: Competitive advantages of RETs and RE-readiness scores
Table 8: Expected electricity demand growth and scores of RE-readiness
Table 9: The GCC countries RETs deployment targets and policy mechanism scores
Table 10: The GCC countries regulatory framework scores
Table 11: World ranking and financial market development scores
Table 12: RE Readiness Scores for Investment in RE Development
Table 13: Macroeconomic indicators, world ranks and competitiveness scores
Table 14: List of organizations and their R&D facilities in the GCC countries on renewable and sustainable energy
Table 15: The GCC countries RE-readiness scores and overall index
Table 16: The SWOT analysis for optimal deployment of renewables in the GCC countries

GCC Renewable Energy Readiness Report 2011 – 2012
4
List of Figures Figure 1: Average annual growth of renewable energy capacity
Figure 2: Applied methodology for this study
Figure 3: Direct jobs across the PV value chain
Figure 4: Market infrastructure sub-factors readiness score
Figure 5: RE-readiness for pillar 1: Infrastructure
Figure 6: RE-readiness for pillar 2: Institutions
Figure 7: RE-readiness for pillar 3: Human capital
Figure 8: GCC countries’ RE-readiness index
Figure 9: GCC countries’ attractiveness index on renewable energy development pillars
Figure 10 : GCC countries’ strengths and gaps on RE-readiness
Figure 11: RET deployment gaps in Bahrain
Figure 12: RET deployment gaps in the KSA
Figure 13: RET deployment gaps in Kuwait
Figure 14: RET deployment gaps in Oman
Figure 15: RET deployment gaps in Qatar
Figure 16: RET deployment gaps in the UAE

GCC Renewable Energy Readiness Report 2011 – 2012
5
List of Acronyms AER: Authority for Electricity Regulation
BAPCO: Bahrain Petroleum Company
CDM: Clean Development Mechanism
COP18: 18th UNFCCC Conference of Parties
CSP: Concentrated Solar Power
DLR: German Aerospace Centre
E&Y: Ernst & Young
EWA: Electricity and Water Authority
EU: European Union
GCC: Gulf Cooperation Council
GCR: Global Competitiveness Report
GDP: Gross Domestic Product
GHG: Global Greenhouse Gas
GCI: Global Competitiveness Index
GW: Gigawatt
IAEA: International Atomic Energy Agency
IEA: International Energy Agency
IRENA: International Renewable Energy Agency
KACST: King Abdulaziz City for Science and Technology
KAUST: King Abdullah University of Science and
Technology
KA-CARE: King Abdullah City for Atomic and Renewable
Energy
KFUPM: King Fahd University of Petroleum and Minerals
KISR: Kuwait Institute for Scientific Research
KSA: Kingdom of Saudi Arabia
kW: kilowatt
kWh: kilowatt-hour
LNG: Liquefied natural gas
MCDM: Multi-criteria decision making
MEDRC: Middle East Desalination Research Centre
Mtoe: Million ton of oil equivalent
MW: Megawatt
NGO: Non-government organization
NPRP: National Priorities Research Program
NPRP-EP: NPRP-Exceptional Program
NRA: National Regulatory Authority
O&M: Operation and Maintenance
OECD: Organization for Economic Cooperation and
Development
OPEC: Organization of the Petroleum Exporting
Countries
PV: Photovoltaic
QNFSP: Qatar National Food Security Programme
QNRF: Qatar National Research Fund
QNRS: Qatar National Research Strategy
QSTP: Qatar Science and Technology Park
RE: Renewable Energy
RET: Renewable Energy Technology
RE-readiness: Renewable Energy readiness
R&D: Research and Development
SWOT: Strength, Weakness, Opportunity and Threat
SWERA: Solar and Wind Energy Resource Assessment
T&D: Transmission & Distribution
TCF: Trillion Cubic Feet
TWh: Terawatt-hour
UAE: United Arab Emirates
UN-FCCC: United Nations Framework Convention on
Climate Change

GCC Renewable Energy Readiness Report
6
Acknowledgements
This report was commissioned and financed by Masdar Institute of Science and Technology and produced in collaboration with the GCC Consortium Partners of the EU-GCC Clean Energy Network. A large share of the research for this report was conducted on a voluntary basis. Authors
Dr. Alam Mondal, Masdar Institute of Science and Technology, UAE
Diala Hawila, Masdar Institute of Science and Technology, UAE
Huden Serenat Khalil, Masdar Institute of Science and Technology, UAE
Dr. Toufic Mezher, Masdar Institute of Science and Technology, UAE
Section Authors
Dr. Rabia Ferroukhi and Arslan Khalid, Knowledge, Policy and Finance Centre, IRENA, UAE
Yousef M. Alyousef, Director, Energy Research Institute, King Abdulaziz City for Science and
Technology, Saudi Arabia
Abdul Sattar Al-Taie, Executive Director, Qatar National Research Fund (QNRF), Qatar
Foundation, Qatar
Lead Country Facilitators and Contributors
Dr. Abdullah Al-Badi, Sultan Qaboos University, Oman
Dr. Ibrahim Abdel Gelil and Maha Abdel Wahab, Arabian Gulf University, Bahrain
Dr. Rabi H. Mohtar and Dr. Mohammed Darwish, Qatar Environment and Energy Research
Institute, Qatar Foundation, Qatar
Dr. Salem F. Alhajraf, Innovative and Renewable Energy, Kuwait Institute of Scientific Research,
Kuwait
Dr. Sulaiman Al Mayman, King Abdulaziz City for Science and Technology, Saudi Arabia
Reviewers
Dr. Scott Kennedy, Masdar Institute of Science and Technology, UAE
Dr. Sgouris Sgouridis, Masdar Institute of Science and Technology, UAE
Abdulla Al Seiari, Masdar Institute of Science and Technology, UAE
Editing
Zarina Khan, Masdar Institute of Science and Technology, UAE

GCC Renewable Energy Readiness Report 2011 – 2012
7
1 Introduction
1.1 Motivation
Energy is a vital input for socio-economic development. Worldwide, the present trends of energy supply
and demand are not sustainable due to the expected gap between supply and demand in the future.
The fossil fuel reserves are limited and use of these fuels has a negative impact on the environment.
Holding energy at a secure level and global climate change at a safe level requires policies to be
connected to sustainable development strategies.
One may ask, however, why Gulf Cooperation Council (GCC) countries, endowed with substantial
reserves in oil and gas, should invest in alternative energy. There is a perceived opportunity cost of
diverting resources away from the oil and gas sector, which has high a return on investment. However,
this perception is relatively short-sighted and ignores both the near-term opportunities of economic
growth in the renewables sector as well as the long-term threats of falling behind in a transforming
energy economy.
On a purely economic basis, the GCC’s investment in the development of Renewable Energy
Technologies (RETs) provides an opportunity for a number of key benefits. First, facilitating the
diversification of the energy supply mix away from a reliance on petroleum and natural gas would
increase long-term energy security by exploiting a renewable, as opposed to finite, energy resource.
Second, reducing the domestic consumption of fossil fuels would increase oil and gas export revenue
potential and help prevent a near-term transition to the status of an energy importer for some countries
(e.g., the KSA, UAE), given current projections of rapidly increasing domestic energy demand. Third,
support for this sector would create opportunities for capital investment. Finally, the resulting economic
development can potentially create high value jobs within the region that can support the establishment
of the full renewable energy value-chain, including R&D, manufacturing, and local and international
deployment.
These benefits can only be realized through supportive policies that address the existing barriers
preventing growth in this sector. By tackling these challenges, the integration of RETs in the power
sector would not only support the sustainable development of the GCC region, but would also
contribute towards the region’s global responsibility for environmental protection.
Climate change and energy security1 [1, 2] are also important issues on the global arena which are
rapidly becoming equally important issues for the GCC. The region’s current energy situation shows a
trend of rapid energy demand growth. From 1997 to 2006, the primary energy consumption in the GCC
increased by almost 60% [3] at a rate of about 6.6% per year. Forecasts suggest that energy demand will
increase at an annual growth rate of 9.5% by 2020 [4].
1 Energy security refers to a consistent availability of sufficient supplies of primary energy. It involves the provision
of sufficient and reliable energy supplies to satisfy demand at all times and at affordable prices, while also avoiding environmental impacts [1, 2].

GCC Renewable Energy Readiness Report 2011 – 2012
8
Rapid development in the region has also resulted in a rise of CO₂ emissions of 33% to 35% between
2007 and 2008 [3]. Currently the CO₂ emissions per capita, per gross domestic product (GDP) and energy
intensities in the GCC countries are higher than the average of EU-25 and the average of the
Organization for Economic Co-operation and Development (OECD) countries [5]. Although the GCC
region represents 0.6% of the global population, it is responsible for 2.4% of the total greenhouse gas
(GHG) emissions produced globally [6].
With recent climate change modeling studies showing that the Arab region could face an increase in
surface temperature between 2 to 5.5°C by the end of the 21st century [7], all GCC countries have
responded by ratifying the Kyoto Protocol of the United Nations Framework Convention on Climate
Change (UNFCCC). In 2005, Kuwait, Oman, Qatar, the Kingdom of Saudi Arabia (KSA), and the United
Arab Emirates (UAE) all ratified the Kyoto Protocol. Bahrain was the last of the GCC countries to join the
Annex 1 party in 2006 [8].
Even with clear incentives to adopt RETs and a good potential resource base, the region’s transition
from conventional fossil dependence to widespread utilization of renewables is not an easy one.
Throughout the GCC region, domestic economies continue to enjoy significant subsidies on fossil fuels,
albeit while bearing the external costs associated with their use. Subsidies create a higher economic
barrier for adopting any alternatives, which is exacerbated by the high investment cost of RETs.
Given these barriers to RET development, GCC countries are required to provide both economic and
political interventions to support RETs. These interventions include legislation, incentives to investment,
generation targets, guidelines for energy conservation and strategies to stimulate the energy industry
[9, 10].
Assessment of renewable energy readiness (RE-readiness) is a useful approach for developing countries,
including the GCC, to find the gaps hindering deployment of RETs and to identify a country’s strengths
and weaknesses in regards to RET development. It is defined by the International Renewable Energy
Agency (IRENA) as an assessment of the key conditions for RET development and deployment in a
country, and the actions necessary to further improve these conditions of the conditions necessary for
the installation and ongoing operation of renewable energy facilities in a country [11].
1.1 Renewable Energy Readiness
IRENA defines readiness as “when actors are able to deploy renewables where they are the best option,
accounting for all economic, social and environmental criteria.” It conducts its assessments by looking at
“the current state of national readiness, across the project lifecycle, from national energy strategy and
policy, to building, operation and maintenance (O&M), with capacity-building cutting across all these
items” [11].
On a national level, RE-readiness is an indication of the country’s realization of the need for renewable
energy and its ability to introduce and support renewable energy projects. In this report, RE-readiness is
defined as the level of development of a county’s infrastructure, institutions and human capital factors
that influence the attractiveness of investing in renewable energy projects and play a role in enhancing

GCC Renewable Energy Readiness Report 2011 – 2012
9
the reliability of RETs to ensure their sustainable deployment. This report presents a RE-readiness
framework that can create a benchmark for comparison among different countries and to assess future
progress.
1.2 Aim of this Report
Prepared in partnership with GCC Consortium on Clean Energy through the European Union (EU) GCC
Clean Energy Network, this report aims to develop and disseminate an assessment framework to
evaluate GCC countries’ (RE-readiness) for deployment of (RETs).
A framework is adopted in which we apply a consistent methodology across all the GCC countries to
assess the current state of infrastructure, institutions and human capital to adopt and deploy RETs.
The framework is followed by an assessment of how conditions might be improved. The assessment will
enable countries to identify existing gaps and increase diffusion of RETs across a range of renewable
energy sources (solar and wind) resulting in improved energy security and reduced CO2 emissions.
1.3 Objectives
Through this study we hope to achieve the following objectives:
1) Foster understanding and development of RETs in GCC countries.
2) Provide a wider introduction to energy and environmental issues.
3) Develop a generic framework to assess RE-readiness of GCC countries as a case study.
4) Calculate the RE-readiness score for GCC countries and discuss the associated weaknesses and
strengths.
5) Identify priority areas for research and development related to renewable energy deployment.
Towards achieving these objectives, the report essentially serves as a benchmark to assess each
country’s RE- readiness, identifying gaps and providing recommendations to overcome the main barriers
to integrate renewable energy projects for power generation. It is useful for a first level benchmarking
of a country’s relative position against regional or global averages. However, one must recognize that
such an assessment reflects a best estimate, given currently available data, of an inherently dynamic
situation. As both the availability of data and the weight of the impact of factors behind the readiness
calculation are modified over time, the absolute scores will change and the rankings will be affected.
To meet the above mentioned objectives, this report is divided into the following sections:
Introduction: the motivation behind the study, definition of RE-readiness, aims and objectives of
this report.
Energy Demand and the Deployment of Renewables: section discusses the global and GCC
energy context, focusing on RET development, drivers and barriers to RETs. The potential of RE
jobs in the GCC as a major benefit of RET deployment in the region is also explored.
Energy Demand and Renewable Energy Development Initiatives in the GCC Countries: section
discusses the energy demand, consumption and the status of RET development initiatives in
each GCC country.

GCC Renewable Energy Readiness Report 2011 – 2012
10
Methodology: Framework to Assess RE-Readiness Factors
Analysis of RE-Readiness Factors: section discusses the factors’ and sub-factors’ scores of
infrastructure, institutions and human capital pillars.
Summary of Findings: section provides RE-readiness index and overall noticeable gaps for
development of RETs. This section also includes country-wide gaps, SWOT analysis and priority
research areas to deployment of RETs in the GCC countries.
Conclusions
2 Energy Demand and the Deployment of Renewables
This section provides an update of the current and future global energy scene: demand and supply,
diminishing fossil fuel reserves and the consequence of increasing global CO2 emissions. Within the
same context, the GCC energy scenario is discussed.
The second part of this section gives an overview of the benefits of RETs to meet growing energy
demand, growth status, drivers and barriers to deployment and deployment trends.
Lastly, the potential for renewable energy jobs in the GCC as a major benefit of RET deployment in the
region is explored.
2.1 Growing Energy Demand
The global primary energy demand in 1980 was 7,228 million ton of oil equivalent (Mtoe), the total
installed capacity of power generation was 1,945 gigawatt (GW). By 2008, global primary energy
demand had increased by 70% at 12,271 Mtoe with installed capacity increasing to 4,719 GW, of which
almost 70% was from fossil fuels [12].
In 2011, although the world primary energy consumption grew by 2.5%, roughly in line with the 10-year
average, consumption in OECD countries fell by 0.8%, the third decline in the past four years driven by
the global financial crisis. However, non-OECD consumption continued to grow by 5.3%, in line with the
10-year average. Global consumption growth decelerated in 2011 for all fuels, as did total energy
consumption for all regions [13]. This sudden shift in paradigms in recent year shows how energy plays a
vital role in the functioning of the world economy.
With improving global economic prospects, it is expected that over the next two decades, projected
electricity demand alone will require the installation of the same power generation capacity that was
installed over the entire 20th century [14].
Key factors driving this increase in energy demand can be summarized as follows:
Industrialization: particularly in emerging markets.
Increasing wealth: among rapidly developing countries, where often less efficient end-use
equipment are used.
Globalization: increasing transportation to further destinations with greater speed.

GCC Renewable Energy Readiness Report 2011 – 2012
11
Energy Security: while energy demand is typically driven by short-term considerations (e.g., GDP
growth, transport needs), long-term concerns over energy security worldwide are leading to
premiums being paid for energy assets.
2.1.1 Global Energy Mix
Conventional fossil fuels that provide energy in affordable, concentrated ready to use forms remain the
principal sources of energy worldwide. Currently, the global energy supply share of fossil fuels is about
80%. While only 20% of the worldwide total final energy demand is supplied by nuclear and renewable
energy sources [15].
Increasing global energy demand, most of which is being met by fossil fuels is causing an increase in CO₂
emissions. In 2012, a total of 35.6 billion tons of CO₂ emissions were generated worldwide, 2.6% more
than the previous year, mostly as a result of increased fossil fuel combustion. The emissions thus exceed
1990 levels (base year for the Kyoto Protocol) by almost 60% [16]. The IEA suggests that around 84% of
total CO₂ emissions are energy related [17] with 41% of emissions coming from fossil fuel-based power
generation alone [18].
A global decline in conventional coal, oil and natural gas reserves has been observed over recent
decades as these conventional fuels are not being newly formed at any significant rate, and thus their
reserves are ultimately finite. Unconventional fossil fuels, such as tar sands and shale oil and gas, have
recently seen a rapid rise in terms of their projected supply. While these unconventional sources will
likely have a major role to play in the global energy supply, they remain subject to the same drawbacks
as conventional sources: uneven distribution, finite resources, environmental impacts including GHG
emissions and other hazards.
2.1.2 Future Energy Supply
If the current rate of energy consumption is continued then conventional coal, oil and natural gas
reserves may last for 118, 46 and 58.6 years respectively [19]. On the other hand, unconventional
resources will likely last much longer [20].
The World Energy Outlook Factsheet on the evolution of global energy markets by 2035 suggests that
though renewables grow rapidly, fossil fuels remain the principal sources of energy worldwide. Demand
for oil, gas and coal grows in absolute terms through 2035, but their combined share of the global
energy mix falls from 81% to 75% during that period. The unlocking of unconventional resources
portends a very prominent future for natural gas, which nearly overtakes coal in the primary energy
supply mix by 2035 [21].
Nuclear power, in light of additional policy changes in several countries prompted by the accident at
Fukushima Daiichi has seen a downward revision from previous projections leading many to wait for a
new generation of proven nuclear reactors to minimize risks. Projections for 2035 suggest that nuclear
power will maintain a 12% share of electricity generation [21].

GCC Renewable Energy Readiness Report 2011 – 2012
12
Renewable energy deployment is driven by government incentives, falling costs, rising fossil fuel prices
and, in some cases, carbon pricing: their share of electricity generation grows from 20% in 2010 to 31%
by 2035 [21].
2.1.3 The GCC Energy Scenario
The GCC region accounts for about 45% of the world’s proven oil reserves and 25% of the world’s oil
exports. It possesses around 18% of the proven global natural gas reserves [22]. Driven by strong
economic growth, rapid industrialization and infrastructure development and investment in the energy
sector, this region’s energy consumption has increased at a tremendous rate. In 2005, total energy
consumption was 275 Mtoe which increased to 389 Mtoe in 2011 at an average growth rate of about
6.85% per year [23].
Electricity consumption in the GCC countries has also increased at a fast rate: 12.4% from 2005 to 2009
(3.15% per year). The rate is much higher than the world average of 2.2% for the same period [4].
Average per capita electricity consumption in the GCC region was 10,976 kilowatt-hour (kWh) in 2009,
which was 3.9 times more than the world average of 2,806 kWh in 2009 [24].
In 2006, the total electricity production in the GCC was about 324 TWh, which increased to 391 TWh in
2009 [24]. On this basis, it is estimated that the production growth is about 6.9% per year. Energy
demand is expected to continue increasing in line with growing industrialization in this rapidly
developing region. The present generation capacity in the GCC countries is about 80 GW [25].
Considering current trends, the region must increase its electricity capacity by an additional 60 GW to
meet the demand by 2020. Some macroeconomic, energy and environmental indicators for the GCC
countries are presented in Table 1.
Table 1: Key indicators of the GCC countries and world average (2009-10) [24]
Key indicators Bahrain Kuwait Oman Qatar KSA UAE GCC World
GDP growth (%) 4.5 3.41 4 16.6 4.6 1.43 5.7 2.71
GDP per capita (Current USD) 18,184 62,664 20,790 72,398 16,423 39,624 38,347 9,157
Electricity production (TWh) 12.05 53.21 17.82 24.78 217 90.5 415.3 20,078
Electricity consumption per capita (kWh)
9,214 17,609 5,724 14,420 7,427 11,463 10,976 2,806
Energy use per capita (kWh) 93,936 132,263 64,426 172,967 683,00 99,620 105,246 20,764
Electricity production from gas (% total)
100 28.82 82 100 44.8 98.2 75.63 21.4
Electricity production from oil (% total)
0 71.17 18 0 55.2 1.8 24.36 4.8
Electricity production from renewable (% total excluding hydro)
0 0 0 0 0 0 0 3
Access to electricity (% population)
99.4 100 98 98.7 99 100 99.18 74
CO2 emission (metric ton per capita)
21.36 30.11 17.34 49 16.56 24.98 26.55 4.76
CO2 emission from electricity
and water (% total)
54.21 68.19 56.7 52 51.4 50.8 55.55 47.5
GCC Renewable Energy Readiness Report 2011 – 2012
13
CO2 intensity2 (kg per kg oil
equivalent) 2.43 2.75 2.78 2.97 2.81 2.65 2.73 2.53
In the context of such significant need for new capacity, the GCC region has a unique opportunity to
channel future investment into the deployment of renewable energy technologies (RETs), thus
enhancing future energy security and reducing GHG emissions. The integration of RETs in the power
sector through nationwide energy planning would enhance not only the sustainable development of the
GCC region, but would also integrate the GCC’s efforts into the broader global effort to address the
challenges of climate change.
2.2 Deployment of Renewable Energy Technologies
Renewable energy plays an important role in the process of integrating the environment into energy
policies through its potential to contribute to the objectives of sustainability. Renewable energy-based
power generation generally emits no GHG’s during operation, with the notable exception of biomass-
based power plants, which are neutral over their complete life-cycle in terms of GHG emissions.
Renewable energy resources can contribute significantly to the security and diversity of a nation’s
energy supply mix by providing a secure, indigenous source of energy that is available in a variety of
forms [26].
Renewable energy benefits have created a strong motivation for pursuing RETs in both developed and
developing countries. During the global financial crises in 2009, renewable energy continued to grow to
supply 16.7% of global final energy consumption in 2010 [27]. Of this total, modern renewable energy
accounted for an estimated 8.2%, a share that has increased in recent years, while the share from
traditional biomass has declined slightly to an estimated 8.5% [28]. Global investments in RE continued
to surge, from USD 39.5 billion in 2004 to USD 244 billion in 2012 (UNEP, FSFM and BNEF, 2013).
Globally, electricity generation from renewable energy resources has been growing rapidly. During 2011,
renewables accounted for almost half of the estimated 208 gigawatts (GW) of electric capacity added in
the power sector globally. Wind and solar photovoltaics (PV) accounted for almost 40% and 30% of new
renewable capacity, respectively, followed by hydropower (nearly 25%). By the end of 2011, total
renewable power capacity worldwide exceeded 1,360 GW, up 8% over 2010; renewables comprised
more than 25% of total global power-generating capacity (estimated at 5,360 GW in 2011) and supplied
an estimated 20.3% of global electricity. Non-hydropower renewables exceeded 390 GW, a 24% capacity
increase over 2010 [28].
Solar PV grew the fastest of all renewable technologies during the period from end-2006 through 2011,
with operating capacity increasing by an average of 58% annually, followed by concentrating solar
thermal power (CSP), which increased almost 37% annually over this period from a small base, and wind
power (26%) [28]. Compared to the global 1.4% annual growth of conventional energy, worldwide
installed capacities of solar PV and wind power grew at 30% per year [29-31]. This has led to a significant
2 CO2 intensity refers to CO2 emissions per kg of oil equivalent of final energy use.

GCC Renewable Energy Readiness Report 2011 – 2012
14
reduction in the investment cost of solar PV and wind power generation. Figure 1 shows the growth of
renewable energy capacity from 2006 to 2011.
During 2011, China added 90 GW of electric capacity (70 GW of which was non-hydro) ending the year
with an estimated 282 GW, more renewable power capacity than any other nation. The top seven
countries for non-hydro renewable electric capacity—China, the United States, Germany, Spain, Italy,
India, and Japan—accounted for about 70% of total capacity worldwide. The ranking was quite different
on a per capita basis, with Germany in the lead followed by Spain, Italy, the United States, Japan, China,
and India [28].
Figure 1: Average annual growth of renewable energy capacity, 2006-2011, adopted from [28]
2.2.1 Drivers and Barriers to the Deployment of RETs
National governments tend to increase the deployment of RETs for the following three interlinked
reasons [2]:
1) To improve energy security.
2) To encourage economic development with innovation and high-tech manufacturing.
3) To protect the climate and the wider environment from the impacts of fossil fuel use.
Despite the exhibited performance of RETs worldwide and their significant environmental benefits, it
has not been possible to tap their full potential. This is due to the various barriers, relating to
infrastructure, market conditions, human capital both institutional and regulatory [9, 32-36], which all
impede the diffusion and continued growth of RETs.
Renewable energy must compete with financial and regulatory systems that have evolved to promote
the development and use of fossil fuels, and often discriminate against the use of RETs. Furthermore,
0% 10% 20% 30% 40% 50% 60% 70% 80%
Solar PV
Concentrated Solar Power (CSP)
Wind power
Solar thermal
Ethanol production
Biodiesal production
Hydropower
Geothermal power
% Growth Rate
End 2006 to 2011 2011 only
GCC Renewable Energy Readiness Report 2011 – 2012
15
the one major barrier to RETs is their relative cost. Costs are closely tied to the development of markets
and technical progress.
The cost of solar PV has been falling consistently over the last three decades, exhibiting a learning curve
with a cost reduction rate of 19.3% [37] for every doubling of solar PV capacity. This is partly driven by
the increase in the efficiency of solar PV and improvements in market conditions favorable to RETs.
Availability, affordability (price volatility and price uncertainty) and sustainability of energy supply are
interlinked aspects of an overall energy system that can significantly influence deployment.
Global new investment in renewables rose 17% to a record USD 257 billion in 2011. This was more than
six times the figure for 2004 and almost twice the total investment in 2007, the last year before the
acute phase of the recent global financial crisis. This increase took place at a time when the cost of
renewable power equipment was falling rapidly and when there was uncertainty over economic growth
and policy priorities in developed countries [28].
2.3 Potential Renewable Energy Jobs in the GCC Countries3
Investment in the development of RETs in GCC countries provides an opportunity for a number of key
benefits, one of which is the potential for job creation across the full renewable energy value-chain,
including R&D, manufacturing, installation, operation and maintenance and decommissioning. Several
studies indicate that there is considerable potential for gross job creation in renewable energy and that
the number of jobs generated per dollar of investment or per unit of capacity is generally higher in
renewable energy than in fossil fuel generation. While the extent of employment effects may be
debated, most studies suggest that renewable energy deployment may also be associated with net job
creation, although the magnitude will vary by country and by sector. Similarly, the number of jobs
created in the GCC countries will depend on a range of factors, including the success of deployment,
existing industry, labor skill and availability, training and education policy, as well as the multiplier
effects of deployment on the rest of the economy.
Unemployment is a challenge in the GCC region and could potentially threaten the high standards of
living. In particular, high population growth rates, unattractive private sector opportunities and the
relative lack of required skills among the local graduates have resulted in a significant employment
problem for GCC youth4. As such, policy makers have been considering different ways to generate jobs,
as well as shift part of the workforce away from government jobs into fast-growing new industries
outside of hydrocarbons, including the renewable energy sector.
Indeed, national renewable energy targets indicate that most countries in the GCC are planning to add
significant renewable energy based capacity in the next couple of decades. Given that all countries have
ample solar resources available throughout the year, the main focus of investment is expected to be
solar energy (PV in particular). This is also reflected in the existing and planned projects in the GCC.
3 This section is contributed by Rabia Ferroukhi and Arslan Khalid, Knowledge, Policy and Finance Centre, IRENA.
4 Unemployment rates are significantly higher in the 19-25 age groups: 30% in Saudi Arabia, 24% in the UAE, 28%
in Bahrain, 23% in Oman, and 12% in Kuwait; as opposed to the overall unemployment rates of 10.5% in Saudi Arabia, 14% in the UAE, 8% in Bahrain and Oman and 6% in Kuwait.
GCC Renewable Energy Readiness Report 2011 – 2012
16
Encouragingly, studies also indicate that when comparing between renewable technologies with
different capacity factors (employment per unit of energy), PV technologies account for the highest
number of job-years per GWh over the lifetime of a facility [38].
Realization of the announced renewable energy targets in the GCC region can potentially lead to
significant job creation along the value chain in the GCC countries, which can be estimated more
precisely using different available methodologies. Based on a simple employment factors methodology,
preliminary analysis shows that the renewable energy capacity in GCC can reach 20 GW by 2020 and 60
GW by 20305 [39], generating 0.6 and 1.8 million (gross) jobs by 2020 and 2030, respectively. More than
90% of these jobs will be generated in the solar energy sector, where the dominant share of jobs
created is generally concentrated in the manufacturing and construction6 stages of the supply chain
(discussed in Section 5.1.4.4). It must be noted that the share of local jobs will eventually depend on the
degree of localization (domestic vs. foreign) of some of the key stages of the supply chain (in particular,
manufacturing). Therefore, fostering the domestic growth of these stages should be essential in the list
of priorities of GCC governments.
In order to create a market for renewable energy and facilitate the development of the local renewable
energy supply chain, regulations and policies will play a very import role. A stable, thriving and
predictable renewable energy demand is an essential factor for attracting sizeable private investment in
a local renewable energy supply chain. Therefore, deployment policies that create a significant local
renewable energy demand (public or private), are very important in generating renewable energy
related jobs. In addition, capacity building activities that develop the necessary skills and understanding
among the stakeholders7, coupled with conducive labor policies, can facilitate the shift of labor resource
towards renewable energy.
Several studies suggest that demand for PV or wind power can lead to significant job creation through
installation and maintenance activities given that appropriate capacity building initiatives are applied.
However, in order to create jobs throughout the renewable energy supply chain, GCC countries can
adopt various industrial policies that encourage the development of the domestic industry from the
demand and the supply side.
On the demand side, incentives such as local content requirement can be a key tool to establish
manufacturing facilities by generating the demand for local equipment and services. On the supply side,
governments can support the establishment of manufacturing facilities by providing guarantees and low
cost financing; promoting research and development; arranging transfer of technology; training human
capital; and if possible, providing additional demand by facilitating export of the domestic equipment
and capabilities [40]. Finally, government can further promote the establishment of the renewable
5 It is assumed that the share of the RE technologies are the following: 60% PV, 30% CSP, 5% wind and 5% waste to
energy. 6 In general this applies to fossil fuel-based technologies, feedstock production and distribution of biofuels account
for the largest share of jobs. 7 Training and skill development program for stakeholders including workers, investors, financers and politicians.
GCC Renewable Energy Readiness Report 2011 – 2012
17
energy supply chain through direct public investment in flagship projects and/or public private
partnerships.
Of particular relevance in the enabling policies that would ensure job creation from renewable energy
deployment are renewable energy education and training. Strong skills development initiatives need to
be undertaken to build a critical mass of technical skills to ensure the sustainability and long-term
success of renewable energy industries.
To achieve deployment targets and maximize job benefits, it will be necessary to facilitate increased
renewable energy education and training. It is, therefore, advisable to conduct skills mapping exercises
to identify existing skill and knowledge-related gaps in the GCC region. This should then be used to
develop appropriate training and education policies and to make sure that vocational training and
curricula are in line with industry needs.
In the development of policies to support job creation in renewable energy, the following aspects should
also be considered: the state of existing skills should be accounted for when formulating deployment
and industrial policies; services should be provided to help match jobs and workers; and job creation
should be focused in areas/demographic groups with low employment. The efforts mentioned above
will be especially needed given that the GCC relies heavily on skilled labor from overseas, without always
ensuring that skills are transferred to local people [40].
Significant efforts are already being undertaken to increase renewable energy education. The flagship
research institutes of the Masdar Institute of Science and Technology and the King Abdullah University
of Science and Technology (KAUST), for example, have become state-of-the art higher education
facilities that provide both local and foreign students with the necessary training needed to carry
forward the dream of a renewable energy future in the GCC. Among several other educational and
research initiatives in Qatar, Qatar University, along with implementing renewable energy related
teaching, has established a teaching laboratory in collaboration with the German Heliocentric Energy
Solutions company to provide practical knowledge in the fields of solar and wind energy generation
systems and storage. The Qatar Environment and Energy Research Institute (QEERI) is conducting
research on various energy and environmental issues with special focus on solar energy. The Kuwait
Institute for Scientific Research (KISR) is financing research projects on solar energy systems and their
technical feasibility in the country, in which more than 70 researchers, engineers and technicians are
trained and involved. Dhofar University in Oman has launched projects integrating renewable
technologies into academic programs and into students’ course curricula, thus providing graduates with
knowledge in renewable energy systems and design aspects of related projects.
Clearly there is significant potential for job creation along the value chain in the GCC to meet announced
renewable energy targets. However, as explained above, sustainable job creation in the GCC will require
going beyond a deployment policy to also introduce the appropriate labor, education/training, and
industrial policies required to create the overall enabling environment. Assuming there are net
employment benefits from deploying renewables, the jobs created will be most cost-efficient when
support policies are holistic, stable, consistent, and long-term.

GCC Renewable Energy Readiness Report 2011 – 2012
18
3 Energy Demand and Renewable Energy Development Initiatives in the GCC
Countries
This section discusses the energy demand, consumption and the status of RET development initiatives in
each GCC country.
3.1 Bahrain
Population and economic growth have led to a very high estimated annual energy growth rate of 10% in
Bahrain. In 2008, the total installed power generation capacity was 2,780 megawatts (MW) [25]. It is
expected that a total capacity of 6,500 MW will be required by 2030 to meet the projected demand [41].
With an installed capacity that is not always able to meet current demand, causing occasional power
outages, this small nation will need to double its natural gas supply in less than a decade to meet the
growing demand [4] or diversify its energy supply through careful consideration of alternative energy
sources.
3.1.1 RET Development Initiatives
Bahrain installed three wind turbines at its world trade center that meet 13% of the building’s energy
demand. The country has a pilot solar energy street lighting project that was implemented by the
Electricity and Water Authority (EWA).
Initiatives by the Bahrain Government to evaluate the renewable resources include the assignment of
Petro-solar an American company to assess the potential of solar energy. In July 2011, Bahrain signed a
contract with Fichtner Consulting Engineers of Germany to prepare a detailed techno-commercial
feasibility study for solar and wind energy resources [42]. The EWA of Bahrain also conducted an
assessment of solar and wind energy resources. The authority observed the possibility of using these
resources for production of electricity and desalinated water.
The following are the planned and conducted renewable energy projects in Bahrain:
1) Bahrain Petroleum Company’s (BAPCO) first zero emissions house built with a hybrid energy
system with total capacity of 7 kW (hybrid: solar, wind and fuel cell). BAPCO had formed an
administration team consisting members from universities and energy utilities, responsible for
the oversight and promotion of RET projects in Bahrain.
2) In 2009, a 5 MW capacity solar and wind project was announced to be installed. Bidding for the
project is being organized by the EWA.
3.2 Kingdom of Saudi Arabia
The KSA’s rapid economic growth is closely linked to its per capita energy consumption which has
increased by more than 30% since 2010 [43]. This significant increase in internal energy consumption
has caused a gradual decrease in oil exports. In 2008, oil met 60% of total energy consumption (about
800 million barrels of oil equivalent). Current trends show that energy consumption in the KSA is
expected to double in 2030, which will inevitably lead to diminished oil exports [43].

GCC Renewable Energy Readiness Report 2011 – 2012
19
KSA’s power generation capacity grew 11.8% reaching 51.2 GW by 2009. Population growth and
economic expansion, are projected to increase demand for electricity capacity to 77.4 GW by 2020 [44].
3.2.1 RET Development Initiatives
The KSA made the first step in the region in the 1970’s by founding the King Abdulaziz City for Science
and Technology (KACST) and funding R&D projects including renewable energy. Despite having the
largest oil reserves in the world, the Kingdom is focusing heavily on solar energy projects, with an early
emphasis on water heating and electrification in off-grid remote areas.
In 2009, the KAUST was founded to turn the country into a key energy research hub and to develop
renewable and sustainable technologies through cooperation with global scientific bodies. However, the
renewable energy sector is still somewhat immature in the KSA. No comprehensive technical or techno-
economic feasibility studies based on local conditions have been performed yet.
In May 2010, the governor of the Saudi Electricity and Cogeneration Authority announced a framework
that set out the conditions of government funding and incentives for the development of the renewable
energy sector. A feed-in tariff based is expected but has not yet been implemented.
In April 2010, the King Abdullah City for Atomic and Renewable Energy (KA-CARE) was founded by a
Royal order with a mandate to contribute towards sustainable development through implemention of
nuclear power plants and renewable energy projects to diversify energy supply and minimize CO2
emissions. It aims to exploit the country’s abundant natural resources to reach a sustainable energy
supply mix. Its intention is to strengthen Saudi Arabia's ability to meet future international oil demand
for the development of technology and human capacity. These require the establishment of an
important new economic sector focused on alternative energy.
In April 2011, the KSA announced that it would invest USD 100 billion in renewable and nuclear energy
to reduce its dependence on crude oil and to achieve 7-10% electricity generation from RETs by 2020
[44].
3.2.2 Initiatives for Reducing Supply Side Energy Consumption8
The KSA has taken the following initiatives to reduce energy consumption on the supply side [43]: 1)
modernization of existing power plants, 2) minimum efficiency standard for new power plants, 3)
minimum overall efficiency standard for co-generation desalination plants, and 4) implementation of a
renewable energy program to displace fossil fuels.
3.2.3 Renewable Energy Program to Displace Fossil Fuels
Analysis of solar resource assessment studies show that there is a great potential for solar energy in the
KSA. A solar photovoltaic area of 22–40 km2 in Saudi Arabia can produce as much electricity as a 1,000
MW oil-fired power station [43]. Studies suggest that if subsidy on oil is removed, at current oil prices
(assuming USD 80/barrel), electricity from PV in Saudi Arabia can be more competitive than electricity
from oil-fired power generation. An estimate done by this section contributor shows that in order to
8 This section is contributed by Yousef M. Alyousef, Director, Energy Research Institute, King Abdulaziz City for
Science and Technology, Riyadh, Saudi Arabia.

GCC Renewable Energy Readiness Report 2011 – 2012
20
stimulate PV in the country, an incentive equivalent to approximately USD 0.17 /kWh needs to be
introduced.
Our review of renewable energy options for the KSA also advocates a great potential for solar thermal
applications. Concentrated solar power (CSP) electricity generating systems can achieve conversion
efficiencies of 18-30%. Solar absorption cooling, where thermal energy from the sun is used for re-
generation in absorption chillers, is another possible application.
Despite its great potential, the wide scale deployment of solar energy in the KSA faces several barriers.
These include lack of incentives, high costs (considering current subsidies on oil), the need for more
public knowledge and professional training. It is assessed that 5 GW of solar PV installation has the
potential to save about 55 TWh per year in the KSA, leading to savings of about 2.8% compared to the
base case.
3.3 Kuwait
Kuwait is the fifth largest oil producer in the Organization of the Petroleum Exporting Countries (OPEC).
Oil and natural gas are the main available primary energy resources in the country. Energy consumption
is increasing at a rate of 8% annually [45].
In 1958, the first power plant was installed with a capacity of 15 MW; the total installed capacity grew to
11.6 GW by 2008. It is expected that by 2020 a total capacity of 23 GW would be needed to meet the
projected demand of electricity [44].
3.3.1 RET Development Initiatives
The country is richly endowed with solar energy. Kuwait has set an ambitious renewable energy
production target, which aims to generate 10% of its electricity from sustainable sources by 2020 [46].
Another initiative was the establishment of the renewable energy program by the Kuwait Institute for
Scientific Research (KISR). The KISR undertakes studies on feasibility of deploying renewable energy in
Kuwait. It focuses on regulations and policies that government needs to set up to promote renewable
energy development. As part of renewable energy resources assessment efforts, a study by the Japan
External Trade Organization was commissioned by the Ministry of Economy, Trade and Industry of
Kuwait in 2008. The study assessed technical, economical and operational aspects of combined cycle
power generating system using solar thermal energy.
Several pilot projects in wind, solar PV and solar thermal technologies have been completed by the KISR.
Some of these projects are: solar heating and cooking with different thermal storage configurations,
solar cooking project with 172 solar collectors covering a total area of 300 m2, thermal and electricity
application projects including Kuwait English School (Salwa) with daily electricity load of 80 kWh, 630 PV
modules and 110 batteries with electricity production capacity of 24.2 kW, KISR’s solar house with 76 PV
modules, 48 batteries and electricity production capacity of 2.6 kW, solar power plant at Sulaibia
complex with 56 power production of 125 kW. In addition, the following renewable energy projects
have been announced [4]:

GCC Renewable Energy Readiness Report 2011 – 2012
21
1) A joint project of 15 MW wind power has been proposed by KISR and Germany to install in
Kuwait. Another project of 5-10 MW solar power is to be installed.
2) The country is also working with a Japanese company in order to assess economic feasibility of
solar power plants in Kuwait.
3.4 Oman
Expansions of industrial and population growth have put a strain on Oman’s power sector infrastructure.
In 2010, total peak electricity demand in Oman was 3,856 MW, a 46.4% increase since 2005 [44]. The
peak demand is expected to grow at an annual rate of 8% and is projected to reach about 6,600 MW by
2018 [47].
3.4.1 RET Development Initiatives
The Authority for Electricity Regulation (AER) of Oman has outlined a roadmap for the Development of
Renewable Energy Projects. The AER published a report called “Study on renewable energy resources,
Oman” in 2008. The study recommends several pilot projects of RETs [48]: 1) 10 kW off-grid solar
PV/diesel hybrid system; 2) 20 kW grid-connected solar PV system; and 3) 10 MW grid connected wind
power farm. The criteria for selection of the recommended pilot projects types include:
1) Demand for these types of projects is expected in the near future.
2) The projects are expected to be economically viable in the future.
3) The projects shall contribute to the awareness of renewable energy.
4) The projects are based on well proven and reliable technology.
However, as of yet none of the recommended projects have been confirmed. Oman has recently floated
a tender for a concentrated solar power plant between 50 MW and 200 MW capacity. Special attention
has been given to look for a suitable policy framework and develop institutions to promote renewable
energy investments under clean development mechanism (CDM).
3.5 Qatar
Qatar’s economic growth is estimated to increase by 10% annually over the next 5 years, and to
continue growing at a slightly lower rate of 7% in subsequent years [49]. The economic growth is driven
by rising energy prices and higher exports of liquefied natural gas (LNG). Almost one third of the Middle-
East’s total conventional gas reserves are in Qatar, which also has a world share of about 12% [50].
Revenues generated from tapping this resource are used to develop the country's infrastructure,
education and health facilities as well as modern hydrocarbon operations.
In the year 2000, the country’s peak electricity demand was only 1,800 MW, this figure reached 8,000
MW by the year 2011. Electricity demand growth in recent years has been about 5.1% [4]. By 2030,
Qatar’s electricity generation is projected to continue growing at an annual rate of 2.9%. The country’s
primary energy demand is projected to grow at a moderate rate of 5.2% annually.
3.5.1 RET Development Initiatives
The government of Qatar is committed to diversifying its economy and to reducing its dependency on
fossil fuels. Qatar hosted the 18th United Nations Framework Convention on Climate Change (UNFCCC)
GCC Renewable Energy Readiness Report 2011 – 2012
22
Conference of Parties (COP18) in Doha from November 26 to December 7, 2012. The COP18 marks the
beginning of negotiations for a global agreement. With the international spotlight shifting to the region,
COP18 provided an unprecedented opportunity for the GCC countries to contribute their ambition and
combined experience to the world’s most complex intergovernmental efforts. The conference was
especially important given the inseparability of the global climate and energy challenges. As the first
Gulf country to host the talks, Qatar presented an opportunity to overcome differences between energy
exporters and importers and drive forward practical, mutually beneficial solutions.
Qatar announced to host a carbon neutral Football World Cup in 2022. Although, the country has no
renewable energy goals or policy mechanisms yet [36], Qatar proposed the newly built stadiums for the
event be solar powered and suggested that solar power will be connected to each of the stadiums’
electrical systems and national grid.
The Qatar National Food Security Programme (QNFSP) recently launched a solar resource assessment
project. The project is to be conducted by the German Aerospace Centre (DLR) to identify the country’s
most favorable areas for solar energy projects. Additionally, the following are the planned renewable
energy development projects in Qatar [4]:
1) On January 7, 2010, the country announced plans to invest about USD 1 billion in solar power
projects, and to install at least 100 MW of solar power in the next five years.
2) Over USD 500 million will be invested by Qatar Foundation to establish a polycrystalline silicon
plant. The Qatar Science and Technology Park will develop a new plant at Ras Laffan Industrial
City that will be one of the first operational polycrystalline silicon plants in the GCC region.
3) Chevron will test solar panels and energy-efficient lighting in Qatar.
4) The Center for Sustainable Energy Efficiency is expected to open soon. The center aims to
identify solar power, solar air-conditioning and low-energy lighting technologies for Qatar.
In 2012, Qatar published Qatar’s National Research Strategy (QNRS) and a strategic plan for
implementation. The strategy reflects input from Qatar’s researchers, leadership and other
stakeholders. The strategy addressed some important pillars for R&D such as enterprise, energy and
environment, computer science and information technology, health and social sciences. Energy and
environment pillar goals and objectives identified there-in are as follows:
1) Sustain economic prosperity through oil and gas diversification.
2) Achieve sustainable development through economic diversification, including solar energy and
alternative fuels.
3) Energy efficiency for improvement of energy use.
4) Protecting Qatar’s natural environment.
5) Environmental sustainability.
6) Addressing global climate change.
7) Cross-cutting basic research and applications.

GCC Renewable Energy Readiness Report 2011 – 2012
23
3.5.2 National Research Funding Mechanisms9
Qatar launched the Qatar National Research Fund (QNRF) to support its strategic development plans.
QNRF funds a broad range of subjects that align with the themes and objectives listed in QNRS
(discussed in the previous section) via two flagship programs namely; National Priorities Research
Program (NPRP) and NPRP-Exceptional Program (NPRP-EP).
The NPRP grant offers competitive funding with a maximum budget per proposal of USD 350,000 per
year for up to three years (total USD 1.05 million). Lead Principal investigators (PI) from outside of Qatar
may identify a co-lead PIs inside Qatar with whom they can submit joint project proposals.
The NPRP-EP, grants only proposals that carry exceptional scientific merit, with a total budget of up to
USD 5 million for projects with a duration of up to five years.
3.6 United Arab Emirates
Although, the UAE has an abundance of natural resources, possessing 9.3% of the world’s proven oil
reserves and 4.1% of the world’s proven gas reserves [51], the relatively high energy demand and
current constraints on exploiting domestic gas reserves has led the country to become a net importer of
natural gas since 2007 [44].
Power generation in the UAE is almost entirely dependent on fossil fuels, with natural gas accounting for
98% of the total installed capacity in 2009 [24]. With the cost of natural gas heavily subsidized to
produce electricity for the utilities [9], low energy costs and high economic and population growth rates
have driven the country’s energy consumption to rise tremendously in the past decades [52]. The annual
electricity demand growth in recent years has been about 9% [53, 54].
3.6.1 RET Development Initiatives
Despite the UAE’s natural gas and oil reserves, the country has made significant commitments to
alternative energy development. The UAE is among the first major oil-producing countries to ratify the
Kyoto Protocol of the UNFCCC in 2005 with other GCC countries excluding Bahrain which ratified in
2006.
The Emirate of Abu Dhabi has established one of the world’s most comprehensive clean energy
initiatives through the Masdar Initiative. It has set target of 7% of electricity generating capacity from
renewable energy by 2020. The Abu Dhabi Climate Change Policy Plan proposes that Abu Dhabi will
generate electricity by 10% from renewable energy by 2030 [51]. IRENA’s headquarter were established
in Abu Dhabi after the emirate won the bid to host the international body. Abu Dhabi also hosts the
World Future Energy Summit every year. The Summit brings together some of the world's most
influential stakeholders across the renewable energy sector and encourages the development of RE
related human capital for the region. This initiative showcases Abu Dhabi’s commitments to the
deployment of renewable energy.
9 This section is contributed by Abdul Sattar Al-Taie, Executive Director, Qatar National Research Fund (QNRF),
Qatar Foundation, Qatar

GCC Renewable Energy Readiness Report 2011 – 2012
24
Dubai has set a target of 5% renewable energy generating capacity by 2030 (1000 MW). Both emirate
level governments are creating policies and incentive frameworks to deliver their targets.
The UAE Solar Atlas has been commissioned to provide valuable technical data for setting up solar
energy projects in the country. The UAE Solar Atlas is the outcome of the agreement signed between
Masdar Institute and IRENA. The agreement announced at the World Future Energy Summit 2012 in Abu
Dhabi also covers exchange of information; joint implementation of project activities, analyses and
research studies; as well as defining technical compatibility and methodological harmonization and data
transparency protocols for solar and wind data.
Existing RET projects in the UAE include a 10 MW PV plant in Masdar City, Abu Dhabi and the recent
Shams 1 project, a 100 MW CSP plant in the western region of Abu Dhabi. Other planned RET projects in
the country include:
100 MW PV plant
28.8 MW wind plant
100 MW waste-to-energy plant
The Dubai Supreme Council of Energy launched the Emirates Energy Award in 2012-13. It is an
international prize that will be awarded every two years to encourage rational use of energy and energy
resources. The award aims to reward best practices and leading initiatives in pursuit of alternative
energy, energy efficiency, sustainability and environmental protection.
Another notable effort on part of the UAE, is the annual Zayed Future Energy Prize to honor
outstanding, innovative achievements and governance or leadership in the global search for a
sustainable energy future.
4 Methodology: Framework to Assess Renewable Energy Readiness
The RE-readiness assessment framework has been developed by identifying the dominant barriers and
supporting mechanisms for the deployment of RETs and then proposing ways to quantify and rate those
factors. The framework defines the factors along the pillars of infrastructure, institutions, and human
capital. Each factor is assigned a weight and a score between 1 and 7, with 1 being the lowest and 7 the
highest score.
The scoring criteria for some factors and sub-factors can be initially assessed from a qualitative range of
“poor” to “very good” and then translated into a score from 1 for “poor” to 4 for “very good”. These are
then normalized into a score between 1 and 7. The scores are: 1 (poor), 2 (fair), 3 (good) and 4 (very
good), corresponding to 1, 2.33, 4.66 and 7, respectively. For other factors and sub-factors that are
related to quantitative data, this study applied different quantitative techniques to get an RE-readiness
score from 1 to 7. These techniques or assessment methods are explained in the following sections of
analysis of renewable energy readiness factors.

GCC Renewable Energy Readiness Report 2011 – 2012
25
The factors and sub-factors data relating to the deployment of RETs was provided by the team members
of this report from their respective GCC countries. A questionnaire (given in appendix 1) was supplied to
the report team members to collect data related to the deployment of RETs. After gathering all
quantitative and qualitative data, this study applied different scoring techniques to obtain an RE-
readiness score for each factor and sub-factor.
This scale range is adopted to align with the scale of the Global Competitiveness Report (GCR)
developed by the World Economic Forum [55]. Table 2 provides an example of global competitiveness
scores for some factors of the GCC countries. The GCR measures countries’ competitiveness levels by
assessing their competitiveness factors and giving them a score between 1 and 7. Some of the factors of
the GCR, such as countries’ overall infrastructure, institutions, financial market development,
macroeconomic environment, higher education and training, were taken directly from the report, as
these factors are also relevant to the countries’ level of readiness to adopt renewable energy projects.
Other factors and sub-factors, such as access to renewable energy finance, power off-take
attractiveness, renewable generation target and current installed capacity, are taken from the Ernst &
Young (E&Y) renewable energy country attractiveness indices report [56]. However, this study applies its
own technique to finding the selected factors and sub-factor scores as discussed, based on the GCC
countries’ available data. The E&Y report provides long-term indices that are forward looking and take a
long-term view. The report is published quarterly and provides scores out of 100 for national renewable
energy markets and infrastructures and their suitability for RETs. Some additional factors and sub-
factors are also incorporated that are related to the development of RETs in this framework (Table 3).
Table 2: Global competitiveness scores* of the GCC countries [55, 57]
Global Competitiveness Index (GCI)-pillars
Bahrain Kuwait Oman Qatar KSA UAE
GCI 2011-2012 4.5 4.6 4.6 5.2 5.2 4.9 Basic requirements 5.4 5.2 5.6 5.8 5.7 5.8 Institution 5.3 4.4 5.3 5.4 5.5 5.2 Infrastructure 5.1 4.4 5.2 5.2 5.3 6.0 Macroeconomic environment 5.1 6.6 6.5 6.4 6.1 6.1 Higher education and training 5.0 3.8 4.2 4.6 4.8 4.8 Goods market efficiency 5.2 4.3 4.8 5 5.2 5.2 Financial market development 5.1 4.2 4.7 5 5.1 4.6 Technology readiness 4.5 3.7 4.1 4.7 4.3 4.9 Innovation 3.2 3.0 3.4 4.7 4.2 4.0 * The score is out of 7. The higher the score, better the competitiveness of the country.
To determine the weights of different sub-factors that make up a given factor, or the factors that make
up a given pillar, the commonly utilized equal weights method [58] was applied, which weighs all
variables within one category equally. A list of the pillars, factors and sub-factors and related weights
are given in Table 3.
After determining weights, a multi-criteria decision making (MCDM) technique was applied to calculate
the final RE-readiness index for each country. The MCDM technique provides solutions to problems

GCC Renewable Energy Readiness Report 2011 – 2012
26
involving multiple conflicting objectives [59]. The MCDM is a general class of operations research models
that deals with problems involving a number of decision criteria. In this report, the weighted sum
method is applied [58] to obtain a final RE-readiness index.
This study combines the various methodologies to determine a final RE-readiness index (Figure 2). This
study also applies a SWOT analysis to find the strengths, opportunities, weaknesses and threats for the
diffusion of RETs in the GCC countries. Finally it recommends some priority areas for research and
development in this region towards sustainable development for the longer term.
Table 3: RE-readiness framework factors and respective weight
Pillars, Factors and sub-factors Weight (within immediate parent category)
Pillar 1: Infrastructure 33.34%
1.1 Natural resources 20% 1.1.1 Conventional resources 50% 1.1.2 Renewable energy potential 50% 1.2 Country overall infrastructure 20% 1.3 Existing grid capacity 20% 1.4 Market infrastructure 20% 1.4.1 Goods market efficiency 20% 1.4.2 Market deregulation/power sector reform 20% 1.4.3 Current installed capacity of RETs 20% 1.4.4 RE supply chain and operation & maintenance facilities 20% 1.4.5 Power off-take attractiveness 20% 1.5 Electricity access rate and projected demand 20% 1.5.1 Projected electricity demand growth 50% 1.5.2 Electrification rate 50% Pillar 2: Institutions 33.33%
2.1 Public and private institutions related on renewable energy 25% 2.2 Key policies 25% 2.2.1 Identified targets and policy mechanisms 34% 2.2.2 Institutional/electricity market regulatory framework 33% 2.2.3 Climate or CO2 emission reduction policy 33% 2.3 Access to renewable energy finance 25% 2.3.1 Financial market development 50% 2.3.2 Investment in renewable energy 50% 2.4 Macroeconomic environment 25% Pillar 3: Human capital 33.33%
3.1 Technical and commercial skills 34% 3.1.1 Higher education and training 25% 3.1.2 Capacity building 25% 3.1.3 Availability of renewable energy scientists and engineers 25% 3.1.4 Labor market efficiency 25% 3.2 Technology adoption and diffusion 33% 3.2.1 Technological adaption readiness 50% 3.2.2 Innovation and research & development 50% 3.3 Awareness among consumers, investors and decision makers 33% 3.3.1 Resource availability awareness 50% 3.3.2 Consumer and social awareness 50%

GCC Renewable Energy Readiness Report 2011 – 2012
27
Figure 2: Overall methodology for this study
Supplied data by this report team members and literature
review on RETs development in the GCC countries
●●●●●●●●●●●●●●●●
●●●●●●●●●●●●●●●●
●●●●●●●●●●●●●
●●●●●●●●●●●●●●●
●●●
●●●
●
●●●
●●● ●●●
●●●
Pillars
Infrastructure Institutions Human Capital
Identify
factors &
sub-factors
Identify
factors &
sub-factors
Identify
factors &
sub-factors
Input
representative
Data gathering
& scaling
between 1 & 7
Data gathering
& scaling
between 1 & 7
Data gathering
& scaling
between 1 & 7
Output
representative
Weighting
factors
Weighting
factors
Weighting
factors
Equal Weights
Method
X 33.3% X 33.3% X 33.3%
Total RE-readiness index for a country: Out of 7
Multiply by the
pillar weights
Weighted Sum
Method
Identify strengths, gaps and priority
research areas in the GCC countries
for sustainable development
SWOT analysis

GCC Renewable Energy Readiness Report 2011 – 2012
28
5 Analysis of RE-Readiness Factors
This section outlines RE-readiness factor assessment data for each of the GCC countries and the given
scores based on the methodology discussed. The factors are separated according to the three pillars of
infrastructure, institutions and human capital.
5.1 Infrastructure
In general, infrastructure refers to a country’s physical capability to deploy RETs. It is assessed by
availability of natural resources (conventional fossil-fuels and renewable energy) as well as grid capacity
to transmit and distribute additional power/electricity generated from renewable energy sources to
consumers. Furthermore, other factors of infrastructure related to the development of RETs are
considered such as: market infrastructure (goods market, power sector reform, RETs development, and
power off-take attractiveness), electricity access rate and projected electricity demand.
5.1.1 Natural Resources
5.1.1.1 Conventional Resources
An assessment of the availability of conventional fossil fuels, as it relates to RE-readiness, is evaluated
according to proven reserves of oil and gas in GCC countries. These conventional resources are scored
based on the rankings provided by the World Factbook 2011 [60] for oil and gas reserves of each
country. Therefore, RE-readiness score of this sub-factor is high if the proven reserves are relatively low
for a given country. It presumes that less proven reserves encourages investment in RETs in order to
diversify the supply mix of energy. Moreover, these individual scores for oil and gas are averaged to
determine an overall score for this sub-factor.
For example, the Gulf countries have substantial conventional resources: KSA has the world’s largest oil
reserves of 259.9 billion barrels, Kuwait has 101.5 billion barrels, the UAE has 97.8, and Qatar 25.4
billion barrels. In regards to proven natural gas reserves, Qatar ranks 3rd in the world with 899 trillion
cubic feet (TCF), KSA ranks 5th with 263 TCF, UAE ranks 7th with 210 TCF, and Kuwait has 63 TCF [60]. The
following table (Table 4) illustrates the given scores for each country based on its reserved rank.
Table 4: The GCC countries energy reserve ranks and RE-readiness scores
Proven Oil and Gas Reserves
Rank 1-16 16-32 32-48 48-64 64-80 80-96 Rank >96
Allocated score 1 2 3 4 5 6 7
Country Oil rank Score Gas rank Score Average score
Bahrain 66 5 55 4 4.5
KSA 1 1 4 1 1
Kuwait 6 1 20 2 1.5
Oman 23 2 26 2 2
Qatar 12 1 3 1 1
UAE 7 1 7 1 1

GCC Renewable Energy Readiness Report 2011 – 2012
29
5.1.1.2 Renewable Energy Potential
Assessment of potential RE resources is necessary to deploy RETs in a nation. It includes solar radiation,
wind speed, and available lands for solar PV, CSP and wind farms used for
power generation. A higher resource value leads to a higher RE-readiness score. Other RE sources, such
as biomass and hydro, are not incorporated into the study due to their limited potential in the GCC
countries. The following analysis of solar and wind potentials clarifies these sub-factors.
5.1.1.2.1 Solar
GCC countries receive substantial solar radiation, with KSA having the highest resource potential. Table
5 shows solar potentials of each GCC country. On average, the global solar radiation for solar PV is close
to 2,083 kWh/m2/year and the direct solar radiation for CSP is about 2,208 kWh/m2/year in the region.
Our study considers the technical potential of solar energy (kWh/m2) to calculate readiness related to
solar potential. The impact of dust, humidity and high summer temperatures can decrease efficiency of
solar power, but this factor is not taken in account for the purpose of this study.
5.1.1.2.2 Wind
The Gulf region has moderate wind energy potential. Its countries have an average wind speed of about
6 m/s with a wind potential that varies substantially among them. The recorded full load hours per year,
which denotes the number of hours a wind turbine that is designed for the local wind speeds would
operate at full capacity, are relatively less comparing to other countries (Table 5). The cost per unit
generation increases if full load hours of wind power decrease. KSA has recorded full load hours of 1,789
per year, which is the highest within the GCC countries where as UAE has the least full load hours per
year at 1176. It is assumed that a country’s average wind speed will impact its RE-readiness score, as
higher speed is more attractive for wind power development.
Table 5: Solar and wind potential in the GCC countries [4, 61, 62]
Country PV Global solar
radiation kWh/m
2/year
CSP Direct normal solar radiation (kWh/m
2/year)
Solar energy
(kWh/m2)/
Score
Wind speed (m/s)
Hours of full load per year
Score
Bahrain 2160 2050 5.1 5 – 6 1,360 5.5
Kuwait 1900 2100 5.9 5 - 5.5 1,605 5.2
Oman 2050 2200 5.4 4 -6 1,463 5
Qatar 2140 2200 5.2 5 -7 1,421 6
KSA 2130 2500 5.6 2.5-4.5 1,789 3.5
UAE 2120 2200 5.4 3.5-4.5 1,176 4
Average 2083 2208
Generally, the GCC countries have substantial solar and reasonable wind resources. Qatar, Kuwait,
Bahrain and Oman receive RE-readiness scores of 5.6, 5.5, 5.3 and 5.2, respectively, because of their
GCC Renewable Energy Readiness Report 2011 – 2012
30
substantial solar and wind resources. UAE and KSA follow with a score of 4.7 and 4.55, respectively and
their lower scores are due to their lack of wind resources.
5.1.2 Overall Country Infrastructure
Overall infrastructure includes transport (roads, airports, and sea-ports), information and
communication technologies, and import-export facilities of a country, revealing its capacity to
implement large-scale projects. Infrastructure influences projects that depend highly on logistical
supports. For example, a modern infrastructure makes transportation of equipment for the installation
of renewable energy projects easier and more efficient. Therefore, a well-developed transport network
is a prerequisite to deploying large amounts of renewalbe energy capacity.
The GCR ”Global Competitiveness Report” gives scores for countries’ overall infrastructure on a scale
from 1 to 7 [55]. The GCC countries enjoy a well-developed modern infrastructure. In Qatar, for
example, winning the bid to host the 2022 World Cup has provided further impetus for rapid
infrastructure development. UAE has a modern infrastructure that ranks 8th in the world with a score of
6 [55]. Qatar and the KSA scores are 5.2 and 5.3, respectively. The scores for Oman, Bahrain and Kuwait
are 5.2, 5.1 and 4.4, respectively.
5.1.3 Existing Grid Capacity
A modern and advanced grid is required to transmit electricity generated from RETs. The ability to
efficiently balance supply and demand is also necessary, as RET-generated electricity varies based on
resource availability. Realizing the urgent need to meet the growing electricity demand, the GCC
countries have jointly embarked on a project to develop their grid systems and establish an
interconnection. Over 1 billion US Dollars has been allocated for the GCC grid interconnection project.
The electricity grids of Bahrain, Kuwait, KSA and Qatar were connected for the first time to form the
North Grid (Phase 1) in 2009 and the connection between UAE and Oman to form South Grid (Phase 2)
was completed in 2011. This power grid project in the GCC region started in 2005 to establish an
integrated electricity network in the Middle East. The network is expected to transmit an additional 100
GW to meet the next 10 years’ electricity demand.
Generated power from RETs can be transmitted through the same grid. Alternatively, RET-generated
power can be set up and transferred across the region to load centers [63]. This interconnection
provides an alternative source of reserve and support during emergencies. The GCC countries’ existing
grid capacity is well suited to handle additional energy generation through RETs. The allocated score is 7
for each country on existing grid capacity related to RE-readiness.
5.1.4 Market Infrastructure
Even though renewable energy technologies are still developing, they are gaining maturity similar to
conventional technologies used for power generation. New technology always demands a suitable
market infrastructure for its sustainable development. However, market infrastructure sub-factors
which influence deployment of RETs in a country are:
GCC Renewable Energy Readiness Report 2011 – 2012
31
1) Goods market efficiency10;
2) Market deregulation/power sector reform;
3) Current installed capacity of RETs;
4) Supply chain and O&M facilities;
5) Power off-take attractiveness.
5.1.4.1 Goods Market Efficiency
Efficient goods markets refers to a broad set of factors that affect the overall efficiency of markets in a
particular country. Limited barriers to entry, low transaction costs, and clear and transparent tax
structures are examples of conditions that will encourage competitive behavior of firms and lead to a
more efficient market.
Independent power producers need efficient goods markets to be able to enter the power sector,
particularly with a new technology that may be competing with conventional power sources. The goods
market efficiency score is given by the GCR. The KSA, Bahrain and the UAE ranked 4th, 6th, and 10th,
respectively in the world in goods market efficiecy in 2010. The UAE, Bahrain and the KSA receive scores
of 5.2 each for their goods market efficiency while Qatar, Oman, and Kuwait are scored at 5, 4.8 and
4.3, respectively.
5.1.4.2 Market Deregulation/Power Sector Reform
Market deregulation and power sector reform refer to a process by which government ownership and
involvement in the operation of the power sector is reduced and competitive entrants are encouraged.
Encouraging this substantial change in the sector requires strong policies and regulations to ensure
efficient operation and eliminate monopolistic behavior of private firms, as well as the availability of
private investment to guarantee sufficient capacity and reliability of service. Power sector reform can
also include [64]:
1) Introducing competition in the market to guarantee higher quality of service and lower tariffs;
2) Adjusting tariffs by removing subsidies and ensuring cost reflective pricing;
3) Minimizing the government’s regulatory role by changing the regulatory mandate from a
government entity (e.g., Ministry of Energy) to an independent regulatory authority;
4) Amending electricity acts to establish a sound legal basis for power sector reforms.
Additional factors that are used to assess the level of reform include macroeconomic indicators such as
power sector investment constraints, government fiscal constraints, options to raise capital,
international investment, multilateral structural commitment lending policies, and national economic
reform [64].
The GCC countries’ power sector reforms show that most of the electricity generation takes place
through partial public ownership with T&D typically having full public ownership. The limited extent of
10 “Countries with efficient goods markets are well positioned to produce the right mix of products and services
given their particular supply-and-demand conditions” (GCR, 2012).

GCC Renewable Energy Readiness Report 2011 – 2012
32
private competition for power generation reduces the RE-readiness. Aggresseive government
involvement in terms of policy and financial supports to further reform the power sector and limit
government involvement is also lacking. All of the GCC countries receive a fair score of 2.33 for market
deregulation.
5.1.4.3 Installed RET Capacity
The current installed capacity of RETs gives an indication of attractiveness for RET investment. High
capacity installation of RETs demonstrates that the country has an established infrastructure and supply
chain facilities. These facilities accelerate the growth of additional capacity and increase the
attractiveness of new investment, which in return leads to a higher RE-readiness score.
UAE leads the GCC region in existing RET installation capacity. A solar PV plant of 10 MW has been
installed at Masdar City, Abu Dhabi as well as four other small-scale solar PV projects [71]:
1) 1 MW rooftop installation on the Masdar Institute.
2) 291 kW PV array at the Yas Marina circuit.
3) 204 kW PV parking shade at Masdar City.
4) 200 kW mounted on the Presidential Sea Palace rooftop.
In addition, a 100 MW CSP plant called Shams 1 in Abu Dhabi’s western region has been launched
recently in 2013. There are future plans to build 1,500 MW of renewable energy projects in Abu Dhabi
by 2020 [9, 34] which will include a 100 MW PV plant, named Nour 1, to be installed in Al Ain and the
developing of a wind farm of 30 MW and a solar PV array at Sir Bani Yas Island by Masdar Power.
Moreover, in January 2012, Dubai announced a renewable energy target of 1% of installed capacity by
2020 and 5% by 2030. It has launched the Mohammed bin Rashid al-Maktoum Solar Park, with a total
capacity of 1GW by 2030 [65].
KSA has a total of 723 kW solar PV systems installed so far [4]. In addition, KSA inaugurated its first 500
kW (expandable to 6-8 MW) solar power plant at Farasan Island in 2011. The country also announched
plans to install 5 GW solar power generation capacity by 2020 [44]. The KSA is also preparing to install a
total capacity of 41 GW in the next 20 years which would be divided into 25 GW from CSP and 16 GW
come from solar PV. Additionally, the country is planning to install 9 GW from wind power in the next 20
years.
Kuwait and Bahrain have installed solar power capacity of 151 kW and 7 kW, respectively, and there are
no RE-based power plants in Qatar or Oman so far. Nevertheless, Qatar is planning to install at least 100
MW from solar power in the next five years. Also, Oman has confirmed a shortlist of six renewable
energy pilot projects to be installed. Four of these projects are solar and two are wind projects:
1) 100 kW solar PB project in Hiji.
2) 292 kW solar project in Al Mazyonah.
3) 1,500 kW solar project, location not yet confirmed.
4) 28 kW solar project in Al Mathfa including battery storage.
5) 500 Kw wind project in Masirah Island.

GCC Renewable Energy Readiness Report 2011 – 2012
33
6) 4,200 kW wind project in Saih Al Khairat, Wilyiat of Thumrait.
In addition, a large scale solar project of 200 MW is also expected to become available in 2014.
As discussed previously, RE-readiness gets a higher score when the current installed capacity of RETs in a
country is high and the growth trend of installation capacity is increasing. Qualitative assessment for
current installed capacity can be done using an indicator from a range of poor to very good. This study
considered the following for the scores:
If there is no current installed capacity then the country’s score is 1.
If less than 1 MW installed capacity then the score is 2.33.
If more than 1 MW but less than 1 GW is installed then the score is 4.66.
If more than 1 GW capacity is installed the score is 7 out of 7.
Considering the present installation capacity of RE-based generation of the GCC countries, the UAE and
KSA receive a higher RE-readiness score of 4.66 (good) each because of their current installed capacity.
Qatar and Oman get 1 each and Kuwait and Bahrain get a fair score of 2.33 each due to their limited
current installed capacity of RETs.
5.1.4.4 RE Supply Chain and O&M Facilities
This study assesses the extent to which a domestic supply chain exists and its adequacy in terms of
supporting the construction, operation and maintenance of RET power facilities. A well-developed local
supply chain could minimize logistical issues, increase availability of product inputs for an RET project,
and significantly reduce construction, operation and maintenance costs. Additionally, having locally
available O&M facilities ensures a higher reliability of energy supply. These factors, in turn, boosts
customer confidence and the attractiveness of a technology and increases investors’ interest. Other
elements such as quality control, adequate standards, and a skilled workforce help to improve a
product’s reliability and increase its market size.
An example of the workforce requirements for the case of the PV industry is illustrated in Figure 3.
Engineers and technicians form the backbone of the upstream stages (processing and manufacturing) of
this supply chain. They are responsible for producing solar grade ingots and wafers from raw
semiconductor material and also for the production/assembly of the PV panels and other system
components. Project development requires diverse skills of system designers, solar resource analysts
(meteorology), business managers and financial analysts, among others, while the installation sub-stage
creates jobs for construction workers and technicians. Technical staff is again needed over the project
lifetime for operation and maintenance. Finally, construction workers and materials recycling related
personal are required at the decommissioning stage.
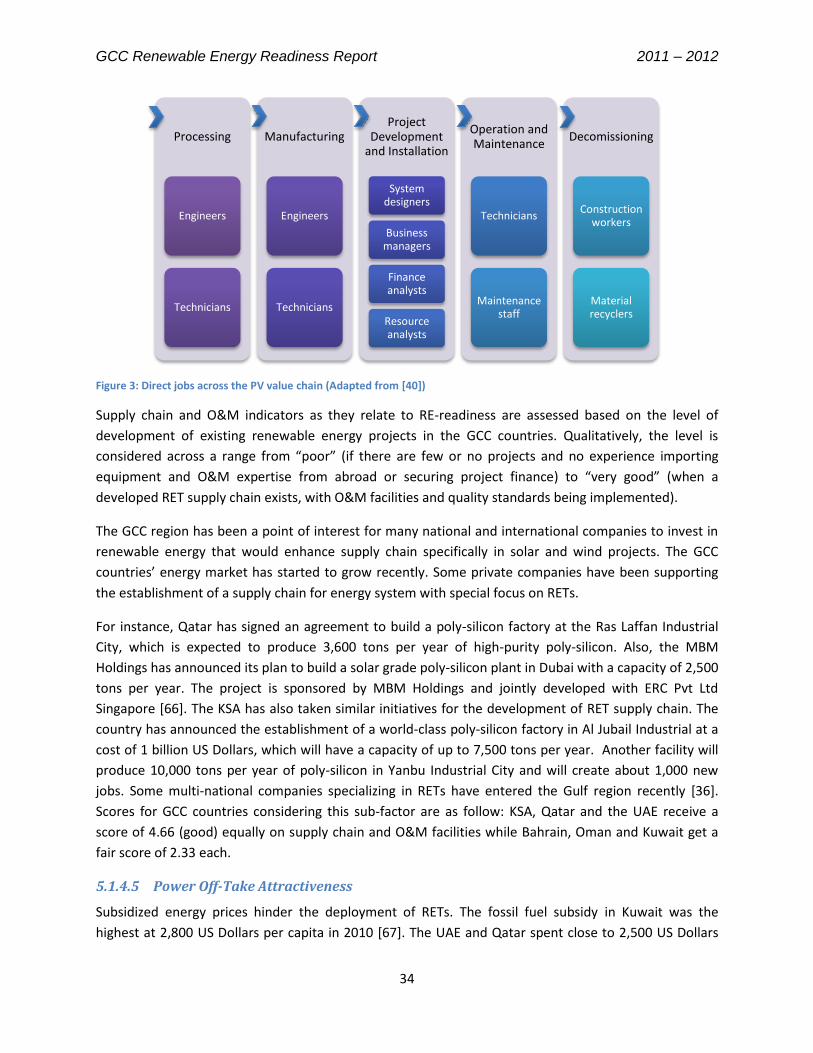
GCC Renewable Energy Readiness Report 2011 – 2012
34
Figure 3: Direct jobs across the PV value chain (Adapted from [40])
Supply chain and O&M indicators as they relate to RE-readiness are assessed based on the level of
development of existing renewable energy projects in the GCC countries. Qualitatively, the level is
considered across a range from “poor” (if there are few or no projects and no experience importing
equipment and O&M expertise from abroad or securing project finance) to “very good” (when a
developed RET supply chain exists, with O&M facilities and quality standards being implemented).
The GCC region has been a point of interest for many national and international companies to invest in
renewable energy that would enhance supply chain specifically in solar and wind projects. The GCC
countries’ energy market has started to grow recently. Some private companies have been supporting
the establishment of a supply chain for energy system with special focus on RETs.
For instance, Qatar has signed an agreement to build a poly-silicon factory at the Ras Laffan Industrial
City, which is expected to produce 3,600 tons per year of high-purity poly-silicon. Also, the MBM
Holdings has announced its plan to build a solar grade poly-silicon plant in Dubai with a capacity of 2,500
tons per year. The project is sponsored by MBM Holdings and jointly developed with ERC Pvt Ltd
Singapore [66]. The KSA has also taken similar initiatives for the development of RET supply chain. The
country has announced the establishment of a world-class poly-silicon factory in Al Jubail Industrial at a
cost of 1 billion US Dollars, which will have a capacity of up to 7,500 tons per year. Another facility will
produce 10,000 tons per year of poly-silicon in Yanbu Industrial City and will create about 1,000 new
jobs. Some multi-national companies specializing in RETs have entered the Gulf region recently [36].
Scores for GCC countries considering this sub-factor are as follow: KSA, Qatar and the UAE receive a
score of 4.66 (good) equally on supply chain and O&M facilities while Bahrain, Oman and Kuwait get a
fair score of 2.33 each.
5.1.4.5 Power Off-Take Attractiveness
Subsidized energy prices hinder the deployment of RETs. The fossil fuel subsidy in Kuwait was the
highest at 2,800 US Dollars per capita in 2010 [67]. The UAE and Qatar spent close to 2,500 US Dollars
Processing
Engineers
Technicians
Manufacturing
Engineers
Technicians
Project Development
and Installation
System designers
Business managers
Finance analysts
Resource analysts
Operation and Maintenance
Technicians
Maintenance staff
Decomissioning
Construction workers
Material recyclers

GCC Renewable Energy Readiness Report 2011 – 2012
35
per capita in 2010. Subsidy and lack of inclusion of external costs of fossil fuels impede investment in
RETs.
The level of attractiveness of renewable energy would ideally be assessed based on the difference
between the per unit electricity generation cost from fossil fuels and renewable energy. To ascertain the
RET attractiveness, the costs of conventional fossil fuels based power generation must be assessed
including these fuels’ subsidies and the external costs associated with their use. If the cost difference is
large then conventional primary fuels will be favored, whereas RET deployment will appear more
attractive for electricity generation in the opposite situation. Another way to measure RET
attractiveness is to look at the electricity tariffs. Higher electricity tariffs make RET development more
attractive.
RE-readiness is high where renewable energy generation costs are competitive with conventional
energy-based generation. This study assumes that higher electricity tariffs in a country lead to a more
favorable environment for deployment of RETs, while the lowest tariffs create the least favorable
environment. This study categorizes electricity tariffs according to seven levels, starting from the lowest
tariff with the lowest score (Table 6). A recent estimate places the cost of electricity for solar PV (ground
mounted) between USD 0.11/kWh and USD 0.49/kWh and for a roof-top system the cost ranges
between USD 0.14/kWh and USD 0.69/kWh [68]. An electricity tariff that is more than USD 0.14/kWh
will receive the highest score of RE-readiness. For example, the highest electricity tariff is paid by the
residential consumers in Denmark, of about USD 0.37/kWh [69] while Abu Dhabi has the lowest which is
about USD 0.013/kWh for citizen consumers.
Table 6: Scoring criteria for attractiveness of RETs
Electricity tariff (USD/ kWh)
0.013- 0.0334
0.0334- 0.0533
0.0533- 0.0731
0.0731-0.0930
0.0930-0.1128
0.1128-0.138
>0.138-
Score 1 2 3 4 5 6 7
According to the household electricity tariffs of the GCC countries [3] and the scoring methodology
proposed, the scores of RE-readiness for the GCC countries are presented in Table 7. The flat electricity
tariff is less in Qatar, Kuwait and Bahrain based on an average residential consumer’s tariff. The average
electricity tariff, including citizens and foreign residents, in Abu Dhabi and Dubai is relatively high and
receives a RE-readiness score of 3.
Table 7: Competitive advantages of RETs and RE-readiness scores
Country Generation cost (USD/kWh)
Consumer cost (USD/kWh)
Type Score
Bahrain 0.0397 0.008-0.04 Slab rate 1
KSA 0.099 0.013-0.06 Slab rate 2
Kuwait 0.131 0.006-0.04 Slab rate 1
Oman 0.0649 0.0415 Flat 2
Qatar 0.0384 0.0164 Flat 1
UAE 0.0595 0.028 Flat national 3
0.082 Flat non-national
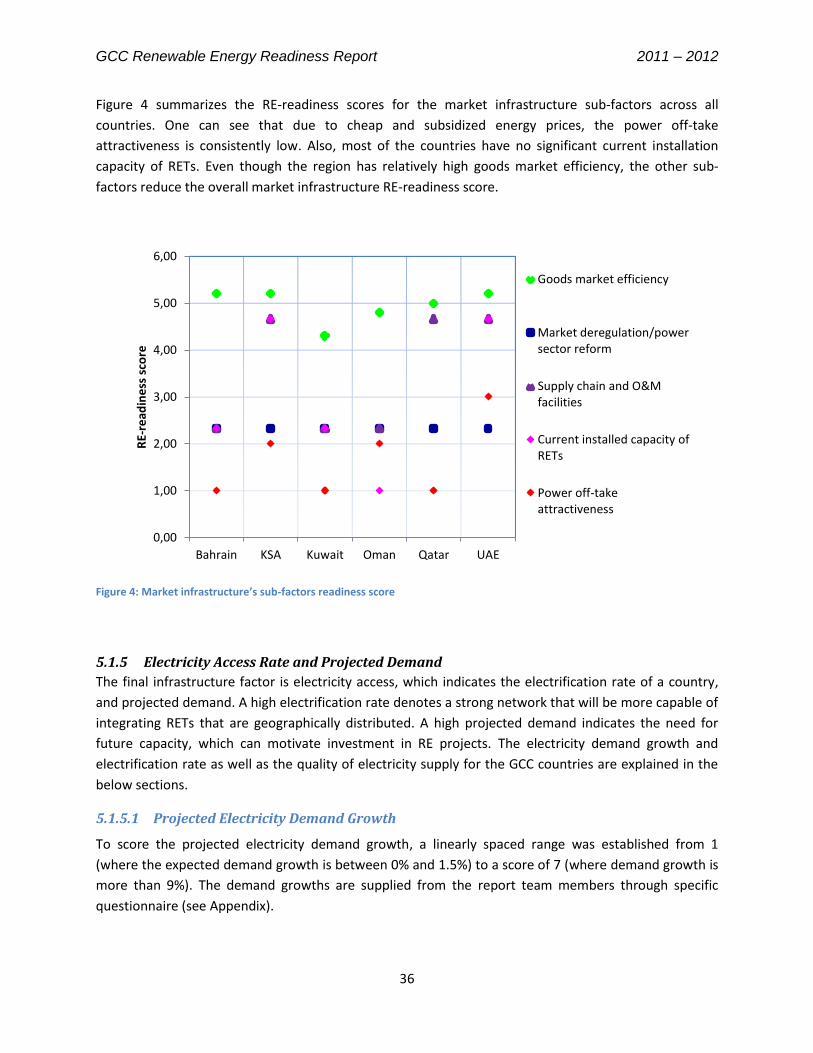
GCC Renewable Energy Readiness Report 2011 – 2012
36
Figure 4 summarizes the RE-readiness scores for the market infrastructure sub-factors across all
countries. One can see that due to cheap and subsidized energy prices, the power off-take
attractiveness is consistently low. Also, most of the countries have no significant current installation
capacity of RETs. Even though the region has relatively high goods market efficiency, the other sub-
factors reduce the overall market infrastructure RE-readiness score.
Figure 4: Market infrastructure’s sub-factors readiness score
5.1.5 Electricity Access Rate and Projected Demand
The final infrastructure factor is electricity access, which indicates the electrification rate of a country,
and projected demand. A high electrification rate denotes a strong network that will be more capable of
integrating RETs that are geographically distributed. A high projected demand indicates the need for
future capacity, which can motivate investment in RE projects. The electricity demand growth and
electrification rate as well as the quality of electricity supply for the GCC countries are explained in the
below sections.
5.1.5.1 Projected Electricity Demand Growth
To score the projected electricity demand growth, a linearly spaced range was established from 1
(where the expected demand growth is between 0% and 1.5%) to a score of 7 (where demand growth is
more than 9%). The demand growths are supplied from the report team members through specific
questionnaire (see Appendix).
0,00
1,00
2,00
3,00
4,00
5,00
6,00
Bahrain KSA Kuwait Oman Qatar UAE
RE-
read
ine
ss s
core
Goods market efficiency
Market deregulation/powersector reform
Supply chain and O&Mfacilities
Current installed capacity ofRETs
Power off-takeattractiveness

GCC Renewable Energy Readiness Report 2011 – 2012
37
The expected electricity demand growth of the GCC countries and their scores are given in Table 8. The
KSA receives a score of 4. Bahrain, Kuwait and Qatar receive a score of 5 individually. Oman and the UAE
receive a score of 6 each.
Table 8: Expected electricity demand growth and scores of RE-readiness
Expected demand growth 4.5-6%
Expected demand growth 6-7.5%
Expected demand growth 7.5-9%
Expected demand growth > 9%
Score
Score 4 5 6 7
Bahrain X 5
KSA X 4
Kuwait X 5
Oman X 6
Qatar X 5
UAE X 6
5.1.5.2 Electrification Rate
GCC countries have electrification rates that are among the highest in the world (Kuwait and the UAE
100%, the KSA 99%, Bahrain 99.4%, Qatar 98.7%, and Oman 98%). The Gulf region enjoys a high
reliability (limited load shedding/blackouts) of electricity supply. The only exception is during summer
peak load days, when some shortages are experienced.
Kuwait and the UAE have 100% electrification rates and best quality of electricity supply (with only very
rare blackouts/load shedding). Thus they receive a score of 7 on electrification rate and quality of
supply. KSA and Bahrain receive a score of 6.5 each, and then Qatar and Oman receive a score of 6
equally, due to existence of some blackouts or load shedding.
Finally, the overall RE-readiness based on infrastructure is summarized in Figure 5. It shows the
strengths and weaknesses of some issues for the development of RETs in the region. It also points out
that market infrastructure and available fossil-fuels reserves are limiting factors regarding RE-readiness
of infrastructure in all GCC countries.

GCC Renewable Energy Readiness Report 2011 – 2012
38
Figure 5: RE-readiness for pillar 1: Infrastructure
5.2 Institutions
Institutional readiness gives an overview of factors such as the existing institutional framework, key
long-term policies, access to renewable energy finance and microeconomic environment of RET
deployment. These factors are very significant to establish effective and reliable energy policy for
sustainable energy development in any country. They also show the fitness of institutions to implement
targeted renewable energy projects and their sustainable development.
5.2.1 Public and Private Institutions Supporting RE
The quality of Institutions has a strong bearing on the development of renewable energy projects. Legal
and administrative frameworks that govern public and private sectors represent the overall institutional
environment. Moreover, institutions influence strategy development as well as policy and investment
decisions. The GCC countries have healthy public and private institutions in general according to the GCR
(2012). KSA ranks 12th in the world on general institutions and achieves a score of 5.5. Qatar ranks 14th
on institutional competitiveness and gets a score of 5.4, followed by Oman and Bahrain at 16th and 17th,
respectively, with a score of 5.3 equally. UAE ranks 22nd and receives a score of 5.2 whereas Kuwait’s
institutional competitiveness level is less, with a rank of 47 and gets a score of 4.4.
5.2.2 Key Policies
Government policies are the backbone of the development of RETs in a country. Energy policies and
energy-related utilities’ regulatory frameworks are the drivers for sustainable implementation of
renewable energy projects. Relevant policies in this context could include targeted renewable energy
production to improve energy security and/or CO2 emissions reduction targets to mitigate climate
change.
Bahrain KSA Kuwait Oman Qatar UAE
0,00
1,00
2,00
3,00
4,00
5,00
6,00
7,00
RE
-rea
din
ess
sco
re
Natural resources
Overall infrastructure
Existing grid capacity
Market infrastructure
Electricity access rate andprojected demand

GCC Renewable Energy Readiness Report 2011 – 2012
39
5.2.2.1 Identified Targets and Policy Mechanisms
Reliable and effective renewable energy policies are essential to attract investors. It is important to have
a realistic target based on long-term planning to integrate large-scale renewable energy projects into
the power sector. Large RET projects provide economies of scale and favorable planning environments,
which facilitate project development financing [56]. The absence of long-term planning based on
techno-economic feasibility results in a lack of policy clarity and consistency over the long-term,
hampering investment and development of renewable energy projects [70].
Each country has its own unique energy resources, national economic development and demand
patterns, and energy security and climate concerns. Given these unique variables, suitable policies for
each country will be unique. The possible long-term policies for the deployment of RETs must be
evaluated in terms of their cost of implementation, while also considering evolving factors such as
technology learning effects, and resource availability. The challenge is in finding a suitable path where
energy security, environmental constraints and economic development are taken into consideration.
Cost-benefit analysis of policies can be assessed through various energy-economy modeling techniques.
Some approaches can also suggest optimal capacity expansion plans, while considering the factors
mentioned above. Such approaches have been commonly applied by national and international agencies
such as the International Energy Agency (IEA), International Atomic Energy Agency (IAEA) and others.
The IEA presents a series of renewable energy plans for Denmark, Sweden, France, USA, Germany, and
Japan in [71].
National energy-economy modeling has remained relatively limited in the GCC countries. There are a
few studies on RETs made for UAE and KSA [51, 52, 72-75]. Furthermore, Kuwait had developed its
reference energy system to integrate RETs using MARKAL model and now converted to the TIMES model
to optimize energy use in the long-term [76, 77].
RETs development targets should ideally be based on techno-economic modeling of renewable energy
potential for a given country. These targets provide guidance to investors and entrepreneurs in order to
develop their future strategy and business plans to invest in RETs development.
To ascertain the RE-readiness score of this sub-factor for each GCC country, our study disaggregated this
sub-factor into two components: renewable energy production targets and policy mechanisms.
Renewable energy production targets are scored by assessing the targets using the SMART approach – a
target must be specific, measurable, achievable, reasonable, and time-bound. Policy mechanisms are
further broken down into regulations, fiscal incentives, and finance (including finance for R&D). The
policy mechanisms are identified by the Renewable Energy Policy Network for 21st Century (REN21) [78].
A summary of the scoring rubric for this factor is shown in Table 9. Examples of policy initiatives
currently established in the GCC countries are explained below.
In Bahrain, the Ministry of Electricity and Water has recognized the need to promote sustainable energy
sources. However, Bahrain has set no targets yet for renewable energy-based electricity generation.
Only some fragmented activities exist to demonstrate renewable energy projects in the country.

GCC Renewable Energy Readiness Report 2011 – 2012
40
The KACST published a strategy report on “Strategic priorities for energy technology program” focusing
on Saudi Arabia’s energy research and innovation plans [79]. The KA-CARE has drafted a strategy that
includes new regulations and financial incentives for private investors to develop renewable energy
projects in the KSA. The strategy will be announced shortly after approval from the Saudi Cabinet. The
KSA has a target to generate 7-10% of total electricity from renewable energy by 2020 [44], including
other sources such as nuclear. The target is specific and time bound as well as it is reasonable and
achievable.
Kuwait has set most ambitious targets to generate 10% of its electricity from sustainable sources by
2020 [46]. Specialists are skeptical of its ability to meet its targets because Kuwait has no policy
mechanism or financial incentive to encourage renewable energy projects.
Oman has announced its target to develop the solar industry. A large scale solar power plant with a
capacity of 200 MW is expected to become available in 2014. The country has no specific target or policy
mechanism for development of renewable energy projects.
Qatar has introduced project-specific targets for its plan to host a major sustainable sporting event in
2022. Qatar proposed the newly built stadiums for the World Cup 2022 to be solar powered. It also
suggested that solar power plants will be connected to the stadiums and to the national grid. Qatar set a
target of 6% electricity from renewable energy by 2020. The target is specific and time bound. The
country has no policy and financial incentive mechanisms for renewable energy development yet. The
Qatar Foundation is supporting R&D in renewable energy projects through funding.
UAE has set a target to reach 7% of total capacity through renewable energy installations for Abu Dhabi
by 2020 [6]. Dubai's target of 5% renewable energy generation capacity by 2030 is to be achieved
primarily through the development of solar plants and clean coal power plants. Official policies are being
drafted for this sector, but are not yet finalized.
In reference to the scoring methodology explained above, Table 9 shows the targets and RE-readiness
scores relating to policy mechanisms for the GCC countries.
Table 9: The GCC countries RETs deployment targets and policy mechanism scores
Renewable Energy Generation Target Policy Mechanism Score
Specific Measurable Achievable Reasonable Time bound
Regulations Fiscal Incentives
Finance &R&D
Score 0.7 0.7 0.7 0.7 0.7 1.16 1.16 1.16 7
Bahrain 0 0 0 0 0 0.3 0 0.3 0.6
KSA 0.7 0.35 0.35 0.35 0.7 0.58 0.58 0.58 4.19
Kuwait 0.7 0 0 0 0.7 0 0 0 1.4
Oman 0.35 0 0 0 0.35 0 0 0 0.7
Qatar 0.7 0.17 0.17 0.17 0.7 0 0 0.58 2.49
UAE 0.7 0.35 0.35 0.35 0.7 0.3 0 0.3 3.05

GCC Renewable Energy Readiness Report 2011 – 2012
41
5.2.2.2 Institutional/Electricity Market Regulatory Framework
Institutional regulatory challenges are diverse in terms of their impact on energy production. Some of
these challenges affect the energy industry in general and some affect renewable energy projects
specifically. Regulators need to create an environment that avoids or minimizes investors risk in RET
projects. The most common institutional regulatory challenges are [70]:
1) The absence of long-term planning;
2) A large number of overlapping relevant authorities;
3) Lack of coordination between relevant authorities;
4) Complex permitting procedures;
5) Lack of stakeholder involvement in decision-making.
Frequent changes in regulations pose uncertainty and reduce the attractiveness of renewable energy
investments. A study was conducted in 2006 to identify how a country’s regulatory framework affects
investments in the e-communication sector [80]. It discusses factors that contribute to more regulatory
certainty. These factors involve clear legislation, timely implementation of legislation, comprehensive
guidance on the interpretation of legislative requirements, harmonization between stakeholders, clear
communication from the relevant National Regulatory Authority (NRA), and adequate appeals processes
and adequate NRA enforcement powers. These identified factors are used to determine RE-readiness
score of the regulatory framework for renewable energy deployment in the GCC countries.
Most of the GCC countries lack a specific regulatory authority that is specifically responsible for RET
projects. The existence of such an authority could streamline the permitting and approval process,
ensure standardization of projects and promote competitiveness in the sector; thereby ensuring a
higher project quality and increased administrative efficiency.
The KSA has assigned KA-CARE to co-coordinate national and international energy policy. KA-CARE is
responsible for working on the development of sustainable energy in the KSA. In contrast, Bahrain has
not assigned a separate regulator yet.
The Sustainable Environmental Management Program in Kuwait was started in 2003 to establish an
environmental database. The program also includes a focus on building awareness of sustainable energy
sources and their usage. So far, there is no dedicated law on sustainable energy use or uptake in Kuwait.
Oman has carried out a study to evaluate CDM projects that are suitable for the country. The authority
has also invited the Rural Areas Electricity Company to identify possible locations for pilot distributed
projects on solar and wind power.
Qatar has no dedicated legal or regulatory framework for the deployment of clean energy projects yet.
UAE launched the Masdar Initiative in 2006 to advance the development, commercialization and
deployment of RETs. The coordination between Masdar and the regulatory authority in UAE is relatively
advanced comparing to the rest of GCC countries, with an established feed-in-tariffs for the Shams 1 CSP
plant.

GCC Renewable Energy Readiness Report 2011 – 2012
42
According to the country-specific surveys, KSA and UAE have better legislation and harmonization
between stakeholders as well as an adequate regulatory enforcement for RET deployment. These
advantages are reflected in their scores as shown in the next table. The scores are given based on seven
sub-factors that contribute more regulatory assurance and each sub-factor receives 1 point out of total
7 points (Table 10).
Table 10: The GCC countries regulatory framework scores
Country Bahrain KSA Kuwait Oman Qatar UAE
Clear legislation 0.25 1 0.25 0.5 0.5 1 Timely implementation of legislation 0.25 0.25 0.25 0.25 0.25 0.25 Harmonization between stakeholders and good coordination
0.25 1 0.25 0.5 0.25 1
Transparency and clear communication from NRA
0.25 0.5 0.25 0.5 0.25 0.5
Comprehensive guidance of legislative requirements
0.25 0.5 0.25 0.25 0.25 0.5
Adequate NRA enforcement 0.25 1 0.25 0.25 0.5 1 Clear and consistent permitting procedures and fair competition as well as adequate appeals processes
0.25 0.5 0.25 0 0.25 0.5
Score 1.75 4.75 1.75 2.25 2.25 4.75
5.2.2.3 Climate / CO2 Emissions Reduction Policy
A policy for climate protection and energy security should incorporate efforts to diversify the energy
mix, including the use of low carbon supply options. Climate change mitigation policies that target
renewable energy supply options or demand-side efficiency have associated co-benefits of less primary
energy use as well as diversification of supply [81, 82]. All the GCC countries have ratified the Kyoto
Protocol and are committed to sustainable development. The Kyoto Protocol was successfully extended
for 2nd commitment periods of 8 years (2012 to 2020) in COP18 meeting in Doha, Qatar. Any party in
Annex I may continue to participate in CDM projects activities.
The existence of reduction targets for CO2 emissions would promote the development of RETs. Our
study gives the top score of 7 for countries with a target of 30% CO2 emissions reduction by 2020,
whereas the lowest score of 1 is given if there is no target to reduce CO2 emissions.
The Dubai Supreme Council of Energy and Dubai Carbon Center for Excellence are developing a strategy
to cut CO2 emissions. The strategy sets its effort to cut Dubai’s CO2 emissions by 1.5 million tons per year
[83]. Therefore, UAE receives a score of 2.33 and the remaining GCC countries are scored at 1 for no
emission reduction targets.
5.2.3 Renewable Energy Finance
The availability of project finance for RETs is an important factor for project development. This study
looks at financial market development in general and investment in renewable energy projects

GCC Renewable Energy Readiness Report 2011 – 2012
43
specifically. Scores for “financial market development” and “investment in renewable energy” are
averaged to get readiness score of “renewable energy finance”.
5.2.3.1 Financial Market Development
One of the most pressing barriers to deployment of RETs is finance. It is essential to evaluate the
financial market of a country to determine its capability to invest in renewable energy projects. General
financial market development indicates efficiency of the market in terms of availability and affordability
of financial services. It also assesses financing possibility through equity market, access to loans, capital
availability and restriction on capital flows.
The GCC countries have relatively well developed financial markets. Bahrain and Qatar receive a score of
5.3 each in financial market development. Kuwait gets a lower score of 4.3. Scores for different sub-
factors of financial market and world rankings are presented in Table 11.
Table 11: World ranking and financial market development scores [55]
Country Availability of finance (score) [Rank]
Affordability (score) [Rank]
Local equity market (score) [Rank]
Access to loans (score) [Rank]
Venture capital (score) [Rank]
Soundness of Banks (score) [Rank]
Average score
Bahrain 6.1 [11] 5.8 [7] 4.6 [18] 5.0 [2] 4.2 [8] 6.1 [18] 5.3 KSA 5.5 [30] 5.4 [17] 5.1 [5] 4.6 [5] 4.2 [7] 6.0 [20] 5.1 Kuwait 4.9 4.6 3.9 3.5 3.4 5.4 4.3 Oman 4.8 4.9 4.5 4.0 [13] 3.9 [16] 6.0 4.7 Qatar 5.6 5.6 [8] 5.1 [6] 5.3 [1] 5.4 [1] 5.0 5.3 UAE 5.5 [31] 5.1 [24] 4.2 [35] 4.3 [10] 4.0 [13] 5.5 4.8
5.2.3.2 Investment in RETs
The level of investment in renewable energy shows a country’s interest in deployment of RETs. Higher
investment in this sector indicates that a country is substantially ready for RET development. For
example, Germany invested 1.5% of its GDP in 2010 in clean technologies and energy efficiency to
reduce the impact of climate change [84]. Worldwide, total investment in renewable energy reached to
257 billion US Dollars in 2011, up from 211 billion US Dollars in 2010 [27, 85]. This investment increased
in both developed and developing countries; 168 billion US Dollars and 89 billion US Dollars,
respectively. China increased its investment to 51 billion US Dollars in 2011. India displayed the fastest
expansion rate for investment in renewable energy projects in 2011 with a 62% increase to 12 billion US
Dollars [85].
The Gulf region investments in RETs are increasing compared to a very low level in 2010. The UAE
invested about 837 million US Dollars in 2011 [85]. Qatar has invested 500 million US Dollars in a poly-
silicon facility that is expected to start in 2012 [27]. The KSA invested more than 200 million US Dollars in
research and developed of RETs. Additionally, Oman, Bahrain and Kuwait plan to invest 21 million US
Dollars, 133 million US Dollars and 600 million US Dollars, respectively, in future renewable energy
projects [86]. Huge investments in RETs and non-fossil energy sources are planned by Qatar, UAE, and

GCC Renewable Energy Readiness Report 2011 – 2012
44
KSA. Qatar plans to invest 1 billion US Dollars in RETs, UAE plans 20 billion US Dollars on 4 nuclear
reactors and solar projects, and the KSA plans to invest 100 billion US Dollars on 16 nuclear reactors and
solar [86] plants.
Table 12 below provides insight into how RE readiness scores for this sub factor are evaluated:
Table 12: RE Readiness Scores for Investment in RE Development
Investment in RE Development (USD) RE Readiness Score
50 billion 7
1 – 50 billion 4.66
200 million – 1 billion 2.33
No investment 1
Considering the present investment level, the UAE, KSA and Qatar receive a RE-readiness score of 2.33
each on investment in renewable energy. The remaining countries score a 1.
5.2.4 Macroeconomic Environment
In addition to the financial markets of a country, the stability of its macroeconomic environment is vital
for RET development. For the readiness assessment, the macroeconomic environment indicates the
ability of the government and private sector to support and invest in the development of renewable
energy projects. High interest and inflation rates, for example, will discourage investment. The scores for
the macroeconomic environment factor are given by the GCR.
The GCC countries have a very strong macroeconomic environment. A number of factors such as the
government budget, gross national savings, inflation, interest rates, government debt, and credit rating
are considered to determine RE-readiness scores for the macroeconomic environment factor. The GCC
countries’ macroeconomic data, world ranking (2011-2012) and RE-readiness scores are presented in
Table 13. Kuwait receives the highest score of 6.6 followed by Oman at 6.5 on macroeconomic
environment.
Table 13: Macroeconomic indicators, world ranks and competitiveness scores [55]
Country Budget balance (% GDP) [Rank]
National savings (% GDP) [Rank]
Inflation (%) [Rank]
Interest rate (%) [Rank]
Debt (% of GDP [Rank]
Credit rating (1-100) [Rank]
Overall score
Bahrain -7.8 34.4 2 [1] 6.0 32 68.1 [40] 5.1 KSA 7.7 [8] 35.2 [14] 5.4 6.0 10.8 [10] 75 [32] 6.1 Kuwait 17.5 [2] 40.4 [9] 4.1 [75] 0.5 [2] 10.5 [9] 76.2 [29] 6.6 Oman 75 [9] 41.4 [8] 3.3 3.5 5.9 [4] 71.8 6.5 Qatar 11.4 [4] 49.4 -2.4 [102] 4.4 17.8 79 6.4 UAE 3.3 [12] 26.4 0.9 [1] 3.0 21.0 75.3 6.1
Figure 6 represents the RE-readiness scores for the factors of pillar 2 along with the sub-factors that
comprise the key policies factor. The lines in figure 6 indicate RE-readiness scores for sub-factors of key
policies. The dots in this figure present overall factor scores of institutions. The figure shows that there
are insufficient policies for the development of RETs for power generation in the GCC countries. There is

GCC Renewable Energy Readiness Report 2011 – 2012
45
also a lack of targeted energy production from renewable energy policy and climate policy in most of the
GCC countries.
Figure 6: RE-readiness for the Institutions pillar (dots present factors scores and lines indicate the scores for the sub-factors of the Key Policies factor).
5.3 Human Capital
Human capital is a critical driver for sustainable development of RETs over the short and long term
period. Human capital in the context of RE-readiness indicates supply of human resources with the
ability to develop, manage and maintain renewable energy projects in a given country. It measures the
ability to select and sustainably operate the most appropriate technology. Factors such as technical and
commercial skills, technology adoption and diffusion, and consumer awareness of renewable energy,
are required for the development of human capital for RETs deployment.
5.3.1 Technical and Commercial Skills
There are a number of sub-factors that must be considered to determine the overall RE-readiness score
of technical and commercial skills factor. These include higher education and training, capacity building,
availability of renewable energy scientists and engineers, and labor market efficiency.
5.3.1.1 Higher Education and Training
Higher education and training programs give an indication of the technical capacity to plan, develop,
operate and maintain infrastructure projects in a country. The score is calculated based on the number
of schools for secondary and tertiary levels and enrollment rates. It is also assessed based on the quality
of education including math and science, management studies and internet access in schools.
Additionally, higher education and training programs provide a general understanding of technical skills
0,00
1,00
2,00
3,00
4,00
5,00
6,00
7,00
Bahrain KSA Kuwait Oman Qatar UAE
RE-
read
ine
ss s
core
Public and private institutions
Key policies
Identified targets and policymechanisms
Institutional/electricitymarket regulatory framework
Climate or CO2 emissionreduction policy
Access to renewable energyfinance
Macroeconomic environment

GCC Renewable Energy Readiness Report 2011 – 2012
46
to install and run new technologies. The scores for higher education and training are given by the GCR.
Bahrain leads with a score of 5, followed by the KSA and UAE with 4.8 each on higher education and
training. Qatar, Oman and Kuwait are scored at 4.6, 4.2 and 3.8, respectively.
5.3.1.2 Capacity Building
For the energy sector, capacity building can be conducted and measured at four levels, including overall
energy sector, organization, personnel and individual or community. Capacity building comprises a
series of activities that lead to an improvement in skill and performance for personnel, an organization,
or a community.
The capacity building indicator for renewable energy can be measured by the number of non-
governmental organizations (NGOs) and public and international organizations that are working on
renewable energy. Additionally, the number of associations, professional networks, annual
conferences/workshops on renewable energy and energy policy in a country indicate the level of
capacity building on RETs. This factor is assessed qualitatively based on survey data into a range of
“poor” to “high” capacity building and then translated into RE-readiness scores between 1 and 7.
The EU and the GCC partner countries established the EU-GCC Clean Energy Network in 2009. This
network brings together the relevant EU and GCC stakeholders from public and private sectors to
expand cooperation on clean energy. This network acts as a facilitator and identifies projects in fields of
common interest, specifically in renewable energies for their development.
The European Commission is assisting in the establishment of a large-scale platform for R&D
cooperation with the GCC to provide opportunities for stakeholders from both the EU and the partner
countries. It aims to identify initiatives and projects to increase utilization of renewable energy
resources in the GCC region. The establishment of IRENA’s headquarters in the UAE also plays an
important role in enhancing capacity building in the GCC region.
A list of organizations that are working in energy and sustainable energy in the GCC countries are given
in Table 14, along with their activities. Some related issues on renewable energy development in this
region have explained in Section 2.5. The GCC countries earn equally a score of 2.33 on capacity building
due to their limited present activities.
Table 14: List of organizations and their R&D facilities in the GCC countries on renewable and sustainable energy
Country R&D Facilities
Bahrain University of Bahrain conducting studies on solar and wind energy sources.
Bahrain Petroleum Company launched R&D policy in the field of solar energy.
The Electricity and Water Authority trying to install RETs.
The BAPCO formed a team consisting members from universities and energy utilizes. This team is responsible to follow up the renewable energy projects and promotion of RETs. BAPCO also established a renewable energy education park.
National Gas and Oil Company planning to install 20 MW grid-connected solar PV.

GCC Renewable Energy Readiness Report 2011 – 2012
47
Kuwait The Kuwait Institute for Scientific Research (KISR) supervises research on solar energy systems. The KISR works for long-term energy planning, applying MARKAL/TIMES model. Analysis has been conducted to evaluate the financial feasibility of photovoltaic technology. Studies have been carried out to assess potential of grid-connected photovoltaic systems. The KISR research areas are: innovative and renewable energy resources, energy efficiency and implementation, and energy planning and policy measures.
The Public Authority for Applied Education and Training, the Kuwait Foundation for the Advancement of Sciences, the Kuwait Society of Engineers and Kuwait University promote research on alternative energy resources and their use, projects and events.
Oman The Middle East Desalination Research Centre (MEDRC) and the Sultan Qabous University conduct active research on renewable energy.
The MEDRC and Caledonian College of Engineering worked on the application of solar energy in reverse osmosis water desalination.
The Renewable & Sustainable Energies Research Group was established in 2003.
The Ministry of Environment and Climate Affairs, the Authority for Electricity Regulation and the Public Authority for Water and Electricity are working on renewable energy resources feasibility and also conducting events and seminars.
Qatar The Qatar National Research Fund, a member of the Qatar Foundation, provides funds for research on variety of subjects including renewable energy.
The Qatar Science and Technology Park (QSTP) is working on clean energy. QSTP is closely working with Qatar Solar Technologies, a joint venture with SolarWorld AG, one of the largest solar companies.
Chevron is working with local organizations in Qatar to identify and deploy sustainable energy technologies.
The Center for Sustainable Energy efficiency is expected to open to identify solar power technologies that are best suitable for Qatar.
KSA The Energy Research Institute in King Abdulaziz City for Science and Technology conducted two major international joint programs that have assisted in establishment of a series of research activities and pilot projects in Saudi Arabia.
Solar Energy Research American Saudi directed towards demonstration projects such as solar electricity generation and decentralized usage, water desalination and cooling systems.
The second major research program by ERI-KACST is Hydrogen from Solar Energy (HYSOLAR) concentrated on solar based production of hydrogen.
King Faisal University, King Abdul Aziz University, King Fahd University of Petroleum and Minerals (KFUPM), and King Saud University have joined the KACST research program to establish solar cooling labs.
The Center for Engineering Research at KFUPM conducts research to investigate the potential of utilizing hybrid energy conversion systems.
Solar and Photovoltaic Engineering Research Center at KAUST provide a foundation for RET research and development.
A Sustainable Energy Technologies program has been established at King Saud University.
The Center for Clean water and Clean Energy at MIT and KFUPM has been established for research and educational partnership.
GCC Renewable Energy Readiness Report 2011 – 2012
48
UAE Masdar Institute of Science and Technology has been established as a post-graduate university focused on science and engineering of advanced renewable energy, environmental technologies and sustainability.
Many UAE universities are conducting research on RETs, environmental sustainability assessments in UAE buildings and utilization of solar–hydrogen energy. They also organize seminars, workshop on renewable energy. Masdar hosts the World Future Energy Summit in every year.
5.3.1.3 Availability of Renewable Energy Experts
The availability of renewable energy experts can be indicated by the number of specialized institutions
or consultancy firms in a country that provide advisory services. It indicates the number of specialized
companies that are capable of installing RETs including their operation and maintenance services. To
find the availability of renewable energy experts, the number of undergraduate and graduate study
programs dedicated to renewable energy also provide an indication. This factor is assessed qualitatively
by a range from “poor” to “very good” and then translated into scores.
The Gulf region has been able to establish several institutions that offer education and research facilities
in renewable energy (Table 14). In general, a depth of technical skills personnel and experts in
renewable energy are lacking in the GCC countries except for KSA and UAE. Commercial skills and
information on RETs are lacking in all the GCC countries [36]. UAE and KSA receive a score of 4.66 each
and the rest of the GCC countries score 2.33 each on availability of renewable energy expert readiness.
5.3.1.4 Labor Market Efficiency
The labor market is vital to assess ability to retain labor forces in a country. The labor market efficiency
indicator measures the efficacy of the labor market. It gives an idea of the country’s efficient use of
talent, in terms of pay and productivity, reliance on professional management, brain drain and female
participation in the labor force. Otherwise, even in the presence of clean energy education institutions,
graduates are unlikely to choose to stay and work in a country.
The GCC countries are mainly characterized by a small population relative to their resources and thus
there is considerable reliance on foreign labor. The countries have had to offer high remuneration
packages to attract expatriates with necessary experience. The scores for labor market efficiency are
given by the GCR: the better the labor market efficiency of a country the higher its score for readiness.
Bahrain ranks 19th, Qatar 22nd and the UAE 28th in the world in labor market efficiency and receive scores
of 4.9, 4.9 and 4.8, respectively. The KSA and Oman get score of 4.6 each and Kuwait receives the lowest
score of 4.4.
5.3.2 Adoption and Diffusion of New Technologies
5.3.2.1 Technological Adoption Readiness
This factor includes technological readiness and innovation, representing both shorter- and longer-term
drivers for competitiveness of technology development. Technological readiness measures agility of a
country to adopt existing and new technologies. It also measures the capacity to influence daily
activities and processes for increased efficiency and competitiveness. The indication of RETs adoption

GCC Renewable Energy Readiness Report 2011 – 2012
49
can be measured by looking at some factors such as the existing available technologies and their
adoption, foreign and domestic investments, and technology transfer facilities. The scores for
technological readiness of all countries are given by the GCR. UAE scores the highest at 4.9, followed by
Qatar with 4.7. Bahrain receives a score of 4.5, the KSA is scored t 4.3, Oman is scored at 4.1 and finally
Kuwait has the lowest score of 3.7.
5.3.2.2 Innovation and R&D
Establishment of a strong R&D sector for knowledge economy aids the GCC countries to fulfill
sustainable development goals. R&D institutions lead technological development and also meet the
critical need for training and capacity building for the workforce. The R&D indicator of a country can be
found from its expenditure of GDP for R&D purposes. The percentage of GDP expenditure on R&D in the
GCC countries is very low compared to the world average. Kuwait spent about 0.1% and the KSA spent
about 0.08% of their GDP for R&D in 2009 when the world average spent was about 2.1% [24].
The innovation and R&D indicator is determined by quality of scientific research institutions, investment
in R&D, university-industry collaboration in R&D, and availability of scientists and engineers. There is no
specific indicator related to RET innovation. The countries that are highly innovative are those, which
move towards the most appropriate innovations and technologies for their development. These
countries will also likely include RET development as a priority.
The number of energy utilities and scientific research institutes related to energy in the GCC countries is
given in Table 14 to provide a general overview of R&D in renewable energy. The GCC region relies
heavily on importing its knowledge through people, technologies and services in an effort to accelerate
development with little or no focus on R&D. There is no published number of researchers found in the
GCC countries. RE-readiness scores of innovation are taken from the GCR. Qatar scores the highest in
innovation with a score of 4.7 followed by the KSA with 4.2. The UAE gets a score of 4 and Oman
receives a score of 3.4. Bahrain gets a poor score in innovation at 3.2 and the poorest score is received
by Kuwait, with a score of 3.
5.3.3 Consumers, Investors and Decision Makers Awareness
5.3.3.1 Awareness of Renewable Energy Resource Availability
Detailed and reliable renewable energy resources assessment is an asset for energy planners and
investors. The assessed resources’ potential allows investors to evaluate the possible return on their
investment and determine the viability of a particular project. High quality assessment of renewable
energy resources allows national and regional level energy agencies to establish long-term energy
policies for sustainable development.
The resource awareness factor is assessed qualitatively by a range from “poor” (if there are no resource
assessment efforts) to “very good” (if all potential resources have been assessed and the results of the
studies have been made available to the public). Finally, qualitative levels are translated into scales from
1 to 7. RE-readiness scores are allocated considering four stages of awareness:
1) No resource assessment efforts;

GCC Renewable Energy Readiness Report 2011 – 2012
50
2) Few assessment projects have been planned but no studies conducted;
3) Potential resources have been investigated;
4) Assessment for all resources have been conducted and made available to the public.
The scores are 1, 2.33, 4.66 and 7, respectively.
Several initiatives have been carried out to assess renewable energy resources potential in the GCC
countries. A committee led by the Bahrain Electricity and Water Authority conducted an assessment of
solar and wind energy and looked at the possibility of using these resources for the production of
electricity and desalinated water in the early 1990s.
In Kuwait, a study was commissioned by the Ministry of Economy, Trade and Industry in 2008 with the
aid of the Japan External Trade Organization to assess the technical, economical and operational aspects
of combined cycle power generating system using solar thermal energy.
In Oman, meteorological data collected by Directorate General of Civil Aviation and Meteorology is now
available in order to assist RETs development. The Oman Authority for Electricity Regulation has done a
complete study on “Renewable Energy Resources, Oman” in 2008. The Oman Public Authority for
Electricity and Water has been conducting a study to assess feasibility of solar energy.
In Qatar, the QNFSP launched a solar resource assessment project to be conducted by the DLR to assess
the country’s most favorable areas for solar energy projects.
In the KSA, between 1993 and 2000, the KACST and the National Renewable Energy Laboratory, USA
conducted a joint project to upgrade the solar resource assessment capability of the country. The KACST
is collecting wind speed and direction data at 20, 30, and 40 meters above ground level and also
conducting solar resource assessment using 12 solar radiation monitoring stations to monitor total
horizontal, direct normal and diffuse radiation. The Energy Research Institute of KACST has made
progress in the use of solar energy with several experimental applications of solar technologies through
actual field studies at remote areas [44].
A preliminary assessment of solar and wind energy resources was conducted between 2007 and 2008
within United Nations Environment Programme’s (UNEP) Solar and Wind Energy Resource Assessment
(SWERA) in the UAE. The assessment was sponsored by Masdar as part of the Masdar Initiative and the
findings of the assessment are to be made available on the SWERA website when completed.
More recently, the UAE Research Centre for Renewable Energy Mapping and Assessment has been
mandated to develop the UAE solar and wind energy resource maps, in addition to developing regional
knowledge and leadership in renewable energy assessment and mapping for the Arabian Peninsula and
countries with similar climate, mainly in Africa.
All countries in the GCC are engaged in renewable energy resources assessment for RET development to
differing degrees. The KSA and UAE are ahead compared to the other GCC countries. The KSA and UAE
receive scores of 4.66 while the rest of the GCC countries score 2.33.

GCC Renewable Energy Readiness Report 2011 – 2012
51
5.3.3.2 Consumer and Social Awareness
Consumer and social awareness are usually the result of capacity building efforts on renewable energy
resources and technologies. NGOs, professional associations, and related public organizations may
organize exhibitions, seminars, events, and awareness campaigns in the media to raise consumer
awareness. This factor is usually measured through surveys. The results are generally presented in
published reports, such as “The GCC in 2020: Resources for the future” [23]. The factor is assessed
qualitatively from a range of “poor” to “very good” consumer and social awareness and finally
translated into the scales from 1 to 7. Many initiatives have been taken to spread awareness in the GCC
states. Social awareness concerning the requirement of clean energy development has been assessed
with a good score of 4.66 for the KSA and UAE. Bahrain, Kuwait Oman and Qatar receive a fair score of
2.33 on consumer and social awareness.
Figure 7 presents the RE-readiness scores for the human capital pillar. Bahrain, Kuwait and Qatar show
that they are not ready for the development of RETs due to their lack of capacity building and
awareness. Bahrain, Kuwait and Oman are also lacking on innovation and R&D. The lines of the Figure 7
show the main factors for readiness and the dots represent the parent categories sub-factors scores.
Figure 7: RE-readiness for the Human Capital pillar (lines indicate factors and dots show sub-factors)
6 Summary of Findings
This section summarizes the RE-readiness of the GCC countries to adopt renewable energy projects
based on the following pillars: infrastructure, institutions and human capital. After obtaining all
quantitative values for factors and sub-factors, these were weighted using the method discussed in
Section 4.
2,00
2,50
3,00
3,50
4,00
4,50
5,00
Bahrain KSA Kuwait Oman Qatar UAE
RE-
read
ine
ss s
core
Technical and commercialskills
Higher education andtraining
Capacity building
Availability of renewableenergy experts
Labor market efficiency
Technology adoption anddiffusion
Technological adaptionreadiness
Innovation and R&D
Awareness (resource,social, consumer)
GCC Renewable Energy Readiness Report 2011 – 2012
52
Table 15 summarizes the surveyed and assessed RE-readiness scores for the all GCC countries. With a
score of 4.75 out of 7 the UAE receives the highest RE-readiness index. The KSA follows closely with a
score of 4.60. The RE-readiness index shows that compared to the other GCC countries, the UAE and KSA
are more ready to integrate RETs for power generation (Table 15). Kuwait receives the lowest RE-
readiness index of 3.8 due to lack of market infrastructure, awareness and key policies for development
of RETs.
Table 15: The GCC countries RE-readiness scores and overall index
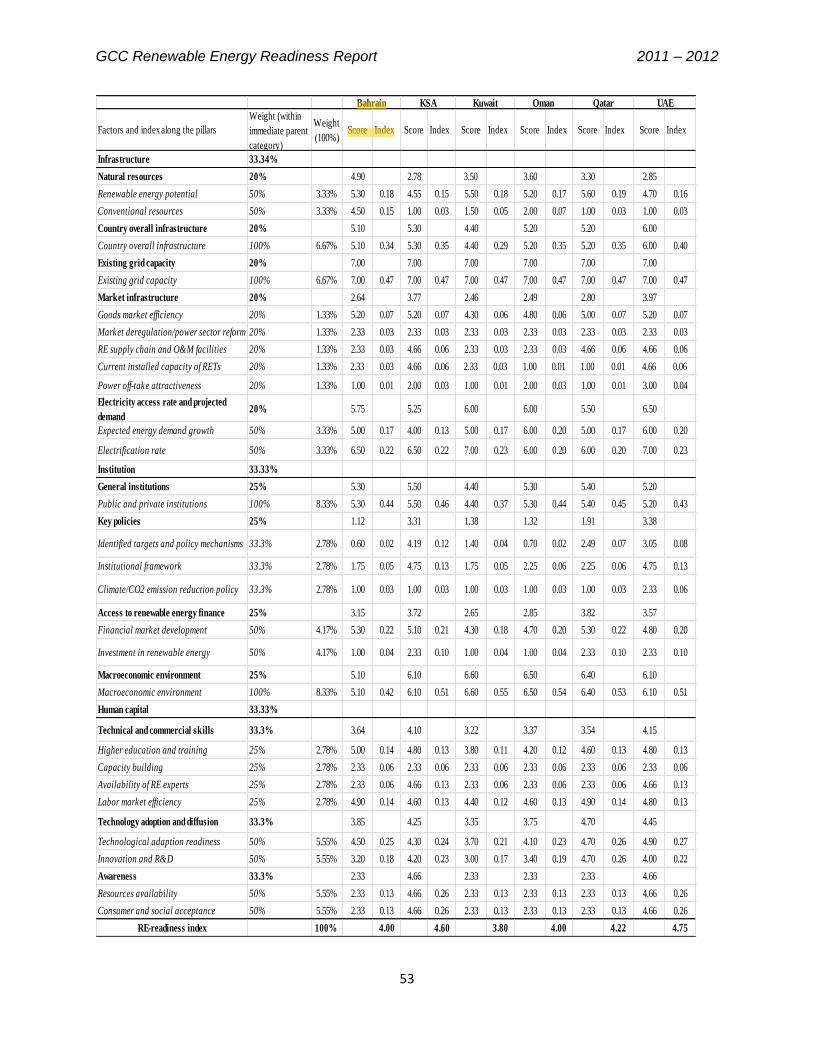
GCC Renewable Energy Readiness Report 2011 – 2012
53
Factors and index along the pillars
Weight (within
immediate parent
category)
Weight
(100%)Score Index Score Index Score Index Score Index Score Index Score Index
Infrastructure 33.34%
Natural resources 20% 4.90 2.78 3.50 3.60 3.30 2.85
Renewable energy potential 50% 3.33% 5.30 0.18 4.55 0.15 5.50 0.18 5.20 0.17 5.60 0.19 4.70 0.16
Conventional resources 50% 3.33% 4.50 0.15 1.00 0.03 1.50 0.05 2.00 0.07 1.00 0.03 1.00 0.03
Country overall infrastructure 20% 5.10 5.30 4.40 5.20 5.20 6.00
Country overall infrastructure 100% 6.67% 5.10 0.34 5.30 0.35 4.40 0.29 5.20 0.35 5.20 0.35 6.00 0.40
Existing grid capacity 20% 7.00 7.00 7.00 7.00 7.00 7.00
Existing grid capacity 100% 6.67% 7.00 0.47 7.00 0.47 7.00 0.47 7.00 0.47 7.00 0.47 7.00 0.47
Market infrastructure 20% 2.64 3.77 2.46 2.49 2.80 3.97
Goods market efficiency 20% 1.33% 5.20 0.07 5.20 0.07 4.30 0.06 4.80 0.06 5.00 0.07 5.20 0.07
Market deregulation/power sector reform 20% 1.33% 2.33 0.03 2.33 0.03 2.33 0.03 2.33 0.03 2.33 0.03 2.33 0.03
RE supply chain and O&M facilities 20% 1.33% 2.33 0.03 4.66 0.06 2.33 0.03 2.33 0.03 4.66 0.06 4.66 0.06
Current installed capacity of RETs 20% 1.33% 2.33 0.03 4.66 0.06 2.33 0.03 1.00 0.01 1.00 0.01 4.66 0.06
Power off-take attractiveness 20% 1.33% 1.00 0.01 2.00 0.03 1.00 0.01 2.00 0.03 1.00 0.01 3.00 0.04
Electricity access rate and projected
demand20% 5.75 5.25 6.00 6.00 5.50 6.50
Expected energy demand growth 50% 3.33% 5.00 0.17 4.00 0.13 5.00 0.17 6.00 0.20 5.00 0.17 6.00 0.20
Electrification rate 50% 3.33% 6.50 0.22 6.50 0.22 7.00 0.23 6.00 0.20 6.00 0.20 7.00 0.23
Institution 33.33%
General institutions 25% 5.30 5.50 4.40 5.30 5.40 5.20
Public and private institutions 100% 8.33% 5.30 0.44 5.50 0.46 4.40 0.37 5.30 0.44 5.40 0.45 5.20 0.43
Key policies 25% 1.12 3.31 1.38 1.32 1.91 3.38
Identified targets and policy mechanisms 33.3% 2.78% 0.60 0.02 4.19 0.12 1.40 0.04 0.70 0.02 2.49 0.07 3.05 0.08
Institutional framework 33.3% 2.78% 1.75 0.05 4.75 0.13 1.75 0.05 2.25 0.06 2.25 0.06 4.75 0.13
Climate/CO2 emission reduction policy 33.3% 2.78% 1.00 0.03 1.00 0.03 1.00 0.03 1.00 0.03 1.00 0.03 2.33 0.06
Access to renewable energy finance 25% 3.15 3.72 2.65 2.85 3.82 3.57
Financial market development 50% 4.17% 5.30 0.22 5.10 0.21 4.30 0.18 4.70 0.20 5.30 0.22 4.80 0.20
Investment in renewable energy 50% 4.17% 1.00 0.04 2.33 0.10 1.00 0.04 1.00 0.04 2.33 0.10 2.33 0.10
Macroeconomic environment 25% 5.10 6.10 6.60 6.50 6.40 6.10
Macroeconomic environment 100% 8.33% 5.10 0.42 6.10 0.51 6.60 0.55 6.50 0.54 6.40 0.53 6.10 0.51
Human capital 33.33%
Technical and commercial skills 33.3% 3.64 4.10 3.22 3.37 3.54 4.15
Higher education and training 25% 2.78% 5.00 0.14 4.80 0.13 3.80 0.11 4.20 0.12 4.60 0.13 4.80 0.13
Capacity building 25% 2.78% 2.33 0.06 2.33 0.06 2.33 0.06 2.33 0.06 2.33 0.06 2.33 0.06
Availability of RE experts 25% 2.78% 2.33 0.06 4.66 0.13 2.33 0.06 2.33 0.06 2.33 0.06 4.66 0.13
Labor market efficiency 25% 2.78% 4.90 0.14 4.60 0.13 4.40 0.12 4.60 0.13 4.90 0.14 4.80 0.13
Technology adoption and diffusion 33.3% 3.85 4.25 3.35 3.75 4.70 4.45
Technological adaption readiness 50% 5.55% 4.50 0.25 4.30 0.24 3.70 0.21 4.10 0.23 4.70 0.26 4.90 0.27
Innovation and R&D 50% 5.55% 3.20 0.18 4.20 0.23 3.00 0.17 3.40 0.19 4.70 0.26 4.00 0.22
Awareness 33.3% 2.33 4.66 2.33 2.33 2.33 4.66
Resources availability 50% 5.55% 2.33 0.13 4.66 0.26 2.33 0.13 2.33 0.13 2.33 0.13 4.66 0.26
Consumer and social acceptance 50% 5.55% 2.33 0.13 4.66 0.26 2.33 0.13 2.33 0.13 2.33 0.13 4.66 0.26
RE-readiness index 100% 4.00 4.60 3.80 4.00 4.22 4.75
UAEBahrain KSA Kuwait Oman Qatar

GCC Renewable Energy Readiness Report 2011 – 2012
54
Figure 8 demonstrates the RE-readiness assessment index of the GCC countries and shows a quick
comparison to benchmark the initiatives taken in each country. Figure 9 presents the renewable energy
attractiveness index based on different pillars related to the development of RETs. The figure shows that
human capital readiness is comparatively low, institutional readiness scores in the middle, while existing
infrastructure is relatively strong.
Figure 8: The GCC countries RE-readiness index
Figure 9: The GCC countries’ attractiveness index on renewable energy development pillars
Figure 10 presents the gaps and strengths for the GCC countries for the development of RETs. Overall
the most noticeable gaps identified are as follows (Figure 10):
1,00 2,00 3,00 4,00 5,00
Kuwait
Bahrain
Oman
Qatar
KSA
UAE
RE-readiness index
0,00
1,00
2,00
3,00
4,00
5,00
6,00
Bahrain KSA Kuwait Oman Qatar UAE
RE
-ea
din
ess
sco
re
Pillar 1: Infrastructure Pillar 2: Institutions Pillar 3: Human capital
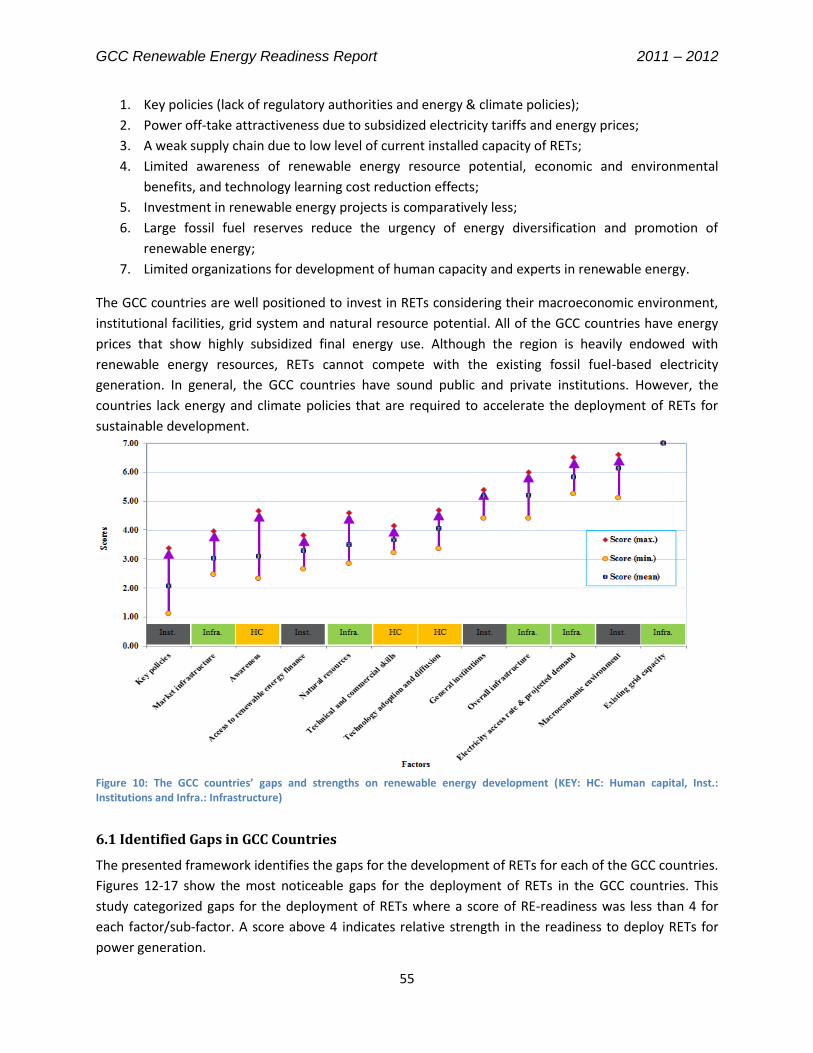
GCC Renewable Energy Readiness Report 2011 – 2012
55
1. Key policies (lack of regulatory authorities and energy & climate policies);
2. Power off-take attractiveness due to subsidized electricity tariffs and energy prices;
3. A weak supply chain due to low level of current installed capacity of RETs;
4. Limited awareness of renewable energy resource potential, economic and environmental
benefits, and technology learning cost reduction effects;
5. Investment in renewable energy projects is comparatively less;
6. Large fossil fuel reserves reduce the urgency of energy diversification and promotion of
renewable energy;
7. Limited organizations for development of human capacity and experts in renewable energy.
The GCC countries are well positioned to invest in RETs considering their macroeconomic environment,
institutional facilities, grid system and natural resource potential. All of the GCC countries have energy
prices that show highly subsidized final energy use. Although the region is heavily endowed with
renewable energy resources, RETs cannot compete with the existing fossil fuel-based electricity
generation. In general, the GCC countries have sound public and private institutions. However, the
countries lack energy and climate policies that are required to accelerate the deployment of RETs for
sustainable development.
Figure 10: The GCC countries’ gaps and strengths on renewable energy development (KEY: HC: Human capital, Inst.: Institutions and Infra.: Infrastructure)
6.1 Identified Gaps in GCC Countries
The presented framework identifies the gaps for the development of RETs for each of the GCC countries.
Figures 12-17 show the most noticeable gaps for the deployment of RETs in the GCC countries. This
study categorized gaps for the deployment of RETs where a score of RE-readiness was less than 4 for
each factor/sub-factor. A score above 4 indicates relative strength in the readiness to deploy RETs for
power generation.

GCC Renewable Energy Readiness Report 2011 – 2012
56
The main gaps are market infrastructure, targets and policy mechanisms, climate policy, access to
renewable energy finance and institutional framework. Capacity building, lack of current RETs installed
capacity, awareness, supply chain and O&M are also common for almost all the GCC countries. The GCC
region lacks available experts (scientists and engineers) and an innovation and R&D environment to
support the diffusion of new technologies. Abundance and affordability of fossil fuels as well as
subsidized electricity tariffs are all prominent barriers. Subsidies act as a major disadvantage to the
investment of renewable energy projects for power generation.
Figure 11 shows identified RET development gaps for Bahrain. Bahrain lacks key policies, awareness of
renewable energy resource potential and their benefits. It is also low on current RET installed capacity
under market infrastructure, and access to renewable energy finance. Subsidized electricity tariffs,
innovation and capacity building gaps are also evidenced. Similar gaps exist in Kuwait and Oman; these
can be seen in Figure 13 and Figure 14, respectively.
In Qatar, RETs are less attractive due to subsidized electricity tariffs and heavy reliance on fossil fuels,
which can be seen in Figure 15. More efforts should be made to promote climate and long-term energy
policies in an effort to accelerate deployment of RETs in Qatar. Awareness, capacity building and
institutional framework are expected to improve due to Qatar’s hosting of a carbon neutral world cup in
2022.
The KSA and UAE are in a better position due to their many initiatives to invest in clean technologies and
targeted policies for accelerating deployment of RETs. Many stakeholders are involved in the
development of renewable energy projects in these two countries.
Many of the gaps that are identified in the UAE are being addressed by the UAE government. The
government realizes the need for diversification of its energy supply and optimal use of finite fossil fuels,
reviewing tariffs and minimizing subsidies. Lack of innovation and R&D, capacity building and long-term
energy and climate policies are being addressed by the Abu Dhabi government, which has set a target of
transforming into a knowledge-based economy by 2030. Moreover, the establishment of Masdar City
has created a hub for renewable energy business and is developing a comprehensive supply chain for
accelerating deployment of RETs.

GCC Renewable Energy Readiness Report 2011 – 2012
57
0 1 2 3 4
Key policies
Awareness
Market infrastructure
Access to renewable energy finance
Technical and commercial skills
Technology adoption and diffusion
Figure 11: RET deployment gaps in Bahrain
Bahrain
0 1 2 3 4
Natural resources
Key policies
Access to renewable energy finance
Market infrastructure
Figure 12: RET deployment gaps in the KSA
KSA
0 1 2 3 4
Key policies
Awareness
Market infrastructure
Technical and commercial skills
Access to renewable energy finance
Technology adoption and diffusion
Natural resources
Figure 13: RET deployment gaps in Kuwait
Kuwait
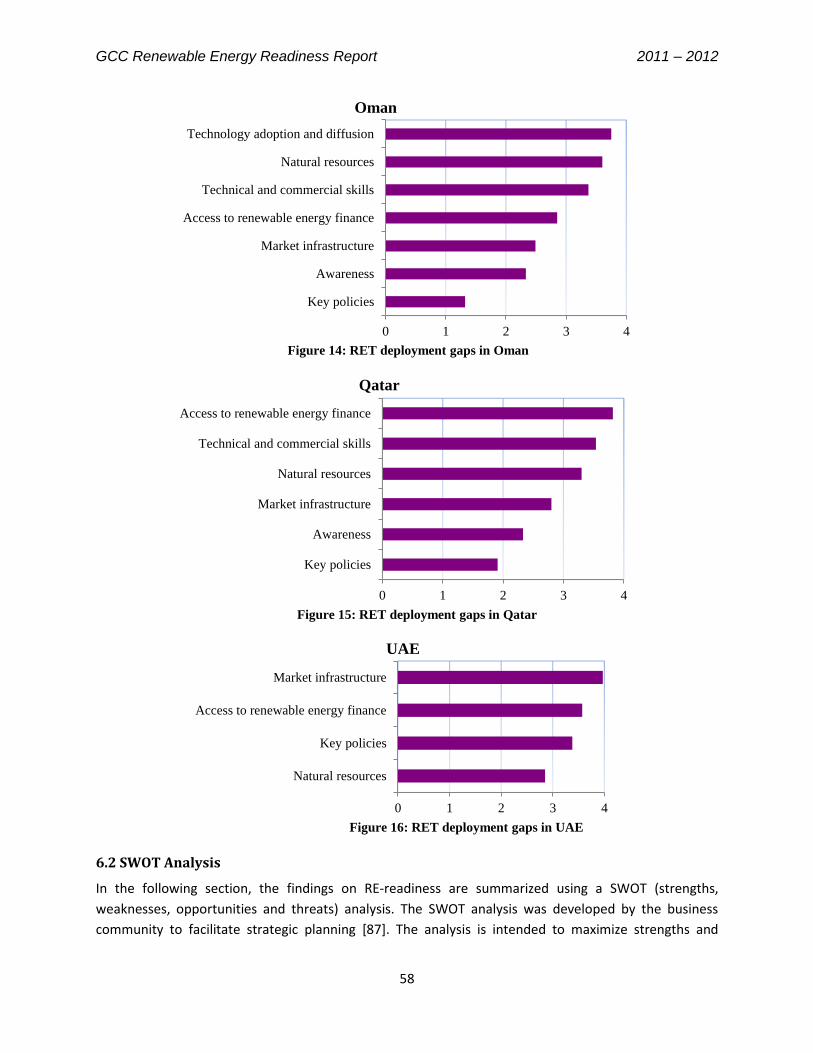
GCC Renewable Energy Readiness Report 2011 – 2012
58
6.2 SWOT Analysis
In the following section, the findings on RE-readiness are summarized using a SWOT (strengths,
weaknesses, opportunities and threats) analysis. The SWOT analysis was developed by the business
community to facilitate strategic planning [87]. The analysis is intended to maximize strengths and
0 1 2 3 4
Key policies
Awareness
Market infrastructure
Access to renewable energy finance
Technical and commercial skills
Natural resources
Technology adoption and diffusion
Figure 14: RET deployment gaps in Oman
Oman
0 1 2 3 4
Key policies
Awareness
Market infrastructure
Natural resources
Technical and commercial skills
Access to renewable energy finance
Figure 15: RET deployment gaps in Qatar
Qatar
0 1 2 3 4
Natural resources
Key policies
Access to renewable energy finance
Market infrastructure
Figure 16: RET deployment gaps in UAE
UAE

GCC Renewable Energy Readiness Report 2011 – 2012
59
opportunities, minimize external threats, and transform weaknesses into strengths. It is designed to be
used in the preliminary stages of decision-making and as a precursor to strategic management planning.
The analysis results are presented in Table 16.
Table 16: The SWOT analysis for optimal deployment of renewables in GCC countries
Strengths
Healthy macroeconomic environment
Developed general financial market
Well-developed general infrastructure
High projected electricity demand growth
Substantial grid capacity
High general technological readiness
Weaknesses
Lack of energy policy and mechanisms
Lack of climate policy
Lack of investment in renewable energy
Large fossil-fuel reserves
Subsidized electricity tariffs
Lack of RET supply chain
Lack of technical and commercial skills in renewable energy
Opportunities
Substantial renewable energy resources
Recent initiatives to raise awareness on RET
Diversification of energy supply
CO2 emissions reduction towards global responsibility
Threats
Subsidized energy prices
Lack of awareness of technology learning effects
Lack of awareness of RETs benefits and co-benefits
6.3 Priority Research Areas
Research and development is a pre-requisite for deployment of RETs and a sustainable energy
transition. Both technological and non-technological R&D on RETs are essential. Technological R&D that
is most required for the region should focus on the unique climactic challenges associated with RET
deployment, such as the effects of high temperatures, limited water supply, and dust and humidity on
RET operation.
For non-technological R&D, a major effort should be undertaken to advance the state of long term
techno-economic modeling to assess the feasibility of sustainable energy systems in the region. Many of
the main threats to RE-readiness, such as subsidized energy prices, lack of awareness of technology
learning effects and RET benefits and co-benefits can be addressed through rigorous energy-economy-
environment modeling. At the same time, research on external costs associated with the use of fossil
fuels for all conventional conversion technologies should be intensified. Strategies to internalize these
costs should be developed and analyzed. Research into these areas in the GCC countries are lacking,
which poses a significant barrier even though the region exhibits many important strengths and
opportunities.
Based on the identified gaps in GCC countries, this study recommends the following for accelerating the
deployment of RETs:
1. Develop strategic plans to meet sustainable development goals for each of the GCC countries
and the region.
GCC Renewable Energy Readiness Report 2011 – 2012
60
2. Create collaboration among the GCC energy research institutions and universities as well as
international partners.
3. Undertake feasibility analysis of long term energy and climate policy (targeted renewable energy
production and CO2 emissions reduction) and establish feasible national policies for sustainable
energy development.
4. Undertake analysis of energy subsidies and incorporate external costs of fossil based power
generation technologies.
5. Include technology learning effects of innovated clean conversion technologies in long term
planning.
6. Undertake research on life cycle cost of RETs incorporating their co-benefits.
7. Undertake research on methods of financing for evolution of RETs.
8. Establish an organization to implement, support and monitor RET projects.
9. Use international instruments such as CDM to promote RET development.
10. Improve capacity-building and awareness.
11. Undertake best practice analysis on renewable energy projects and its application to develop
human capital.
12. Develop awareness of RET benefits, energy security and global contribution on climate change
issues.
7 Conclusions
The GCC countries have embarked on a major economic diversification program during recent years,
including many programs to diversify sources of energy supply. These countries are endowed with huge
amounts of fossil fuels and abundant renewable energy resources, especially solar and, to a lesser
extent, wind.
The GCC countries are becoming increasingly aware of their depleting oil and natural gas reserves. They
have begun taking steps to explore alternative energy resources for power generation. The region has
undertaken initiatives to launch renewable energy projects to prove their commitment to the UNFCCC
towards sustainable development. Some of the countries, the KSA and UAE in particular, have begun to
invest heavily in renewable energy projects. However, the question remains whether these RET projects
will be followed by a clear policy and legal framework that ensures their sustainable deployment. The
promoted rationale for this undertaking is that by investing in RETs for final energy, the countries will be
able to reduce reliance on their valuable and finite fossil fuel resources for domestic use and increase
their export earnings.
The initiatives taken represent a proactive approach to addressing energy security and environmental
issues at international, regional and national scales. The GCC, however, has yet to come up with a
consistent strategy for the region as well as individual national plans to achieve RET deployment goals.
Most of the countries have not yet officially set their renewable energy development targets and lack
stable policies towards this endeavor. Based on techno-economic feasibility investigations, the countries
could manage to fix their long term strategy and R&D as well as target to produce a certain percentage
of total electricity from solar and wind. RETs would help to increase export earnings while avoiding the

GCC Renewable Energy Readiness Report 2011 – 2012
61
external costs of burning these fuels at home. Development of RETs, particularly in R&D, would also help
to create a knowledge-based economy in the GCC countries.
The establishment of IRENA’s headquarters in Abu Dhabi, the Zayed Future Energy Prize, Emirates
Energy Award, hosting of COP18 conference in Doha and many workshops/conferences related to
renewable energy have shed light on the GCCs efforts, further encouraging the deployment of RETs in
the region. Yet, there is still limited awareness among decision-makers about the potential benefits of
clean energy technologies and also inadequate national institutions for R&D of RETs. There has also
been a lack of coordination with national and regional development and lack of stakeholders’
involvement.
The identified RE-readiness gaps need to be minimized to develop a sustainable energy system in this
region. While the region might face certain challenges, such as minimizing energy subsidies and
promoting RET investment, sustained and strong support by the government will help to overcome
these barriers and set the GCC on a path of leadership for the region.

GCC Renewable Energy Readiness Report 2011 – 2012
62
8 References
[1] M. Asif and T. Muneer, "Energy supply, its demand and security issues for developed and
emerging economies," Renewable and Sustainable Energy Reviews, vol. 11, pp. 1388-1413, 2007.
[2] IEA, "Renewable Energy: Policy Considerations for Deploying Renewables," Internationa Energy
Agency (IEA), OECD/IEA-2011, Paris, France2011.
[3] H. Radhi, "On the value of decentralised PV systems for the GCC residential sector," Energy
Policy, vol. 39, pp. 2020-2027, 2011.
[4] W. E. Alnaser and N. W. Alnaser, "The status of renewable energy in the GCC countries,"
Renewable and Sustainable Energy Reviews, vol. 15, pp. 3074-3098, 2011.
[5] H. Doukas, K. D. Patlitzianas, A. G. Kagiannas, and J. Psarras, "Renewable energy sources and
rationale use of energy development in the countries of GCC: Myth or reality?," Renewable Energy, vol.
31, pp. 755-770, 2006.
[6] D. Reiche, "Energy Policies of Gulf Cooperation Council (GCC) countries—possibilities and
limitations of ecological modernization in rentier states," Energy Policy, vol. 38, pp. 2395-2403, 2010.
[7] ESCWA, "Promoting large-scale renewable energy applications in the Arab region: An approach
for climate change mitigation. Economic and Social Commission for Western Asia (ESCWA). United
Nations. 2010 " 2010.
[8] UNFCCC. (2012). Status of Ratification of the Kyoto Protocol, United Nations Framework
Convention on Climate Change. http://unfccc.int/kyoto_protocol/status_of_ratification/items/2613.php.
Cited on 17 September 17, 2012.
[9] T. Mezher, G. Dawelbait, and Z. Abbas, "Renewable energy policy options for Abu Dhabi: Drivers
and barriers," Energy Policy, vol. 42, pp. 315-328, 2012.
[10] R. Saidur, M. R. Islam, N. A. Rahim, and K. H. Solangi, "A review on global wind energy policy,"
Renewable and Sustainable Energy Reviews, vol. 14, pp. 1744-1762, 2010.
[11] IInternational Renewable Energy Agency (IRENA)," Renewables Readiness Assessment: Design to
Action", Abu Dhabi, 2013.
[12] WEO, "World Energy Outlook," International Energy Agency (IEA), OECD/IEA-2010, Paris, France
2010.
[13] BP, "BP Statistical Review of World Energy," June 2012.
[14] N. Lior, "Sustainable energy development: The present (2011) situation and possible paths to
the future," vol. Article in press, doi: 10.1016/j.energy.2011.11.038, 2012.
[15] IEA. Key World Energy Statistics [Online]. Available: www.iea.org

GCC Renewable Energy Readiness Report 2011 – 2012
63
[16] G. C. Project, "Carbon Budget 2012," 2012.
[17] IEA, "Energy Technology Perspectives: Scenarios and Strategies to 2050 ", International Energy
Agency (IEA), OECD/IEA-2010, Paris, France2010.
[18] WEO, "World Energy Outlook," International Energy Agency (IEA), OECD/IEA, Paris, France2007.
[19] BP. British Petroleum (BP) Statistical Review of World Energy, June 2011. http://www.bp.com,
Cited on 30 May, 2012 [Online].
[20] N. Lior, "Sustainable energy development: The present (2011) situation and possible paths to
the future," Energy, vol. 43, pp. 174-191, 2012.
[21] W. E. OUTLOOK. (2012, How will global energy markets evolve to 2035? 2012 FACTSHEET.
Available: http://www.worldenergyoutlook.org/media/weowebsite/2012/factsheets.pdf
[22] M. Al-Sahlawi, "Energy Security in the EU from GCC perspective," in The GCC Economics:
Stepping up the Future Challenges, M. A. Ramady, Ed., ed: Springer Science and Business Media, New
York, 2012.
[23] EIU, "The GCC in 2020: Resources for the future," A report from the Economic Intelligent Unit
(EIU) and Sponsored by the Qatar Financial Centre Authority 2010.
[24] WDI, "World Development Indicators 2011, The World Bank, 1818 H Street NW, Washington,
D.C. 20433 USA," 2011.
[25] EIA. (2012). Country Analysis Brief, Energy Information Administration, U.S. Department of
Energy. http://www.eia.doe.gov. Cited on September 16, 2012.
[26] M. A. H. Mondal and M. Denich, "Assessment of renewable energy resources potential for
electricity generation in Bangladesh," Renewable and Sustainable Energy Reviews, vol. 14, pp. 2401-
2413, 2010.
[27] REN21, "Renewables 2011: Global Status Report. REN21. Renewable Energy Policy Network for
the 21st Century.," 2011.
[28] R. E. P. N. f. t. s. C. (REN21), "Renewable 2012 Global Status Report," 2012.
[29] BP, "Brithish Petroleum (BP). Statistical Review of World Energy. June 2009," 2009.
[30] EIA, "Electricity, International data, Energy Information Administration, U.S. Department of
Energy. http://www.eia.doe.gov/fuelelectric.html. Cited on March 02, 2010," 2010.
[31] M. A. Green, "Recent developments in photovoltaics," Solar Energy, vol. 76, pp. 3-8, 2004.
[32] N. J. Martin and J. L. Rice, "Developing renewable energy supply in Queensland, Australia: A
study of the barriers, targets, policies and actions," Renewable Energy, vol. 44, pp. 119-127, 2012.

GCC Renewable Energy Readiness Report 2011 – 2012
64
[33] M. A. H. Mondal, L. M. Kamp, and N. I. Pachova, "Drivers, barriers, and strategies for
implementation of renewable energy technologies in rural areas in Bangladesh—An innovation system
analysis," Energy Policy, vol. 38, pp. 4626-4634, 2010.
[34] T. Mezher, G. Dawelbait, and Z. Abbas, "Renewable energy policy options for Abu Dhabi: Drivers
and barriers," Energy Policy, vol. 42, pp. 315-328, 2012.
[35] S. O. Negro, F. Alkemade, and M. P. Hekkert, "Why does renewable energy diffuse so slowly? A
review of innovation system problems," Renewable and Sustainable Energy Reviews, vol. 16, pp. 3836-
3846, 2012.
[36] K. D. Patlitzianas, H. Doukas, and J. Psarras, "Enhancing renewable energy in the Arab States of
the Gulf: Constraints & efforts," Energy Policy, vol. 34, pp. 3719-3726, 2006.
[37] IEA, "Deploying Renewables 2011: Best and Future Policy Practice ", Internationa Energy Agency
(IEA), OECD/IEA-2011, Paris, France2011.
[38] M. Wei, S. Patadia, and D. M. Kammen, "Putting renewables and energy efficiency to work: How
many jobs can the clean energy industry generate in the US?," Energy Policy, vol. 38, pp. 919-931, 2010.
[39] IRENA, "Impacts of renewable energy targets in the GCC. IRENA internal document. November
2012.," 2012.
[40] IRENA, "Renewable Energy Jobs: Status, Prospects and Policies. Available from
http://www.irena.org. Cited on February 10, 2013," 2011.
[41] I. A. Gelil, "Diversifing Energy Mix in Bahrain, Presented in the World Future Energy Summit, Abu
Dhabi, UAE January 15-17, 2013. ," 2013.
[42] MEW. (2011). The Ministry of Electricity and Water signs a contract for conducting feasibility
study for renewable energies and supervision of establishment of a pilot power plnat. www.mew.gov.bh.
Cited on September 9, 2012.
[43] Y. Alyousef and M. Abu-ebid, "Energy Efficiency Initiatives for Saudi Arabia on Supply and
Demand Sides, Energy Efficiency - A Bridge to Low Carbon Economy, Dr. Zoran Morvaj (Ed.), ISBN: 978-
953-51-0340-0, InTech, DOI: 10.5772/38660. ," 2012.
[44] I. J. Bachellerie, Renewable Energy in the GCC Countries: Resources, Potential, and Prospects:
Gulf Research Center 2012., 2012.
[45] S. Alotaibi, "Energy consumption in Kuwait: Prospects and future approaches," Energy Policy,
vol. 39, pp. 637-643, 2011.
[46] T. E. Times. (2011). Kuwait sets biggest renewable-energy goal in Gulf to free crude for export.
The Economic Times on October 27, 2011. http://economictimes.indiatimes.com. Cited on September 21,
2012.

GCC Renewable Energy Readiness Report 2011 – 2012
65
[47] A. Al-Badi, "Status and Future Plans for the Deployment of RE Technologies in Oman. Presented
in the World Future Energy Summit, Abu Dhabi, UAE January 15-17, 2013," 2013.
[48] AERO, "Study on renewable energy resources. The Authority for Electricity Regulation, Oman.
Prepared by COWI and partners LLC.," 2008.
[49] QIA. (2012). Qatar Investment Authority. http://www.qia.qa/about.html. Cited on September 06,
2012.
[50] BP, "British Petroleum (BP) Statistical Review of World Energy, June 2012. ," 2012.
[51] E. Harder and J. M. Gibson, "The costs and benefits of large-scale solar photovoltaic power
production in Abu Dhabi, United Arab Emirates," Renewable Energy, vol. 36, pp. 789-796, 2011.
[52] A. Kazim, "Strategy for a sustainable development in the UAE through hydrogen energy,"
Renewable Energy, vol. 35, pp. 2257-2269, 2010.
[53] DSC, "Statistical Yearbook - Emirate of Dubai. Dubai Statistics Center. 2010," 2010.
[54] NBS, "National Bureau of Statistics. United Arab Emirates. www.uaestatistics.gov.ae. Cited on 02
August, 2012. ," 2012.
[55] WEF, "The Global Competitiveness Report 2011-2012. World Economic Forum. Geneva,
Switzerland 2011.," 2011.
[56] E&Y, "Renewable Energy Country Attractiveness Indices. May 2012, Issue 33. Ernst & Young.,"
2012.
[57] A. A. A. Khalifa, "Macroeconomic Competitiveness of the GCC Economies," in The GCC
Economics: Stepping up the Future Challenges, M. A. Ramady, Ed., ed: Springer Scienec and Business
Media, New York, 2012.
[58] J.-J. Wang, Y.-Y. Jing, C.-F. Zhang, and J.-H. Zhao, "Review on multi-criteria decision analysis aid
in sustainable energy decision-making," Renewable and Sustainable Energy Reviews, vol. 13, pp. 2263-
2278, 2009.
[59] S. D. Pohekar and M. Ramachandran, "Application of multi-criteria decision making to
sustainable energy planning—A review," Renewable and Sustainable Energy Reviews, vol. 8, pp. 365-
381, 2004.
[60] CIA, "World Factbook. Central Intelligence Agency (CIA)." 2011.
[61] R. Ferroukhi, N. Ghazal-Aswad, S. Androulaki, D. Hawila, and T. Mezher, "Renewable energy in
the GCC: Status and Challenges," International Journal of Energy Sector Management, EU-GCC Clean
Energy Network Special Issue, 2013, in press., 2013.

GCC Renewable Energy Readiness Report 2011 – 2012
66
[62] ACML, "Unlocking the potential of alternative energy in MENA. Al Masah Capital Management
Limited (ACML), Dubail, UAE.," 2011.
[63] CSP, "CSP today: An Overview of CSP in Europe, North Africa and the Middle East.
http://www.csptoday.com. Cited on October 14, 2012," 2008.
[64] REEEP, "The reform of the power sector in Africa. Sustainable Energy Regulation and Policy
Making for Africa. http://africa-toolkit.reeep.org. Cited on October 15, 2012.," 2010.
[65] K. Times. (2012). Dubai launches Solar Park. Khaleej Times on 9 January 2012.
www.khaleejtimes.com. Cited on September 20, 2012.
[66] Go-green, "Solar Polysilicon Plant in Dubai. http://www.go-green.ae. Cited on December 12,
2012 " 2012.
[67] EPI, "Data Highlights: Governments Spend $1.4 Billion Per Day to Destabilize Climate. Earth
Policy Institute (EPI). www.earth-policy.org. Cited on October 10, 2012. ," 2012.
[68] IEA, "Renewable Energy: Markets and Prospects by Technology ", International Energy Agency
(IEA), OECD/IEA-2010, Paris, France2011.
[69] EEP. (2012). Europe's Energy Portal. http://www.energy.eu/#domestic. Cited on October 15,
2012.
[70] WEF, "Scaling up Renewables: Developing renewable energy capacity-addressing regulatory and
infrastructure challenges in emerging markets. April 2011. Geneva, Switzerland.," 2011.
[71] H. Scheer, Energy autonomy: The economic, social and technological case for renewable energy.
Earthscan. UK., 2007.
[72] H. J. AlFarra and B. Abu-Hijleh, "The potential role of nuclear energy in mitigating CO2 emissions
in the United Arab Emirates," Energy Policy, vol. 42, pp. 272-285, 2012.
[73] S. M. Shaahid and I. El-Amin, "Techno-economic evaluation of off-grid hybrid photovoltaic–
diesel–battery power systems for rural electrification in Saudi Arabia—A way forward for sustainable
development," Renewable and Sustainable Energy Reviews, vol. 13, pp. 625-633, 2009.
[74] S. M. Shaahid and M. A. Elhadidy, "Technical and economic assessment of grid-independent
hybrid photovoltaic–diesel–battery power systems for commercial loads in desert environments,"
Renewable and Sustainable Energy Reviews, vol. 11, pp. 1794-1810, 2007.
[75] S. Rehman, M. A. Bader, and S. A. Al-Moallem, "Cost of solar energy generated using PV panels,"
Renewable and Sustainable Energy Reviews, vol. 11, pp. 1843-1857, 2007.
[76] O. A. Alsayegh and F. A. fairouz, "Renewable energy supply options in Kuwait," World Academy
of Science, Engineering and Technology 60, 870-875., 2011.

GCC Renewable Energy Readiness Report 2011 – 2012
67
[77] S. A. Jandal, "Kuwait Renewable Energy Readiness Assessment and Roadmap – Country Report.
Presentation given in EU-GCC cooperation conference in Abu Dhabi, UAE. A side event of WFES 2013.,"
2013.
[78] REN21. (2012). Renewables Policy and Policy Instruments: Overview on Policy Instruments.
REN21. http://www.ren21.net. Cited on October 18, 2012.
[79] KACST, "Strategic Priorities for Energy Technology Program, King Abdulaziz City for Science and
Technology (KACST), Kingdom of Saudi Arabia," 2012.
[80] L. Economics, "An Assessment of the Regulatory Framework for Electronic Communications –
Growth and Investment in the EU e-Communications Sector. London Economics In association with
PricewaterhouseCoopers. July 2006.," 2006.
[81] M. A. H. Mondal, M. Denich, and P. L. G. Vlek, "The future choice of technologies and co-benefits
of CO2 emission reduction in Bangladesh power sector," Energy, vol. 35, pp. 4902-4909, 2010.
[82] R. M. Shrestha and S. Pradhan, "Co-benefits of CO2 emission reduction in a developing country,"
Energy Policy, vol. 38, pp. 2586-2597, 2010.
[83] Gulfnews, "Dubai strategy developed to reduce carbon emissions. www.gulfnews.com. Cited on
Noverber 14, 2012.," 2012.
[84] CPI, "The Landscape of Climate Finance in Germany. Climate Policy Initiative (CPI). November
2012. www.climatepolicyinitiative.org. Cited on January 3, 2013," 2012.
[85] FSFM, "Global Trends in Renewable Energy Investment 2012. Frankfurt School of Finance &
Management gGmbH (FSFM), Frankfurt School UNEP Collaborating Centre for Climate & Sustainable
Energy Finance. ," 2012.
[86] VENTURES, "Solar Energy in GCC Construction. September 2012. Ventures middle-east.
www.ventures-me.com. Cited on January 7, 2013," 2012.
[87] C. Karakosta, H. Doukas, and P. John, "EU–MENA energy technology transfer under the CDM:
Israel as a frontrunner?," Energy Policy, vol. 38, pp. 2455-2462, 2010.

GCC Renewable Energy Readiness Report 2011 – 2012
68
9 Appendix
Questionnaire for the GCC renewable energy readiness assessment report
Based on our presentation and discussion on 28.06.2012 at Masdar Institute, we have prepared the
following questionnaire with short explanations of some factors to support the proposed framework
and to write the GCC renewable energy readiness assessment report:
(Please provide all references in support of your submissions. Respondents may also adopt this
questionnaire in developing report for their respective countries.)
Background
Energy, economy, environment information in general.
Infrastructure
Infrastructure explores each country’s physical capability to install renewable energy technologies in
terms of availability of natural resources, the country’s general infrastructure, and grid capacity to
support additional renewable energy capacity.
Renewable and non-renewable energy potential as well as generation capacity:
1) Which renewable energy resources are available and what are their theoretical or technical
potential (based on wind speed or solar radiation) to generate electricity?
2) What is the total conventional fuel(s) reserve?
3) How does your country rank internationally in terms of proven reserves?
4) What is the fuel cost (per m3 or PJ or barrel) for power generation for each fuel?
5) What is the present generation capacity (MW) by fuels including renewable capacity?
General infrastructure: A country’s general infrastructure affects its ability to implement new
projects, specifically ones that depend on logistical requirements. The Global Competitiveness
Report (http://www3.weforum.org/docs/WEF_GCR_Report_2011-12.pdf) gives quantitative data for
overall infrastructure for each country. Ernst & Young report also gives some indicators of some
factors related to renewable energy (attached).
6) Are there blackouts, load shedding or power shortages?
7) If yes, please provide the frequency and duration.
Market efficiency: In countries where the government has monopoly over power generation,
transmission and distribution, it is an indication of restriction to private sector entry. Control on
transmission and distribution and strict rules and regulations could constraint market forces and
reduce market efficiency.
8) Please complete the following table based on your country’s power sector market regulation:

GCC Renewable Energy Readiness Report 2011 – 2012
69
Sector Public
ownership
Partial public
ownership
Private
monopoly
Private
competition
Don’t know
Generation
Transmission
Distribution
9) What is the cost per unit of electricity generation by fuels?
10) If existent, what is the cost per unit of electricity generation from renewable-based plants?
11) What is the electricity tariff to consumers?
12) Is the tariff subsidized and what are the mechanisms?
13) What is the expected growth rate of electricity demand?
14) What is the percentage of people that have been connected to grid electricity?
Qualitative or quantitative indicators of electricity supply quality can be found in the Global
Competitiveness Report.
Institutions
General institutions indicator gives an indication of how committed the government is to the health
of its institutional framework in terms of efficient or inefficient government. Inefficiency is
determined by wastefulness of government spending, burden of government regulation as well as
transparency of government policy making. These types of factors are most significant in
determining the effectiveness and reliability of energy policy and how fit the public institution is to
implement its set renewable energy targets. Indicator for each country on general institute can be
found in the Global Competitiveness Report.
15) Regulatory framework: The most frequent regulatory challenges are a) the absence of long-term
planning; b) a large number of relevant authorities; c) lack of coordination between relevant
authorities; d) complex permitting procedures and legal appeal process; and e) lack of
stakeholder involvement in decision-making. Which of the above challenges exist in your
country?
A study11 was conducted in 2006 to identify how a country’s regulatory framework effects
investments in the e-communication sector. The main factors identified are: a) clear legislation;
b) timely implementation of legislation; c) comprehensive guidance on the interpretation of
legislative requirements; d) harmonization between stakeholders; e) clear communication from
national regulatory authorities (NRA); and f) adequate appeal processes and NRA enforcement
powers. Which of the above factors exist in your country for regulatory framework?
16) Please provide a list of energy related institutions and provide their activities.
11
Assessment of the regulatory framework for electronic communications – growth and investment in the EU e-
communications sector was conducted in 2006 by London economics in association with Price waterhouse Coopers

GCC Renewable Energy Readiness Report 2011 – 2012
70
17) What are the federal or local level renewable energy policies?
18) What are the mechanisms to support renewable energy deployment?
19) Do you have any climate policy to minimize CO2 emissions?
20) Are there any renewable energy deployment or capacity generation targets?
21) Are the targets specific and time bound?
22) Are the targets achievable and reasonable?
23) Are there fiscal incentives to install renewable based power plants?
24) Please provide some detailed information on existing renewable energy projects.
25) Is there public funding to support research and development (R&D) in energy-related subjects?
26) Financial market development: To overcome one of the most pressing barriers to diffusion of
renewable energy technologies, it is important to assess the well-being of the financial market
that determines investor’s capability to invest renewable energy projects. This factor looks at
the efficiency of the financial market in term of availability and affordability of financial services,
possibility of financing through equity market, ease of access to loans, capital availability and
restriction on capital flows. Please rank from “poor” to “very good” your country’s financial
market development for deployment of renewable energy technologies. Also provide
explanations in support of your ranking.
27) Macroeconomic environment: In addition to a country’s financial market, the stability of its
macroeconomic environment is vital to determine the ability to invest in energy sector for
sustainable development. The government’s capability to invest in the energy sector weakens
when it has to make high-interest payments on its past debts. Also, developers do not operate
efficiently when inflation rates are high, and investors are not encouraged when cost of capital
is elevated. This factor is determined by the government’s budget balance and debt, the
national savings rate, inflation, interest rate, and country credit rating. So, the macroeconomic
environment signals government ability to support for renewable energy deployment and the
private sector’s ability to invest in new projects. Please provide explanations on how you rank
your country’s overall macroeconomic environment. Give a range from “poor” to “very good”
regarding the macroeconomic environment for the deployment of renewable energy
technologies of your country.
28) Are there any existing reports or models focusing on long-term energy planning based on
techno-economic analysis?
Human capital
The human capacity measures a country’s ability to select and sustainably operate the most
appropriate technology, as well as managing and maintaining projects of a country. Please discuss
the status/perspective of the following factors related to human capacity for the deployment of
renewable energy technologies:
29) Higher education and training: This is an indicator of how much a country can provide the
necessary technical human capacity in terms of skilled and trained personnel in order to plan,

GCC Renewable Energy Readiness Report 2011 – 2012
71
develop, operate and maintain general projects. Please discuss the human capacity level on
renewable energy based on the following headings:
Engineers
Technicians
Project developers
Researchers
Consultants
others
30) Labor market efficiency: It is vital to assess the country’s ability to retain experts. The labor
market efficiency indicator measures the efficacy of the labor market, and gives an idea of the
country’s efficient use of experts, in terms of pay and productivity, reliance on professional
management, brain drain and female participation in the labor force. Otherwise, even in the
presence of renewable energy education programs, graduates would not choose to stay and
work in the country. Please provide explanations on how you judge the overall labor market
efficiency of your country. Both qualitative and quantitative assessments are expected.
31) Are there any institutes in your country responsible for long-term energy planning, applying
models for sustainable development?
32) Technology adaption and diffusion: It is important to assess how well a country succeeds in
keeping up with the new technologies when we want to study the chances of renewable energy
technologies adoption. This is measured by its people’s ability to adapt to technological changes,
the level of innovation and R&D. Please discuss renewable energy technologies adoption
readiness and how you rate your country in adopting renewable energy technologies. Give a
range from “poor” to “very good”.
33) Innovation and R&D: Aside from technological readiness, this factor measures the country’s
capacity for innovation, quality of scientific institutions, company spending on R&D, government
procurement of advanced technology products, and availability of scientists, utility patents.
Please discuss innovation and R&D programs. The indicator of this factor can be found in Global
Competitiveness Report.
34) Resource availability awareness: Please provide some details on resource availability awareness
in your country. Give a range from “no resource assessment efforts” to “conducted assessment
on all renewable resources and made data available to the public”.
35) Please discuss consumer and social awareness of renewable energy in your country. Give a
range from “no consumer and social awareness” to “very good consumer and social awareness”.
Thank you


