New Mexico’s hydroelectric capacity is about 78.3 megawatts from five plants. Hydropower is not a large portion of the state’s total generating capacity and there is not a great deal more potential because of the state’s arid climate and because greater development would involve substantial environmental concerns. Significant evapo- rative water losses occur from hydropower projects that include storage reservoirs. Drought has an adverse impact of on water levels and hydro plant output Undeveloped small hydropower sites exist in New Mexico, including river sites and existing dams, but numerous constraints limit the potential. These constraints include financing, multiple-use issues, reg- ulatory barriers, economic issues, and environmental impacts. Renewable Energy Resources—Hydropower Table 6. Hydropower Plants in New Mexico PLANT CAPACITY (MW) OWNER Navajo Reservoir 30 City of Farmington Elephant Butte 24.3 U.S. Bureau of Reclamation Abiquiu 15 County of Los Alamos El Vado 8.8 County of Los Alamos Farmington 0.2 City of Farmington ENERGY, MINERALS and NATURAL RESOURCES DEPARTMENT 34
Transcript
New Mexico’s hydroelectric capacity isabout 78.3 megawatts from five plants.
Hydropower is not a large portion of thestate’s total generating capacity and there isnot a great deal more potential because ofthe state’s arid climate and because greaterdevelopment would involve substantialenvironmental concerns. Significant evapo-rative water losses occur from hydropowerprojects that include storage reservoirs.Drought has an adverse impact of on waterlevels and hydro plant output
Undeveloped small hydropower sites existin New Mexico, including river sites andexisting dams, but numerous constraintslimit the potential. These constraintsinclude financing, multiple-use issues, reg-ulatory barriers, economic issues, andenvironmental impacts.
Renewable Energy Resources—Hydropower
Table 6. Hydropower Plants in New Mexico
PLANT CAPACITY (MW) OWNER
Navajo Reservoir 30 City of Farmington
Elephant Butte 24.3 U.S. Bureau of
Reclamation
Abiquiu 15 County of Los Alamos
El Vado 8.8 County of Los Alamos
Farmington 0.2 City of Farmington
ENERGY, MINERALS and NATURAL RESOURCES DEPARTMENT 34
35 NEW MEXICO’S NATURAL RESOURCES 2003/2004
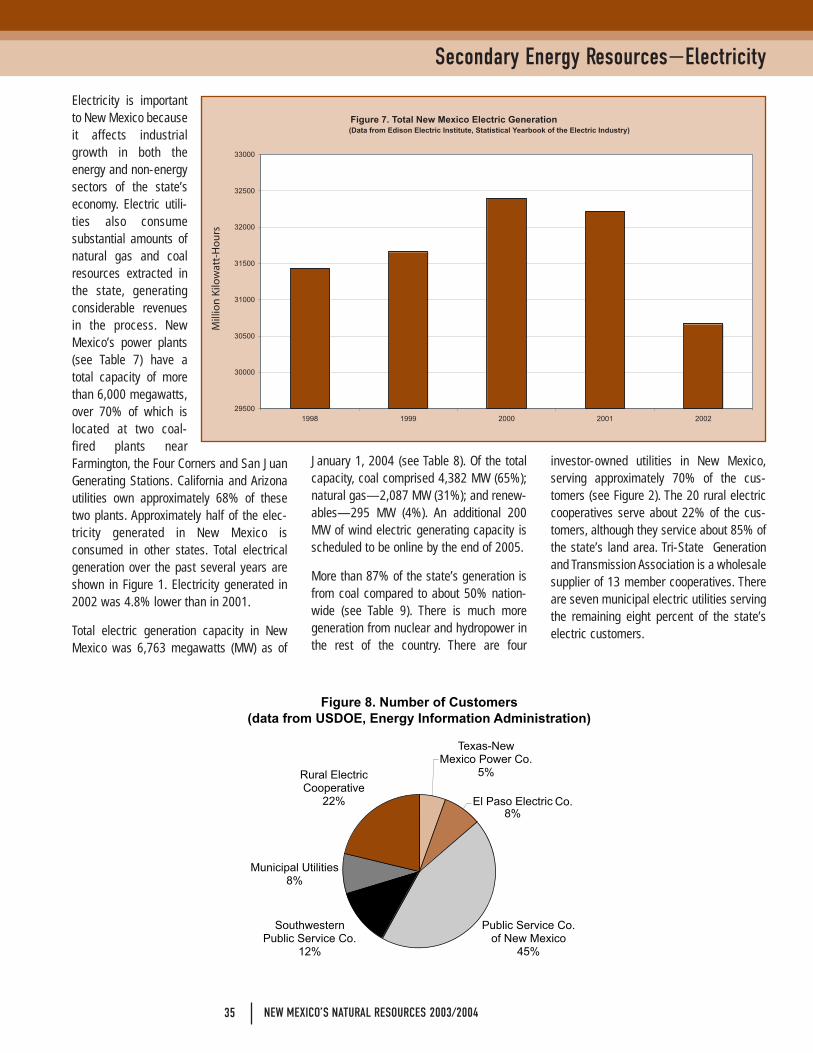
Electricity is importantto New Mexico becauseit affects industrialgrowth in both theenergy and non-energysectors of the state’seconomy. Electric utili-ties also consumesubstantial amounts ofnatural gas and coalresources extracted inthe state, generatingconsiderable revenuesin the process. NewMexico’s power plants(see Table 7) have atotal capacity of morethan 6,000 megawatts,over 70% of which islocated at two coal-fired plants nearFarmington, the Four Corners and San JuanGenerating Stations. California and Arizonautilities own approximately 68% of thesetwo plants. Approximately half of the elec-tricity generated in New Mexico isconsumed in other states. Total electricalgeneration over the past several years areshown in Figure 1. Electricity generated in2002 was 4.8% lower than in 2001.
Total electric generation capacity in NewMexico was 6,763 megawatts (MW) as of
January 1, 2004 (see Table 8). Of the totalcapacity, coal comprised 4,382 MW (65%);natural gas—2,087 MW (31%); and renew-ables—295 MW (4%). An additional 200MW of wind electric generating capacity isscheduled to be online by the end of 2005.
More than 87% of the state’s generation isfrom coal compared to about 50% nation-wide (see Table 9). There is much moregeneration from nuclear and hydropower inthe rest of the country. There are four
investor-owned utilities in New Mexico,serving approximately 70% of the cus-tomers (see Figure 2). The 20 rural electriccooperatives serve about 22% of the cus-tomers, although they service about 85% ofthe state’s land area. Tri-State Generationand Transmission Association is a wholesalesupplier of 13 member cooperatives. Thereare seven municipal electric utilities servingthe remaining eight percent of the state’selectric customers.
Secondary Energy Resources—Electricity
The number of ultimate customers buyingelectricity has increased every year over thepast four years (see Figure 9). The increasein the residential sector from 1998 through2002 was 7.6%, and the increase in thecommercial/industrial sector was 8%. Thetotal number of customers in New Mexicoincreased by 7.8% from 1998 through 2002.
New Mexico’s electricity consumption percustomer decreased 2% over the pastfour years.
Average sales per residential customerincreased from 6,661 kWh to 6,988 kWh.Average sales per commercial/industrial cus-tomer decreased from 112,677 kWh to108,082 kWh. Total revenues from the sales
of electricity in New Mexico in 2002 were$1.29 billion (See Figure 10.).
Figure 11 shows the price paid per kWh inNew Mexico and the United States for 1998through 2002 in the residential, commercial and industrial sectors. Price per kWh isderived by dividing revenue by sales. Theprice paid in New Mexico decreased 4% in
Secondary Energy Resources—Electricity
ENERGY, MINERALS and NATURAL RESOURCES DEPARTMENT 36
37 NEW MEXICO’S NATURAL RESOURCES 2003/2004
the residential sector, decreased 8% in thecommercial sector, and remained about thesame in the industrial sector over this four-year period. In 2002, New Mexico’s pricescompared to U.S. prices were 0.5% higherin the residential sector, 8.1% lower in thecommercial sector, and 8.4% lower in theindustrial sector.
In 2002 the Public Regulation Commissioncontinued hearings and workshops on pro-posed rulemaking to require electricityproviders to include renewable energy as aresource. They issued a final rule thatrequires 10% renewable energy by the year2011 with intermediate requirements. Therule also requires utilities to offer an optionalgreen power tariff so that those customerswilling to pay more for renewable power willbe able to purchase larger amounts ofrenewable power.
Secondary Energy Resources—Electricity
Table 8. New Mexico Electric Generation Capacity
and Percentage of Total, by Fuel Source (as of January 1, 2004)
Fuel Source New Mexico
Capacity (MW)
% of Total
Capacity
Coal 4,382.1 64.8%
Natural Gas 2,087.0 30.9%
Renewables 294.8 4.4%
Hydro 81.1 27.5%
Non-Hydro 213.7 72.5%
Wind 206.0 96.4%
Solar 0.2 0.1%
Geothermal 0.9 0.4%
Biomass 6.6 3.1%
Table 9. Electrical Generation by Fuel Source, 2002
(Data from Edison Electric Institute, Statistical Yearbook of the Electric Industry)